Chapter 2
Operations and Supply Chain Strategy
Teaching Notes
This chapter reflects the increasing importance of Operations and Supply Chain Strategy in today's business environment. The model of Operations Strategy developed by Schroeder, Anderson, and Cleveland is discussed. Other materials by Porter, Skinner, Hayes and Wheelwright, and Hill, add definition to the concept of Operations and Supply Chain Strategy and fortify the argument for its relevance.
The chapter may be eye-opening to students who think of operations as nitty gritty or purely tactical material while the important strategic issues are left to marketing and finance. The chapter shows how operations can be a "competitive weapon" for the firm by strategically supporting the firm's distinctive competence. The concepts of multiple objectives and response to external factors are presented. Linkage of functional strategies and global operations concerns are also addressed along with supply chain strategies. This chapter also includes attention to environmental and sustainable operations issues, and how they fit with operations and supply chain strategies.
Chapter 2 serves an integrating purpose for the book. It can be taught either at the beginning or at the end of the course depending on whether one wishes to start or end with a strategic theme. We have personally used the chapter both ways.
Answers to Questions
1. The reasons for formulating and implementing an operations and supply chain strategy include:
To renew emphasis on operations and the supply chain: the fundamental creation of value for the customer,
To assure consistency between the operations and supply chain strategy and the business strategy,
To enable the use of operations and supply chain capabilities as a competitive force in the business.
2. a. Ambulance Service:
Mission -- To provide immediate, quick, and safe transportation for ill or injured people and a high level of medical care from the ambulance crews. Availability must be very high and costs must not be excessive.
Copyright © 2017 McGraw-Hill Education. All rights reserved. No reproduction or distribution without the prior written consent of McGraw-Hill Education.
3.
Associated Strategies -- A central location near a main freeway to insure fast service, a knowledgeable and well-trained staff, excellent vehicle maintenance, high capacity relative to use.
b. Production of hybrid automobile batteries:
Mission -- To provide environment-friendly automobile batteries for the sustainability of the environment and reduce energy consumption to meet market demand.
Associated Strategies – Forming cross-functional teams with suppliers and environmental interests to measure and reduce the environmental impact in all phases of design, manufacturing, and distribution of the hybrid batteries.
c. Production of electronics products that have a short product life cycle:
Mission -- To be first or one of the first to provide an electronics product to the market at reasonable cost and quality levels.
Associated Strategies -- Use of new product introduction teams, flexible manufacturing processes, high R & D budgets, hire people who are willing to take reasonable risks (innovators).
Note: Many different missions and associated strategies could be used.
a. No, the business does not have an operations strategy since it can be inferred from the operations manager complaint that the operations function was not included in the planning process.
b. The operations manager should write a memo to the chief executive and other officers of the corporation informing them of the concerns of the operations function and solicit their appropriate actions to address the concerns. He/she should also work with the managers of the other functional areas and take an active role in strategy formulation and decision making.
4.
Operations Mission: The mission of operations defines the role of operations within the total business strategy: how operations fit into the overall business plan. The mission should state the relative priority among the operations objectives: cost, quality, delivery, and flexibility.
Order Winner/Order Qualifier: A high level of performance (C, Q, D, F) on the order winner is required to get the customer order. An order qualifier is a minimum level of performance required to be considered for the order. A high level on an order qualifier will not win the order; only high performance on the order winner can win the order.
Distinctive competence: The distinctive competence is what operations must excel at relative to the competition to provide competitive advantage. It is generally not possible
Copyright © 2017 McGraw-Hill Education. All rights reserved. No reproduction or distribution without the prior written consent of McGraw-Hill Education.
to excel on several different dimensions, thus the distinctive competence of a firm requires focus.
5. To determine if a company has an operations and supply chain strategy, study the decisions that have been made. If a consistent pattern of decision-making exists, then there is an operations strategy, stated or unstated, in the firm.
Specifically, information about the four decision categories - process, quality, capacity, and inventory – is required. Questions such as the following could be used to obtain information:
What are the most important characteristics of a new process? Quality produced by the process? Capacity of the process? Flexibility of the process? Amount of training required for the workforce to operate the process?
Is capacity acquired after demand materializes? Ahead of demand?
Is inventory built up to prevent layoffs? To delay the addition of additional capacity?
What is the company policy on hiring and layoffs? On training of employees at various levels? On the level of compensation relative to the competition?
The answers to these and other questions should be analyzed for internal consistency. If an operations and supply chain strategy exists, it can be deduced from the consistent pattern of decision-making it produces.
Another test for an operations and supply chain strategy is the presence of a written plan that has been implemented in operations. Not only should the plan be examined, but managers should also be interviewed to insure they understand the plan and are implementing the strategy through their everyday decision making.
6. Quality. This is the primary goal of most hospitals. Much of the staff is licensed in their professions, and in-service training is done regularly. Staff-patient ratios are considered important, and techniques such as peer review, quality committees, and the use of many kinds of advanced-technology equipment are used to insure quality of care.
Delivery. This refers to the speed with which a patient receives care and providing care as promised on time. Delivery also occurs with each service the patient receives from check-in to checkout. As consumers take a more active role in choosing hospitals and the way that care is provided, delivery is becoming more of a concern.
Flexibility. This is the ability to respond to different and changing patient needs. Flexibility implies offering a wide variety of services and the ability to change at a moment's notice. A current problem with hospitals is that they sometimes emphasize this objective too much and duplication of services occurs between hospitals. As a result there are equipment and services that are sometimes under-utilized (such as helicopters and MRI equipment). This situation is improving, though, with regional health planning.
Copyright © 2017 McGraw-Hill Education. All rights reserved. No reproduction or distribution without the prior written consent of McGraw-Hill Education.
Cost. Until recently, this objective received low priority. But with rising costs, inflation, government pressure and payment of standard fees by public health programs and insurance companies, hospitals are under extreme pressure to hold costs down while maintaining or improving quality. The cost effectiveness of each objective, including quality, must be demonstrated as it becomes increasingly costly to provide health care.
All departments are not typically focused on the same objectives. One department may stress cost control while another stresses quality or flexibility.
The order winner in a hospital is typically quality from the patient’s point of view. Delivery, cost and flexibility may be order qualifiers. An insurance company, on the other hand may consider cost the order winner, while quality, delivery and flexibility are their order qualifiers.
7. Mission emphasizing imitation and low cost. Strategic decisions include the level of automation, service levels and inventory policies, store layout and general appearance, store location, product selection, wage level, service level at check-out, and service in aisles.
Mission emphasizing innovation and quality. Strategic decisions include types of innovation offered (for example, ordering online), service levels, general store appearance, locations of stores, product selection, freshness, specialized brands, convenience, training of staff, availability of staff in aisles, carry-out service, delivery service, check-out service, and additional special features such as lobster tanks, a delicatessen, or a restaurant.
8. Answers will vary depending on the students' sources. You should check to see if the students describe something like the mission, objectives, strategies and distinctive competence of their examples.
9. Examples of where higher quality costs more occur in all products including automobiles, clothing, furniture, etc. The definition of quality in this case refers to product design features, not consistency in producing a given product. If we use the definition of quality as consistently meeting a given customer need, then higher quality generally costs less.
10. a. Starbucks Coffee’s distinctive competence is the location of their stores and their unique product line.
b. Hewlett Packard’s distinctive competence is the HP Way and product innovation. The HP Way is how they treat their people with respect and trust. Product innovation is pursued to stay ahead of the competition.
c. Burger King’s distinctive competence is offering unique service in a highly standardized industry, and required transformation of the traditional supply chain system. They provide fast and efficient food service.
Copyright © 2017 McGraw-Hill Education. All rights reserved. No reproduction or distribution without the prior written consent of McGraw-Hill Education.
11. A distinctive competence in operations provides a basis for providing to customers what is important to them. It gives the company a way to differentiate from competitors and to attract customers. It provides a means to stay focused on what is important to the company.
12. One example of a distinctive competence that can be sustained and not easily duplicated is a particular type of internal culture that is very customer oriented, as evidenced by companies such as Nordstroms and IBM. Another example is the ability to continually introduce new products in companies such as Apple, 3M, and Sony. These product innovators develop internal systems that support continuous new product ideas.
The above distinctive competencies are hard to duplicate because they rely on internal values, cultures and systems that are difficult to describe and very path dependent in their development. These distinctive competencies cannot be purchased on the open market.
13. Students examples will vary. Operations and supply chains must be conceived of as global in nature. A global distinctive competence should be developed for operations, along with a global mission, objectives, and strategic decisions. For example, Ford Motor Company is considered to have one of the best global sources of supply, regardless of its national origin. The supply chain is global in nature. Global design and process technology are used. A basic product is designed, and whenever possible, it fits global tastes.
14. The link between the business and the operations function is through the operations mission. The operations mission is derived from the business strategy and should be in agreement with other functional strategies. If there is misalignment between the business and operations strategies, the company might not be able to adequately respond to market needs. For example, if a company’s business strategy is to be a low-cost producer and the operations mission is flexibility, then the company would have problems making decisions on what types of technology to purchase: for flexible manufacturing, or for low-cost, large scale manufacturing? There are frequently trade-offs in decision-making processes. A company cannot have everything, because of limited recourses. A close link between the business and operations strategies guarantees that the right trade-offs will be considered.
Copyright © 2017 McGraw-Hill Education. All rights reserved. No reproduction or distribution without the prior written consent of McGraw-Hill Education.
Market1
Teaching Note:
CASE DESCRIPTION
The primary subject matter of this case concerns the move towards utilizing electricity to power automobiles and the potential of a Chinese company to become the world's largest automaker, as well as the strategic fit of its innovation with the current external environment. It asks the students to analyze the situation facing BYD and to develop an Operations and Supply Chain strategy. Secondary issues examined include issues of managing growth and environmental sustainability.
With the emerging importance of alternative fueled vehicles, this case should be interesting to students. The case is useful in showing how the global automobile industry is quickly changing and the need for speed and innovation is essential for survival. With the rise of the Chinese automobile market, companies like BYD represent additional challenges to the American car manufacturers. The case asks students to do a number of things including assessing the future of electric cars and providing a strategic analysis of the Chinese producer BYD. These concepts are interrelated in that BYD has staked its future in the auto business on batteries.
It would be helpful to require students to do some additional research into the automobile industry; however the case can stand alone without this additional research. Students should be encouraged to think about the future of the automobile industry and the means by which vehicles will be powered. Current trends indicate that further change is likely for this industry. Students should consider the strategic direction of BYD and its operations and supply chain strategy along with the automobile industry as a whole. Assumptions should be challenged including one that the United States will lead the automobile industry, electric cars will continue to be cost prohibitive, or that gasoline powered vehicles will always be needed. An objective of the case is for students to see the importance of innovation and creativity in creating a competitive advantage, and distinctive competence for operations.
1 This case was prepared by CharlesA.Rarick,KasiaFirlej,andArifinAngriawanofPurdueUniversityCalumet and was published in the Journal of International Academy of Case Studies, Vol 17, 1, 19-29, 2011. It has been revised by Roger G. Schroeder, 2016 and is reprinted with permission.
ANALYSIS
The case asks students to answer four discussion questions. Instructors using the case should feel free to add any additional questions they feel are important for their course. While the discussion questions listed at the end of the case are ones considered important by the authors of the case, they are in no way meant to represent the only way to approach the analysis of the case.
Question 1: Do you think electric cars are a viable alternative to gasolinepowered vehicles? What is the future of the electric car? Explain youranswers.
Electric vehicles may become a viable alternative to gasoline-powered vehicles in the not so distant future, however, major changes will need to occur in order for this to happen.
There are a number of problems facing the electric car including the current limited driving distance on a single charge and therefore a frequent need to recharge. While the vehicles may be introduced for urban drivers where the limited driving range is not a problem, as a replacement for all gasoline powered vehicles, major structural changes will have to be made. It seems reasonable to assume that hybrid vehicles will be a viable market in that they can run short distances without using the gasoline engine and then shift to gasoline power when on a long drive. Toyota, Chevy and others have continued to emphasize hybrid vehicles over electric cars due to difficulties with long driving requirements in many markets.
To completely remove the combustion engine from automobiles it will be necessary to build an infrastructure of recharging stations or battery replacement stations throughout the country. This will take time and a lot of capital. Improvement in battery technology will also be needed to make this a viable situation. One could make a reasoned argument that electric vehicles will eventually replace gas powered cars, but it will take breakthroughs in battery technology, infrastructure changes, and possibly a more secure source of the raw materials used to produce ion lithium batteries. The power position of the current energy companies cannot be ignored in the future shift away from gasoline as a power source for automobiles. As the new president of Toyota, Akio Toyoda stated in a recent Fortune interview, “We are talking about a once-in-a-century transformation of the market. I believe the auto industry is now trying to face the challenges of presenting a solution to this one-in-a- century change. And what is clear to me that what is going to happen will not just simply be an extension of the past.” (Fortune July 6, 2009)2. The global auto industry is clearly going to be experiencing significant changes in the coming years. Whether electric
2 Source: A. Taylor. Toyota’s New Man at the Wheel. Fortune, July 6, 2009. 84-85.
autos will dominate that future is presently unclear, however, an argument could be made for a variety of alternative vehicles emerging to at least slowly replace gasoline powered automobiles.
Question 2: What are the internal strengths and weaknesses of BYD along with external, opportunities and threats (SWOT Analysis)?
The Chinese company, BYD has a number of strengths, a few weaknesses, a number of opportunities, and a number of threats. As a relative newcomer to the automobile industry the company will have to leverage its strengths in innovation to capitalize on its opportunities, along with overcoming the weakness and threats.
Strengths:
A spirit of innovation and a creative management style that pays attention to detail
Competence in battery production that can be applied to automobiles
Located in the fastest growing automobile market in China
No “legacy costs” found with established competitors
Positioned as a “green business” in a growing market
Financial backing of Berkshire Hathaway
Substantial government support of the company and industry
Weaknesses:
Relatively small firm in an industry that operates with large economies of scale
Weak brand recognition outside of China
Little experience in automobile manufacturing
Strategy success dependent on acceptance of electric vehicles
Opportunities:
Market growth in China and expansion to other Asian countries
Expansion to other markets outside of Asia
Possible supplier of automobile batteries to other auto manufacturers
Partnerships with other automotive battery manufacturers
Partnerships with more seasoned auto manufacturers
Threats:
Battery technology advances do not materialize
Competitive strengths are copied by competitors, both foreign and domestic
Global economic slowdown retards new car sales
Rising labor costs in China reduce some competitive advantages
Political instability in China affects the company
Question 3: Given a business strategy of being the word leader in manufacturing electric cars with innovative technology, what operations and supply chain strategy do you think BYD should pursue? Identify what operations and supply chain should do to help BYD compete including a mission, objectives, distinctive competence and key decisions.
Mission: The mission of operations and supply chain should be to support the high growth and innovative business strategy. It can be simply stated as: Operations and supply chain should excel at producing new products and providing adequate capacity to support sales of high quality products and lowest cost compared to the competition.
Note: this is not the only way to state the mission. The important point is that it must be linked to the high growth and innovative business strategy (e.g., good at NPD and providing adequate capacity).
Distinctive Competence: The distinctive competence right now is to produce superior batteries at significantly lower cost. It should be maintained by proprietary technology going forward which is not easily copied by the competition.
Objectives:
Cost: Product cost should be lowest in the industry and reduced each year.
Quality: Quality should be insured to minimize product failures, recalls and warranties.
Delivery: Sufficient capacity should be provided to fill orders at a 95% level.
Flexibility: Flexibility to change product mix and volume should be high because of the difficulty in forecasting future sales.
Note: Objectives should be consistent with the mission and business strategy.
Key Decisions and Policies:
Process: The process should be geared toward high volume production and fast scale-up for new products. Innovative process technology should be stressed.
Quality: Quality should use an ISO9000 certified process for BYD and its suppliers. This would insure that the product could be made to specification and would minimize failures.
Capacity: Capacity should be built in advance of production to prevent stockouts. Even a bit of excess capacity is acceptable rather than shortages. Plants should be located in China and foreign markets as international sales are developed.
Inventory: Finished goods inventory should be managed to provide a 95% service level. WIP inventories should be minimized by lean operations to reduce throughput time.
Supply Chain: A short supply chain should be used to minimize inventory and provide flexibility in supply. Partnerships with suppliers should be encouraged to provide a long-term orientation. Distributors will be key in selling the product.
Note: key decisions and policies are just an illustration of what is possible. The important point is that the decisions should support the objectives, mission, and distinctive competence.
Question 4: What recommendations would you make going forward for the business as a whole to overcome its weaknesses and threats and then capitalize on its strengths and opportunities?
There are a number of recommendations that can be given for BYD to continue its success, and one day become the world’s largest auto manufacturer. BYD will need to establish its brand identity. Outside of China the brand has little to no recognition. BYD will need to begin to build a brand identity that is associated with the image it hopes to project to the world – a new car company with a new idea. BYD needs to create the image of being a leader in alternative vehicles which are environmentally friendly, affordable, and stylish. While the Chinese have improved the quality of many of their products, Chinese brands still do not carry a quality image.
Strategic alliances with automobile companies may also be helpful in not only creating a better quality image, but also in providing some of the strengths BYD currently lacks. BYD has done well on its own in battery production and the company should continue its efforts at battery innovation and product development.
The current strategy is not a bad one but BYD faces the problem of much larger competitors copying its innovation. BYD may want to consider a strategic alliance with a more established automobile manufacturer, one that shares its spirit of innovation and possesses strong brand acceptance and has an established dealer network. To protect its battery technology, BYD needs to build patented batteries or process technologies that are difficult to copy.
Finally, since BYD is betting the company on the success of electric automobiles, and since electric cars require batteries made of lithium ion, BYD will want to make sure that it has a reliable supply of the necessary raw material. If electric cars do become more popular, demand for lithium will rise and potential supply issues
may arise. This may require partnerships with companies that supply lithium.
Given the limited range of EVs, BYD should consider exploiting markets other than the U.S. market until the range improves. Even in the U.S. households with two cars, one EV as a town car for commuting and limited driving could be a viable market, with the second car gasoline or hybrid powered for longer distances. In markets outside the U.S. where driving distances are not very long EVs may have a more satisfactory range, e.g., Japan, and Europe. The global hybrid market will continue to be a very robust market for BD vehicles in all countries, until EVs develop a longer range and highway recharge or replacement stations are built. BYD should therefore continue building a mix of hybrid and EVs in the foreseeable future.
BYD has an impressive track record. With the financial backing of Warren Buffet, the innovative and entrepreneurial spirit of its founder (Wang) and the growing need for alternative vehicles, BYD is positioned quite well for continued success. To move from its current market position to the world’s largest electric car company will require continued attention to detail, continued innovation, and perhaps, partnering with more established firms.
Note to Instructors: Prior to teaching this case, useful information can be found at the BYD website. www.byd.com. Also, you can Google “BYD” to find more current information about the company. Google “EV or electric cars” to find out about the current state of the industry. Google “lithium iron phosphate batteries” to find out about patents and the advantages of these batteries.
Technical Chapter Two Simulation
Simulation is an approach to model situations, problems, and behavior for which a solution cannot be computed or easily determined. Because simulation is so useful, one often hears, “if all else fails, try simulation.” Simulation models include business games, analogue simulators, and flight simulators, which all represent a real situation in terms of a model. In this chapter, however, our discussion of simulation will be limited to computer simulation of business decision problems.
Simulation is typically, but not always, used for dynamic models which include multiple time periods. Dynamic simulation models are incremented from one time period or one event to the next as the situation unfolds over time. In this way the effect of successive decisions can be evaluated.
Simulation should be used in situations where it is too expensive or too difficult to experiment in the real situation. In these cases, the effects of a decision can be tested on a simulation model before the decision is implemented. A large number of situations have been simulated in this way, including the flow of patients in clinics, the operation of physical distribution networks, the organization of curricula in colleges, factory operations, and arrivals and departures of all types (ships, aircraft, students, blood shipments, etc.), to name only a few. Simulation is frequently useful in solving queuing problems which have complicated arrival patterns, service distributions, or line disciplines. Simple queuing problems can be solved by analytical methods discussed in Technical Chapter 1. We will begin this chapter with a simple example of simulation. This will be followed by a discussion of the general simulation method, and some comments on the uses of simulation in operations.
A SIMULATION EXAMPLE: BETTY'S BAKERY
Betty's Bakery orders a number of bakery products each day that are carried in stock. One product Betty carries is a special type of whole wheat bread. Betty wanted to determine how much of this bread she should order each day to maximize her profits. If she ordered too little, she would lose sales and profit. If she ordered too much, the excess would be wasted. For simplicity, we assume that all bread not sold during the day would be given away the next day at a total loss. (In real life, the leftover bread could, perhaps, be sold as day-old bread at only a partial loss.)
Betty collected data on the daily demand for her bread for 100 days, obtaining the following demand frequencies:
Betty had been managing her bread inventory by ordering an amount equal to demand on the day before. Sometimes this decision rule left her with too much bread, and sometimes she did not have enough. Therefore, Betty wondered whether there was a better decision rule that she might use. For example, how would profits be affected if she ordered an amount of bread equal to the average past usage? For this case, average past usage is equal to 37 loaves per day.
X = .05(22) + .10(27) + .20(32) + .30(37) + .20(42) + .10(47) + .05(52)= 37
To resolve this issue, we will construct a simulation model incorporating the following two decision rules:
Rule 1: Order a number of loaves equal to demand on the previous day.
Rule 2: Order 37 loaves each day regardless of past demand.
The best rule will be selected on the basis of maximum profit over the total number of days simulated. We will use 15 days of simulation, just for purposes of illustration. In a real application, many more days would be used to obtain reliable results.
To simulate this problem, we will generate a series of random daily demands with frequencies equal to those given above. To visualize the demand-generation procedure, imagine a large wheel of fortune with 100 positions on it. Five of those positions are labeled with a 22, corresponding to the .05 frequency above. Ten of the positions are labeled with a 27, corresponding to the .10 frequency, and so on. The wheel is spun once for each day, and where it stops determines the daily demand. As a result, provided that the wheel is truly random, random demands with the proper frequencies are generated. Although this process of generating random demands is helpful conceptually, it can be made more efficient by using a random number table. The random number table shown in Appendix B of the textbook, consists of a series of random numbers arranged in rows and columns. The numbers are randomized across rows, down columns, and by digits within numbers. The table can be used by selecting an arbitrary starting point and proceeding either across rows or down columns. Some of the digits can be thrown away if they are not needed because the numbers in the table are completely randomized.
For example, suppose we wish to generate 15 two-digit random numbers for Betty's Bakery. Suppose we start in the upper left-hand corner of the table (arbitrarily) and proceed across the first row. Taking the first two digits of each number and throwing the rest of the digits away, we obtain
27, 43, 85, 88, 29, 69, 94, 64 32, 48, 13, 14, 54, 15, 47
In this case, we could also have used all the digits in each number or proceeded down the columns instead of across rows or used any other pattern we liked as long as the pattern was consistent.
Now that we have generated 15 random numbers, we can convert them to loaves of bread demanded. This is done by associating the entire range of 100 random numbers with the demand distribution, as follows:
In the table, 00 04 - a total of 5 numbers out of 100 - is assigned to the first category. Similarly, 05 14 contains 10 numbers, or a frequency of .10.
The random numbers that we have generated above are converted to loaves of bread demanded, as shown in Table T2.1. For example, the first random number, 27, corresponds to a demand of 32 loaves; the second random number, 43, corresponds to a demand of 37 loaves; and so on. In this way, we can simulate the demand for bread on each of the 15 days of the problem by what is commonly called the Monte Carlo method.
The next step will be to calculate the corresponding sales and amount ordered on each day. These calculations depend on the rule chosen; therefore, two sets of calculations are shown in Table T2.1. With rule 1, the amount ordered can be filled in the table, since demand is known. Sales are then just the minimum of the amount ordered and the amount demanded on each day. Betty cannot sell more than she ordered, and she cannot sell more than the demand. Similar daily calculations are made for rule 2.
The total amount ordered and the total amount sold over the 15 days are obtained in Table T2.1. These figures can be multiplied by the unit cost and selling price to derive profits. Assume that bread sells for 50 cents a loaf, and it costs 25 cents to purchase a loaf wholesale. The total profit over 15 days for each rule then is
Rule 1: Profit = .50(500) - .25(550) = $112.50
Rule 2: Profit = .50(515) - .25(555) = $118.75
Rule 2, therefore, offers some improvement in profit contribution over rule 1.
TABLE T2.1 BETTY'S BAKERY
GENERAL METHODOLOGY
The example we have just discussed represents an application of the generalized simulation method. The steps used in every simulation study are shown in Figure T2.1 and described below; it is assumed that a computer is being used in the simulation process.
Define the Problem
A relevant decision problem must be isolated and defined for study. Considerable experience and insight are required if a problem for simulation is to be properly isolated
FIGURE T2.1
from its environment. Problem definition also includes deciding on the objectives, constraints, and assumptions that will be used. After the problem is defined in general terms, a specific quantitative model can be developed.
In Betty's Bakery, a problem regarding a specific type of bread was isolated. It was assumed that if the whole wheat bread was not available, the sale would be lost. Customers' substitution of other types of bread or other bakery products was not considered possible. It was also assumed that Betty's objective was to maximize profits, and a variety of other explicit or implicit assumptions were made. These assumptions collectively define the problem.
Develop the Model
In the development of simulation models, the controllable variables, the uncontrollable variables, measures of performance, decision rules, and model functions must be defined. In this way a specific mathematical representation of the problem will be developed. Every model can be expressed in the form
P = f (Ui, Ck)
In developing the simulation model, we are simply specifying the P, f, Ui, and Ck values in the model.
In the model, the uncontrollable variables Ui, or parameters, are fixed constants, which are outside the control of the decision-maker. For example, in Betty's Bakery, the initial demand level, the frequency distribution of demand, the cost of purchasing bread, and the price of bread were all considered fixed values and, therefore, uncontrollable variables.
The controllable variables or decision variables Ck, in a simulation model can be controlled by the decision-maker. These variables will change in value from one run to the next as different decisions are simulated. In Betty's Bakery, the amount ordered each day was the controllable decision variable. The values of this variable were specified by a decision rule, which determined the amount ordered each day.
Finally, a decision model has one or more measures of performance P and function(s), which relate the variables to performance. In Betty's Bakery, the measure of performance was profit. A specific formula was used to calculate profit as a function of the controllable and uncontrollable variables in the model.
After all the model elements have been defined, the model is ready for computer flowcharting and programming. Before a flowchart can be constructed, however, the analyst must decide whether the model will be incremented by fixed or variable time increments. Every simulation model has a “clock” which keeps track of the time increments in the model. In a fixed-time-increment model, the clock is advanced in fixed time periods (e.g., Betty's Bakery). In a variable- time-increment model, the clock is advanced to the next event. For example, if patient flows in a hospital are simulated, each arrival and departure can be treated as an event. The clock is then advanced to the next arrival or departure time, which results in variable time increments.
Flowchart the Model
A simulation model should always be flowcharted prior to computer programming. Flowcharting helps clarify the precise computational logic of the model. This facilitates computer programming and helps the model builder discover logical errors in the model.
A flowchart for Betty's Bakery is shown in Figure T2.2. The flowchart simply represents the logic used to construct the data recorded in Table T2.1. Each day of the simulation, a demand value is generated. The order quantity is then determined by using the appropriate decision rule and comparing the order quantity with the demand. If the demand is greater than or equal to the order quantity, sales are set equal to the order quantity, since Betty will sell all she has on hand. If demand is less than the order quantity, sales are set equal to demand and the rest of the available bread will be given away. Using the quantities for sales and order size, profit is then computed, and the simulation is recycled until it reaches the desired number of periods. When the simulation is finished, a report showing the various values of sales, order quantities, demands, and profit is printed.
The flowchart is a representation of the mathematical model being simulated. On each step of the simulation, we compute values for the equation P = f(Ui, Ck). In the case of Betty's Bakery, we use the mathematical model already described above to compute sales and profit on each step of the flowchart.
In constructing simple flowcharts, two types of symbols are used:
Operation Symbol = Decision Symbol
An operation may consist of generating a demand, setting a value of a variable, or other tasks in the simulation. A decision results in a branch in the simulation mode depending on a comparison or test of variables. Flowcharts are normally drawn from top to bottom. (See Figure T2.2.)
Start
FIGURE T2.2
Set Initial Values Demand = 37 Unit cost = .25 Unit price = .50
Flowchart for Betty’s Bakery
Run length = n Day = 0 Day = Day + 1
DetermineOrder
GenerateDemand Sales = Demand
Accumulate Sales and Orders Sales = Order Profit=SalesxPrice -OrderxCost Is Demand ≥ Order Is
Program the Model
A good flowchart will make it easy to program the simulation model for computer operation. For example, a simple FORTRAN program for Betty's Bakery is shown in Figure T2.3. The program uses the following fixed inputs: demand for day zero, the decision rule being used for order quantity, the demand distribution, unit cost, unit price, and run length. The output of the program when rule 1 is used is shown in Table T2.2. This table provides the same information as the data recorder we constructed earlier by hand. The advantage of the program, of course, is that we can easily change the run length and other input parameters when we are using the simulation model for decision making. Simulation programming can be done in a variety of computer languages - general languages such as FORTRAN, C and VISUAL BASIC as well as special simulation languages such as SimScript or VisSim. The advantage of the special languages is that they simplify the programming through the use of special simulation statements that can be used to generate arrivals, build queues, and maintain statistics commonly used in simulation.
TABLE T2.2 BETTY'S BAKERY OUTPUT
FIGURE T2.3 FORTRAN program.
DIMENSION D(100), Q(100), PROFIT (100), SALES (100)
C INITIALIZE VARIABLES
TPROF=0
TDEMAN=0
TSALES=0
TQTY=0
D1=37
C=.25
P=.5
N=100
DO 100 I=1,N
C GENERATE DEMAND
NX=RANF (0) *100.
IF (NX.GE.0..AND.NX.LE.4.)
IF (NX.GE.5..AND.NX.LE.14.)
IF (NX.GE.15..AND.NX.LE.34.)
IF (NX.GE.35..AND.NX.LE.64.)
IF (NX.GE.65..AND.NX.LE.84.)
IF (NX.GE.85..AND.NX.LE.94.)
IF (NX.GE.95..AND.NX.LE.99.)
C DECISION RULE
IF (I.EQ.1) THEN Q(I)=D1
ELSE
Q(I)=D(I-1)
ENDIF
C SALES
IF(D(I).GE.Q(I)) SALES(I)=Q(I)
IF(D(I).LT.Q(I)) SALES(I)=D(I)
C PROFIT CALC
PROFIT(I) =SALES(I) *P-Q(I) *C
100 CONTINUE
C HEADINGS
PRINT 110
D(I)=22
D(I)=27
D(I)=32
D(I)=37
D(I)=42
D(I)=47
D(I)=52
110 FORMAT (///, 1X, 28X, 6HAMOUNT, /, 3X, 3HDAY, 8X, 6HDEMAND, 8X, 7HORDERED, * 8X, 5HSALES, 10X, 6HPROFIT,//)
C SUMMATION
DO 200 I=1,N
TPROF=PROFIT(I)+TPROF TDEMAN=TDEMAN+D(I)
TSALES=TSALES+SALES(I)
TQTY=TQTY+Q(I)
PRINT 180, I, D(I), Q(I), SALES(I), PROFIT(I) 180 FORMAT (3X, I3, 10X, F3.0, 12X, F3.0, 11X, F3.0, 9X, F7.2,/)
200 CONTINUE
PRINT 210, TDEMAN, TQTY, TSALES, TPROF 210 FORMAT (IX, 5HTOTAL, 6X, F7.0, 8X, F7.0, 7X, F7.0,7X,F9.2)
STOP END
Collect Data
After the model is programmed, data must be collected to specify the input parameters. In the case of Betty's Bakery, data are required for unit cost, price, and the demand distribution. The unit cost might be available from the accounting department, or it might be derived from past purchase orders. The price is easily obtained from current practice. The demand data might be derived from available records or collected by a special study. A minimum of about 20 days would be needed to obtain even rough estimates of demand frequencies. It would be better to have as many as 100 days of past demand data for stable estimates of demand frequency.
The collection of data is often one of the most costly and time-consuming parts of the simulation study. Because of the time required, data collection is often done at the same time as the programming. In this case, when the programming is done, the data are also available to begin validation of the model.
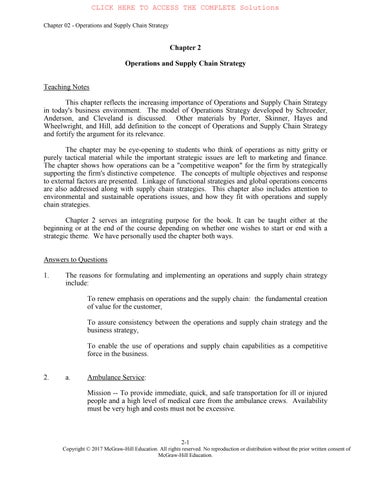
Validate the Model
Validation determines whether the simulation models are sufficiently accurate to portray the real world. To be useful, the model does not have to reflect every real-world condition and assumption. As a matter of fact, a simplified description of the real world is often necessary to make the model controllable and affordable. Therefore, simplifying assumptions incorporated into the model must be checked by the process of validation. There are several types of validation: of input parameters, of outputs, and of run length. Validation of input parameters is aimed at determining whether the inputs used by the model match the correct values. For example, in the case of Betty's Bakery, we should test whether the demand distribution for bread generated by the model is a good match for the assumed distribution. Figure T2.4 shows a plot of 100 values of the demand distribution used in a simulation run versus the true values of the demand distribution. In each case, there are errors between the true demand and the observed values in the simulation. Standard statistical tests can be used (e.g., the chi-squared test) to determine whether or not the observed distribution is a sufficiently close fit to the true distribution. If not, perhaps more runs may be needed or there may be an error in the coding itself. Similar tests can be made on output values to determine whether the simulator is predicting properly or not. In the case of Betty's Bakery, an output test would be a comparison of actual sales and profit data with the outputs from the model under similar conditions. These output comparisons can be tested statistically in the same way as the inputs.
FIGURE T2.4
Betty’s Bakery: true versus simulated demand
Finally, validity can be related to run length. In simulation, run length is set to obtain stable or realistic results. One way to determine run length is to plot the output results of the model versus run length and determine when output stability occurs. In Figure T2.5, both sales and profit are plotted as a function of run length. As may be noted, there are wide fluctuations for small run lengths, but the output stabilizes as run length increases. Often, simulators have initial starting conditions that are arbitrarily selected. Therefore, the simulator must be run long enough to arrive at steady-state results. Standard statistical tests can be run on the output to determine when stability occurs. After evaluating the model validity, it may be necessary to revise the model. Therefore, Figure T2.1 shows a feedback loop from validation to all earlier steps in the modeling process. In addition to guiding model revision, validation should help determine an appropriate run length. When validation is completed, the model is ready to be used.
Exercise the Model
To aid decision making, the simulation model is exercised or run through several cases of interest. In the case of Betty's Bakery, a run is made for each of the two decision rules, and the effects on sales and profits are compared. For 100 periods, the following results are obtained:
In this comparison, exactly the same daily demand is used for both rules, so demand variability is the same in both cases.
In simulation studies, sensitivity analysis is required to test the sensitivity of the results to input assumptions. In the case of Betty's Bakery, for example, there may be some uncertainty with regard to the unit cost figure. In the example, a cost of 25 cents per loaf was used, but the cost might really be 30 or 20 cents a loaf, depending on the assumptions made. Would these changes in cost affect our preference for the rule used? In order to answer this question, we make two additional calculations: one with C = .30 and the other with C = .20. The results of these calculations are
As indicated earlier, rule 2 is still preferred to rule 1 on the basis of profit.
As part of the decision-making process, similar sensitivity runs could be made for price and demand. In many cases, sensitivity runs are the most valuable part of the analysis because they give the decision maker a “feel” for the situation.
FIGURE T2.5
FIGURE T2.6
Sensitivity analysis
For Betty's Bakery, additional decision rules should also be investigated. For example, why should we order at the average of past demand? Should we not also consider other values of constant ordering levels? Figure T2.6 shows profit as a function of various constant ordering levels, indicating that it is most profitable to order 40 loaves a day (slightly more than the past average of demand). As part of the analysis, other rules should also be investigated.
Implement the Results
In the pursuit of model building, we sometimes forget that the simulation study is not useful until it has some impact on decision making. This means that the result of the study must cause a change in behavior or - at a very minimum - provide confirmation that the present actions are correct. In the latter case, the study may have prevented undesirable change.
Implementation, therefore, requires us to consider the behavioral reactions of decision makers and the people they manage. In the case of Betty's Bakery, rule 2 is preferred; fortunately, it has the least behavioral impact on the supplier, for a constant number of loaves is ordered each day.
VARIABLE-TIME-INCREMENT SIMULATION
As we have already indicated, variable-time-increment simulation is not based on discrete time periods; instead, the “clock” is advanced from one event to the next. As a result, the clock could read time 1, 3, 9, 12, and 17, for example, in a simulation run consisting of 5 events and 17 time units. The principles of designing a variable-time-increment simulation model are exactly the same as those of designing the fixed-time-increment model. Therefore, following the same steps in model design, we will provide a variable-timeincrement example as follows.
Suppose we are trying to design dock facilities for ships. Since docks are very expensive, we want to decide whether to use one or two docks in a particular harbor. To
solve this problem, we need an arrival-time distribution for the ships. In particular, suppose the ships arrive at random with a specified mean time between arrivals, according to the exponential arrival distribution described in Technical Chapter 1. We also assume, for the sake of convenience, that the time to service a ship is a constant number of days, such as 5. Service in this case involves unloading a ship and refueling it at a dock. Under these conditions, we are interested in how long the ships will have to wait in the harbor before they are unloaded. After finding the waiting time, we might convert waiting time to waiting cost in order to trade off the cost of the waiting ships with the cost of the additional dock.
In developing this model, we need to generate exponential ship arrivals. When we assume an average time of 6 days between ship arrivals, the exponential distribution of arrival times is as shown in Figure T2.7. These times are derived from the following formula:1
Random times for ship arrivals can be generated by using the discrete probability distribution shown in Figure T2.7a or the continuous distribution shown in Figure T2.7b. The discrete distribution is used in the same way as in the previous example, by assigning random numbers to the distribution.
1This formula is the exponential distribution which specifies the time between arrivals for a Poisson arrival distribution. See Technical Chapter 1 for more details.
Distribution of arrival times.
The continuous distribution is used by generating a random number for the y axis between 0 and 1 and computing the corresponding t coordinate from the inverse of the exponential equation. The inverse equation is obtained from the exponential formula [Equation (T2.1)] by solving for t in terms of y. This is done by first expressing Equation (T2.1) in the following form:
Then, taking the natural logarithm of both sides yields
Solving for t gives
Various values of y between 0 and 1 are generated at random and plugged into Equation (T2.2) to give the corresponding value of t. For example, if y = .7 is generated, this corresponds to a ship arrival time of t = 7.22 days between ships.
FIGURE T2.7
This computation is shown in Figure T2.7b, where the y = .7 value is projected onto the t axis.
The arrival times generated with the continuous exponential distribution are shown in Table T2.3, which also shows the corresponding times the ship enters and leaves service. For the single dock, if another ship is in the dock when an arrival occurs, the ship joins the waiting line and waits until the preceding ship is finished. As a result, the waiting time for each ship can be calculated from the table.
TABLE T2.3 SHIP EXAMPLE
The remaining steps in using an event-oriented model, flowcharting, programming, data collection, validation, experimentation, and implementation, are exactly the same as with the time-oriented model described above.
For this example, the problem would also be simulated using two docks and the same ship arrival times. Then the solutions with one dock and two docks would be compared. A decision could be based on differences in costs, waiting times, and other factors of importance.
APPLICATIONS OF SIMULATION IN OPERATIONS
Applications of simulation in operations are numerous. Well-known applications include the following:
1. Facilities design. These applications are related to the size of facilities or the number of servers required. Examples include the number of checkout counters in a supermarket, the number of runways in an airport, and the number of toll booths on a freeway. Simulation methods are useful in queuing situations, such as these, with complex conditions.
2. Aggregate planning. Where an operation's aggregate capacity must be determined, simulation models are used to find the cost of alternative plans. Specific aggregate planning decisions that may involve simulation are described in the text.
3. Scheduling. Simulation has been used in the evaluation of alternative scheduling rules. In scheduling patients for surgery, for example, should the longest operation be scheduled first or last? In the textbook scheduling of jobs in a machine shop is discussed and alternative dispatching rules are evaluated by simulation.
4. Inventory. Many inventory models are evaluated by simulating the effects of ordering rules. In complex inventory situations, it is often necessary to simulate proposed rules before they are put into effect to determine the impact on customer service and cost.
5. Materials requirements planning. When materials requirements planning (MRP) is used to plan and control manufacturing, simulation is used to evaluate proposed changes in the manufacturing plan before the changes are put into effect. As a result, “what if” questions can be asked by management before decisions are made
Simulation is a broad methodology which has wide applicability to operations decisions.
QUESTIONS
1. Discuss the differences between fixed- and variable-time-increment simulation models. When would one model or the other be preferred?
2. Suppose you are simulating the arrival of customers at a barbershop to determine the number of chairs needed. Develop an approach to model validation in this case.
3. How should you decide how long to run a simulation model?
4. Show how random times can be developed from a normal distribution using the cumulative normal distribution function.
5. Discuss the advantages and disadvantages of making a simulation model completely realistic.
6. Sketch out a flowchart for the ship-arrival simulation problem described in the chapter.
7. What is the purpose of using sensitivity analysis in simulation studies?
8. Contrast and compare the use of simulation and analytical methods for solving queuing problems.
PROBLEMS
1. The owner of the ABC grocery store is trying to decide whether to install one or two checkout counters. The time between customer arrivals is exponentially distributed with an average of 18 minutes between arrivals. The time to service a customer is also exponentially distributed with an average of 10 minutes per customer. Customers are served on a first-come first-served basis.
a. Simulate this problem either by writing a computer program or by doing it manually. If the simulation is done manually, use 10 arrivals.
b. Calculate the average waiting time of the customer and the percentage of idle time of the server or servers.
c. How would you decide between the alternatives?
2. An inventory of a certain repair part is maintained in a garage. At present, when the supply of the part drops to 30 units, an additional 40 units are ordered. It takes 2 days to get the parts after they are ordered. The daily demand is exponentially distributed with a mean of 13 units. Assume a starting inventory of 35 units.
a. Simulate this problem by writing a computer program or doing it by hand. For hand computations, use 20 days of simulated demand.
b. How many orders are placed, how much inventory is carried on average, and how many stockouts occur?
c. How would you validate your model in this case?
3. An assembly operation requires processing through two stations in sequential order. The amount of time required for processing at each station is a random variable, as shown in the following table. Assume that station 2 must wait whenever there is no work available from station 1. Also assume that there is no buffer between the stations.
a. How long will it take to process 10 jobs through both stations, assuming the stations are empty when starting?
b. How much time do stations 1 and 2 spend waiting?
c. What is the effect on waiting time of placing a buffer between the two stations?
Station 1 Station 2
4. A florist is trying to decide how many bouquets of fresh flowers to cut for each day. Any flowers cut and not sold during the day are thrown away. The variable cost of growing and cutting flowers is $4 per bouquet, and the price is $6 per bouquet. The following demand distribution has been observed in the past:
The florist would like to evaluate policies of cutting 55 and 60 bouquets each day.
a. Simulate each policy for 20 days.
b. Which policy maximizes profit?
5. A laundromat is considering installation of 10 washers and 5 dryers. On average, a customer arrives at the laundromat every 12 minutes with one or more baskets of clothes. The time between arrivals is distributed according to the exponential distribution. The number of washer loads per customer is distributed as follows:
Each dryer will handle two loads from the washer. It takes 15 minutes to wash a load of clothes and 30 minutes to dry a load.
a. Simulate the operation of this laundromat for 4 hours. Build a table to describe the status of the washers, the dryers, and the waiting loads.
b. How much idle time is there for the washers and dryers? How much waiting time for customers?
c. What actions might be suggested by your simulation?
6. A repairer tends three different machines. Each machine has an exponential distribution of time between failures, with a mean of 100 minutes. When the machine fails, it takes an average of 20 minutes to repair it with an exponential service time. Assume all machines are in operation at the beginning of the simulation.
a. Simulate the problem for a total of 8 hours.
b. How much idle time is there for the machines and for the repairer?
c. If the repairer is paid $10 per hour and lost machine time costs $30 per hour, evaluate the suggestion to add another repairer.
7. At an airport, aircraft wait in a holding pattern whenever the runway is busy or temporarily closed for bad weather. After 20 minutes in the holding pattern, a plane must be diverted to an alternative field for landing. Planes arrive at the field at an average rate of one plane every 5 minutes according to the Poisson distribution. Landing takes a constant time of 30 minutes for each plane.
a. Simulate 10 landings at the airport.
b. How long do planes wait on the average? Are any planes diverted to another field?
c. What is the average utilization of the runways?
d. Suppose planes arrive at a rate of one every 4 minutes. What effect will this have on your answers?
8. In order to reduce congestion, it has been proposed that a second runway be opened to landings at the airport described in Problem 7.
a. Simulate 10 landings with the two runways in operation.
b. What improvements are made in average landing times?
c. What percentage of the time are both runways busy?
9. Patients arrive at a hospital emergency room for x-rays. The arrivals occur at random according to a Poisson distribution with an average of 30 minutes between arrivals. Service is provided by x-ray technicians who take an average of 20 minutes per patient, but service time varies exponentially.
a. Simulate the arrival and service of 20 patients at the x-ray room.
b. Compute the average waiting time, the average number of patients in line, and the percentage of idle time of the x-ray machine.
c. Compute the same statistics as in part (b) using the queuing formulas from Technical Chapter 1. Compare the results and explain differences.
10. A repairer fixes a total of 500 different major appliances in an apartment complex. Each appliance operates an average of 900 hours between failures using an exponential distribution. It takes the repairer an average of 25 minutes to get to the site, fix the machine, and return to base. The repair times follow a uniform probability distribution with a minimum of zero and a maximum of 50 minutes per repair.
a. Simulate 15 machine failures and repairs.
b. How busy is the appliance repairer? How long is the average appliance out of service for repair?
c. The company is considering adding 200 more appliances to the repair load. What will the effect be on the statistics in part (b)?
d. What if the repairer can fix the machines in a maximum of 40 minutes using the uniform distribution of repair times?