Discrete wavelet transform Fast Fourier transform Lissajous WindVoltageMonitoringcurvesdipsturbineconversion chain
Article history:
Wind turbine doubly-fed induction generator defects diagnosis under voltage dips
Received Apr 22, 2021
Keywords: Diagnosis methods
Email: sara.kharoubi@gmail.com
Corresponding Author: Sara DepartmentKharoubiof Electronics / Electrotechnical, National School of Applied Sciences Abdelmalek Essaadi University, Tangier 9000, Morocco
Article Info ABSTRACT
1. INTRODUCTION
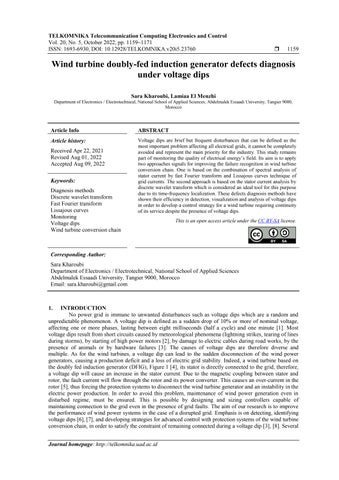
No power grid is immune to unwanted disturbances such as voltage dips which are a random and unpredictable phenomenon. A voltage dip is defined as a sudden drop of 10% or more of nominal voltage, affecting one or more phases, lasting between eight milliseconds (half a cycle) and one minute [1]. Most voltage dips result from short circuits caused by meteorological phenomena (lightning strikes, tearing of lines during storms), by starting of high power motors [2], by damage to electric cables during road works, by the presence of animals or by hardware failures [3]. The causes of voltage dips are therefore diverse and multiple. As for the wind turbines, a voltage dip can lead to the sudden disconnection of the wind power generators, causing a production deficit and a loss of electric grid stability. Indeed, a wind turbine based on the doubly fed induction generator (DFIG), Figure 1 [4], its stator is directly connected to the grid, therefore, a voltage dip will cause an increase in the stator current. Due to the magnetic coupling between stator and rotor, the fault current will flow through the rotor and its power converter. This causes an over current in the rotor [5], thus forcing the protection systems to disconnect the wind turbine generator and an instability in the electric power production. In order to avoid this problem, maintenance of wind power generation even in disturbed regime, must be ensured This is possible by designing and sizing controllers capable of maintaining connection to the grid even in the presence of grid faults. The aim of our research is to improve the performance of wind power systems in the case of a disrupted grid. Emphasis is on detecting, identifying voltage dips [6], [7], and developing strategies for advanced control with protection systems of the wind turbine conversion chain, in order to satisfy the constraint of remaining connected during a voltage dip [3], [8]. Several
1159
This is an open access article under the CC BY SA license.

TELKOMNIKA Telecommunication Computing Electronics and Control Vol. 20, No. 5, October 2022, pp. 1159~1171
ISSN: 1693 6930, DOI: 10.12928/TELKOMNIKA.v20i5 23760
Sara Kharoubi, Lamiaa El Menzhi Department of Electronics / Electrotechnical, National School of Applied Sciences, Abdelmalek Essaadi University, Tangier 9000, Morocco
Revised Aug 01, 2022
Voltage dips are brief but frequent disturbances that can be defined as the most important problem affecting all electrical grids, it cannot be completely avoided and represent the main priority for the industry. This study remains part of monitoring the quality of electrical energy’s field. Its aim is to apply two approaches signals for improving the failure recognition in wind turbine conversion chain. One is based on the combination of spectral analysis of stator current by fast Fourier transform and Lissajous curves technique of grid currents. The second approach is based on the stator current analysis by discrete wavelet transform which is considered an ideal tool for this purpose due to its time frequency localization. These defects diagnosis methods have shown their efficiency in detection, visualization and analysis of voltage dips in order to develop a control strategy for a wind turbine requiring continuity of its service despite the presence of voltage dips.
Accepted Aug 09, 2022
Journal homepage: http://telkomnika.uad.ac.id
��
Ω�� =��×Ω
of voltage dips diagnosis have been developed, [6], [9], [10]. However some methods allow only some voltage dips classification [6]. Others do not allow estimating the parameters characterizing the voltage dip [9]. These parameters are of a great use especially for a possible correction in real time.
���������������� = 1 2 ×��p×ρ×π×��
2. WIND TURBINE MODELING
The multiplier adapts the slow speed of the blades to the fast speed of the machine by the gain �� The mechanical torque �� and the speed of the machine �� are expressed respectively in (4) and (5) (4) (5) dynamic equation is given by:
����Ω�� ���� = �� p ������ ���� =���� ������ �������� =���� ������ ��×Ω�� (6)
ISSN: 1693 6930
Where �� is the specific speed and �� is the angle of the blades orientation. The aerodynamic torque is [14]: (3)
Where, �� is the aerogenerator radius, �� is the air density, 1.225 kg/m3 , �� is the wind speed and ��p is the coefficient of power. According to [13] this last coefficient is approximated by: p(λ,β)=0.4233������(��(�� 3) 15 03��) 0.0184(�� 3)�� (2)
��
The
��
Figure 1. System configuration of the DFIG based wind turbine
The expression of the mechanical power recovered by the turbine [12] is: 2 × 3 (1)
���������� = ���������������� Ω = 1 2 ����×��×��×��2×��3 Ω
��
1160methods
In this paper, two techniques are used for detecting and characterizing three types of voltage dips. One is based on grouping of fast Fourier transform (FFT) analysis of stator current and Lissajous curves of grid currents The second technique is founded from applying the discrete wavelet transform (DWT) for analyzing the stator current. For this purpose, the modeling of a non defected wind conversion system, based on mathematic model and created in Matlab simulink, is firstly presented, secondly, an indirect stator field vector oriented control is applied to obtain the wind system performance. After that, diagnosis methods were required for extracting appropriate features related to the defect. The FFT analyzer convert the signals from the time domain to the frequency domain, while the DWT can accurately locate frequencies and their exact time locations. Therefore, it can detect unexpected transient changes that might occur in any steady state due to its time frequency decomposition. To FFT spectrums of stator current were associated Lissajous curves formed of Concordia components of grid currents which has been tested and approved previously in [11]. Simulation results curried out for non defected and defected operation show the effectiveness of the proposed methods.
TELKOMNIKA Telecommun Comput El Control, Vol. 20, No. 5, October 2022: 1159 1171
���� =����������/����
Wind turbine doubly fed induction generator defects diagnosis under voltage dips (Sara Kharoubi)
��������
Voltage dips due to single phase faults present a voltage drop over a single phase without additional phase shifts.
TELKOMNIKA Telecommun Comput El Control
1161
Where �� is the total inertia that appears on the generator shaft, �� is the number of pole pairs, ���� is the electrical angular speed of the rotor, is the electromagnetic torque, is the viscous friction torque and �� is the coefficient of viscous friction
{���� =�� ����×�� ���� × ������ ���� =�� ����×�� ���� × ������ (10)
Voltage dips due to a fault between two phases and earth, which causes the voltage drop of two phases, while the third remains unchanged.
Voltage dips due to three phase faults, present voltage drops of the same depth on all three phases without additional phase shifts.
Usually, when a voltage dip occurs in the grid, wind turbine is disconnected to avoid loss of structure However, for large wind energy capacity, disconnection from the grid could cause problems. Hence the necessity of induction generator monitoring and online diagnosis in order to resolve this problem. Among the online diagnostic methods [19], those based on the stator current such as the Park vector [20], [21] or its
{������ =���� ������ =0 ������ = �� �� ���� ������ ������ (9) Active and
������ = 3 2��× ���� ���� (������ ×������ ������ ×������) (8)
6. COMBINAITION OF FAST FOURIER TRANSFORM AND LISSAJOUS CURVES
3. MODELING OF DOUBLY FED INDUCTION GENERATOR
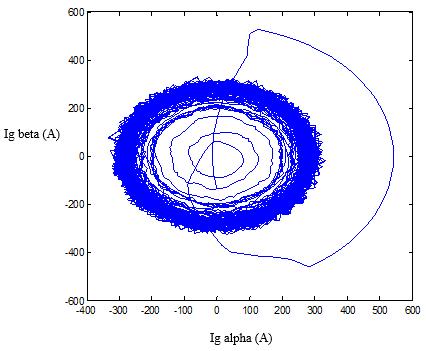
The main characteristics of electrical voltage dips are their amplitude and phase [1], [5]. Thus, they can be represented by vectors so called phasors [16], [17]. The relationship between these phasors is called the signature or type of the voltage dip.
4. FIELD ORIENTED CONTROL
A two phase reference frame ( ) linked to the rotating field is chosen. The stator flux is oriented along the direct axis. So, we can write: reactive powers can be written as:
The electromagnetic torque equation is:
������
{������ =���� × ������ + �� ����(������) ���� ×������ ������ =���� × ������ + �� ����(������) ���� ×������ {������ =���� × ������ + �� ����(������) (���� ����)×������ ������ =���� × ������ + �� ����(������) (���� ����)×������ (7)
5. DEFINITION OF THREE TYPES OF VOLTAGE DIPS
��, ��
The asynchronous machine mathematical model in Park reference frame (��, ��) is given by [15].
There are two general types of voltage dips that can affect wind turbines: voltage dips without phase shift and voltage dips that are accompanied by a phase shift affecting one or more phases. In this paper, we limit our study to presenting the simulation results of voltage dips without phase shift Table 1 namely:
Where in Table 1, �� is the maximum value of the electric voltage amplitude, �� is the voltage dip value and �� is the voltage dip depth The mathematical expressions ���� �� ∈(��,��,��) relate to the three components of each signature. As these different scenarios show, voltage dips are caused by an imbalance affecting the amplitude. Note that their signature can be modified by transformers located within the grid [18].
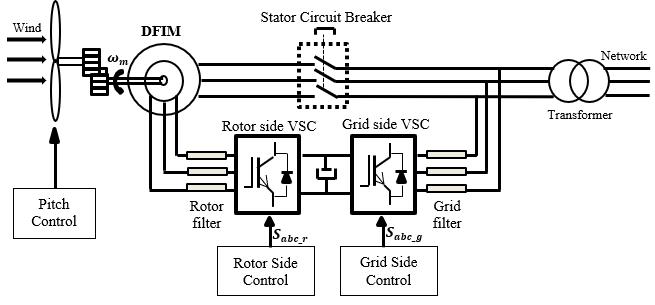
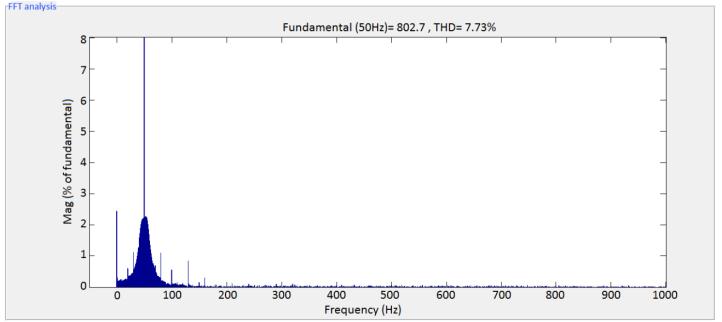
The results presented below are displayed using the Matlab graphical interface. Figure 2(a) and Figure 2(b) represent respectively the grid currents Lisssajous curves and the FFT diagram of the stator current during healthy operation. These cases are a reference to which voltage dips diagnosis cases are compared.The Lissajous curve of the grid currents Concordia components, as shown in Figure 2(a), has a circular shape more concentrated on its outline. As depicted in Figure 2(b), the fundamental of the signal is 802.7 at 50 Hz and the total harmonic distortion THD content is equal to 7.73%. In addition, harmonics are detected at a frequency equal to 100 Hz, its amplitude equal 0.5% of the amplitude of the fundamental. There are also current components around the main supply frequency component at a low frequency and having low amplitude. These harmonics result from the type of converter control implemented in the system.
Figure 2. Currents graphical analysis based on (a) Lissajous curves of grid currents and (b) FFT diagram of stator current
(a) (b)
TELKOMNIKA Telecommun Comput El Control, Vol. 20, No. 5, October 2022: 1159 1171
1162spectrum
Table1. Classification of the three types of voltage dips
{ ���� = ���� 2 (������ +�� ����) ���� = �� 2(����(�� 2�� 3 ) +�� ��(�� 2�� 3 )) ���� = �� 2(����(�� 4�� 3 ) +�� ��(�� 4�� 3 ))
Three phase fault
[22], [23] or their combination [24]. In this part, an approach for detecting and characterizing three types of voltage dips is presented. It is based on association of FFT and Lissajous curves.
6.1. Simulations results of free defects operation
{ ���� = �� 2(������ +�� ����) ���� = ���� 2 (����(�� 2�� 3 ) +�� ��(�� 2�� 3 )) ���� = ���� 2 (����(�� 4�� 3 ) +�� ��(�� 4�� 3 ))
Fault between two phases and the ground
Single phase fault
The shapes obtained from Lissajous curves are used to indicate the presence of a voltage dip and to distinguish the affected cases. The method to get Lissajous curves of three phase currents has been explained in detail in [11], [25]. Whereas the FFT enables a conversion of a signal from its original domain to a representation in the frequency domain. The FFT estimate the fundamental of the main supply frequency and present harmonic contents of one phase of stator current waveform which can be measured as total harmonic distortion (THD). The resulting spectrums offer a source of defects information.
ISSN: 1693 6930
Signature Equations Origin { ���� = ���� 2 (������ +�� ����) ���� = ���� 2 (����(�� 2�� 3 ) +�� ��(�� 2�� 3 )) ���� = ���� 2 (����(�� 4�� 3 ) +�� ��(�� 4�� 3 ))
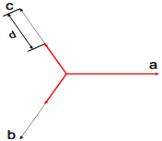
Figure 4(b) shows the curve of stator current spectrum in case of voltage dip of 50%. The peak’s amplitude at 50 Hz reaches 969.7. Instead of 0.5% found in healthy operation, the amplitude at 100 Hz has increased to 25% of the value of the fundamental. Two other important peaks appear at frequencies equal to 150 Hz and 200 Hz. Their amplitudes reach 12% and 8% of the fundamental value respectively. In addition, THD hugely increased from 7.73% in normal generator operating condition to 81.63% in generator failure.
b) Fault between two phases and the ground
In the case of voltage dip of 75% Figure 6(c), important peaks appear. The third order harmonic at 150 Hz has increased to 25% of the fundamental. The fifth order harmonics is also characterized by the presence of another peak at 250 Hz (five times the induction generator supply frequency). Its magnitude percentage, equal to that in frequency of 100 Hz, reaches 10% of the fundamental. Here the amplitude of the fundamental is 483.5 and the THD has increased to 234.31% instead of 93.62% found in previous case.
6.2. Simulations results of faulty operation
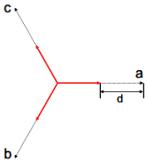
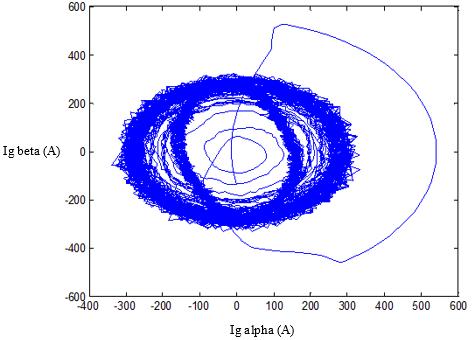
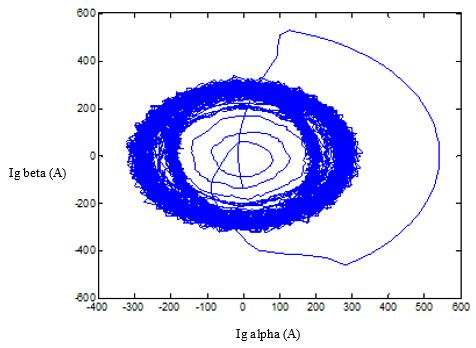
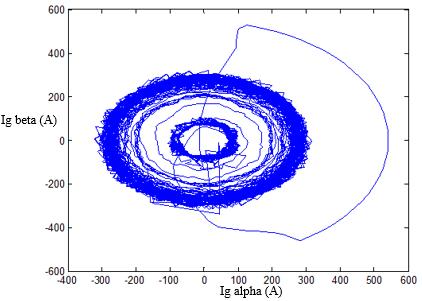
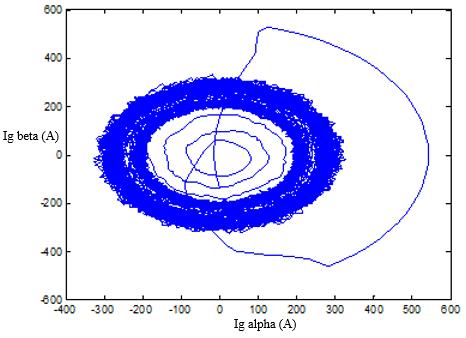
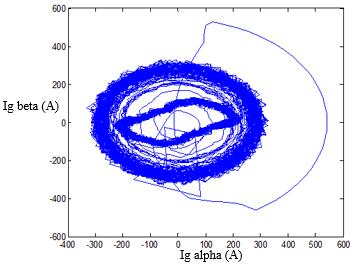
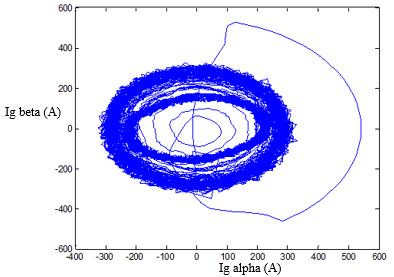
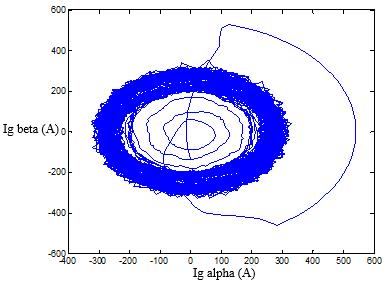
In the presence of this type of fault, as shown in Figure 3(a), Figure 3(b), and Figure 3(c), we notice the generation of a circle inside the main circular shape characterizing the Lissajous curves of the grid currents. The interior circle becomes an ellipse whose small axis diameter change according to the percentage of the applied single phase voltage dip. The smaller the single phase voltage dip percentage is, the larger is the axis diameter and the closer is the ellipse to the circular shape in the case of free defects operation.
In our simulation, we first started our system in free defects operation. Then we caused different types of voltage dips. Note that we have simulated, for each type of fault, three possible specific cases namely: voltage dip of 25%, 50%, and 75% of the nominal voltage. The voltage dip is created by modifying the parameters of the block called “three phase programmable voltage source”. Thus, we have programmed the percentage of the voltage dip provoked, its tripping time at �� = 1.5 s and the fault duration at 1 second.
Wind turbine doubly fed induction generator defects diagnosis under voltage dips (Sara Kharoubi)
In the presence of voltage dip of 50% Figure 6(b), the peak’s amplitude at 50 Hz reaches 762.3. The magnitude percentages at 200 Hz and 300 Hz had increased to 6% and 4% respectively. Two other important peaks appear at frequencies equal to 100 Hz and 150 Hz. Their amplitudes both reach 14% of the fundamental value. In addition, THD has hugely increased from 7.73% in healthy state to 93.62% in this faulty state case.
1163
In the presence of this type of fault, as shown in Figure 5, we notice the generation of a new shape inside the main circular shape characterizing the Lissajous curves of the grid currents. This generated shape changes depending on the percentage of the applied voltage dip. A voltage dip of 25% of nominal voltage in Figure 5(a) has, as a result, an interior circle with large diameter closer to the circular shape previously presented in the case of free defects operation. A voltage dip of 50% result, Figure 5(b), has the shape of an ellipse. In Figure 5(c), a 75% voltage dip result has the shape of a sharp eye sides.
Figure 6(a) shows the stator currents spectrum in case of voltage dip of 25%. It contains one peak at a frequency equal to 50 Hz the main supply frequency, its spectrum amplitude reaches 735.7. There are also two remarkable peaks appearing at 200 Hz and 300 Hz. Their amplitude equal 1.5% and 0.8% of the fundamental respectively. The THD increased from 7.73% (healthy state) to 13.9% in generator failure. Equal to that in frequency of 100 Hz, reaches 10% of the fundamental. Here the amplitude of the fundamental is 483.5 and the THD has increased to 234.31% instead of 93.62% found in previous case.
In case of a single phase voltage dip of 25% of the nominal voltage, Figure 4(a), the amplitude of the fundamental reaches 816.8 at 50 Hz, we note that in addition to the harmonics at frequencies equal to 100 Hz (case of healthy state), the appearance of new harmonics at 150 Hz (three times the induction generator supply frequency). Its amplitude equal 2%. This peak is surrounded by other peaks less important that have low amplitude. Here THD increased from 7.73% in healthy state to 9.43% in this faulty state case
c) Three phase fault
TELKOMNIKA Telecommun Comput El Control
a) Single phase fault
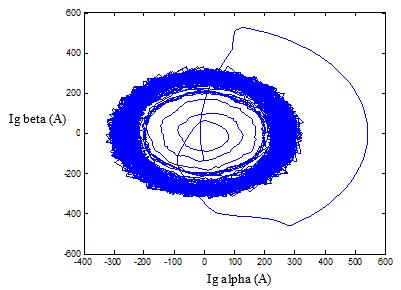
In case of presence of this type of fault, as shown in Figure 7, we notice the generation of a new circle inside the main circular shape characterizing the Lissajous curves of the grid currents. The diameter of this generated circle changes depending on the percentage of the applied fault. A voltage dip of 25% has, as result, a larger diameter circle, Figure 7(a), closer to the circular shape previously presented (healthy operation) A voltage dip of 50% of nominal voltage result, Figure 7(b), has a smaller diameter circle but bigger than the one in the case of a 75% voltage dip in Figure 7(c) which depict the smallest diameter.
In presence of single phase voltage dip of 75% of the nominal voltage, Figure 4(c), different important peaks appear, the second, the third and the fourth order harmonic had increased to 90%, 35%, and 36% of the fundamental respectively. Two other new peaks appear at frequencies equal to 250 Hz and 300 Hz. Their amplitudes reach 15% and 12% of the fundamental respectively. Here the amplitude of the fundamental is 517.9; the THD has increased to 209.9% instead of 81.63% found in previous case. Indeed, a higher THD means an increase in temperature at the level of the generator and the appearance of current peaks.
In presence of three phase voltage dip of 25%, Figure 8(a) the stator current spectrum contains one peak at 50 Hz, the doubly fed induction machine supply frequency. Its amplitude reaches 756.4. THD increased from 7.73% (healthy state) to 19.07% in generator failure.
(a) (b) (c)
Figure 8(b) shows the stator currents spectrum in case of voltage dip of 50%. We note decreasing in the main peak’s amplitude that reaches 625.8 at 50 Hz. New peaks appear at 100 Hz, 150 Hz, 200 Hz, and 250 Hz. Their magnitude percentage represents respectively 20%, 7%, 5%, and 3%. In addition, the harmonic distortion has hugely increased from 7.73% (normal operating) to 135.43% in generator failure.
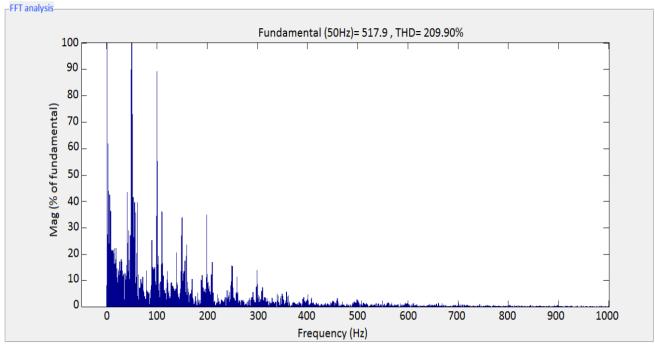
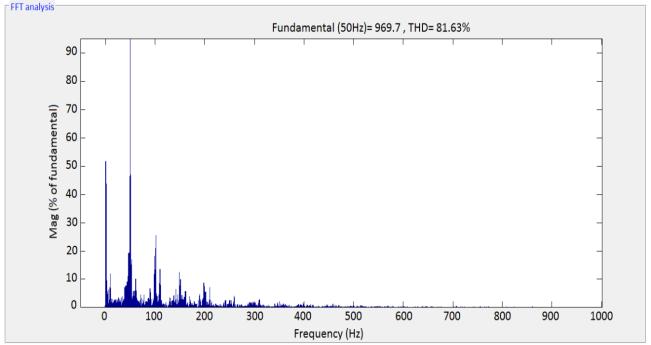
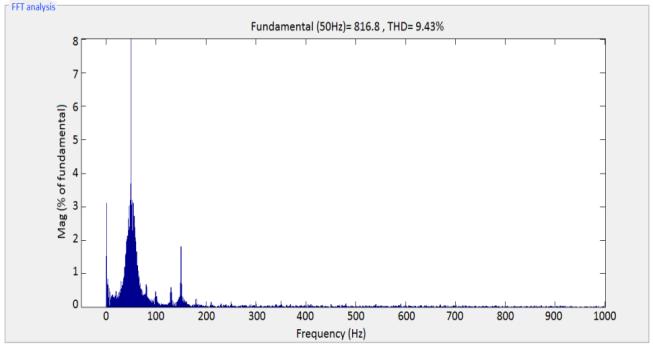
Figure 3. Lissajous curves of grid currents in the presence of a single phase voltage dip of (a) 25%, (b) 50%, and (c) 75% of the nominal voltage
(a) (b) (c)
Figure 4. FFT diagrams of stator current in the presence of a single phase voltage dip of (a) 25%, (b) 50%, and (c) 75% of the nominal voltage
In presence of a three phase voltage dip of 25% of nominal voltage, Figure 8(c), we note decreasing in the main peak’s amplitude that reaches 477.7 at 50 Hz different, also the second, the third and the fourth order harmonic had increased to 25% (100 Hz), 10% (150 Hz) and 10% (200 Hz) of the fundamental respectively. Here the THD has increased to 277.78% instead of 135.43% found in previous case.
ISSN: 1693 6930 TELKOMNIKA Telecommun Comput El Control, Vol. 20, No. 5, October 2022: 1159 1171 1164
(a) (b) (c)
1165
Figure 5. Lissajous curves of grid currents in the presence of three cases of fault between two phases and the ground (a) 25%, (b) 50%, and (c) 75%
Figure 6. FFT diagrams of stator current in the presence of three cases of fault between two phases and the ground (a) 25%, (b) 50%, and (c) 75%
Wind turbine doubly fed induction generator defects diagnosis under voltage dips (Sara Kharoubi)
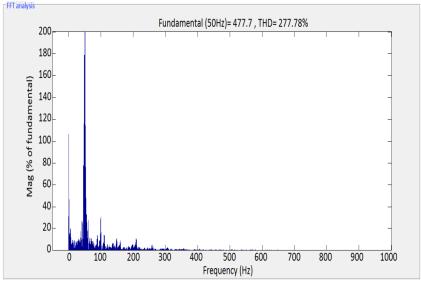
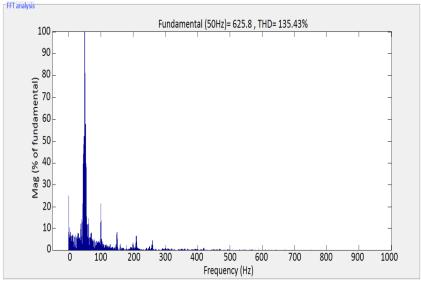
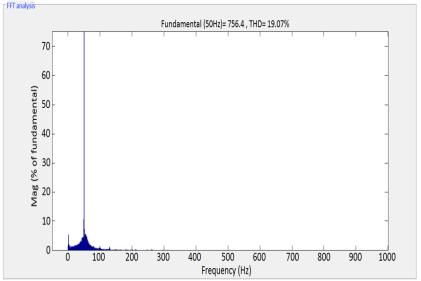
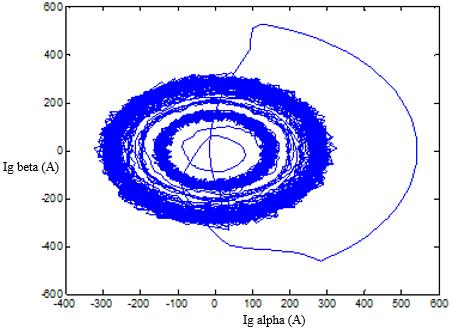
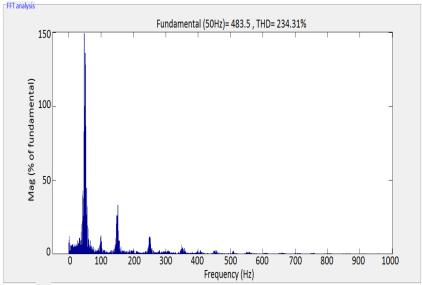
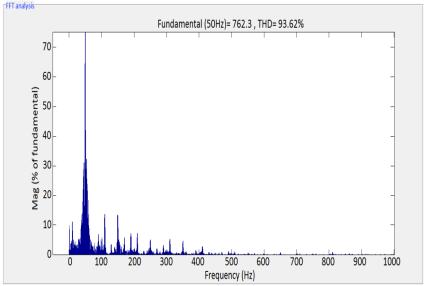
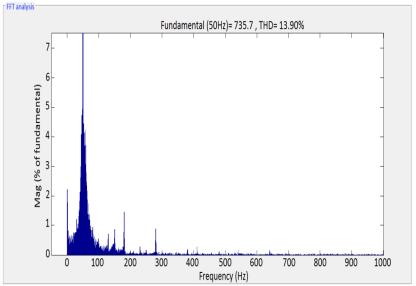
Figure 7. Lissajous curves of grid currents in the presence of three phase voltage dip of (a) 25%, (b) 50%, and (c) 75% of the nominal voltage
(a) (b) (c)
(a) (b) (c)
Figure 8. FFT diagrams of stator current in the presence of three phase voltage dip of (a) 25%, (b) 50%, and (c) 75% of the nominal voltage
TELKOMNIKA Telecommun Comput El Control
��
The discrete wavelet transform can approximate a signal successively with different scales. The discrete signal passes through n high pass filters and low pass filters in the time domain together with changes in sampling rates. Each step of the signal decomposition corresponds to a certain resolution. To each of the wavelet scales corresponds a frequency band [26] expressed by (11), where �� is the upper frequency limit of the frequency band represented by decomposition level ��, ���� is the sampling frequency, and 2�� is the data points number in the signal. These bands cannot be changed unless a new acquisition with different sampling frequency is performed. =2(�� ��)(���� 2��)
El Control,
TELKOMNIKA Telecommun
In order to avoid the loss of important information for fault detection analysis, the stator current was sampled at 4 kHz, i.e. 4000 samples/s, note that the supply frequency is 50 Hz, this gives us 600,000 samples obtained at a measured time of 3 s. The total decomposition levels (L) can be calculated according to (12). When (12) is applied at a sampling frequency of 4 kHz, an 8 level decomposition occurs. For a better performance analysis, we choose to decompose our signal to 10 levels as shown in Table 2
The DWT is an extension to short time Fourier transforms (STFT). It is considered as one of the powerful techniques in the fault diagnosis field. It provides time frequency representation of a stationary signal as well as non stationary signal with better time resolution than any other signal processing methods like the Fourier transform.
d6d5d4d3d2d1 [2000 4000] [1000 2000] [500.0 1000] [250.0 500.0] [125.0 250.0] [62.50 125.0]
7.2. Simulation results of free defects operation
For the extraction of defect components, after development of several tests, a great variety of wavelet families can give satisfying results. In our case study, we have used Daubechies 44 as the mother wavelet for the discrete wavelet transform analysis. It is also commonly employed as the mother function to avoid low level overlap with adjacent bands. A higher wavelet order introduces better signal accuracy.
As shown in Figure 9, the upper level signal a10 (approximation) reproduces the analyzed stator current. Signals a10, d10 and d9 (details) do not show any significant variation, apart from the initial oscillations that last only few cycles. Therefore, the harmonic associated with voltage dips is not present in this situation. This healthy state case is a reference to which the faulty cases will be compared to.
ISSN: 1693 6930 Comput Vol. 20, No. 5, October 2022:
(11)
7. The Discrete Wavelet Transform
[31.25 62.50] [15.62 31.25] [7.81 15.62] [3.90 7.81] [0.0 3.90]
Figure 9. the DWT of the stator current in free defects operation
The proposed method has shown its effectiveness in several fields like diagnostic of mechanical faults [27], [28] as well as electrical faults [29] [31] attacking induction machines. With its ability to more coarsely discretized scales, DWT has proven efficient in compressing and denoising signals and images [32], [33] while preserving important features. Discrete wavelet transforms can be used also to perform multiresolution analysis and split signals into physically meaningful and interpretable components [34], [35].
Table 2. Frequency levels of wavelet coefficients Level Frequency bands (Hz) Level Frequency bands (Hz)
7.1. Application of the DWT
d10d9d8d7a10
�� ≥ ������(���� ��) ������(2) +1 (12)
1159 1171 1166
7.3. Simulation results of faulty operation
Wind turbine doubly fed induction generator defects diagnosis under voltage dips (Sara Kharoubi)
(b)(a)(c)
TELKOMNIKA Telecommun Comput El Control
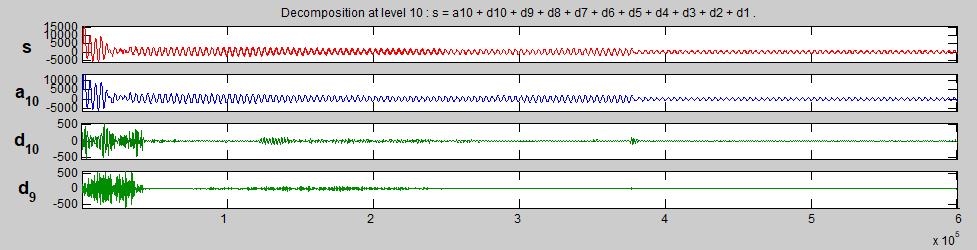
In presence of a single phase voltage dip of 25% of the nominal voltage, as shown in Figure 10(a), a significant increase, if compared with the free defects operation, appears in the energy of the upper level signal d10 (detail) after 3×10⁵ samples corresponding to �� = 1.5 seconds, which is exactly the tripping time chosen for the voltage dip. Its amplitude varies between 50 and 100 and lasts from 1.5 s to 2.5 s, with appearance of one peak at �� = 1.8 s of an amplitude of 200. The oscillations in this detail signal are due to the evolution of the fault frequency component. These oscillations follow a sequence which is a function of the fault frequency evolution on FFT based method.
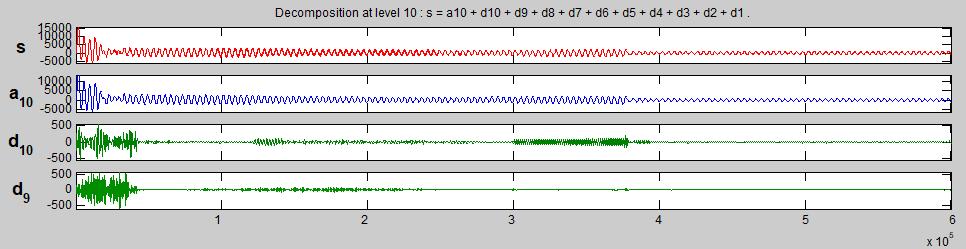
One phase of stator current is used as the input to the wavelet circuit. Note that we have already specified the fault tripping time at �� = 1.5 s and its duration at 1 second. The percentage of the voltage dip caused was limited to three cases of 25%, 50%, and 75% of the nominal voltage.
a) Single phase fault
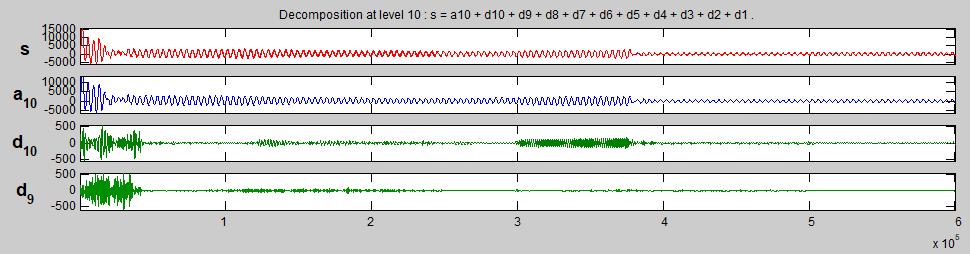
Figure 10. The DWT of the stator current in case of single phase voltage dip of (a) 25%, (b) 50% and (c) 75%
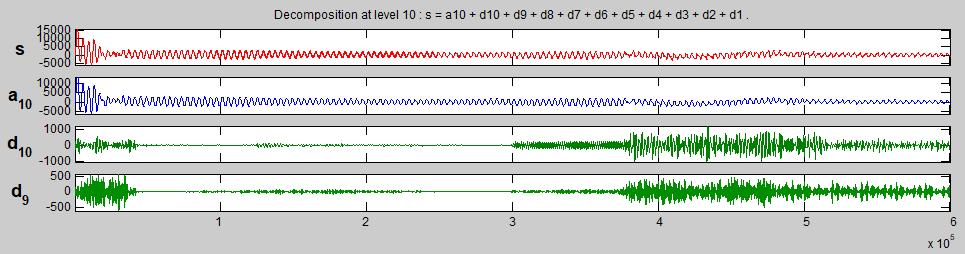
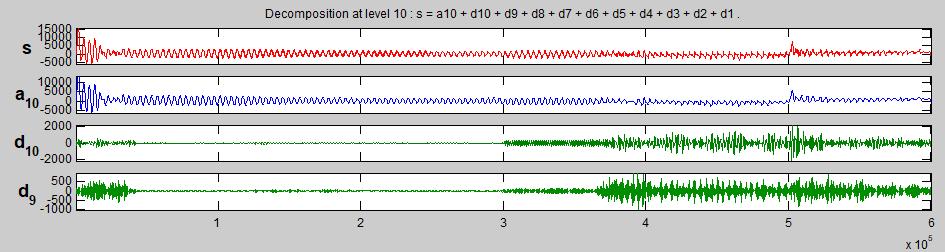
Figure 10(b) shows the DWT results in presence of single phase voltage dip of 50%. Significant variations appear in the energy of the upper level signal a10 (approximation) from �� = 1.5 s to �� = 2.5 s with an amplitude varying between 500 and 2000. More oscillations are detected at details d10 starting from �� = 1.5 s with an amplitude of 200 until �� = 1.8 s where the oscillation amplitude increase to 700 and keep varying between 500 and 700 until �� = 2.5 s. The detail signal d9 also displays two multiple variations. From �� = 1.5 s to �� = 1.8 s, the amplitude attends 50. At �� = 1.8 s these oscillations increase and vary between 200 and 400 until �� = 3Ins.case of single phase voltage dip of 75%, Figure 10(c), oscillations can be noticed from �� = 1.5 s in all approximation and details signals. At a10, oscillations vary in amplitude between 1000 and 2000 and lasts until �� = 2.5 s where they represent a peak of 5000 in the energy. Details d10 and d9 present the same variation and have different amplitude and width starting at �� = 1.5 s with an amplitude of 250 and 150 respectively. From �� = 1.8 s to �� = 3 s, variations vary between an amplitude of 700 and 1500 at d10 and between 300 and 600 at d9. From this, it can be concluded that the information provided by the DWT method can complement that given by the classical approach, based on FFT analysis, to reach a more accurate detection (time).
1167
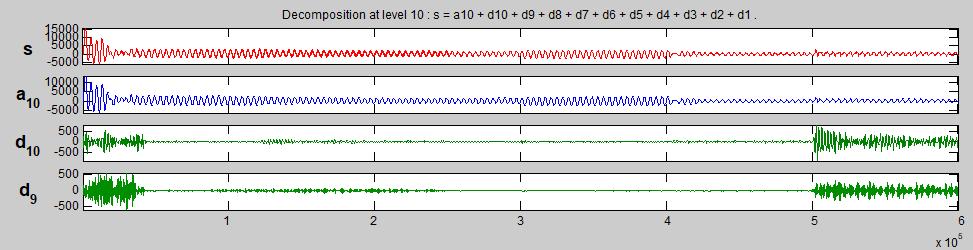
between two phases and the ground
TELKOMNIKA Telecommun Comput El Control, Vol. 20, No. 5, October
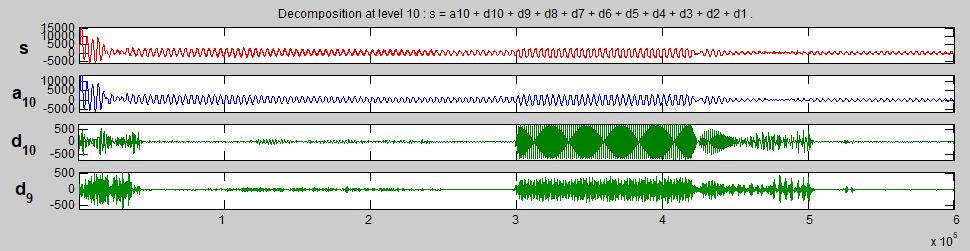
Figure 11. The DWT analysis of the DFIG stator current in presence of voltage dip of (a) 25%, (b) 50%, and (c) 75%
ISSN: 1693 6930 2022:
1159 1171 1168b)Fault
(b)(a)(c)
Upon the occurrence of a voltage dip of 50%, Figure 11(b), the variations in the DWT coefficients become higher than what they were prior to this incident. The tenth approximation, a10, corresponding to the low frequency components below 50 Hz, shows a meaningful variation following the fault, its energy attends an amplitude of 2500 from 1.5 s to 2 s, and an amplitude of 1000 from 2 s to 2.5 s, the total period of variation is the exact voltage dip duration. Two multiple oscillations appear in detail d10, the first starts at 1.5 s until 1.8 s with amplitude of 300 and the second from 2.2 s until 2.5 s with amplitude varying between 400 and 600. The detail d9 also represent two different oscillations, the first one from 1.5 s to 2 s with amplitude varying between 50 and 100, and the second one from 2 s to 2.5 s with amplitude between 200 and 300.
The Figure 11 display DWT results of stator one phase current during this faulty operation. In the case of voltage dip of 25%, Figure 11(a), the upper order wavelet signal d10 (detail) resulting from the DWT analysis show a clear increase in its energy with respect to the free defects operation. In addition, its oscillations which start at �� = 1.5 s and lasts to 2 s with an amplitude varying between 100 and 150, fit well with the fault frequency evolution described above
The peak variations after voltage dip of 75%, Figure 11(c), are clearly seen in the tenth approximation signal which corresponds to amplitude of 300 from 1.5 s to 2.3 s. Much higher variations, representing the high energy content of the current signal, can be seen in detail d10 with amplitude of 650 from 1.5 s to 2.3 s and amplitude between 250 and 400 until 2.5 s. The detail d9 also displays one large oscillation varying between 200 and 400 and lasting from 1.5 s to 2.5 s (the exact voltage dip time duration).
Wind turbine doubly fed induction generator defects diagnosis under voltage dips (Sara Kharoubi)
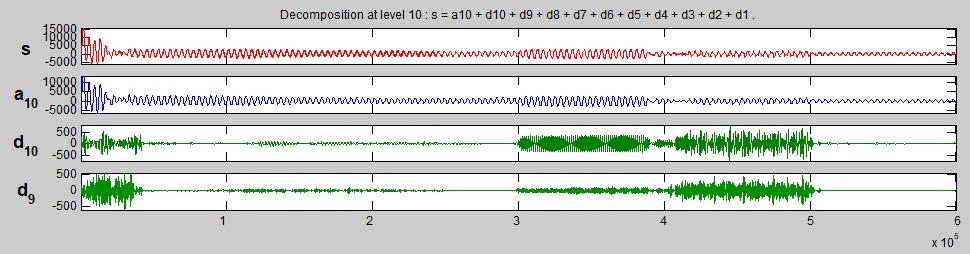
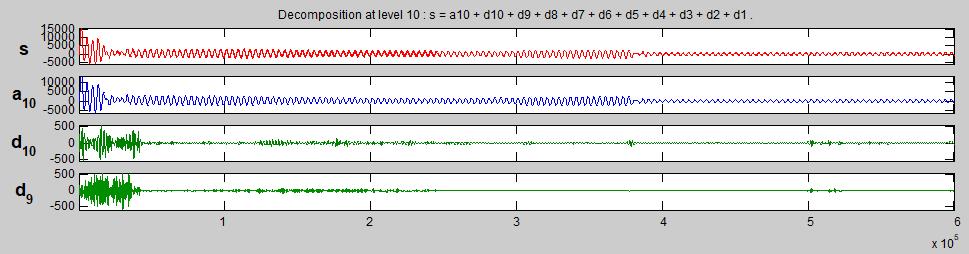
The Figure 12(b) shows the DWT results in presence of three phase voltage dip of 50%. The upper level signal a10 (approximation) presents the same variation with an amplitude of 2000 but has different width starting from �� = 1.5 s until �� = 2.2 s. More oscillations are detected at details d10 and d9 starting from �� = 2.5 s with an amplitude varying between 200 and 700 and between 100 and 300 respectively.
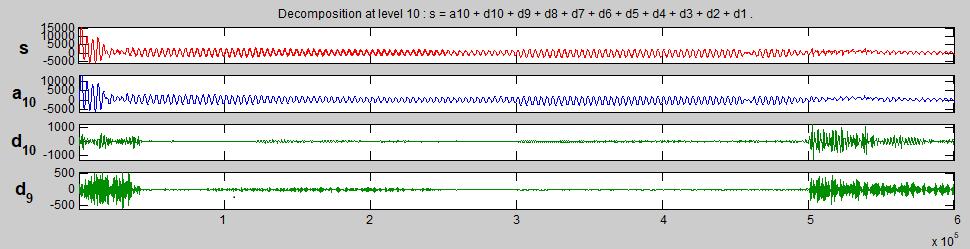
Figure 12. The DWT analysis of the DFIG stator current in presence of voltage dip of (a) 25%, (b) 50%, and (c) 75%
In case of three phase voltage dip of 75%, Figure 12(c), much higher variations, representing the high energy content of the current signal, can be seen in the upper order wavelet signal d10 and d9 (details) with an amplitude between 1500 and 500 respectively and lasting from 2.5 s until 3 s. Moreover, the tenth approximation a10, corresponding to the low frequency components below 50 Hz, shows the largest variation from �� = 1.5 s until �� = 2.5 s with an amplitude of 2000 as detected previously.
Figure 12 show simulations results of DWT analysis during this faulty operation. In presence of a three phase voltage dip of 25% of the nominal voltage, as depicted in Figure 12(a), significant variations appear in the energy of the tenth approximation a10 from 3×10⁵ to 4×10⁵ samples corresponding to the time interval (1.5 s, 1.8 s), their amplitude attends 2000. Multiple peaks appear in the energy of the upper level signals d10 and d9 from �� = 2.5 s to �� = 3 s. Their amplitudes vary from 50 to 100 and 40 to 70 respectively.
(b)(a)(c)
TELKOMNIKA Telecommun Comput El Control
1169
c) Three phase fault
[5] Z. Rafiee, M. Rafiee, and M. R. Aghamohammadi, “The voltage dip and doubly fed induction generator with considering uncertainty conditions,” Bulletin of Electrical Engineering and Informatics, vol. 9, no. 1, pp. 30 38, 2020, doi: 10.11591/eei.v9i1.1669.
REFERENCES
[10] L. J. Awalin, Tasnim, T. L. Tien, and H. Suyono, “Comparison study of fault location on distribution network using PSCAD and DIgSILENT power factory by using matching approaches,” Indonesian Journal of Electrical Engineering and Computer Science, vol. 17, no. 1, pp. 78 85, Jan. 2020, doi: 10.11591/ijeecs.v17.i1.pp78 85.
[13] A. Menacer, M S. N Said, A/H. Benakcha, and S. Drid, “Stator Current Analysis of Incipient Fault Into Asynchronous Motor Rotor Bars Using Fourier Fast Transform,” Journal of Electrical Engineering, vol. 55, no. 5 6, pp. 122 130, 2004. [Online]. Available: http://iris.elf.stuba.sk/JEEEC/data/pdf/05 06_104 02.pdf
[16] L. D. Ndoumbe, S. Eke, C. H. Kom, A. T. Yeremou, A. Nanfak, and G. M. Ngaleu, “Power Quality Problems, Signature Method for Voltage Dips and Swells Detection, Classification and Characterization,” European Journal of Electrical Engineering, vol. 23, no. 3, pp. 185 195, Jun 2021, doi: 10.18280/ejee.230303
[11] S. Kharoubi and L. El Menzhi, “Wind turbine doubly fed induction generator defects diagnosis using rotor currents Lissajous curves,” International Journal of Power Electronics and Drive Systems (IJPEDS), vol. 11, no. 4, pp. 2083 2090, 2020, doi: 10.11591/ijpeds.v11.i4.pp2083 2090
[14] L. Leclercq, “Contribution of inertial storage associated with wind turbines in an electrical grid in order to provide system services,” (in French), Doctoral thesis, Central School of Lille, 2004. [Online]. Available: https://www.osti.gov/etdeweb/servlets/purl/20885965
[1] C. D. Pham, “Detection and Location of Faults in HV Distribution Networks in the Presence of Dispersed Energy Generation,” (in French), doctoral thesis, Electric Energy, National Polytechnic Institute of Grenoble INPG, French, 2005. [Online]. Available: https://tel.archives ouvertes.fr/tel 00164643/document
[8] A. Loulijat, N. Ababssi, and M. Makhad, “DFIG use with combined strategy in case of failure of wind farm,” International Journal of Electrical and Computer Engineering, vol. 10, no. 3, 2020, doi: 10.11591/ijece.v10i3.pp2221 2234.
[3] L. Peng, “Reconfiguration of a wind turbine control device in the prensence of a voltage dip,” (in French), doctoral thesis, The L2EP laboratory at the central school of Lille and the electrical engineering department of Tsinghua University, French, 2010 [Online]. Available: https://tel.archives ouvertes.fr/tel 00584153/document
[15] H. Abu rub, M. Malinowski, and K. Al Haddad, Power electronics for Renewable Energy Systems, Transportation and Industrial Applications, IEEE, May 2014 by John Wiley & Sons, Ltd. doi: 10.1002/9781118755525
[7] A. M. S. Yunus, M. Saini, and A. Abu Siada, “Dynamic performance comparison of DFIG and FCWECS during grid faults,” TELKOMNIKA Telecommunication, Computing, Electronics and Control, vol. 17, no. 2, pp. 1040 1046, 2019, doi: 10.12928/telkomnika.v17i2.11747.
[17] S. Hicham, “Contribution to the Robust Control of the Brushless Asynchronous Machine with Dual Feeds,” (in French), Thesis in view of obtaining a doctorate in Sciences in Electro technique, Department of Electrical Engineering, Mohamed Khider University Biskra, Algeria, 2016. [Online]. Available: http://archives.univ biskra.dz/handle/123456789/7618
[18] B. Gattal, K. Chikhi and C. Fetha, “Improving Electrical Power Quality: Identifying Voltage Dips,” (in French), Journal of Renewable Energies, vol. 17, no. 4, pp 651 661, 2014. [Online]. Available: https://www.cder.dz/vlib/revue/pdf/v017_n4_texte_14.pdf
8. CONCLUSION
ISSN: 1693 6930
1170
[2] V. Ignatova, “Electrical power quality analysis methods. Application to voltage sags and harmonic pollution,” (in French), doctoral thesis, Electric Energy, Joseph Fourier University Grenoble I, French, 2006. [Online]. Available: https://tel.archives ouvertes.fr/tel 00170713/document
In the first part of this paper, we studied the operating mode of the wind energy conversion system namely the variable speed turbine model and the doubly fed induction generator model. In the second part, two approaches were proposed to identify and analyze three types of voltage dips, namely the three phase fault, the single phase fault and a fault between two phases and the ground. The first approach was based on the combination of Lissajous curves of grid currents and FFT analysis of stator current. The second approach was based on DWT analysis of stator current. The shapes obtained from Lissajous curves are used to indicate the presence of voltage dip and to distinguish defect cases. Whereas the peaks amplitude and the THD indicator revealed by FFT analysis, give a means of indicating the fault severity affecting the wind energy chain. Nevertheless, in both methods it is impossible to estimate the time of the fault occurrence neither its duration. Hence, the introducing of the discrete wavelet method in the detection of voltage dips at the stator current shows clearly, according to the tests results, that the discrete wavelet provides a clear indication about the defect severity, its tripping time and its duration. Also, the use of wavelet signals resulting from the DWT constitutes an interesting advantage because these signals act as filters and are based on the band pass filtering carried out by the DWT, enabling the extraction of the harmonic components caused by the voltage dip. These patterns allow discrimination between defects across the different waveforms appearing in the wavelet signals.
[6] L. D. Zhang and M. H. J. Bollen, “A method for characterizing unbalanced voltage dips (sags) with symmetrical components,” IEEE Power Engineering Review, vol. 18, no 7, pp. 50 52, 1998, doi: 10.1109/MPER.1998.686958
[4] G. Abad, J. Lopez, M. Rodriguez, L. Marroyo, and G. Iwanski, Doubly Fed Induction Machine Modeling and Control for Wind Energy Generation, New Jersey, John Wiley and Sons, Hoboke: IEEE Press, 625 Pages. Nov. 2011. [Online]. Available: https://www.wiley.com/en us/Doubly+Fed+Induction+Machine%3A+Modeling+and+Control+for+Wind+Energy+Generation+ p 9780470768655
[12] O. Gergaud, B. Multon, and H. B. Ahmed, “Modeling of a low power wind conversion chain,” (in French), Electrical engineering of the future, NANCY, France, pp. 17 22, Nov 2001, [Online]. Available: https://hal.archives ouvertes.fr/hal 00674086/document
TELKOMNIKA Telecommun Comput El Control, Vol. 20, No. 5, October 2022: 1159 1171
[9] S. Eke and A. M. Imano, “Algorithm for exhaustive classification of voltage dips: Combination of methods of the six voltages and the symmetrical components,” (in French), in ELECTRICAL ENGINEERING SYMPOSIUM (SGE'14): EF EPF MGE 2014, 2014. [Online]. Available : https://hal.archives ouvertes.fr/hal 01065258/file/Moukengue2_SGE2014.pdf
[20] F. Zidani, M. E. H. Benbouzid, D. Diallo, and M. S. N Said, “Induction motor stator faults diagnosis by a current Concordia pattern based fuzzy decision system,” IEEE Transactions on Energy Conversion, vol. 18, no. 4, pp. 469 475, 2003, doi: 10.1109/TEC.2003.815832.
[25] S. Kharoubi and L. El Menzhi, “Diagnosing multiple short circuit switches faults in wind turbine Doubly fed induction generator,” International Journal of Power Electronics and Drive Systems (IJPEDS), vol. 13, no. 1, pp. 547 553, 2022, doi: 10.11591/ijpeds.v13.i1.pp547 553.
[34] J. Jinju, N. Santhi, K. Ramar, and B. S. Bama, “Spatial frequency discrete wavelet transform image fusion technique for remote sensing applications,” Engineering Science and Technology, an International Journal, vol. 22, no. 3, pp. 715 726, 2019, doi: 10.1016/j.jestch.2019.01.004.
[21] B. Asad, T. Vaimann, A. Kallaste, and A. Belahcen, “Harmonic Spectrum Analysis of Induction Motor With Broken Rotor Bar Fault,” 2018 IEEE 59th International Scientific Conference on Power and Electrical Engineering of Riga Technical University (RTUCON), 2018, pp. 1 7, doi: 10.1109/RTUCON.2018.8659842
[33] K. Bnou, S. Raghay, and A. Hakim, “A wavelet denoising approach based on unsupervised learning model,” EURASIP Journal on Advance Signal Processing, 2020, doi: 10.1186/s13634 020 00693 4.

TELKOMNIKA Telecommun Comput El Control
[27] A. K. Sinha, S. Das, and T. K. Chatterjee, “Wavelet Transform Based Ball Bearing Fault Detection Scheme for Heavy Duty Mining Electrical Motors under Supply Frequency Regulation using MCSA,” International Journal of Technology (IJTech), vol. 9, no. 1, 2018, doi: 10.14716/ijtech.v9i1.1507
[22] H. Malik and S. Mishra, “FAST and Simulink based simulation investigation of wind turbine faults,” International Journal of Renewable Energy Technology, vol. 8, no. 3 4, pp 286 304, Jan. 2018, doi: 10.1504/IJRET.2017.088970.
1171
[23] L. El Menzhi and A. Saad, “Induction Motor Fault Diagnosis Using Voltage Spectrum of Auxiliary Winding and Lissajous Curve of its Park Components,” Advanced Materials Research, vol 805 806, pp. 963 979, 2013, doi: 10.4028/www.scientific.net/AMR.805 806.963
[28] R. N. Toma and J. M. Kim, “Bearing Fault Classification of Induction Motors Using Discrete Wavelet Transform and Ensemble Machine Learning Algorithms,” Applied Sciences, vol. 10, no. 15, P. 5251, 2020, doi: 10.3390/app10155251
[30] R. Kechida, A. Menacer, H. Talhaoui, and H. Cherif, “Discrete wavelet transform for stator fault detection in induction motors,” 2015 IEEE 10th International Symposium on Diagnostics for Electrical Machines, Power Electronics and Drives (SDEMPED), 2015, pp. 104 109, doi: 10.1109/DEMPED.2015.7303676.

[32] R. Starosolski, “Hybrid Adaptive Lossless Image Compression Based on Discrete Wavelet Transform,” Entropy, vol. 22, no. 7, 2020, doi: 10.3390/e22070751.
[35] R. Ashraf et.al., “Content Based Image Retrieval by Using Color Descriptor and Discrete Wavelet Transform,” Journal of Medical System, no. 44, 2018, doi: 10.1007/s10916 017 0880 7
Sara Kharoubi was born in Morocco on September 9th, 1991. In 2015, She received the Engineer degree in Mechatronic Engineering from the National School of Applied Sciences (ENSA) in Abdelmalek Essaadi University of Morocco in Tetouan. She is a PhD student in electrical engineering at Innovative Technologies Laboratory (LTI) of ENSA Tangier since December 2016. She is interested in electrical machines control, on line diagnosis defects in wind turbines, and their integration in grid. She can be contacted at email: sara.kharoubi@gmail.com

[19] S. M. Shashidhara and P. S. Raju, “Stator winding fault diagnosis of three phase induction motor by Park's Vector Approach,” International Journal of Advanced Research in Electrical, Electronics and Instrumentation Engineering, vol. 2, no. 7, 2013. [Online]. Available: https://www.ijareeie.com/upload/2013/july/10_STATOR.pdf
[29] I. B. Imaz, H. D. Ardakani, Z. Liu, A. G Arribas, A. Arnaiz, and J. Lee, “Motor current signature analysis for gearbox condition monitoring under transient speeds using wavelet analysis and dual level time synchronous averaging,” Mechanical Systems and Signal Processing, vol. 94, pp. 73 84, 2017, doi: 10.1016/j.ymssp.2017.02.011.
[26] R. Kechida, A. Menacer, and H. Talhaoui, “Approach Signal for Rotor Fault Detection in Induction Motors,” Journal of Failure Analysis and Prevention, vol. 13, pp. 346 352, 2013, doi: 10.1007/s11668 013 9681 6.

[24] F. E. Hammouchi, L. El Menzhi, and A. Saad, “DFIG Defects Diagnosis Method for Wind Energy Conversion Chain”, Advances in Science, Technology and Engineering Systems Journal, vol. 4, No. 5, pp. 174 185, 2019, doi: 10.25046/aj040523
Lamiaa El Menzhi is a professor in Abdelamalek Essaadi University in Morocco since 2010. On 2002, She got her High Deepened Studies Diploma in electrical machines in electrical engineering from the High National School of Electricity and Mechanics ENSEM in Hassan 2 University in Casablanca. From 2002 until 2004, she was a research student in one of the universities in japan. On 2009, she obtained her doctor degree, then her Habilitation as a professor researcher on 2016 from Hassan 2 University in Casablanca. She is interested in electrical machines control and on line diagnosis either used as a motor or a generator in wind turbines. Lamiaa El Menzhi is a member and advisor of the Moroccan Center of Polytechnical Research and Innovation since 2015. She can be contacted at email: lamdockit@yahoo.com
BIOGRAPHIES OF AUTHORS
[31] H. Cherif, A. Menacer, R. Romary, and R. Pusca, “Dispersion field analysis using discrete wavelet transform for inter turn stator fault detection in induction motors,” 2017 IEEE 11th International Symposium on Diagnostics for Electrical Machines, Power Electronics and Drives (SDEMPED), 2017, pp. 104 109, doi: 10.1109/DEMPED.2017.8062341
Wind turbine doubly fed induction generator defects diagnosis under voltage dips (Sara Kharoubi)