Article history:
Corresponding Author:
Email: radi tep@ugm.ac.id
This is an open access article under the CC BY SA license.

Revised Jun 24, 2022
TELKOMNIKA Telecommunication Computing Electronics and Control Vol. 20, No. 5, October 2022, pp. 1146~1158
1. INTRODUCTION
Accepted Jul 05, 2022
Radi, Joko Purwo Leksono Yuroto Putro, Muhammad Danu Adhityamurti, Barokah, Luthfi Fadillah Zamzami, Andi Setiawan
Journal homepage: http://telkomnika.uad.ac.id
Performance of electronic nose based on gas sensor-partition column for synthetic flavor classification
DepartmentRadi of Agricultural and Biosystems Engineering, Faculty of Agricultural Technology Universitas Gadjah Mada, Jl. Flora no. 1, Bulaksumur, Yogyakarta, Indonesia 55281
Keywords: SyntheticPartitionGasElectronicClassificationnosesensorcolumnflavor
Electronic nose (e nose) has been developed and implemented in a wide area, included in food industries. This study was conducted to investigate the performance of an e nose that utilizes a packed gas chromatography column and a gas sensor for classification of synthetic flavor products. There were six aroma variants of synthetic flavor evaluated, namely durian, jackfruit, ambonese banana, melon, orange and lemon. The e nose was designed with four main parts, namely aroma provider, column and detector room, microcontroller, and data acquisition system. The device was operated automatically at a stable temperature of 60 °C. Collected data consisted of ten data of each sample was preprocessed by baseline equalization and normalization, extracted its distinctive feature and then were analyzed through pattern recognition analysis. There were two kinds of methods used to analyzed the patterns of the data, namely a fuzzy c means clustering and an artificial neural network (ANN). With the fuzzy c means clustering, the result was six data clusters with an unbalanced number of members, indicated that this analysis could not classify samples properly. Meanwhile, analysis with the ANN could classify properly the samples with the level of accuracy of 70%.
The quality of food and beverage products can be assessed based on various parameters such as appearance, taste, aroma, packaging, and price. For some products, aroma plays an important role in determining its quality. Aroma is produced by the content of volatile substances of the products. Aroma can be recognized by humans through their olfactory system. The volatile substances of the products are carried by the air inhaled by humans, enter the nasal cavity, received by olfactory receptors and then transmitted as a chemical signal to the brain, inside it, the signal is translated into a recognizable aroma [1]. The ability of the human nose to recognize aroma has been widely used to assess the quality of food and beverage products, especially products that have a distinctive aroma, such as: food, coffee and tea, which is referred as sensory test. Sensory test in the food and beverage industry is carried out by presenting several experts as panelists. Sadly, there are several shortages of this method that can be identified, including high costs, time consuming, varying between panelists, labor intensive and prone to errors, considering that panelists assessments can be affected by various things such as health and emotional condition of the panelists [2] [4].
Article Info ABSTRACT
ISSN: 1693 6930, DOI: 10.12928/TELKOMNIKA.v20i5 22358 1146
Received Dec 04, 2021
Department of Agricultural and Biosystems Engineering, Faculty of Agricultural Technology, Universitas Gadjah Mada, Yogyakarta, Indonesia
Recent studies reported a good performance of an e nose equipped by a gas chromatography column on a single compound evaluation [19], [21], meanwhile, other studies found out that this design could classify natural ingredients, such as fruit [3] and whisky [20]. For now, implementation of this design for synthetic ingredients, such as synthetic flavor, are seldom investigated. Flavor is one of additive ingredients that is usually mixed in food processing in order to provide a specific taste, aroma and texture. Based on its ingredient, there are two types of flavors namely natural flavor and synthetic flavor. Radi et al [22] reported that classification of synthetic flavor aroma can be done by using an e nose that consists of a series of gas sensors. This result shows that there is a potential of e nose implementation in the processing of synthetic flavor. Therefore, this study was carried out to evaluate the performance of an e nose prototipe constructed with a combination of a gas chromatography column and a metal oxide semiconductor gas sensor for synthetic flavor classification.
Telecommun Comput El Control
2.1. Sample
Samples of this study were synthetic flavors with six variants of aroma, namely durian, jackfruit, ambonese banana, melon, orange and lemon. All of them have a same trademark. These variants were chosen randomly from several aroma variations that are produced by the trademark in question. Composition of each flavor variant are listed in Table 1.
Table 1. Samples composition Ingredients Flavors Durian Jackfruit Ambonese banana Melon Orange Lemon Glucose syrup ✔ ✔ ✔ ✔ ✔ ✔ Natural sorbitolsweetener ✔ ✔ ✔ ✔ ✔ ✔ stabilizerVegetable ✔ ✔ ✔ �� ✔ ✔ Propylene glycol carrier ✔ ✔ ✔ ✔ ✔ ✔ Synthetic vanilla flavor ✔ ✔ ✔ ✔ ✔ ✔ Synthetic coloring ✔ ✔ ✔ ✔ ✔ ✔ Ethyl maltol ✔ ✔ ✔ ✔ ✔ ✔ ingredientsAdditional durianSyntheticflavor jackfruitSyntheticflavor amboneseSyntheticflavor melonSyntheticflavor orangeNaturalflavor lemonSyntheticflavor Isoamyl acetate Syntheticflavormilk Ethyl acetate
Standardized methods of aroma assessment should be applied to overcome the shortages of sensory tests, one of them is by using an electronic nose (e nose). E nose is a kind of device that is developed with the working principle for imitating the human nose. Today, the device of an e nose has been widely developed and investigated for various food industry activities, such as quality control [5], [6], fruit [3], tea [7] [9], and coffee [10] aroma classification, meat [11] [13] and fish [14], [15] degree of freshness identification, and also used for many medical purposes [16], [17]. E nose has been developed with various types of design and technology, but in general, the e nose consists of a series of hardware and software that can capture, shape and recognize the aroma of a substance. Most of e nose constructed by a gas sensor array in order to substitute the function of the human olfactory receptor. The gas sensor is highly favored due to its ability to produce a change in resistance when the sensor is exposed to certain compounds. The type of gas sensor that is often used is the metal oxide semiconductor (MOS) sensor, such as the Taguchi gas sensor (TGS), because it is relatively easy and simple to use. Some other types of gas sensors used in electronic nose are quartz crystal microbalance [7], [18], surface acoustic wave [19] and flame ionization detectors [20]. Another type of an e nose is constructed by combining a gas chromatography column or gas partition column with a gas detector. The new model of the e nose is inspired by the advances in food analysis that are trusted today with the use of gas chromatographic (partition column) analysis. The partition column in this device is used to substitute the sensor array in profiling of samples. By applying the column, profiling of sample can be obtained from a single detector. Therefore, the type of e nose usually only applied a single gas sensor instead of a series of sensors. The utilization of a gas chromatographic column for developing an e nose technology has been reported in [3], [18] [21]. This variation of e nose works on the principle of compound separation.
2. METHOD
TELKOMNIKA
Performance of electronic nose based on gas sensor partition column for … (Radi)
1147
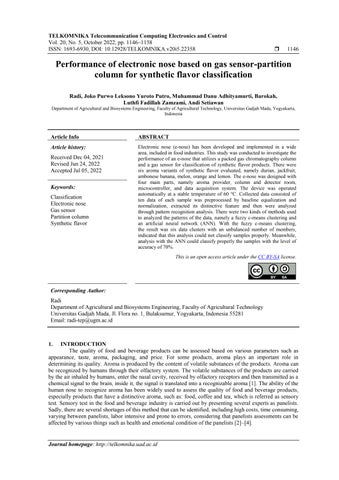
Figure 1. Design of the electronic nose: (a) schematic design and (b) picture of electronic nose
TELKOMNIKA
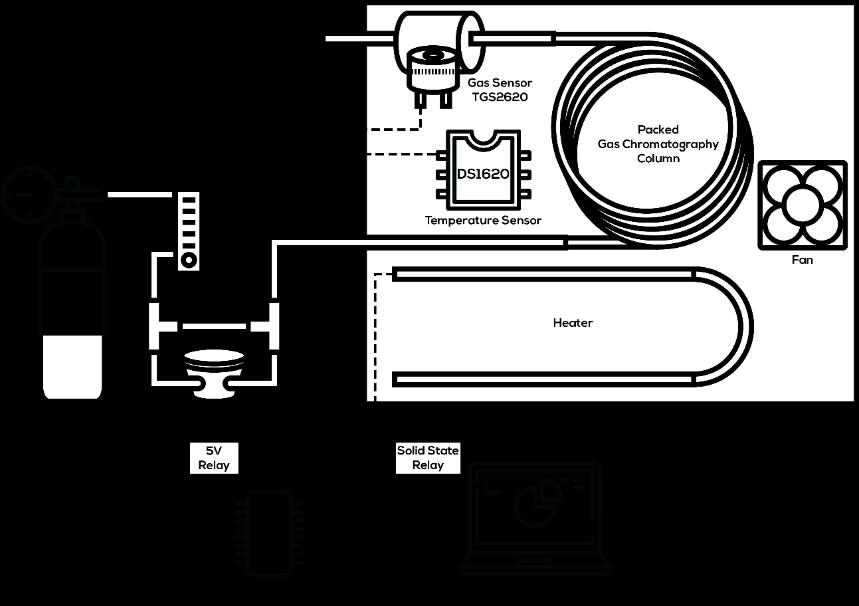
The sample handling and delivery system consisted of a sample vial, two 3 way solenoid valves, a flow meter and an oxygen tank equipped with an oxygen regulator. Oxygen was chosen as the carrier gas to carry aroma of the sample from the sample vial to the chromatography column and sensor. Oxygen was selected to replace the environmental air which was used in [3], in order to minimize the possibility of another substance presence from the air in the aroma mixture that allows the emergence of inaccurate observations. The addition of a flow meter was used to regulate and observe the flow rate of oxygen gas during the data collection process. The sample vial was made of 2 mm thick metal consisting of a lid and a container. It was also equipped with 4 locks and 2 turning pneumatic fittings for a 4 mm outer diameter hose. The chromatography column and gas sensor were housed in a metal chamber with a thickness of 3 mm. The room was equipped with a heater, a DS1620 temperature sensor and a fan that had a function of keeping the room temperature constant during the data collection process at predetermined settings. The gas sensor was selected due to its high sensitivity to vapors of organic substances. In addition, the gas sensor requires only a relatively small operating current. The relationship between sensor resistance and gas concentration is linear on a logarithmic scale, ranging from a few ppm to several thousand ppm [9].
2.2. Electronic nose design
1148
ISSN: 1693 6930 Telecommun Comput El Control, Vol. 20, No. 5, October 2022: 1146 1158
(b)(a)
This study was carried out by using an e nose that was previously designed and used in [3]. The e nose was equipped with the same packed gas chromatography column combined with a gas sensor of TGS 2620 as detector. The device is composed of four main parts namely an aroma sample handling and delivery system, column and detector room, microcontroller, and data acquisition system. The schematic design of the e nose can be seen in Figure 1(a), while the real hardware can be seen in Figure 1(b), and the configuration inside the column and sensor room can be seen in Figure 2.

1149
Before data collection was carried out, an e nose must be prepared and ensured that it could work properly. Once turned on, the temperature regulation function executed to activate the heater and began raising the temperature of the column and sensor room up to 60 ºC. During the temperature regulation process, oxygen regulator tap was opened so oxygen began to flow to clean the column and sensor from the remnants of previous sample aroma exposure. The data acquisition system would receive data from the microcontroller and display it on the screen as a chromatogram that shows a plot of the sensor response versus time. The cleaning process lasted for 15 minutes or until the chromatogram showed a stable sensor response.Data collection began by preparing and putting a sample into the sample vial. Amount of sample used in each data collection was 5 ml. The sample vial was then tightly closed for 5 minutes, so the headspace of the vial would be saturated by sample aroma. After 5 minutes, data collection could be started. Data collection would run automatically in a series of 3 processes. The first process was referencing that lasted for 60 s in which the valve was closed and oxygen flowed directly into the chromatography column without going through the sample vial. This process was carried out to obtain the baseline value (sensor drift), the sensor response without the exposure of sample aroma. The second process was sampling that lasted for 180 s. During this process, the valve opened and oxygen flowed through the sample vial. Oxygen mixed with the sample aroma and continued to flow towards the chromatography column. The third process was profiling that lasted for 35 minutes (2100 s). Once profiling started, the valve was closed and oxygen flowed directly into the chromatography column again. Profiling was a process in which the sensor detected the analytes contained in the sample aroma that had been separated by gas chromatography column. The column retained a certain number of analytes for some time as the consequence of their interaction with the stationary phase inside the column. Analytes that did not interact with the stationary phase would leave first and vice versa. The analytes that had come out of the column flowed to the TGS 2620 sensor that result in the change of sensor conductance which then converted by microcontroller into a digital data of the change of the sensor output voltage, sent to the data acquisition system, received and presented as a chromatogram. Exposure to an analyte was indicated by the increment of the sensor response. During the data collection, the temperature of the column and sample room and the oxygen flow was kept stable at 60 ºC and 0.7 Nl/min respectively.
2.3. Data collection
TELKOMNIKA Telecommun Comput El Control
Figure 2. The configuration inside the column and sensor room

The microcontroller used in this study was the ATmega8535 which had been assembled in the development tools automatic voltage regulator (DT AVR) low cost micro system module and equipped with an oscillator with a frequency of 4 MHz. The microcontroller regulated the performance of the other hardware so that they could work automatically during the data collection process and ensured that the amount of aroma that enters the column and detector was always the same in each data collection process. The microcontroller also acted as an analog to digital converter (ADC) which received a response from the gas sensor and converted it into digital data of the sensor output voltage change to be sent to the data acquisition system. The microcontroller read and sent the response of sensors every 1 second.
Performance of electronic nose based on gas sensor partition column for … (Radi)
Acquisition of the data sent by the microcontroller to a computer. Received data were the response of the gas sensor and the temperature sensor during data collection. Data were then displayed as a chromatogram and stored in a computer based file (.mat) and in the form of a spreadsheet based file as a backup. Besides receiving data, electronic nose performance control was also carried out using this system. Electronic nose performance regulation was done by clicking a specific button to send an appropriate code that have been programmed into the microcontroller. After several data of entire samples were collected, data analysis and aroma recognition could be done directly using available pattern recognition features, such as fuzzy c means clustering (FCM) and artificial neural network (ANN).
ISSN: 1693 6930
pattern recognition analysis method used in this study was pattern recognition neural network. The network was constructed by 2 hidden layers consisting of 250 and 100 nodes respectively. The transfer function of both hidden layers and the output layer was configured to be logsig, so it would produce an output that ranges between 0 and 1. The network was trained using the resilient backpropagation training algorithm which was chosen due to the results of the performance comparison between some training algorithms as reported in [28], where the resilient backpropagation algorithm together with the conjugate gradient algorithm has the best performance for pattern recognition purposes. Twenty networks trained in this study then the network with the best accuracy of test data set classification would be chosen. Five data of each sample that selected randomly were used as the network training data set, while the rest used as the test data set. Performance of the network was evaluated based on its mean squared error (mse). Expected error value and maximum iterations allowed was 1e 3 and 15.000 respectively. In the resilient backpropagation algorithm, there are 2 parameters called regularization and normalization. The regularization parameter decides how much the network weight and bias being
Where ��′′ normalized data, ��′ baseline equalized data, �� baseline value (minimum sensor response during referencing process of each data collection iteration) and �� raw data. From the normalized data, the distinctive features of the data are then extracted in order to reduce the dimension of the data. The feature extraction was done by taking a part of data inside a specific time range that could show the distinctive feature of the entire samples. Distinctive features could be the size of sensor response increment or when and how long an increment occurred. The determination of the time range in question was based on the trend of each chromatogram of Extractedsample.features were used as an input of pattern recognition analysis. There were 2 methods of pattern recognition analysis that was done in this study, namely FCM clustering which was an unsupervised method and artificial neural network which was a supervised method. Unsupervised method means that the analysis doesn’t need the presence of an explanation about in which class a data belongs to. FCM separates data into a specific number of groups or clusters based on the similarity between the patterns of each data. The data separation is done by giving each data a membership value of each cluster. The membership value is fuzzy, that means, the value is between 0 and 1 that indicates the data level of membership to a specific cluster. Higher membership value of a cluster indicates that data in question does strongly belong to that cluster. The membership value is counted based on the euclidean distance of each data to the center of each cluster [26],Supervised[27].
Once the profiling process was completed, the column and sensor were cleaned by continuously flowing oxygen for several time until the chromatogram showed a stable sensor response. Duration of the profiling process was determined based on the result of prior trial and error. This duration is strongly influenced by the carrier gas flow rate and operating temperature due to the influence of both parameters on the compound separation process. Larger carrier gas flow rate will reduce the retention time (the time it takes for a compound to pass through the column) and vice versa, especially for carbon compounds in food products [23], [24]. The lower retention time the faster the sample aroma compounds will flow out from the column, interact with the gas sensor and cause a response. The effect of operating temperature on retention time shows the same relationship as carrier gas flow rate, where a higher temperature reduces retention time. The higher temperature is thought to decrease the ability of the compound to interact with the stationary phase, so it leaves the column faster. In general, a low interaction with the stationary phase will result in an output with poor separation, but in some cases, high temperatures are required for better separation of compounds. Because when the temperature is too low, the compounds may be condensed inside the column and non optimally separated [25].
2.4. Data analysis
Data analysis of this study was conducted based on the collected sensor responses only, while the impact of either the identity or concentration of the odor forming volatile compounds of the sample to the result of the analysis was not further evaluated. Data analysis was carried out through some steps as outlined in Figure 3. Data analysis began by preprocessing the collected data with baseline equalization and normalization, which carried out using following:
Normalization
��′′[��]= ��′[��] (��′[��]) (2)
1150
TELKOMNIKA Telecommun Comput El Control, Vol. 20, No. 5, October 2022: 1146 1158
��′[��]=��[��] �� (1)
Baseline equalization
1151
TELKOMNIKA Telecommun Comput El Control
3.1. Chromatograms of the samples
The pattern of sensor responses to aroma of the samples are also seen varies one each other among the same sample and that indicated a low level of repeatability parameter of the electronic nose used in this study. These variations may be caused by the unbalanced reaction between oxygen, the odor forming volatile compound of the samples and the semiconductor material of the sensor. Samples aroma may have a very low concentration of reducing gas, meanwhile, oxygen flow was intensively interacted with the semiconductor material and may disturb the reaction between semiconductor material of the sensor and the reducing gas of the samples. This disturbance can decrease the sensor response even before it reach the maximum increment as the result of the oxidation of the reducing gas by oxygen adsorbed in the surface of the semiconductor.
Figure 3. Schema of data analysis procedure
minimalized during the training process in order to generate a proper network generalization, while the normalization parameter decides how the performance of the network being evaluated, whether it is normalized or not. The value of both parameters was determined to be 0.5 and ‘standard’ respectively.

Data of each sample was collected 10 times and presented as chromatograms in Figure 4. Figure 4(a) shows the chromatograms of durian flavor, Figure 4(b) jackfruit flavor, Figure 4(c) ambonese banana flavor, Figure 4(d) melon flavor, Figure 4(e) orange flavor, and Figure 4(f) lemon flavor respectively. The baseline value of chromatograms among the same sample are seen varies on each other. The usage of oxygen as the carrier gas may be the reason for these baseline value variations. As a kind of MOS sensor, TGS 2620 response is a change of its conductivity as the result of specific volatile compound exposure, especially the reducing gasses. The semiconductor material of the sensor adsorbs some surrounding oxygen atoms then produce a barrier that resists electron movement and increases sensor resistance. When there is an exposure of reducing gas, it will be oxidized, weakening the barrier, and increasing the sensor conductivity [4], [29]. In this study, oxygen flowed through the gas sensor intensively during data collection and cleaning process. The intense interaction between oxygen flow and the semiconductor material of the sensor may increase the sensor resistance continuously time by time. Consequently, the sensor produced a lower conductivity every time new data collection process started.
For further analysis, the baseline values of the data must be equalized in order to obtain data that show the magnitude of the sensor response change due to the exposure of the aroma of the samples only. Therefore, data preprocessing of baseline equalization was done and the results are presented in Figure 5. Figure 5 shows the baseline equalized chromatograms of Figure 5(a) durian flavor, Figure 5(b) jackfruit flavor, Figure 5(c) ambonese banana flavor, Figure 5(d) melon flavor, Figure 5(e) orange flavor, and Figure 5 (f) lemon flavor respectively. Sensor responses to the sample aroma appear to be very low, except for the lemon flavor. The highest sensor response to lemon flavor is around 1500 mV while for the other samples, the highest is just around 175 mV. A relatively low sensor response to the aroma of the samples may be due to the characteristic of a typical MOS sensor that has a low sensitivity to aromatic ester which generally compose the synthetic flavor samples [30], [31]. Since a detailed composition of the samples is unknown, the specific reason for the high sensor responses to lemon flavor is unknown too, but it can be assumed that lemon flavor may have either a high concentration of odor forming volatile compound or a very differ volatile compound.
3. RESULTS AND DISCUSSION
Performance of electronic nose based on gas sensor partition column for … (Radi)
TELKOMNIKA Telecommun Comput El Control, Vol. 20, No. 5, October 2022: 1146 1158
1152
ISSN: 1693 6930
(c) (d) (e) (f)
(a) (b)
Figure 4. Chromatograms of the samples: (a) durian flavor, (b) jackfruit flavor, (c) ambonese banana flavor, (d) melon flavor, (e) orange flavor, and (f) lemon flavor
TELKOMNIKA Telecommun Comput El Control
Figure 5. Chromatograms of the samples after baseline equalization: (a) durian flavor, (b) jackfruit flavor, (c) ambonese banana flavor, (d) melon flavor, (e) orange flavor, and (f) lemon flavor
The trends of the sample chromatograms are presented in Figure 6. The trends of sensor response to entire samples are increased at the beginning of the data collection process, especially from the 101th s up to the 700th s. The whole samples reached the peak of this increment at around the 280th s. Sensor response increment of each sample can be distinguished by its size. Durian flavor, orange flavor and melon flavor have a similar magnitude of increment, but differ in the decrement rate after the peak of the increment reached. Beside that, melon flavor has another sensor response increment that reaches its peak at around the 1050th s.
Performance of electronic nose based on gas sensor partition column for … (Radi)
3.2. Feature extraction
1153
(a) (b) (c) (d) (e) (f)
Pattern recognition analysis using FCM was done by the help of data dimensional transformation using principal component analysis (PCA) method. Transformation of data was needed due to the visualization of FCM results that was difficult to be presented, especially for a huge multivariate analysis considering the input was the extracted feature which consisted of 1200 variables. Principal component analysis is a statistical technique that linearly changes the shape of the original set of variables into an uncorrelated set of variables, in which the first few variables of the transformed data are able to represent most of the information of the original set of variables. PCA is an effective unsupervised multivariate analysis method for extracting high dimensional data into low dimensional space without losing data characteristics [32]. Therefore, the data clustering by FCM will produce the same result before and after the data transformation by PCA [27], [33]. The first 2 principal components of PCA data transformation result could represent up to 59.22% and 16.31% (75.53% in total) information of the extracted feature respectively.
Figure 6. The trends of the chromatogram of the samples
1154Jackfruit
TELKOMNIKA
The input of FCM analysis in this study was the transformed data as the result of PCA, number of clusters to be generated and maximum iterations allowed which was set to be 6 and 200 respectively. Meanwhile, the other parameters of FCM analysis was remain at the default value determined by the Matlab built in function. The parameters in question are fuzzy partition matrix exponent and minimum improvement limit with the default value of 2.0 and 1e 5 respectively. The result of FCM clustering shows that based on the maximum membership value of each data, the input data were well separated into 6 data clusters, but each cluster had a different number of members. In order to facilitate data interpretation, the clustering result is outlined as a plot of the first and the second principal component in a 2 dimensional field as shown as in Figure 7.
ISSN: 1693 6930 Telecommun Comput El Control, Vol. 20, No. 5, October 2022: 1146 1158
flavor and lemon flavor also produce a similar size of increment here, but lemon flavor has a massive increment starting from the 700th s, have a peak at around the 825th s and decreases until around the 1900th s. Ambonese bananas have the lowest peak at the beginning, but have the second peak at around the 600th s and another peak at the end of data collection process, specifically around the 1900th s. Feature extraction was then done by taking some parts of the data, especially the parts that contain the peaks of sensor response increment mentioned before. Those parts in question are data from the 101st s to the 400th s, from the 501st s to the 700th s, from the 801st s to the 850th s, from the 951st s to the 1200th s and from the 1701st s to the 2100th s. Therefore, the extracted feature of each iteration of the data collection process consisted of 1200 data from 1200 time points within the chosen time span. The extracted feature that had a total dimension of 60×1200 was then used as the input of pattern recognition analysis.
3.3. Fuzzy c means clustering result
The result of this clustering shows that 4 of 6 data clusters are well separated and the other 2 are overlapping one another. Out of these 4, only 2 data clusters that contain data of a single sample, namely cluster 2 which contains all of the lemon flavor (denoted by letter L) data and cluster 4 with 9 of the ambonese banana (denoted by letter B) flavor data. The last data of ambonese banana flavor and the rest of the sample data are clustered to 4 separated clusters with an unbalanced number of members. Based on their trends, the reason why data of durian flavor (denoted by letter D), jackfruit flavor (denoted by letter J) and orange flavor (denoted by letter O) are not separated is the similarity of the sensor response patterns to their aroma. Although melon flavor (denoted by letter M) data show a distinctive trend with another peak of sensor response increment at the middle of data collection process, they are not clustered into a single well separated data cluster. As shown in Figure 5(b), some data of jackfruit flavor have a peak in the similar time span with the distinctive peak of melon flavor data. These jackfruit flavor data may be the reason why melon flavor data could not be clustered into a single separated cluster.
The similarity between the patterns of durian flavor, jackfruit flavor, melon flavor and orange flavor may be due to the composition of the samples which majority are the same. There are only one or two distinct ingredients differing them which is the ingredient that is responsible to the main aroma of the flavor. On the other hand, the ambonese banana flavor contains additional ingredients, namely isoamyl acetate and ethyl acetate that generate a distinct part on its aroma pattern and make it possible to be clearly separated. Beside that, the low level of the e nose repeatability that produces varied patterns among a single sample also has a responsibility to make each sample data ambiguous to be clustered into a single separated cluster. For lemon flavor, its massive sensor response increments is more than enough to make it clearly different from the others.
TELKOMNIKA Telecommun Comput El Control
3.4. Data classification by artificial neural network
1155
The extracted feature is also used as the input of an artificial neural network. Network training was done by the resilient backpropagation training algorithm, a type of algorithm that is developed based on the backpropagation algorithm. In this algorithm, the parameter has been determined and there is no learning rate needed to be present. Feedforward stage of this algorithm was the same with one of the backpropagation algorithms. The difference of both algorithms is in the weight update process during the backward stage. Updates of the network weight and bias are directly based on local gradients of each training iteration. This process uses a sign of the corresponding weight partial derivative (either positive or negative) to decide the direction of the weight update process, while the size of the update based on the adapted update value of the corresponding weight (∆����) [34].
Figure 7. The result of FCM clustering into 6 data clusters
Performance of electronic nose based on gas sensor partition column for … (Radi)
Twenty artificial neural networks trained in this study successfully achieved the network convergence. The best data classification accuracy among these networks is 70.00%. The results of the test data classification by the network in question are listed in Table 2. The entire ambonese banana flavor, the melon flavor and the lemon test data set are perfectly classified, despite 2 ambonese banana data and one melon flavor data have a lower than 90.00% similarity level to their training data set. Although melon flavor data are not well clustered by FCM clustering, it still can be classified perfectly by the trained network. This different result may due to the involvement of the explanation about the data identity in this supervised analysis method. For the durian flavor test data set, only 3 data could be classified correctly while the rest are classified as orange flavor and ambonese flavor. Out of those 3 correctly classified data, there is a data that has such a low similarity level of 44.32%. Meanwhile, there are just 2 orange flavor test data which are well classified and even they have a low level of similarity of 52.74% and 74.40% respectively. The rest of orange data are classified as durian flavor. On the other hand, there is only one jackfruit flavor test data correctly classified with only 76.47% similarity level. The network misclassification is due to the similarity of the sensor response patterns produced by the aroma of durian flavor, jackfruit flavor and orange flavor. The misclassification may be a kind of problem caused by the compositions of the samples, while the low level of similarity between test data set and training data set is caused by the low level of repeatability parameter of electronic nose used in this study as described before.
Table 2. The result of the test data set classification by the chosen trained network Sample Target Output Score Accuracy
D 1 0 0 0 0 0 0.9876 0.0036 0.0001 0.0028 0.0064 0.0148 1 60%
We would like to thank Universitas Gadjah Mada (RTA Grant) for funding this research. We are also grateful to the research group of Agricultural Control & Robotics. Department of Agricultural and Biosystems Engineering. Faculty of Agricultural Technology. Universitas Gadjah Mada (UGM). Part of data in this study was used for student thesis at Faculty of Agricultural Technology UGM
L 0 0 0 0 0 1 0.0024 0.0005 0.0042 0.0034 0.0004 0.9942 1
[4] B. Wyszynski and T. Nakamoto, “Chapter 5 Chemical sensors,” in Flavour Development. Analysis and Perception in Food and Beverages, Cambridge, England: Woodhead Publishing, 2015, pp. 83 104, doi: 10.1016/C2013 0 16460 4.
J 0 1 0 0 0 0 0.0472 0.0180 0.0000 0.3257 0.0528 0.0014 0 20%
J 0 1 0 0 0 0 0.1406 0.0008 0.0002 0.0069 0.8710 0.0022 0
M 0 0 0 1 0 0 0.0206 0.0009 0.0001 0.9873 0.0048 0.0023 1 100%
Notes: Melon,
L 0 0 0 0 0 1 0.0036 0.0005 0.0041 0.0021 0.0005 0.9942 1 100%
L 0 0 0 0 0 1 0.0036 0.0004 0.0044 0.0024 0.0005 0.9944 1
REFERENCES
AB 0 0 1 0 0 0 0.0071 0.0001 0.9822 0.0070 0.0007 0.0296 1
[2] D. Perry, “Sensory Measurement of Meat Quality,” in Meat Technology, North Melbourne: Woolwise Australian Wool Education Trust, 2009, pp. 1 8, Accessed: Dec. 01, 2021. [Online]. Available: https://www.woolwise.com/wp content/uploads/2017/07/Meat 418 518 07 T 14.docx
L 0 0 0 0 0 1 0.0010 0.0006 0.0037 0.0049 0.0004 0.9949 1 0 0 0 0 1 0.0028 0.0005 0.0040 0.0025 0.0005 0.9951 1
D 1 0 0 0 0 0 0.9698 0.0002 0.0006 0.0081 0.0784 0.0018 1
D 1 0 0 0 0 0 0.0111 0.0272 0.7155 0.0036 0.0010 0.0004 0
ACKNOWLEDGEMENTS
M 0 0 0 1 0 0 0.0071 0.1073 0.0004 0.8902 0.0013 0.0001 1
M 0 0 0 1 0 0 0.0436 0.0004 0.0000 0.9258 0.0321 0.0069 1
AB 0 0 1 0 0 0 0.0267 0.0033 0.8757 0.0071 0.0000 0.0475 1
O 0 0 0 0 1 0 0.0659 0.0848 0.0092 0.0018 0.5274 0.0000 1 40%
D 1 0 0 0 0 0 0.0231 0.0015 0.0008 0.0696 0.7704 0.0001 0
TELKOMNIKA Telecommun Comput El Control, Vol. 20, No. 5, October 2022: 1146 1158
O 0 0 0 0 1 0 0.8204 0.0299 0.0009 0.0295 0.0033 0.0001 0
O 0 0 0 0 1 0 0.1129 0.0270 0.0014 0.0821 0.0063 0.0003 0
O 0 0 0 0 1 0 0.7185 0.2396 0.0010 0.0135 0.0013 0.0001 0
Total Accuracy 70%
D = Durian, J = Jackfruit, AB = Ambonese banana, M =
M 0 0 0 1 0 0 0.0005 0.1264 0.0009 0.9947 0.0000 0.0017 1
O = Orange, and L = Lemon
[1] S. S. Schiffman and T. C. Pearce, “Introduction to Olfaction: Perception, Anatomy, Physiology, and Molecular Biology,” in Handbook of Machine Olfaction, Germany: Wiley VCH Verlag, 2003, pp. 1 31, doi: 10.1002/3527601597.ch1.
[3] Radi, S. Ciptohadijoyo, W. S. Litananda, M. Rivai, and M. H. Purnomo, “Electronic nose based on partition column integrated with gas sensor for fruit identification and classification,” Computers and Electronics in Agriculture, vol. 121, pp. 429 435, 2016, doi: 10.1016/j.compag.2015.11.013.
AB 0 0 1 0 0 0 0.0009 0.0087 0.7759 0.0016 0.0226 0.0006 1
ISSN: 1693 6930
M 0 0 0 1 0 0 0.0008 0.0017 0.0037 0.9829 0.0004 0.0015 1
J 0 1 0 0 0 0 0.9230 0.0049 0.0000 0.0778 0.0051 0.0035 0
[5] M. Falasconi, I Concina, E. Gobbi, V. Sberveglieri, A. Pulvirenti, and G. Sberveglieri, “Electronic Nose for Microbiological
J 0 1 0 0 0 0 0.0080 0.7647 0.0021 0.0649 0.0002 0.0014 1
AB 0 0 1 0 0 0 0.0001 0.0045 0.9918 0.0014 0.0041 0.0020 1 100%
AB 0 0 1 0 0 0 0.0001 0.0035 0.9870 0.0058 0.0025 0.0021 1
4. CONCLUSION
D 1 0 0 0 0 0 0.4432 0.0020 0.0002 0.0037 0.3079 0.0046 1
1156
Based on the result of data analysis, a packed gas chromatography column and a gas sensor based electronic nose could be used to classify six variants of synthetic flavor aroma namely durian, jackfruit, ambonese banana, melon, orange, and lemon. The unsupervised pattern recognition analysis by fuzzy c means clustering could separate samples data into 6 distinct clusters with an unbalanced number of members. indicating that this analysis could not classify the samples properly. Meanwhile. the supervised analysis by artificial neural network resulted in a trained network that could classify samples by the level of accuracy of 70.00%. The inseparability of the data analyzed using unsupervised analysis and the misclassification of the trained network was due to the high similarity level of some sensor response patterns from different samples and the low level of electronic nose repeatability. The similarity of sensor response patterns to a different sample might be due to the majority of sample compositions that are the same.
O 0 0 0 0 1 0 0.0133 0.0315 0.0044 0.0071 0.7440 0.0000 1
L 0
J 0 1 0 0 0 0 0.7151 0.0034 0.0000 0.0100 0.0748 0.0176 0
[33] M. S Reza and S. Ruhi, “Study of Multivariate Data Clustering Based on K Means and Independent Component Analysis,” American Journal of Theoretical and Applied Statistics, vol. 4, no. 5, pp. 317 321, 2015, doi: 10.11648/j.ajtas.20150405.11.
[14] S. Grassi, S. Benedetti, M. Opizzio, E. Di Nardo, and S. Buratti, “Meat and fish freshness assessment by a portable and simplified electronic nose system (Mastersense),” Sensors, vol. 19, no. 14, 2019, doi: 10.3390/s19143225.
Quality Control of Food Products,” International Journal of Electrochemistry, vol. 2012, pp. 1 12, 2012, doi: 10.1155/2012/715763.
[32] I. T. Jolliffe, Principal Component Analysis, NY, USA: Springer Verlag New York, 2002, doi: 10.1007/b98835.
[25] O. Zuas, “Effect of Carrier Gas Flow Rate and Column Temperature on the Suitability Parameters of GC ECD for SF6 Measurement,” PERIÓDICO TCHÊ QUÍMICA, vol. 14, no. 28, pp. 120 129, 2017, doi: 10.52571/ptq.v14.n28.2017.120_periodico28_pgs_120_129.pdf.
Performance of electronic nose based on gas sensor partition column for … (Radi)
[30] M. Kadosaki, Y. Sakai, I. Tamura, I. Matsubara, and T. Itoh, “Development of an oxide semiconductor thick film gas sensor for the detection of total volatile organic compounds,” Electronics and Communications in Japan, vol. 93, no. 10, pp. 34 41, 2010, doi: 10.1002/ecj.10190.
[9] T. Sharmilan, I. Premarathne, I. Wanniarachchi, S. Kumari, and D. Wanniarachchi, “Electronic Nose Technologies in Monitoring Black Tea Manufacturing Process,” Journal of Sensors, vol 2020, 2020, doi: 10.1155/2020/3073104
[16] S. Dragonieri, G. Pennazza, P. Carratu, and O. Resta, “Electronic Nose Technology in Respiratory Diseases,” Lung, vol. 195, pp. 157 165, 2017, doi: 10.1007/s00408 017 9987 3.
[31] A. G. Almeida SÁ, A. C. de Meneses, P. H. H. de Araújo, and D. de Oliveira, “A review on enzymatic synthesis of aromatic esters used as flavor ingredients for food. cosmetics and pharmaceuticals industries,” Trends in Food Science and Technology, vol. 69, pp. 95 105, 2017, doi: 10.1016/j.tifs.2017.09.004.
[7] P. Sharma et al., “Monitoring the fermentation process of black tea using QCM sensor based electronic nose,” Sensors and Actuators B: Chemical, vol 219, pp. 146 157, 2015, doi: 10.1016/j.snb.2015.05.013.
[13] S. A. Laga and R. Sarno, “Temperature effect of electronic nose sampling for classifying mixture of beef and pork,” Indonesian Journal of Electrical Engineering and Computer Science, vol. 19, no. 3, pp. 1626 1634, 2020, doi: 10.11591/ijeecs.v19.i3.pp1626 1634.
[26] J. C. Bezdek, Pattern Recognition with Fuzzy Objective Function Algorithms, NY, USA: Springer New York, 1981, doi: 10.1007/978 1 4757 0450 1.
[22] Radi, Barokah, D. N. Rohmah, E. Wahyudi, M. D. Adhityamurti. and J. P. L. Y Putro, “Implementation of an electronic nose for classification of synthetic flavors,” Bulletin of Electrical Engineering and Informatics, vol. 10, no. 3, pp. 1283 1290, 2021, doi: 10.11591/eei.v10i3.3018.
[12] R. Sarno and D. R. Wijaya, “Recent development in electronic nose data processing for beef quality assessment,” TELKOMNIKA Telecommunication Computing Electronics and Control, vol. 17, no. 1, pp. 337 34, 2019, doi: 10.12928/TELKOMNIKA.v17i1.10565.
[24] A. Y. El Naggar, “Factors affecting selection of mobile phase in gas Chromatography,” American Journal of Research Communication, vol. 1, no. 3, pp. 219 228, 2013. [Online]. Available: http://www.usa journals.com/wp content/uploads/2013/02/El Naggar_Vol13.pdf
1157
[34] M. Riedmiller and H. Braun, “A direct adaptive method for faster backpropagation learning: The RPROP algorithm,” in 1993 IEEE International Conference on Neural Networks, 1993, pp. 586 591, vol. 1, doi: 10.1109/icnn.1993.298623.
[27] S. Miyamoto, H. Ichihashi, and K. Honda, Algorithms for Fuzzy Clustering Methods in c Means Clustering with Applications, Germany: Springer Verlag Berlin Heidelberg, 2008, doi: 10.1007/978 3 540 78737 2
[29] H. Nanto and J. R. Stetter, “Introduction to Chemosensors,” in Handbook of Machine Olfaction, Germany: Wiley‐VCH Verlag, 2003, pp. 79 103, doi: 10.1002/3527601597.ch4
[11] B. Gunawan, S. Alfarisi, G. Satrio, A. Sudarmaji, Malvin, and Krisyarangga, “MOS gas sensor of meat freshness analysis on E nose,” TELKOMNIKA Telecommunication Computing Electronics and Control, vol. 17, no. 2, pp. 771 780, 2019, doi: 10.12928/telkomnika.v17i2.11787
[18] M. Rivai, D. Purwanto, H. Juwono, and H. A. Sujono, “Electronic nose using gas chromatography column and quartz crystal microbalance,” TELKOMNIKA (Telecommunication Computing Electronics and Control, vol. 9, no. 2, pp. 319 326, 2011, doi: 10.12928/telkomnika.v9i2.703.
[8] X. Lu, J. Wang, G. Lu, B. Lin, M. Chang, and W. He, “Quality level identification of West Lake Longjing green tea using electronic nose,” Sensors Actuators B: Chemical, vol. 301, 2019, doi: 10.1016/j.snb.2019.127056.
[10] Radi, M. Rivai, and M. H. Purnomo, “Study on electronic nose based quality monitoring system for coffee under roasting,” Jounal of Circuit, Systems and Computers, vol. 25, no. 10, 2016, doi: 10.1142/S0218126616501164.
[21] A. Sklorz, S. Janßen, and W. Lang, “Application of a miniaturised packed gas chromatography column and a SnO2 gas detector for analysis of low molecular weight hydrocarbons with focus on ethylene detection,” Sensors Actuators B: Chemical, vol. 180, pp. 43 49, 2013, doi: 10.1016/j.snb.2011.12.110.
[23] K. D. Wilde and W. Engewald, “Chapter 2 Theory of Gas Chromatography,” in Practical Gas Chromatography A Comprehensive Reference, Heidelberg, Germany: Springer Nature, 2014, pp. 22 59, doi: 10.1007/978 3 642 54640 2.
[15] Radi, E. Wahyudi, M. D. Adhityamurti, J. P. L. Y. Putro, Barokah, and D. N. Rohmah, “Freshness assessment of tilapia fish in traditional market based on an electronic nose,” Bulletin of Electrical Engineering and Informatics, vol. 10, no. 5, pp. 2466 2476, 2021, doi: 10.11591/eei.v10i5.3111.
[19] A. Faricha, Suwito, M. Rivai, M. A. Nanda, D. Purwanto. and R. Anhar R. P., “Design of electronic nose system using gas chromatography principle and Surface Acoustic Wave sensor,” TELKOMNIKA Telecommunication Computing Electronics and Control, vol. 16, no. 4. pp. 1458 1467, 2018, doi: 10.12928/TELKOMNIKA.v16i4.7127.
[28] The MathWorks Inc, “Choose a Multilayer Neural Network Training Function,” MathWorks R2016b Documentation, 2016, Accessed: Sep. 16, 2021. [Online]. Available: https://www.mathworks.com/help/deeplearning/ug/choose a multilayer neural network training function.html
TELKOMNIKA Telecommun Comput El Control
[20] P. Wiśniewska, M. Śliwińska, T. Dymerski, W. Wardencki, and J. Namieśnik, “Comparison of an Electronic Nose Based on Ultrafast Gas Chromatography, Comprehensive Two Dimensional Gas Chromatography, and Sensory Evaluation for an Analysis of Type of Whisky,” Journal of Chemistry, vol. 2017, pp. 1 13, 2017, doi: 10.1155/2017/2710104.
[17] M.V. Farraia, J. C. Rufo, I. Paciência, F. Mendes, L. Delgado, and A. Moreira, “The electronic nose technology in clinical diagnosis: A systematic review,” Porto Biomedical Journal, vol. 4, no. 4, 2019, doi: 10.1097/j.pbj.0000000000000042
[6] W. Wojnowski, T. Majchrzak, T. Dymerski, J. Gębicki, and J. Namieśnik, “Portable electronic nose based on electrochemical sensors for food quality assessment,” Sensors, vol. 17, no. 12, 2017, doi: 10.3390/s17122715.
Andi Setiawan is master’s student of Department of Agricultural and Biosystems Engineering. Faculty of Agricultural Technology. Universitas Gadjah Mada. Indonesia. Indonesia. Currently. he is member of the research group of agricultural control & robotics. His research interest is application of an electronic nose for food quality assessment. He can be contacted at email: andisoum@mail.ugm.ac.id

ISSN: 1693 6930


TELKOMNIKA Telecommun Comput El Control, Vol. 20, No. 5, October 2022: 1146 1158 1158
Muhammad Danu Adhityamurti is master’s student of Department of Agricultural and Biosystems Engineering. Faculty of Agricultural Technology. Universitas Gadjah Mada. Indonesia. Indonesia. Currently. he is a member of the research group of agricultural control and robotics. His research interest is application of an electronic nose for food quality process control. He can be contacted at email: danu.danul@mail.ugm.ac.id


Joko Purwo Leksono Yuroto Putro is a bachelor's student of Department of Agricultural and Biosystems Engineering. Faculty of Agricultural Technology. Universitas Gadjah Mada. Indonesia. Indonesia. Currently. he is a member of the research group of agricultural control and robotics. His research interest is application of an electronic nose for food quality assessment. He can be contacted at email: jokopurwo97@mail.ugm.ac.id
Radi is a lecturer at the Department of Agricultural and Biosystems Engineering. Faculty of Agricultural Technology. Universitas Gadjah Mada. Indonesia. He received his bachelor’s degree from that department. master’s degree from Department of Electrical Engineering. Faculty of Engineering. Universitas Gadjah Mada. doctoral degree from Department of Electrical Engineering. Faculty of Industrial Technology. Institut Teknologi Sepuluh Nopember. Indonesia. Currently. he is head of Agricultural Energy & Machinery Laboratory. His research interest is associated with the research group of agricultural control & robotics which covers electronic nose. machine vision. bio sensing. biosystems control & robotics. He can be contacted at email: radi tep@ugm.ac.id
BIOGRAPHIES OF AUTHORS

Barokah is a master’s student of Department of Agricultural and Biosystems Engineering. Faculty of Agricultural Technology. Universitas Gadjah Mada. Indonesia. Indonesia. Currently. she is a member of the research group of agricultural control & robotics. Her research interest is application of an electronic nose for food quality evaluation. She can be contacted at email: barokah96@mail.ugm.ac.id
Luthfi Fadillah Zamzami is a master’s student of Department of Agricultural and Biosystems Engineering. Faculty of Agricultural Technology. Universitas Gadjah Mada. Indonesia. Indonesia. Currently. he is a member of the research group of agricultural control & robotics. His research interest is application of an electronic nose for food quality monitoring. He can be contacted at email: luthfifadillah@mail.ugm.ac.id