TELKOMNIKA Telecommunication Computing Electronics and Control Vol. 20, No. 5, October 2022, pp. 1132~1138
Optical sensor
Corresponding Author:
Ammonia has been widely used in various industrial processes, agricultural activity, and a variety of biological systems [1]. Ammonia molecules are a nutrient required for life, but excess ammonia will cause toxic effect on the health of plants, animals as well as human beings. Consuming water with presence of ammonia will corrode the lining of the mouth, esophagus, and stomach. Furthermore, excess ammonia level may affect aquatic life. Previous studies have found that lethal ammonia concentration for a variety of fish species ranges from 0.2 mg/L to 2.0 mg/L [2]. However, the ammonia tolerance varies between fish species and physiological status. To avoid the environmental risk, the Food and Agriculture Organization (FAO) has advised that the ammonia levels in water should be lower than 1 mg/L. Thus, it is essential to control the concentration of ammonia in water to prevent environmental pollution.
Article Info ABSTRACT
Recently, a variety of sensing techniques for measuring ammonia concentration in water have been suggested, such as electro chemical method [3], metal oxide semiconductor detectors [4], a ratiometric fluorescence sensor [5], and fiber optic based sensors [2], [6] [11]. The electrochemical method has high
Batu Pahat, Johor, Malaysia
This is an open access article under the CC BY SA license.
3Mass Rapid Transit Corporation Sdn. Bhd. (MRT), MRT Sungai Buloh Depot, Jalan Sungai Buloh, U 4, 47810 Petaling Jaya, Selangor, Malaysia
Accepted Aug 08, 2022
1Faculty of Electrical and Electronic Engineering, Universiti Tun Hussein Onn Malaysia
Plastic optical fiber
Noran Azizan Cholan
Faculty of Electrical and Electronic Engineering, Universiti Tun Hussein Onn Malaysia 86400 Parit Raja, Batu Pahat, Johor Malaysia
Received Apr 21, 2021
2Malaysia Marine and Heavy Engineering Sdn Bhd (MMHE), PLO3 Jalan Pekeliling, P.O. Box 77, 81700 Pasir Gudang, Johor, Malaysia
Keywords:

1. INTRODUCTION
Optimization of light source wavelength for ammonia detection in water
Revised Jul 31, 2022
Journal
ISSN: 1693 6930, DOI: 10.12928/TELKOMNIKA.v20i5 24079 1132 homepage: http://telkomnika.uad.ac.id
Article history:
Optimization of light source wavelength for ammonia detection in surface water is presented in this work. For the ammonia detection, the surface water sample is mixed with sodium chloride and nessler reagent, whereas the sensor head consists of unclad plastic optical fiber. The unclad region has a length of 1 cm and the cladding is removed by immersing it in acetone solution. Experimental results indicate that the output light intensity of the sensor has linear relationship with the ammonia concentration. At the wavelength of 510 nm, the output light increases linearly as the ammonia concentration varies from 0.07 mg/L to 8.97 mg/L. At the same wavelength, the proposed sensor achieves the sensitivity of 0.0139 (mg/L) 1, accuracy of 99.59% and resolution of 0.72 µg/L. The analysis of light source wavelength reveals that a wavelength range from 450 nm to 580 nm produces the optimized performances. Within this wavelength range, the proposed sensor achieves sensitivity of higher than 0.01 (mg/L) 1, accuracy of higher than 99% and resolution of less than 1 µg/L.
Ammonia detection
Nurfatihah Che Abd Rashid1, Noran Azizan Cholan1 , Kim Gaik Tay 1, Afiqah Yaacob1 , Nazrah Ilyana Sulaiman1,2, Khairulanwar Mokhiri3 , Nor Hafizah Ngajikin1
Email: noran@uthm.edu.my
Optimization of light source wavelength for ammonia detection in water (Nurfatihah Che Abd Rashid)
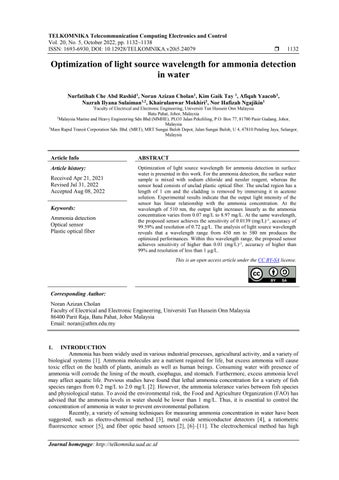
Figure 1. Experimental setup of fiber optic sensor that consists of (a) unclad POF as sensor head and (b) light source and spectrometer
2. EXPERIMENT
selectivity and low detection limit. However, this method lacks in term of the lifetime, miniaturization, and stability of the reference electrodes [5]. On the other hand, metal oxide semiconductor detector has low detection limit with fast response time, but has low sensitivity and lack in selectivity [1]. Ratiometric fluorescence technique meanwhile has great advantages regarding high sensitivity and selectivity with low detection limit [5]. Nonetheless, this method has complex acquisition and data manipulation due to the use of fluorescence ratio [12]. Fiber optic based sensor, on the other hand, is widely known for its immunity to electromagnetic interference, small in size, and ruggedness. Furthermore, fiber optic sensor has low loss, low dispersion, ultrawide bandwidth, high dynamic range, durability, upgradability, and low cost [9]
2.1 Experimental setup
1133
(a) (b)
The ammonia concentration in surface water samples is detected using clad modified fiber optic sensor where the cladding of the optical fiber is removed using etching method. The optical fiber used is a 15 cm long plastic optical fiber (POF) with polymethyl methacrylate (PMMA) core. The POF has a diameter core of 980 µm and diameter cladding of 20 µm thick. The refractive index of the core and cladding are 1.492 and 1.417, respectively. The sensing region of the fiber is prepared based on chemical etching technique using acetone, de ionized water, and sandpaper. No additional coating is deposited on the modified cladding surface. The sensor head of the POF is prepared by removing 1 cm of the middle fiber jacket using a fiber stripper. The cladding of the sensor head is then removed by immersing the optical fiber sensing region in acetone solution for 10 seconds. Reaction between acetone and the cladding forms a milky white foam on the outer fiber surface. To neutralize this reaction towards acetone, the fiber is then dipped in de ionized water. The milky white foam on the outer fiber surface is then removed using 2000 grit sandpaper and cleaned again using de ionized water. The unclad part of the fiber (sensing region) is then tested using FIS fiber optic continuity tester as shown in Figure 1(a). The test is conducted to ensure perfection on the sensor head. The POF is then connected to ocean optics deuterium halogen (DH) mini light source, and ocean optics HR4000CGUV VIS spectrometer for measurement as shown in Figure 1(b).

The basic operating principle of the fiber optic sensor is that the light signal travelling through an optical fiber changes when it is subjected to chemical or physical stimulus [13] Such mechanism allows the fiber optic sensor to find applications in detecting properties such as temperature [14], [15], liquid level [16], [17], refractive index [18] [20], uric acid concentration [21], [22] and ammonia concentration [2], [6] [11]. For ammonia detection in water, many methods have engineered the fiber such that a part of the cladding of the fiber sensor is removed through chemical etching, tapering or a combination of etching and tapering. In order to enhance the sensor sensitivity and selectivity in detecting ammonia concentration, additional coating material such as tin dioxide [2], oxazine 170 perchlorate [6] [8], sol gel silica [9], [10] and zinc oxide [11] were deposited on the modified cladding. However, such developments [2], [6] [11] have limitations in that they lack analysis of the light wavelength for the optimized performances for ammonia detection in water. In this work, the light source wavelength is analysed experimentally for the optimized performances with respect to the sensitivity, accuracy and resolution
TELKOMNIKA Telecommun Comput El Control
For the case of study, the change of light intensity towards different ammonia concentrations at the wavelength of 510 nm is presented in Figure 4. The graph is obtained based on the data obtained from Figure 3. Based on the data shown in Figure 4, it is found that the output light intensity has linear relationship with the ammonia concentration. The sensitivity of the sensor is 0.0139 (mg/L) 1, which is obtained based on the slope of the linear graph [23]. On the other hand, the sensor shows accuracy of 99.59%. The accuracy of the sensor is calculated using the (1) [21]
���������������� =1 |(�� �������� �� ����������������)/�� ��������| (1)
TELKOMNIKA Telecommun Comput El Control, Vol. 20,
5, October
(a) (b) (c)
1132 1138 1134
Where �� �������� is the real ammonia concentration measured by a commercial hanna instrument ammonia high range portable photometer (HI96733) and �� ���������������� is the measured concentration obtained from the linear fit equation in Figure 4. Meanwhile, the sensor has resolution of 0.72 µg/L, which is calculated using the following the (2) [25]
2.2. Sample preparation
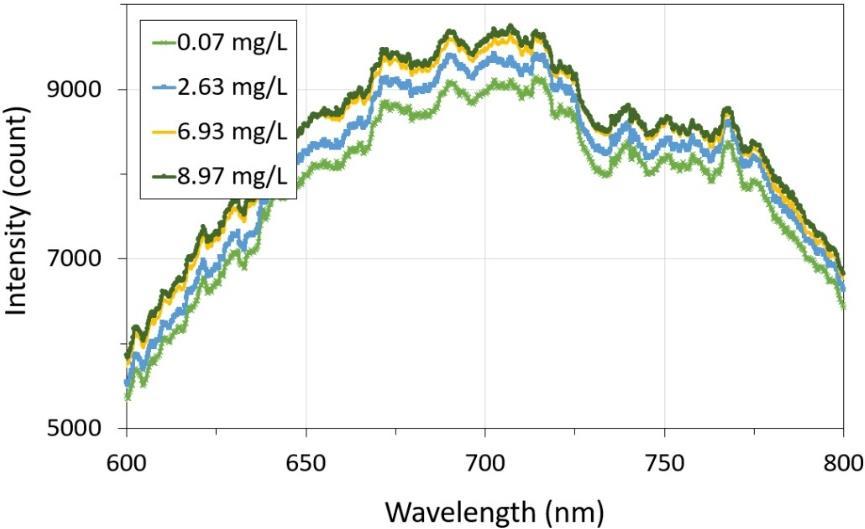
Table 1 shows the refractive index of the sample against the ammonia concentration. Based on Table 1, it is evident that the refractive index of the sample increases when the ammonia concentration in the sample increases. Meanwhile, Figure 3 illustrates the spectrum of light intensity against wavelength with different concentrations of ammonia. Based on Figure 3, it is found that the light intensity increases as the ammonia concentration in the sample increases. This condition is related to the increase of refractive index with the ammonia concentration shown in Table 1. As the refractive index of the sample increases, the refractive index difference between the sample and fiber core reduces. Consequently, the light loss is reduced, causing the output light intensity of the sensor becomes higher [23], [24]
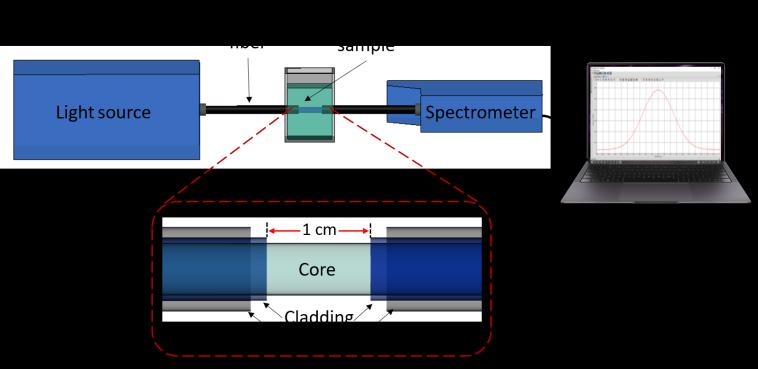
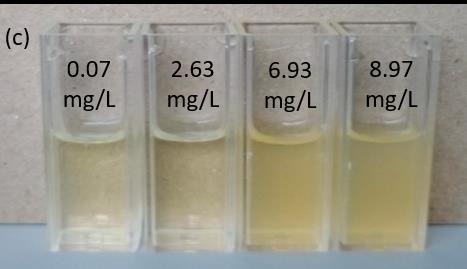
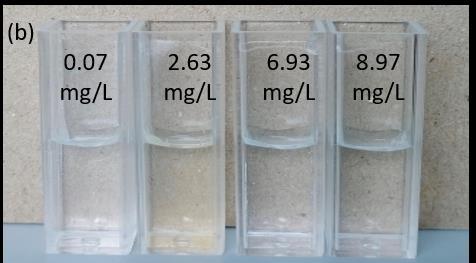
Figure 2. Preparation of water sample for testing: (a) water sample only, (b) water sample with sodium chloride reagent, and (c) water sample with sodium chloride and nessler reagent
3. RESULTS AND DISCUSSION
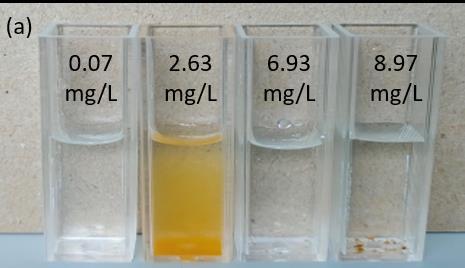
The detection of ammonia in this work is based on the reaction of surface water sample with two reagents: sodium chloride (NaCl) and nessler (K2HgI4). The surface water samples are collected in the area of Batu Pahat, Johor, Malaysia. The sample of the surface water collected is shown in Figure 2(a). The water sample used for measurement is prepared by mixing 1 mL of surface water sample with 9 mL of sodium chloride reagent as shown in Figure 2(b). Then, 4 drops of nessler reagent are added into the mixture. The addition of nessler reagent causes a brown precipitate in the sample as shown in Figure 2(c). The refractive index and concentration of each sample is measured using Atago refractometer and Hanna instrument ammonia high range portable photometer (HI96733), respectively. The concentrations obtained are 0.07 mg/L, 2.63 mg/L, 6.93 mg/L, and 8.97 mg/L. Such concentrations act as the reference for the result analysis. For the measurement, 1.5 mL of the sample is added into a cuvette as shown in Figure 1(b). The light intensity of each sample is observed and recorded using OceanView software installed in a computer. Each water sample is tested 3 times and the average value of each concentration is obtained subsequently
Table 1. Refractive index of water sample Concentration (mg/L) Refractive index 0.07 1.3322 2.63 1.3330 6.93 1.3340 8.97 1.3348
ISSN: 1693 6930 No. 2022:
Optimization of light source wavelength for ammonia detection in water (Nurfatihah Che Abd Rashid)
Where �� is the smallest scale that can be measured by detector and �� is the sensitivity of the sensor. In order to determine the best wavelength range for ammonia detection, the sensitivity, accuracy and resolution of the fiber optic sensor is calculated for every 10 nm wavelength from 400 nm to 900 nm. The data obtained is presented in Figure 5.
Figure 4. Light intensity as function of ammonia concentration at wavelength of 510 nm
Figure 3. Light intensity as function of wavelength for different ammonia concentration
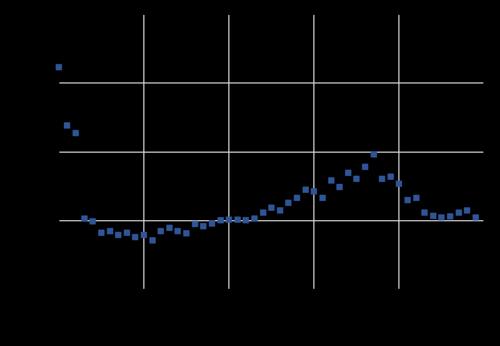
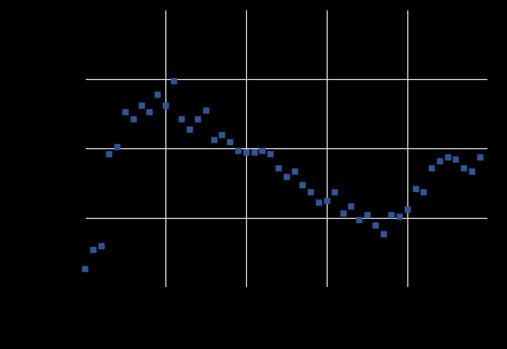
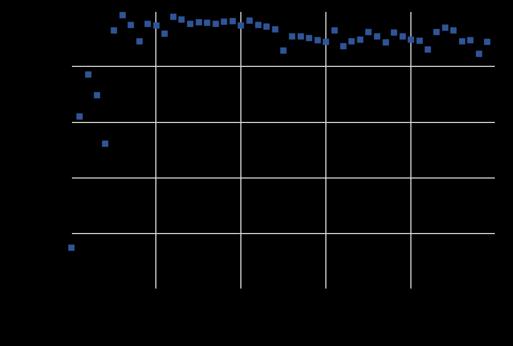
Figure 5(a) plots the sensor sensitivity as a function of wavelength. It can be seen that the sensitivity is higher than 0.01 (mg/L) 1 at a wavelength range from 440 nm to 580 nm. At wavelength ranges from 400 nm to 430 nm and 590 nm to 900 nm, the sensor has sensitivity of less than 0.01 (mg/L) 1 As for the accuracy as illustrated in Figure 5(b), the accuracy of the system is higher than 99% when the wavelength is between 450 nm and 900 nm. Whereas the sensor possesses less than 99% accuracy as the wavelength spans from 400 nm to 440 nm. On a different note, the sensor has resolution of less than 2 µg/L at a wavelength range from 430 nm to 900 nm as shown in Figure 5(c). Resolution of higher than 2 µg/L is recorded when the wavelength spans from 400 nm to 420 nm. All in all, based on the findings in Figure 5, the best wavelength range for the optimized performances with respect to the sensitivity, accuracy and resolution is from 450 nm to 580 nm. Within this wavelength range, the sensor produces high sensitivity, accuracy and resolution.

1135 �������������������� = �� �� (2)
TELKOMNIKA Telecommun Comput El Control
[4] H. Wu, Z. Ma, Z. Lin, H. Song, S. Yan, and Y. Shi, “High sensitive ammonia sensors based on tin monoxide nanoshells,” Nanomaterials, vol. 9, no. 3, 2019, doi: 10.3390/nano9030388.
(b)
TELKOMNIKA Telecommun Comput El Control, Vol. 20, No. 5, October 2022: 1132 1138
ISSN: 1693 6930
In conclusion, optimization of light source wavelength for ammonia detection in the surface water is experimentally demonstrated in this work. The ammonia content in the water is detected by unclad plastic optical fiber with the presence of sodium chloride and nessler reagent. Based on experimental results, it is found that the output light intensity has linear relationship with the ammonia concentration. Experimental results suggest that the wavelength range that produces the optimized performances spans from 450 nm to 580 nm. Within this wavelength range, the proposed sensor achieves sensitivity of higher than 0.01 (mg/L) 1 , accuracy of higher than 99% and resolution of less than 1 µg/L.
(c)
[1] S. Aarya, Y. Kumar, and R. K. Chahota, “Recent Advances in Materials, Parameters, Performance and Technology in Ammonia Sensors: A Review,” Journal of Inorganic and Organometallic Polymers and Materials, vol. 30, no. 2, pp. 269 290, 2020, doi: 10.1007/s10904 019 01208 x.
[3] N. Zhao, X. Li, X. Jin, I. Angelidaki, and Y. Zhang, “Integrated electrochemical biological process as an alternative mean for ammonia monitoring during anaerobic digestion of organic wastes,” Chemosphere, vol. 195, pp. 735 741, 2018, doi: 10.1016/j.chemosphere.2017.12.139.
Figure 5. Performance analysis for light source wavelength range (400 nm 900 nm) in terms of (a) sensitivity, (b) accuracy, and (c) resolution
4. CONCLUSION
REFERENCES
This work was supported in part by the Ministry of Higher Education Malaysia (MOHE) under Fundamental Research Grant Scheme (FRGS) FRGS/1/2018/TK04/UTHM/02/13 Vot K095 and by the Universiti Tun Hussein Onn Malaysia (UTHM) under Post Graduate Research Grant (GPPS) Vot H620.
[5] H. D. Duong and J. Il Rhee, “A ratiometric fluorescence sensor for the detection of ammonia in water,” Sensors Actuators B: Chemical, vol. 190, pp. 768 774, 2014, doi: 10.1016/j.snb.2013.09.071.
ACKNOWLEDGEMENTS
(a)
[2] M. Pisco et al., “A novel optochemical sensor based on SnO2 sensitive thin film for ppm ammonia detection in liquid environment,” Journal of Lightwave Technology, vol. 24, no. 12, pp. 5000 5007, 2006, doi: 10.1109/JLT.2006.884984.
1136
[15] H. Wang et al., “High sensitivity temperature sensor based on a PDMS assisted bow shaped fiber structure,” Optics Communications, vol. 481, p. 126536, 2021, doi: 10.1016/j.optcom.2020.126536.
[18] Z. Samavati, A. Samavati, A. F. Ismail, M. A. Rahman, and M. H. D. Othman, “Intensity modulated silver coated glass optical fiber refractive index sensor,” Chinese Optics Letters, vol. 16, no. 9, p. 090602, 2018. [Online]. Available: https://www.researchgate.net/publication/328331735_Intensity_modulated_silver_coated_glass_optical_fiber_refractive_index_sensor


[19] S. V. Rao and S. Srinivasulu, “Spectroscopic Signal Enabled Refractive Index Sensor Operating at the Temperature Range of 10 o C to 60 o C Using a Source of 660nm Wavelength,” European Journal of Molecular and Clinical Medicine, vol. 7, no. 11, pp. 2528 2537, 2020. [Online]. Available: https://ejmcm.com/article_6140.html
[8] A. G. L Junior, A. Frizera, and C. Marques, “High Sensitive Ammonia Detection in Water with Fabry Perot Interferometers,” IEEE Photonics Technology Letters, vol. 32, no. 14, pp. 863 866, 2020, doi: 10.1109/LPT.2020.3001421.
BIOGRAPHIES OF AUTHORS
[10] S. Tao, L. Xu, and J. C. Fanguy, “Optical fiber ammonia sensing probes using reagent immobilized porous silica coating as transducers,” Sensors Actuators B: Chemical, vol. 115, no. 1, pp. 158 163, 2006, doi: 10.1016/j.snb.2005.08.034.
[9] D. Liu et al., “High sensitivity sol gel silica coated optical fiber sensor for detection of ammonia in water,” Optics Express, vol. 24, no. 21, pp. 24179 24187, 2016, doi: 10.1364/oe.24.024179.
[6] A. G. L Junior, A. Frizera, and C. Marques, “Low cost fiberoptic probe for ammonia early detection in fish farms,” Remote Sensing, vol. 12, no. 9, 2020, doi: 10.3390/RS12091439.
[14] N. A. N. Jaharudin, N. A. Cholan, M. A. Omar, R. Talib, and N. H. Ngajikin, “Remote temperature sensing with a low threshold power erbium doped fiber laser,” Applied Optics, vol. 58, no. 22, pp. 6003 6006, 2019, doi: 10.1364/AO.58.006003.
[16] J. B. Rosolem et al., “Fiber optic bending sensor for water level monitoring: Development and field test: A review,” IEEE Sensors Journal, vol. 13, no. 11, pp. 4113 4120, 2013, doi: 10.1109/JSEN.2013.2278074.
[17] A. S. Rajamani, Divagar M, and V. V. R. Sai, “Plastic fiber optic sensor for continuous liquid level monitoring,” Sensors Actuators A: Physical, vol. 296, pp. 192 199, 2019, doi: 10.1016/j.sna.2019.07.021.
TELKOMNIKA Telecommun Comput El Control
[7] A. H. Jalal, J. Yu, and A. G. A Nnanna, “Fabrication and calibration of Oxazine based optic fiber sensor for detection of ammonia in water,” Applied Optics, vol. 51, no. 17, pp. 3768 3775, 2012, doi: 10.1364/AO.51.003768.
Optimization of light source wavelength for ammonia detection in water (Nurfatihah Che Abd Rashid)

[20] N. G Cardona, E. R Vera, and P. Torres, “High sensitivity refractive index sensor based on the excitation of long range surface plasmon polaritons in H shaped optical fiber,” Sensors, vol. 20, no. 7, 2020, doi: 10.3390/s20072111.

[24] D. K. Mahanta and S. Laskar, “Investigation of Transformer Oil Breakdown using Optical Fiber as Sensor,” IEEE Transactions on Dielectrics and Electrical Insulation, vol. 25, no. 1, pp. 316 320, 2018, doi: 10.1109/TDEI.2018.006855.
[13] J Yuan and M. A. El Sherif, “Fiber optic chemical sensor using polyaniline as modified cladding material,” IEEE Sensors Journal, vol. 3, no. 1, pp. 5 12, 2003, doi: 10.1109/JSEN.2003.809023.
[25] A. Arifin, Yusran, Miftahuddin, B. Abdullah, and D. Tahir, “Comparison of sensitivity and resolution load sensor at various configuration polymer optical fiber,” in AIP Conference Proceedings, 2017, vol. 1801, no. 1, p. 050002, doi: 10.1063/1.4973100.
[12] M. Li, J. Fan, H. Li, J. Du, S. Long, and X. Peng, “A ratiometric fluorescence probe for lysosomal polarity,” Biomaterials, vol. 164, pp. 98 105, 2018, doi: 10.1016/j.biomaterials.2018.02.044.
[11] S. K. Singh, D. Dutta, S. Das, A. Dhar, and M. C. Paul, “Synthetic and structural investigation of ZnO nano rods, hydrothermally grown over Au coated optical fiber for evanescent field based detection of aqueous ammonia,” Materials Science in Semiconductor Processing, vol. 107, p. 104819, 2020, doi: 10.1016/j.mssp.2019.104819.
[21] N. C A Rashid et al., “Spectrophotometer with Enhanced Sensitivity for Uric Acid Detection,” Chinese Optics Letters, vol. 17, no. 8, p. 081701, 2019. [Online]. Available: https://www.researching.cn/ArticlePdf/m00005/2019/17/8/081701.pdf
1137
Nurfatihah Che Abd Rashid received her B.E and M.E in Electrical Engineering from Universiti Teknologi Malaysia (UTM) in 2015 and 2019 respectively. She has involved in research on spectrophotometric detection for uric acid and soil nutrient applications. She is currently pursuing a PhD degree in Faculty of Electrical and Electronic Engineering, Universiti Tun Hussein Onn Malaysia (UTHM). She can be contacted at email: nurfatihahcar@gmail.com.

[22] A. Yaacob et al., “Uric acid detection in visible spectrum,” TELKOMNIKA Telecommunication Computing Electronics and Control, vol. 18, no. 4, pp. 2035 2041, 2020, doi: 10.12928/TELKOMNIKA.V18I4.14993.
Noran Azizan Cholan was born on 31st August 1979 in Segamat, Johor, Malaysia. He received his bachelor degree in Electronics Engineering from Universiti Tenaga Nasional Malaysia in 2002. Afterwards in 2004, he obtained his master degree in Electronics Telecommunications Engineering form Universiti Teknologi Malaysia. In 2010, he enrolled as a PhD student in Universiti Putra Malaysia. During his PhD study in 2012, he went to Swansea University, UK and The Hong Kong Polytechnic University, Hong Kong for research attachment. He completed his PhD in 2014 before serving as a senior lecturer in Universiti Tun Hussein Onn Malaysia. As of now, he has been authors/co authors for 25 journal and 16 conference proceeding papers. His research interests include lasers, amplifiers, optics modeling, microwave optics and optical sensors. He can be contacted at email: noran@uthm.edu.my
[23] M. Batumalay et al., “Tapered plastic optical fiber coated with ZnO nanostructures for the measurement of uric acid concentrations and changes in relative humidity,” Sensors Actuators, A: Physical, vol. 210, pp. 190 196, 2014, doi: 10.1016/j.sna.2014.01.035.
ISSN: 1693 6930
TELKOMNIKA Telecommun Comput El Control, Vol. 20, No. 5, October 2022: 1132 1138 1138
Nor Hafizah Ngajikin received her B.E and M.E in Electronic Engineering from Universiti Teknologi Malaysia (UTM) in 2001 and 2003 respectively. She was awarded a Ph.D from UTM for her work on MEMS Fabry Perot optical tunable filter. From 2004 2017, she served as a senior lecturer and researcher at Lightwave Communication Research Group (LCRG), UTM. She is currently a lecturer at Universiti Tun Hussein Onn Malaysia. Her research interest includes an optical devices and sensors for biomedical applications. She can be contacted at email: norhafizah@uthm.edu.my.


Khairulanwar Mokhiri received his Diploma in Electronic Engineering (Communication) from Politeknik Ibrahim Sultan (PIS) in 2014 and B.E in Electronic Engineering from Universiti Tun Hussein Onn Malaysia (UTHM) in 2019. He has involved in research on development of Ammonia spectrophotometer. Currently, he is working with Rapid Rail Sdn Bhd as a Quality Assurance Engineer for MRT Kajang Line. He can be contacted at email: khairulanwarmokhiri@gmail.com.

Afiqah Yaacob received her Bachelor degree from Universiti Teknologi Mara (UiTM). Currently, she is pursuing her Masters degree in Faculty of Electrical and Electronic Engineering, Universiti Tun Hussein Onn Malaysia (UTHM) in the field of spectrophotometer application. She can be contacted at email: chandanputeri@gmail.com.
Kim Gaik Tay is an Associate Professor of Applied Mathematics in the Faculty of Electrical and Electronic Engineering at Universiti Tun Hussein Onn Malaysia. Her research interests include Nonlinear Waves, Optical Solitons, Fiber Optics Parametric Amplifier (FOPA), Numerical Methods, Forecasting, Breast Cancer Classification and Dorsal Hand Vein Pattern Recognition using machine learning and deep learning techniques. She completed her Bachelor’s, Master and Ph.D. degrees in Applied Mathematics at Universiti Teknologi Malaysia. She is currently a member of the International Association of Engineers (IAENG) and Persatuan Sains Matematik Malaysia (PERSAMA). She can be contacted at email: tay@uthm.edu.my.
Nazrah Ilyana Sulaiman received her Bachelor Degree in Electrical and Electronic Engineering from Universiti Teknologi Malaysia (UTM). Currently, she is pursuing a part time Masters degree in Faculty of Electrical and Electronic Engineering, Universiti Tun Hussein Onn Malaysia (UTHM) in the field of Optical Sensor application. Presently working at Malaysia Marine and Heavy Engineering (MMHE) as Mechanical Completion Instrumentation Engineer, specialised in Field engineering, construction, installation, pre commissioning, Hook Up & Commissioning and Start Up of Topside platforms. She has completed a various Greenfield and Brownfield projects including onshore and offshore phases in Oil and Gas upstream industry with major clients namely PETRONAS , EXXONMOBIL, SHELL, TECHNIP, CHEVRON & AKER SOLUTIONS. She can be contacted at email: nazrahi.sulaiman@mmhe.com.my.