Nur Emileen Abd Rashid1, Nor Ayu Zalina Zakaria2, Zuhani Ismail Khan1 , Siti Amalina Enche Ab Rahim2, Nur Luqman Saleh3 1Microwave Research Institute, Universiti Teknologi MARA, Shah Alam, Selangor, Malaysia
2
Journal homepage: http://telkomnika.uad.ac.id
Keywords:

Email: emileen98@uitm.edu.my
1. INTRODUCTION
Corresponding Author:
ABSTRACT
Accepted Aug 20, 2022
Article history:
Received Aug 24, 2021
Revised Aug 09, 2022
Classification becomes one of the important elements in the forward scatter radar (FSR) micro sensors network. This classification performance is dependent on the target’s profile behaviour and the network’s surrounding; and one of the factors that cause the reduction of classification probability is the presence of ground clutter. As the volume of clutter increases, their masking effect becomes greater and may result in more significant errors in target classification. Hence, to reduce misclassification in the FSR sensor network, a new clutter reduction technique based on the ground clutter model is proposed. Simulated ground clutter is modeled based on the estimated signal to clutter ratio (SCR) of the received signal. The clutter effect is diminished by eliminating simulated like clutter from the receiving signals. The result shows improvement in the classification accuracy, especially for the minimum value of the SCR and this new technique uses only one database which will shorten the processing time and reduce the overall database’s size.
3Wireless and photonic network (WiPNET), Universiti Putra Malaysia, Serdang, Seri Kembangan, Selangor, Malaysia
The aforementioned techniques provide a strong indication of the classification system’s performance. Nonetheless, the classification system’s performance is influenced by the target’s profile
Clutter reduction technique
This is an open access article under the CC BY SA license.
Nur Emileen Abd Rashid Microwave Research Institute, Universiti Teknologi MARA 40450 Shah Alam, Selangor, Malaysia
ISSN: 1693 6930, DOI: 10.12928/TELKOMNIKA.v20i5.24090
955
School of Electrical Engineering, College of Engineering, Universiti Teknologi MARA, Shah Alam, Selangor, Malaysia
The performance of forward scatter radar (FSR) for detecting and classifying ground targets (human and vehicles) has been a subject of investigation in recent years [1] [12]. When a target crosses the radar baseline, the radio wave is partially obstructed and disturbed, resulting in a Doppler signature at the receiver. This signal can be used to detect targets, estimate parameters, track them, and perhaps perform automatic target classification (ATC).
Article Info
Forward scatter radar Radar Targetclutterclassification
TELKOMNIKA Telecommunication Computing Electronics and Control Vol. 20, No. 5, October 2022, pp. 955 962
The FSR micro sensors system is capable of correctly detecting and classifying ground targets, particularly under ideal or controlled settings [4] [8]. Numerous algorithms for pattern recognition have been developed, including the K nearest neighbour (KNN) and neural networks (NN) classifiers. In [6] demonstrated that by combining the output of principal component analysis (PCA) with the input of a KNN, the FSR classification performance above 90% accuracy even at low frequency. Following that, [10], [12] discussed how to improve classification performance using NN. The network’s inputs are the Z score parameters such as mean and standard deviation. While in [11], the time domain signal is analysed using the wavelet transformation approach for the goal of identification and classification.
Clutter reduction technique based on clutter model for automatic target classification in forward scatter radar
TELKOMNIKA Telecommun Comput El Control, Vol. 20, No. 5, October 2022: 955 962
956behaviour,
The outdoor measurement is conducted in the manner depicted in Figure 1. The testing scenario begins when a target moves with a velocity described by projections ���� and ����, and crosses the baseline at the position (0, ����) with a motion direction provided by angle. As the target approaches the baseline, the range between the transmitter target (����) and target receiver (����) fluctuates with time, resulting in a phase (Doppler) shift in the received signal. The received signal can be presented as: ����(��)=��(��)������[��(��)] (1)
2.1. Measurement setup and signal processing
which includes factors such as speed, crossing angles, crossing points, baseline length, and sensor placements, as well as the presence or absence of clutter [13], multiple targets [14] and other factors. This article will only discuss the effect of clutter on the FSR system and how it may be used to improve classificationClutterperformance.isanundesired signal from the environment that originates either internally or externally. Ground clutter may be caused by vegetation, precipitation such as rain, snow, or hail, as well as interference and multipath caused by buildings, the ground, and the sea. The FSR micro sensors network distributes sensors on the ground with a baseline length of hundreds of metres and also makes use of omnidirectional antennas at extremely low elevations. The existence of swinging foliage and wind blown branches nearby sensors could be considered volume distributed scatterers whenever the sensors are surrounded by vegetation. Due to the non directional nature of the antennas and the lack of range resolution, clutter accumulated from a bigger volume.
ISSN: 1693 6930
On an empty concrete field with a baseline distance of 50 m, an outdoor experiment was conducted to gather target signals in a clutter free environment (assumed to have a low vegetation clutter level). Four continuous wave carrier frequencies are simultaneously transmitted in the very high frequency (VHF) (60 MHz 150 MHz) and ultra high frequency (UHF) (400 MHz) bands. This experiment incorporated 200 signals from four different vehicle types: vehicle 1 (4.3 m × 1.4 m, hatchback), vehicle 2 (4.4 m × 1.4 m, hatchback), and vehicle 3 (4.7 m × 1.9 m, sport utility vehicles (SUV)). In this research, the system’s ability will be evaluated to distinguish between similar vehicles, particularly when certain characteristics are present especially when specific applications are applied for example road statistic or automatic tolling system.
The target signature, ��(��) varies with target radar cross section (RCS), which is entirely specified by the target geometrical cross section (silhouette), propagation loss, ����(��), ����(��) along the transmitter target and target receiver paths. Other parameters involved in target detection are the transmit power, ���� and the antenna gains, ���� and ���� where it remains constant. The envelope of the received signal is written as:
2. RESEARCH METHOD
The impact of clutter or noise on the FSR classification systems have been studied previously [15], [16] Numerous signal to clutter ratios (SCR) have been simulated from 0 dB to 30 dB where few possible sources of error were taken into accounts such as erroneously estimate the speed of the target and target spectrum’s shape deformation. Changes in the classification performance can be perceived as SCR level is decreased; which could cause false classification. It has shown almost no effect on the classification accuracy (except for the lowest SCR) due to speed estimation error, which exhibits the robustness of the speed estimation algorithm towards clutter. However, when it comes to the spectrum’s shape deformation error, the effect can be detected even when the clutter power is small. Based on this analysis, it can be concluded that the main source of error which can degrade ATC performance is due to the target’s spectrum shape deformation. By taking into account both sources of error at the same time, it was discovered that the classification performance declines dramatically for SCR below 20 dB, particularly at 64 MHz, when the classification accuracy plummeted from 80% to almost 20% Consequently, the clutter compensation technique has been introduced to eliminate this effect. Different database for a different level of clutter has been implemented. This new technique demonstrates some enhancements where the classification accuracy increases by 20% for SCR = 0 dB However, this technique introduces a large size of the database which contributes towards longer processing time and a lower percentage of accuracy (less than 50%) for SCR below 15 dB.
Hence, in this paper, a new technique is proposed which provides a promising improvement in the system performance while considering a more realistic solution by implementing the clutter reduction technique (CRT) based on the ground FSR clutter model. By using this technique, only one database which consists of original target signatures is used. The paper starts with describing FSR configuration and ATC, followed by a discussion on the ground FSR clutter model. Then, the improvement of the ATC system is presented and discussed including the integration of the ground FSR clutter model with clutter reduction technique. The final section summarizes the outline of future work in the FSR network research
In general, a classification system’s standard approach is divided into two stages: training and testing. During the training stage, a model for each vehicle is constructed using the training data set (this is done using the power spectrum density (PSD) values of the entire feature vector), and during the testing stage, a PCA based feature vector is extracted from an unknown received vehicle signal. However, due to the scarcity of data in this research, all recorded signals were employed alternately in classification trials rather than dividing the database into training and testing sections. To make it feasible, a leave one out approach was adopted, in which only one vehicle signal was used for testing at a time, while the remaining signals were used for Aftertraining.that,the Euclidean distance between this feature vector and all feature vectors associated with trained models is determined. The test data is sorted into the most prevalent class among its K nearest neighbours. If the allocated group and the test data’s actual group match, the classification is termed successful.
������ =10log(���� ���� ) (4)
957 ��(��)=√������������ 4����(��) ��2 ����(��)����(��) (2)
∆�� = �� ��
By utilising signal processing techniques, it is possible to extract important information for classification, such as the target’s speed and feature. When a target crosses the transmitter receiver baseline, the sensors can relay the pre detection signal to headquarters over a wireless network. The received signal will be processed further in the ATC algorithm block, where it will contain information on the target’s silhouette and speed.

Clutter reduction technique based on clutter model for … (Nur Emileen Abd Rashid)
Figure 1. The outdoor measurement topology
Where ���� and ���� are the total power of the signal and total power of the clutter, respectively.
2.2. Errors due to the presence of clutters in FSR system
As a result, pre processing of the spectrum is required before it can be used as a feature vector in the classification system. The target is then classified using a feature vector. The spectral feature vector obtained at the speed normalisation block’s output has a high degree of dimension and the features are highly linked. As a result, principal component analysis (PCA) is utilised to reduce the dimensionality of the data. PCA’s output is then used for classification, either as training or testing data.
The signal that has been received passes through a process called the fourier transform (FT), which converts it into the frequency domain. In this domain, the spectrum displays the Doppler components that are present in the signal. Technically speaking, the speed of the target has an effect on the spectrum since the major lobe of the spectrum’s bandwidth depends on the speed ��, as well as the length of the target ��, and the equation for this is: (3)
TELKOMNIKA Telecommun Comput El Control
A time domain simulated non stationary clutter signal is added to the received vehicle signature at different SCRs (from 0 dB to 30 dB, in 5 dB steps) in order to introduce the effect of clutter into the FSR system and ensure continuous improvement. Low SCR values are used in this research to simulate the worst case scenario, particularly in the presence of natural disasters, where the clutter signal is greater than the target’s Doppler. The SCR is defined as the (4)
As mentioned earlier, the presence of clutter in the target’s signal introduces two possible sources of error in the ATC system: error due to speed estimation and error due to signature deformation. The speed estimation error is the inaccuracy caused by the speed estimation algorithm estimating the speed incorrectly. In the real world, a cluttered received signal is used to determine the target’s speed and as an input to the classification process. As previously stated, the bandwidth of the spectrum’s main lobe ���� is dependent on the speed �� and the length of the target l; consequently, when the speed normalisation method is applied, the spectrum may not be appropriately rescaled due to the erroneous ratio between the estimated and reference speeds. Clutter level diverges with the surroundings. As the clutter level varies, the amplitude of the signal fluctuates and the shape of the signal distorts which introduces signature deformation error As the SCR level lowers, the PCA components for each type of target become more spread out, resulting in increased overlap across the various targets. This leads to a decrease in classification performance. The reader is prompted at [18], [20] for more technical information on the subject matters.
������(��)=������(��) ����2(��) (6)
The clutter received signal, ����(��) is a randomly generated clutter received signal which is generated by employing the clutter simulation model described in [17] [19]. The signal is then bypassing a white Gaussian noise through a low pass filter with a cut off frequency that varies depending on the frequency being used; this generates simulated clutter which is similar to the measured clutter spectrum. The simulated cluttered received signal,������(��) is given by (5)
This article proposed a novel technique for compensating for clutter that is based on the FSR ground clutter model. After receiving the cluttered received signal, it is necessary to acquire an estimate of the noisy conditions. The ratio of signal to clutter energy, SCR, is determined using (4). As illustrated in Figure 2, the energy of the clutter is then evaluated using signal samples taken before and after the target signal is identified.Another set of random clutter is simulated using the clutter modelling parameters [17], [19]. The clutter power level ������2 is modified in accordance with the computed SCR and signal power of the received clutter signal acquired in the preceding step. The simulated clutter signal ����2(��) is then subtracted from the cluttered received signal, where the subtracted clutter signal ������(��) is defined as:
958
TELKOMNIKA
2.3. CRT based on ground fsr clutter model
ISSN: 1693 6930 Telecommun Comput El Control, Vol. 20, No. 5, October 2022: 955 962
������(��)=����(��)+����1(��) (5)
Where ����(��) is the received signal from target detection in section 2.1, (1).
Any classification system’s performance rapidly declines as the discrepancy between training and test conditions increases. Numerous efforts have been made to correct for the effect of noise in a variety of domains of pattern recognition, including automatic voice recognition. Numerous methods for minimizing the influence of noise have been proposed, including filtering prior to classification [20], [21], model based noise compensation [22], [23], noise resistant feature extraction [24], and numerical simulation [25].

������(��) is then run through a bandpass filter to remove any leftover noise and smooth the signal before continuing with the classification procedure. The denoised signal, ����, is the result of this procedure. Figure 2 illustrates the time domain signals for the original, cluttered, and denoised signals.
Figure 2. Target signals: original, with 0 dB clutter and after denoising process
Telecommun
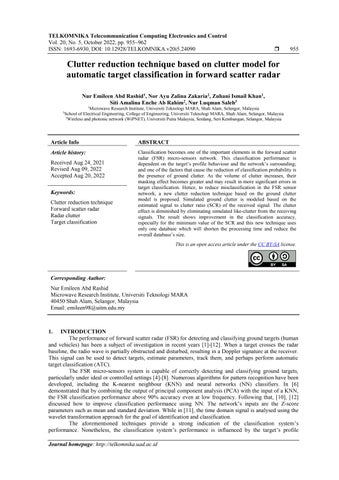
Plots of data from various SCR levels are made against this database. PCA plots for SCR = 0 dB and SCR = 30 dB are shown in Figure 3(a) and Figure 3(b). The figures demonstrate that, with the exception of a few outliers, the positions of both SCRs data are highly correlated. This discrepancy could be explained by residual clutter in the signal, particularly at SCR = 0 dB.
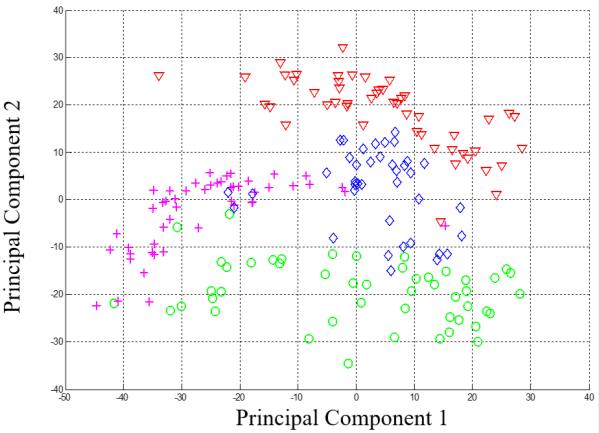

Table 1(a), Table 1(b), and Table 1(c) compare the percentage of correctly classified instances for four different types of vehicles at three different frequencies and with varying SCR levels. The tabulated statistics demonstrate the classifications’ exceptional accuracy, particularly for vehicle 4, where 100% classification was achieved at 151 MHz. This is clearly related to vehicle 4’s physical shape, which is larger and has more defined edges (rectangular shape) than other cars. Apart from that, for SCR values more than 20 dB, the results indicate a high degree of classification accuracy, except for vehicle 1 at 64 MHz and vehicle 3 at 434 MHz. This is because the design and dimensions of both vehicles are close to those of vehicle 2, and hence both were incorrectly classed as vehicle 2. While 434 MHz should theoretically provide a larger radar cross section and more frequency information about the target signal, and 64 MHz should provide lesser propagation loss and clutter, what is fascinating about this data is that 151 MHz performs the best of these frequencies. This could be because 151 MHz has less propagation loss/clutter than 434 MHz and more frequency information than 64 MHz. Thus, 151 MHz is the optimal frequency because it compromises betweem 64 MHz and 434 MHz.
Four different vehicle signals at 3 different frequencies are utilised to determine the efficacy of the clutter reduction strategy based on the clutter model. Previously, the clutter reduction technique is based on several SCR databases is applied. In this study, a single database with SCR = 30 dB (original measured signal) is used, but other parameters such as the number of k for KNN and the number of PCAs (��������) stay constant (�� =3 and �������� =3).
Figure 3. PCA plots for a different level of SCRs after clutter reduction technique at frequency 151 MHz when (a) SCR 0 dB and (b) SCR 30 dB, (notation: vehicle 1 ( ), vehicle 2 (◊), vehicle 3 (O), and vehicle 4 (+))
(a) (b)
TELKOMNIKA Comput
959
El Control
3. RESULTS AND ANALYSIS
Clutter reduction technique based on clutter model for … (Nur Emileen Abd Rashid)
Simultaneously, the target’s speed is measured and the denoised data is converted to the power spectrum. Prior to further processing, the feature that contains enough information to discriminate between distinct classes and is as noise resistant as possible is chosen. The frequency range of the spectrum is determined using knowledge about the signal’s and clutter’s qualities. It is well established that clutter is concentrated in the low frequency region of the spectrum between 0.5 Hz and 1 Hz of the Doppler band, but the target signature may occupy a broad Doppler range.
Additionally, to the preceding approach, there is no requirement to assess the complete spectrum of the target for ATC purposes. This is because the difference between different sorts of targets is visible only at the power spectrum’s highest point, which is within 20 dB of its maximum value of 0 dB; roughly 0.5 Hz 7 Hz (depends on the carrier frequency). As a result of this information, the extremely low and very high frequency bands of the spectrum are omitted from the subsequent stages of feature extraction. As a result, the classification system receives as input only the highlighted portion of the signal spectrum.
Vehicle classification confusion matrices SCR Vehicle 1 Vehicle 2 Vehicle 3 Vehicle 4
(b) 151 MHz 0 60 82 63 68 5 85 90 63 88 10 83 92 82 92 15 88 92 84 96 20 93 92 88 96 25 93 92 88 96 30 93 92 88 96
Figure 4 depicts the average percentage of classification accuracy using automatic target classification clutter compensation (ATC CC), with ATC CC and CRT at different frequencies. As can be seen from the graph, classification performance improves as the SCR increases. Interestingly, the clutter reduction strategy significantly improves the classification accuracy of 64 MHz, particularly for SCR = 0 dB 5 dB, where accuracy increases by more than 50% and continues to improve as SCR grows. As the graph indicates, the same performance is observed at 151 MHz and 434 MHz. However, for SCR values more than 20 dB at 151 MHz, when the clutter impact is negligible, the result indicated that improved performance can be observed without using CRT. This is due to the fact that the database was not corrupted by simulated clutter. Additionally, as compared to other frequencies, 151 MHz strikes a balance between clutter and data gathered from the target signature. Overall, these results indicate that an increase in classification accuracy of at least 30% is possible for signal to noise ratio (SNR) less than 10 dB at all frequencies. Additionally, the CRT based on the FSR ground clutter model outperforms the clutter compensation (ATC CC) model. As demonstrated in the graph, with SCR = 0 dB, a greater than 30% improvement in accuracy can be observed at all frequencies for CRTs with a percentage of accuracy greater than 68% CRT performance improves as the number of SCR grows, reaching 90% accuracy for SCR greater than 15 dB. Interestingly, both approaches operate comparably well at 151 MHz, as the SCR is greater than 20 dB. However, at other frequencies, the FSR ground clutter model CRT outperforms ATC CC. Overall, our results demonstrate that CRT significantly improves classification of ground vehicles, even those with similar shapes and dimensions and operating at varying frequencies, without requiring a large database.

Table 1. Vehicle classification confusion matrices at (a) 64 MHz, (b) 151 MHz, and (c) 434 MHz
ISSN: 1693 6930 Comput El Control, Vol. 20, No. 5, October 2022: 955 962
960
TELKOMNIKA Telecommun
(a) 64 MHz 0 55 98 69 84 5 75 98 86 84 10 80 98 86 96 15 83 98 88 96 20 83 98 88 96 25 83 98 90 96 30 83 98 90 96
(c) 434 MHz 0 73 96 90 92 5 88 98 92 98 10 88 98 94 100 15 93 98 94 100 20 93 98 94 100 25 93 98 94 100 30 93 98 94 100
Figure 4. Comparison of classification accuracy before and after the use of ATC CC, as well as between ATC CC and CRT
ACKNOWLEDGEMENTS
[9] N. H. A. Aziz and R. S. A. R. Abdullah, “Speed Recognition Based PCA on Ground Vehicle in Passive Forward Scattering Radar,” Journal of Telecommunication, Electronic and Computer Engineering, vol. 8, no. 3, pp. 133 137, 2016. [Online]. Available: https://core.ac.uk/download/pdf/229267341.pdf
[7] M. Gashinova, V. Sizov, N. A. Zakaria, and M. Cherniakov, “Signal Detection in Multi Frequency Forward Scatter Radar,” The 7th European Radar Conference, 2010, pp. 276 279. [Online]. Available: https://ieeexplore.ieee.org/document/5614901
[5] C. Hu, T. Zeng, and C. Zhou, “Accurate Three Dimensional Tracking Method in Bistatic Forward Scatter Radar,” URASIP Journal on Advances in Signal Processing, no. 66, 2013, doi: 10.1186/1687 6180 2013 66.
[10] N. H. A. Aziz and M. A. Md Thani, “Vehicle Classification Using Passive Forward Scattering Radar,” Advanced Science Letters, vol. 23, no. 11, pp. 11432 11436, 2017, doi: 10.1166/asl.2017.10299.
961
[2] C. Hu, T. Long, C. Mikhail, and X. L. Li, “Forward scattering micro radars for situation awareness,” 2009 2nd Asian Pacific Conference on Synthetic Aperture Radar, 2009, pp. 231 234, doi: 10.1109/APSAR.2009.5374099
[11] N. F. Abdullah, N. E. A. Rashid, Z. I. Khan, and I. Musirin, “Analysis Of Different Z Score Data to The Neural Network for Automatic FSR Vehicle Classification,” IET International Radar Conference 2015, 2015, pp. 1 5, doi: 10.1049/cp.2015.1089
4. CONCLUSION
[1] R. S. A. R. Abdullah, M. F. A. Rasid, M. W. Azis, and M. Khalafalla, “Target prediction in Forward Scattering Radar,” 2007 Asia Pacific Conference on Applied Electromagnetics, 2007, pp. 1 5, doi: 10.1109/APACE.2007.4603914
[8] L. X Liang, H Cheng, and Z. Tao, “The Analysis of Multi polarization Forward Scattering RCS and the Effect on Target Classification and Identification,” Journal of Electronics & Information Technology, vol. 32, no. 9, pp. 2191 2196, 2010, doi: 10.3724/SP.J.1146.2009.01233.
[6] M. Cherniakov, M. Salous, V. Kostylev, and R. Abdullah, “Analysis of forward scattering radar for ground target detection,” European Radar Conference, 2005. EURAD 2005., 2005, pp. 145 148, doi: 10.1109/EURAD.2005.1605586.
[12] K. A. Othman, M. I. Jusoh, N. E. A. Rashid, and C. W. F. C. W. Fadhil, “Wavelet Technique Implementation in Forward Scattering Radar (FSR) Ground Target Signal Processing,” Journal of Telecommunication, Electronic and Computer Engineering (JTEC), vol. 9, no. 1 5, pp. 59 62, 2017. [Online]. Available: https://web.archive.org/web/20180417084300id_/ http://journal.utem.edu.my/index.php/jtec/article/viewFile/1835/1124
TELKOMNIKA Telecommun Comput El Control
[18] N. N. Ismail, N. E. A. Rashid, Z. I. Khan, N. E. A. Rashid, and M. F. Abdul Rashid, “Measurement, processing and modeling of a tropical foliage clutter using Forward Scatter Radar micro sensor network with VHF and UHF bands,” 2015 International Conference on Radar, Antenna, Microwave, Electronics and Telecommunications (ICRAMET), 2015, pp. 76 81, doi: 10.1109/ICRAMET.2015.7380778
REFERENCES
[3] A. D. Luca, “Forward Scatter Radar: Innovative Configurations and Studies,” PhD Thesis, University of Birmingham, 2018. [Online]. Available: https://etheses.bham.ac.uk//id/eprint/8669/1/De_Luca18PhD.pdf
[16] M. Gashinova, M. Cherniakov, N. A. Zakaria, and V. Sizov, “Empirical Model of Vegetation Clutter in Forward Scatter Radar Micro Sensors,” 2010 IEEE Radar Conference, 2010, pp. 899 904, doi: 10.1109/RADAR.2010.5494494.
Clutter reduction technique based on clutter model for … (Nur Emileen Abd Rashid)
[19] L. Karray and A. Martin, “Towards improving speech detection robustness for speech recognition in adverse conditions,” Speech Communication, vol. 40, no. 3, pp. 261 276, 2003, doi: 10.1016/S0167 6393(02)00066 3.
[21] D. Kumlu and I. Erer, “Clutter removal techniques in ground penetrating radar by using non local means approach,” Journal of the Faculty of Engineering and Architecture of Gazi University, vol. 35, no. 3, pp. 1269 1284, 2020. [Online]. Available: https://dergipark.org.tr/en/download/article file/1039916
[15] M. B. Porfido, M. Martorella, M. Gashinova, and M. Cherniakov, “Sea Clutter Power Reduction in Pulse Forward Scatter Radar,” 2018 19th International Radar Symposium (IRS), 2018, pp. 1 9, doi: 10.23919/IRS.2018.8448221
[13] C. Cao, J. Zhang, J. Meng, X. Zhang, and X. Mao, “Clutter Suppression and Target Tracking by the Low Rank Representation for Airborne Maritime Surveillance Radar,” in IEEE Access, vol. 8, pp. 160774 160789, 2020, doi: 10.1109/ACCESS.2020.3021124.
[17] J. B. Billingsley, Low angle Radar Land Clutter: Measurements and Empirical Models, William Andrew Publishing, 2002. [Online]. Available: https://books.google.co.id/books/about/Low_angle_Radar_Land_Clutter.html?id=FEkn0 h7sz0C&redir_esc=y.
[20] P. Jancovic and M. Kokuer, “Incorporating the voicing information into HMM based automatic speech recognition in noisy environments,” Speech Communication, vol. 51, no. 5, pp. 438 451, 2009, doi: 10.1016/j.specom.2009.01.003.
This paper presents a novel technique for decluttering based on the clutter model. The results demonstrate the technique’s efficacy in a cluttered FSR environment. Even when the power clutter is identical to the strength of the vehicle’s signal with SCR equal to 0, the minimum classification accuracy is around 70%. Clutter reduction techniques based on the FSR clutter model can help reduce overall processing time and database size. Additionally, regardless of the amount of clutter in the signal, the system can be automatically adjusted to the present condition, which minimises the system’s complexity indirectly. For future work, other clutter reduction approaches or classification strategies can be investigated to increase the ATC system’s performance when there is a high level of clutter in the surrounding.
[4] C. Zhang, C. Liu, C. Hu, and X. Liu, “Statistical analysis and simulation method of forward scattering clutter in bistatic radar,” IET International Radar Conference 2013, 2013, pp. 1 6, doi: 10.1049/cp.2013.0479
[22] P. Jancovic, X. Zou, and M. Kokuer, “Speech Enhancement Based on Sparse Code Shrinkage Employing Multiple Speech Models,” Speech Communication, vol. 54, no. 1, pp 108 118, 2012, doi: 10.1016/j.specom.2011.07.005.
This research is fully supported by UiTM grant, 600 RMC/MYRA 5/3/LESTARI (009/2020). The authors would like to thank Research Management Institute (RMI) and Universiti Teknologi MARA for all the supports.
[14] H. Zeng, C. Hu, and T. Li, “The signal to noise ratio analysis of ground forward scattering radar,” 2009 IET International Radar Conference, 2009, doi: 10.1049/cp.2009.0334.
Siti Amalina Enche Ab Rahim received the Diplôme d’Ingénieur in electronics and communications engineering from Ecole National Superieur d’Electronique et de Radioelectricite de Grenoble (ENSERG), Grenoble, France in 2008 and received her D.Eng in electrical and electronics engineering from Kyushu University, Japan in 2017. In 2009, she joined Telekom Research & Development Sdn. Bhd (TMRND), Cyberjaya, Malaysia as a researcher, before joining Universiti Teknologi Mara, (UiTM), Shah Alam, Malaysia as a lecturer in 2017. Her current research interests include the design of RF passive components and RF CMOS integrated circuits. She can be contacted at email: amalinaabr@uitm.edu.my
[25] H. Kikuchi, E. Yoshikawa, T. Ushio, and Y. Hobara, “Clutter Reduction for Phased Array Weather Radar Using Diagonal Capon Beamforming with Neural Networks,” IEEE Geoscience and Remote Sensing Letters, vol. 17, no. 12, pp. 2065 2069, 2020, doi: 10.1109/LGRS.2019.2962558
Nur Luqman Saleh is currently a research associate at Department of Computer and Communication System Engineering, Faculty of Engineering, Universiti Putra Malaysia. He received his Bachelor Degree in Electronic Engineering, Majoring in Microwave and Communications in 2012 from the Multimedia University (MMU), Cyberjaya Malaysia. In 2014, the author received his Master Degree of Engineering Management from Universiti Putra Malaysia (UPM), Serdang, Malaysia. He completed his Ph.D. program in Communications and Network Engineering at Universiti Putra Malaysia (UPM), Serdang, Malaysia in 2020. His research interest related to human echolocator, radar applications, signal processing and data analytic. Prior pursuing his post graduate study, he was served as application support engineer at telecommunications company. He can be contacted at email: nurluqmansaleh@gmail.com
962
Nur Emileen Abd Rashid is currently a Senior Lecturer at University Technology MARA. She obtained the Bachelor of Electrical Engineering (Telecommunication Engineering) from the Universiti Kebangsaan Malaysia in 2001 and subsequently her M.Sc. in Computer, Communication and Human Centered Engineering from the University of Birmingham, UK in 2002. She pursued her studies and received her PhD in 2011 from the same university. She has contributed much of her expertise in areas related Radar Technology, Telecommunication signal processing and clutter modelling. Dr. Nur Emileen is an active member of IET, IEEE and MyRAN. She can be contacted at email: emileen98@uitm.edu.my.
ISSN: 1693 6930
Nor Ayu Zalina Zakaria is currently a Senior Lecturer in School of Electrical Engineering, College of Engineering, University Teknologi MARA, Malaysia and has almost 18 years working experience in an engineering education. She obtained her PhD degree in Radar Technology from University of Birmingham, United Kingdom in 2017. She received her BEng (Hons) in Electronics and Telecommunication Engineering from University Malaysia Sarawak and Master in Mobile and Satellite Communication Engineering from University of Surrey, United Kingdom in 2000 and 2003 respectively. Her areas of interest mainly in radar technology particularly, radar detection and related work in clutter analysis for forward scatter radar. She can be contacted at email: norayu713@uitm.edu.my.


TELKOMNIKA Telecommun Comput El Control, Vol. 20, No. 5, October 2022: 955 962
BIOGRAPHIES OF AUTHORS
[24] T. Pető and R. Seller, “Adaptive Clutter Cancellation Techniques for Passive Radars”, Topics in Radar Signal Processing, Graham Weinberg, IntechOpen, 2017, doi: 10.5772/intechopen.71289.

[23] N. Smitha and V. Singh, “Clutter Reduction Techniques of Ground Penetrating Radar for Detecting Subsurface Explosive Objects,” 2016 International Conference on Information Communication and Embedded Systems (ICICES), 2016, pp. 1 8, doi: 10.1109/ICICES.2016.7518852.


Zuhani Ismail Khan is an Electrical and Electronic Engineer, graduated from University of Bradford, UK in 1998. After joining UiTM in the year 2000, she pursued her MSc in Computer and Information Engineering at International Islamic University Malaysia and completed it in 2005. She then completed her PhD in Electrical Engineering at Universiti Teknologi MARA, UiTM in 2015 where she was involved in designing RF filters. Her research background concentrates on Microwave and RF devices for high frequency system. On October 2019 she was appointed as the head of research in microwave research institute (MRI) and currently she holds the post of Deputy Director of the institute. She can be contacted at email: zuhai629@uitm.edu.my.