Article Info
Received Dec 10, 2021
This is an open access article under the CC BY SA license.

Revised Jul 18, 2022
Cervical cancer diagnosis based on cytology pap smear image classification using fractional coefficient and machine learning classifiers
TELKOMNIKA Telecommunication Computing Electronics and Control Vol. 20, No. 5, October 2022, pp. 1091~1102
ABSTRACT
Corresponding Author: Madhura DepartmentKalbhorofComputer Engineering, Pimpri Chinchwad College of Engineering Pune, Email:Indiakalbhormadhura11@gmail.com
ISSN: 1693 6930, DOI: 10.12928/TELKOMNIKA.v20i5 22440 1091
2Department of Electronics and Communication Engineering, Karunya Institute of Technology and Sciences, Tamil Nadu, India
Cervical cancer accounts for around 6% to 29% of all malignancies in women in India. The age adjusted overall incidence of cervical cancer varies significantly between registries, with the high rate 23.07/100,000 at Mizoram and the low rate 4.91/100,000 at Dibrugarh district. Visual inspection with acetic acid (VIA) have sensitivity of 67.65% and specificity of 84.32%, magnified VIA have sensitivity and specificity 65.36% and 85.76% respectively, visual inspection with Lugol’s iodine (VILI) has sensitivity of 78.27% and specificity of 87.10%, cytology (pap smear) has sensitivity 62.11% and Specificity 93.51, and
Article history:
Keywords: Cytology image DCT transform Haar PapMachinetransformlearningsmear
1. INTRODUCTION
Journal homepage: http://telkomnika.uad.ac.id
1Department of Computer Engineering, Pimpri Chinchwad College of Engineering, Pune, India
Doctors and pathologists have long been concerned about determining the malignancy from cell images. This task is laborious, time consuming and needs expertise. Due to this reason, automated systems assist pathologists in providing a second opinion to arrive at accurate decision based on cytology images. The classification of cytology images has always been a difficult challenge among the various image analysis approaches due to its extreme intricacy. The thrust for early diagnosis of cervical cancer has always fuelled the research in medical image analysis for cancer detection. In this paper, an investigative study for the classification of cytology images is proposed. The proposed study uses the discrete coefficient transform (DCT) coefficient and Haar transform coefficients as features. These features are given as a input to seven different machine learning algorithms for normal and abnormal pap smear images classification. In order to optimize the feature size, fractional coefficients are used to form the five different sizes of feature vectors. In the proposed work, DCT transform has given the highest classification accuracy of 81.11%. Comparing the different machine learning algorithms the overall best performance is given by the random forest classifier.
Accepted Jul 28, 2022
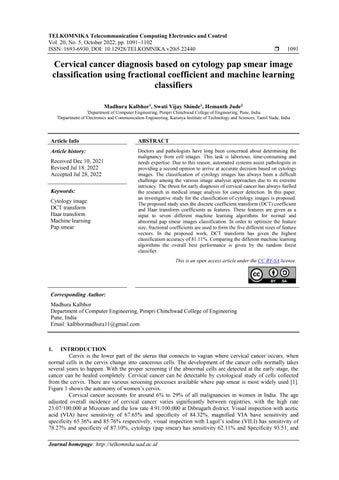
Cervix is the lower part of the uterus that connects to vagian where cervical cancer occurs, when normal cells in the cervix change into cancerous cells. The development of the cancer cells normally takes several years to happen. With the proper screening if the abnormal cells are detected at the early stage, the cancer can be healed completely. Cervical cancer can be detectable by cytological study of cells collected from the cervix. There are various screening processes available where pap smear is most widely used [1]. Figure 1 shows the autonomy of women’s cervix.
Madhura Kalbhor1, Swati Vijay Shinde1 , Hemanth Jude2
1. Autonomy of women cervix
5) Detailed analysis of results obtained by the proposed technique using accuracy, false positive rate precision, recall, mean square error and mean absolute vale of error.
Various attempts have been made by different researchers to automate the pap smear test which will assist the pathologists to accurately predict cervical cancer and with less time and effort. Most of the work focuses on cytology and histopathology images analysis to predict cancer. Artificial Intelligence also has great potential to provide faster and cheaper screening methods [3] as it is facilitated with a wide range of optimization algorithms [4] [7]. In the proposed research work the cytology image classification is done by extracting energy coefficients as features from the pap smear cytology image and machine learning classifiers are used to predict the abnormal and normal cancer cells. Following are the main contributions of the proposed work:
4) Feature size reduction using the fractional energy coefficients.
Arya et al [8] has used the texture features and to recognize the contour of the nucleus and cytoplasm 1st order histogram, discrete wavelet transform local binary patterns and gray level co occurrence matrix are used. To classify the single cell images artificial neural network and support vector machine are used. Chankong et al. [9] proposed a single core thresholding method based on edge and patch based fuzzy C means clustering to remove cell edges to preserve sharpness of nucleus boundaries. Bora et al. [10] extracted
1) A novel technique for cytology image classification using the transformed image energy coefficient and machine learning classifier.
2. LITERATURE SURVEY
3) Classification using machine learning classifiers like simple logistic, Bayesnet, Naïve Bayes, random tree, random forest, decision table, and part
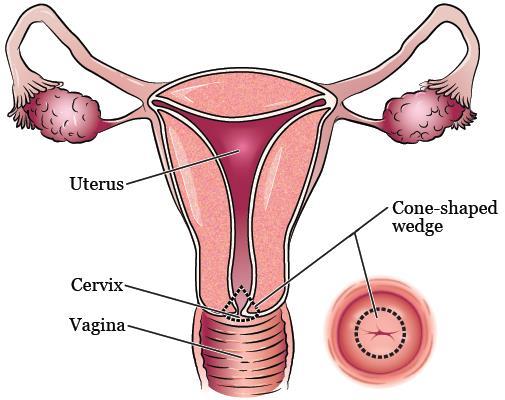
Figure 2. Development of cervical cancer
2) Feature extraction from pap smear cytology images using two transforms: discrete cosine transform and Haar transform.
TELKOMNIKA Telecommun Comput El Control, Vol. 20, No. 5, October 2022: 1091 1102
There is various image classification techniques proposed in literature which are based on the spatial or the transformed contents of the image. The various contents can be the colors, textures or shapes in the images that can be used as features to classify the image in one of the predefined classes. In cytology image classification, the feature vectors are attributes of the nucleus or the cytoplasm of a cell such as shape or morphology of a cell, perimeter, area, eccentricity and thinness ratio.
ISSN: 1693 6930
papillomavirus have 77.8% and 91.54%, respectively [2]. High quality cytology screening may not be feasible for wide scale implementation in developing countries due to a lack of necessary infrastructure and quality control. As a result, cervical cancer screening programmes based on automated pap smear image analysis should be implemented as an integral part of primary health care infrastructure in resource constrained countries.The normal cervix when gets infected from the papillomavirus, the normal cell develops into the precancerous lesions [1]. The precancerous lesions can be tested with various screening methods to find the abnormalities in the cervix. If the human papillomavirus (HPV) infection persists for a longer period the precancerous lesions develop into cervical cancer. The overall development of the cervical cancer process is shown in Figure
2.Figure
1092human
color and texture features using generalized gaussian density descriptors of ripplet type I transform and the second order statistics of gray level co occurrence matrix. Edge detection with a fuzzy system is used to segment cytoplasm and nucleus. Hemalatha and Rani [11] suggested that the proposed enhanced edge detection technique based on a fuzzy approach gives better accuracy for cervical cancer detection. Bhargava et al. [12] extracted histogram of oriented gradients features from segmented cervical cells and performed classification to categorize the cervical cells into cancer and non cancerous using artificial neural network, k nearest neighboring and support vector machine All the methods proposed above depend particularly on the segmentation of nucleus and cytoplasm features; they usually detect only round shapes, are rigid rules that are not flexible, edge detection subject to user defined parameters, and energy minimization consumes time. To overcome these problems, deep learning methods are proposed by other researchers.
Control
TELKOMNIKA Telecommun Comput El
1093
Table 1. Summary of recent work done on pap smear cytology image classification using deep learning Reference Year Dataset Method Number of classes [19] 2021 Mendeley LBC SIPaKMed ResNet 50 + VGG 16+ DenseNet 121 + Inception v3) and PCA, GWO 4
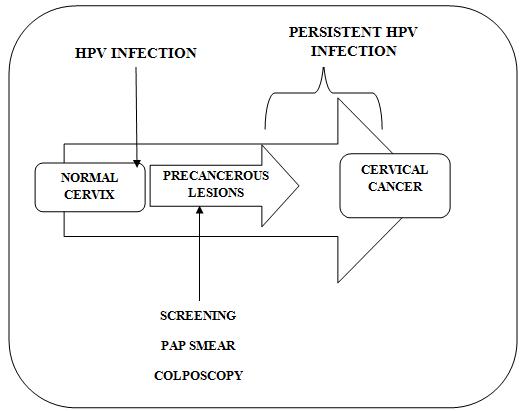
Basic principle used for cervical cancer diagnosis is the cytology image classification. During the classification process; there are three phases: pre processing, feature extraction and classification in one of the predefined classes; here in the pre processing stage image resizing is done to get the equal size of the feature vectors. The two different transforms are experimented to get the energy coefficients that are used as the feature from the cervical cytology images. The different feature size vectors are formed by using the proposed row mean of the fractional energy coefficient method. These different size feature vectors are experimented with seven different machine learning classifiers to get the best classification accuracy. The block diagram of the proposed methodology is shown in Figure 3.
Cervical cancer diagnosis based on cytology pap smear image classification using … (Madhura Kalbhor)
3. PROPOSED WORK
Deep learning ResNet 152 5 [22] 2021 SIPaKMeD
The deep learning models have proven to have high accuracy but the implementation of the deep learning architectures necessitates a large amount of data and memory computation [25]. So along with these basic contents the transform domain is explored for image compression and image classification. To generate the transformed content of the images different orthogonal transforms are used. Orthogonal transforms help in better energy compaction. Various transforms proposed in literature are Cosine, Sine, Walsh, Kekre, Haar, Hartley, Slant, and Hardmard [26]. Up to our knowledge transform contents are not yet used to classify the cytology pap smear image. In this paper discrete coefficient transform (DCT) and Haar transform are used.
The deep learning approach reviewed in [13] can directly process raw images and offers automated learning of features based on specific objective functions such as detection, segmentation and classification. Different existing pre trained models like ResNet 50, ResNet 152, and visual geometry group (VGG) are used in the literature for classification of pap smear images. For segmentation the mask R CNN is applied on the whole slide cell image, outperforming the previous segmentation method in precision, recall and ZSI. For classification, VGG like Net is used on whole segmented cells in [14]. In the case of cervical cancer, Xiang et al [15] developed a deep learning method based on convolutional neural networks (CNN) with YOLOv3 as the baseline model. To improve classification performance, an additional task specific classifier was added. The presence of untrustworthy annotation was handled by smoothing the distribution of noisy labels. The evaluation revealed that the model has a high sensitivity but a low specificity. Rahaman et al [16] proposed a hybrid deep feature fusion that archives high classification accuracy with deep feature and commented it is better than other methods that depend on segmentation of nucleus and cytoplasm hand crafted features.Various models for cervical cancer diagnosis based on deep convolutional neural networks, including Alexnet, VGGnet, Resnet, and GoogleNet architectures are explored in literature [17]. In [18] authors proposed transfer learning based feature extraction using DarkNet19 or DarkNet53 networks in an exemplar pyramid structure and the proposed feature generator creates 21,000 features. Table 1 shows the summary of recent research for automatically classifying the pap smear cytology images using deep learning.
[20] 2021 MoticSIPaKMedSubset1 Graph convolutional network 75
[21] 2021 SIPaKMeD
Deep learning Compact VGG 5 [23] 2021 SIPaKMeD Ensemble of CNN Models 2 [24] 2020 SIPaKMeD AlexNet 5
Step 3: as shown in (2) calculate row mean.
ISSN: 1693 6930
1094
3.5. Feature vector generation
3.2. Feature extraction
Figure 3. Proposed methodology block diagram
The size of the input image should be same for all the images as feature formed should also be of the same size. The images from the standard dataset are of different sizes so the input images are resized before extraction of features. All the training and testing images are resized to 256×256
3.4. Row mean
Where, T = orthogonal transform matrix and ��′ = column transformed image
[��]×��(��,��) = ��′(��,��) (1)
�������������������������� = ������������������1 ��������������������
Row mean refers to the set of averages of the intensity values of the respective rows [28]. The row mean is depicted in (2). Row mean is calculated of the column transformed images to reduce the size of the feature vector. (2)
3.3. Column transformed image
A column transformed cytology image is one in which the transform is only applied to each column of the image. The (1) can be used to generate a column transformed image.
Step for feature vector generation are [10]:
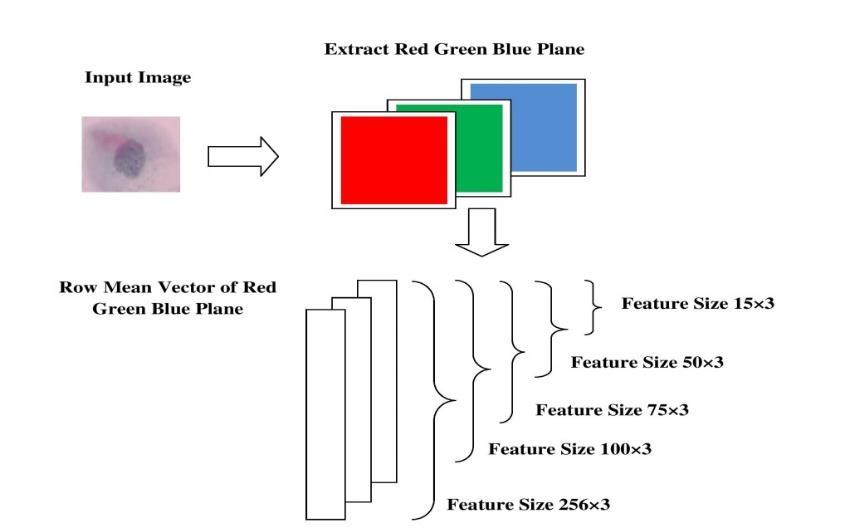
Step 4: generate a feature vector by considering fraction coefficients of each plane. For instance, consider the first 25 coefficients of the red plane, first 25 coefficients of the blue plane and first 25 coefficients of the green plane which will generate a feature vector of 75 sizes.
In the proposed work DCT and Haar transform are used to obtain features from color cytology images. To reduce the complexity, transforms are applied to the columns of the images. Then the row mean of the column transformed images are calculated and used as the features for classification. The performance of feature vectors in various sampling sizes in image classification are experimented [27].
Step 1: extract the planes red, blue and green of cytology pap smear image.
TELKOMNIKA Telecommun Comput El Control, Vol. 20, No. 5, October 2022: 1091 1102
3.1. Preprocessing
Step 2: apply transform (DCT and Haar) on the column of red, green and blue plane to get the column transformed image.
4.1. Experimentation environment
TELKOMNIKA
3.7. Machine learning classifiers
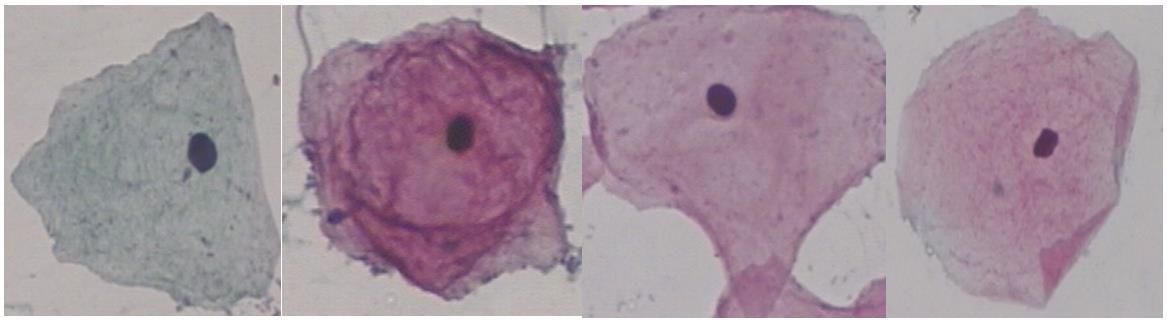
Figure 5 Cervical cell cytology images of Herlev dataset
4. RESULT AND DISCUSSION
1095
Cervical cancer diagnosis based on cytology pap smear image classification using … (Madhura Kalbhor)
Figure 4. Formations of feature vectors
Feature vectors are generated by considering fractional coefficients of five different sizes. The process of forming the feature vectors is demonstrated in Figure 4. The first feature vector is generated by taking all the coefficients with size of 256×3. Then the first 100 coefficients are considered which resulted in a size of 100×3 feature vector. Next, the first 75 coefficients are used to generate a feature vector of size 75×3. Then only the first 50 coefficients were used to generate a feature vector of size 5×3 and finally the 15×3 feature vector was generated using just the first 15 coefficients.
Classification is a machine learning method that determines which class a new object belongs to based on a set of predefined classes [29]. There are numerous classifiers that can be used to classify data, including decision trees, bays, functions, rules, lazy, meta, and so on. In this work we have used different classifiers belonging to the different families and performance comparison is to evaluate the best classifier. From the Bayes family Bayesian Net and Naïve Bayes are used. Simple logistic method of function family, part and decision table methods is used from the rule family
3.6. Feature vector variations
This section describes the experimentation and result analysis. Following sections are as 4.1 describes experimentation environment, 4.2 describes the various performance measures used, and 4.3 describes the performance analysis of the proposed methodology. In detail analysis of the results obtained are presented further.
The proposed technique is implemented using Matlab with Intel core i5 processor and 4 GB RAM. To classify the smear cytology images into normal and abnormal we have used the standard Herlev dataset. The Herlev dataset [30] consists of 917 single cell images that belong to seven different classes. Seven classes dataset is converted to normal and abnormal. Normal class contains 242 images while 675 images belong to malignant class. Figure 5 shows the sample images from the Herlev dataset.
Telecommun Comput El Control
RMSE: it is a quadratic scoring rule which measures the average magnitude of the error. �������� =√1 �� ∑ (���� ���� ̂)�� ��=1 2 (8)
4.2. Performance measure
4.3. Performance analysis
Simple logistic 74.23% 0.622 0.703 0.742 0.35 0.43
MAE: measures the average magnitude of the errors in a set of forecasts, without considering their direction. = 1 �� ∑ |���� ���� ̂ |�� ��=1 (7)
Bays net 75.98% 0.329 0.772 0.76 0.23 0.48
To test the performance of classification systems various performance measures are used in literature. True positive (TP) is the number of correctly labeled positive samples, true negative (TN) is the number of correctly classified negative samples, false positive (FP) is the number of negative samples classified as positive, and false negative (FN) is the number of positive instances predicted as negative (FN). Following measures are used to measure the performance of the proposed work. Accuracy: the number of successfully classified points (predictions) divided by the total number of predictions. Accuracy is calculated as shown in (3).
Decision table 81.11% 0.402 0.801 0.811 0.28 0.38
������
Part 75.76% 0.416 0.749 0.758 0.24 0.48
El Control,
Recall = ���� ����+���� (6)
���������������������������������� = ���� ����+����
Precision = ���� ����+���� (5)
ISSN: 1693 6930 Comput Vol. 20, No. 5, October 2022: 1091 1102
Classifier Accuracy FPR Precision Recall MAE RMSE
TELKOMNIKA Telecommun
Precision: precision is the number of positive class predictions that are actually positive class predictions. It is calculated as shown in (5).
The proposed technique for cervical cytology image classification is analyzed using various performance measures. DCT and Haar transformed contents considering the energy coefficient are used as features to classify the pap smear cytology image into abnormal and normal. Seven different machine learning classifiers are compared based on the classification accuracy.
���������������� = ����+���� ����+����+����+���� (3)
Random forest 79.91% 0.446 0.787 0.799 0.3 0.4
Naïve bays 78.16% 0.331 0.784 0.782 0.21 0.46
Table 2 Performance of proposed technique with 256×3 feature vector using DCT transform
Recall: recall is the number of correct positive class predictions made out of all correct positive examples in the dataset. In (6) shows the formula for the calculating recall
Feature vectors are generated by using the fractional energy coefficients of different sizes to minimize the feature vector size. Table 2 shows the results of using the DCT transform and feature vector of size 256×3. The highest accuracy of 81.11% is given by the Decision table classifier. By considering the first hundred coefficients the feature vector of size 100×3 was formed. Table 3 shows the results with 100×3 feature vector size. Random forest has given the highest accuracy of 76.14%
False positive rate (FPR): it is the percentage of false positives against all positive predictions. In (4) shows the false positive rate. (4)
1096
Random tree 70.08% 0.468 0.701 0.701 0.29 0.54
Simple logistic 75.05% 0.622 0.724 0.751 0.35 0.42
Random forest 76.14% 0.611 0.752 0.761 0.331 0.41
Table 4. Performance of proposed technique with 75×3 feature vector using DCT transform
Simple logistic 75.80% 0.58 0.734 0.758 0.34 0.41
Bays net 75.71% 0.399 0.752 0.757 0.24 0.46
Part 70.99% 0.463 0.707 0.71 0.29 0.51
1097
Random forest 77.02% 0.543 0.751 0.77 0.31 0.4
Part 74.72% 0.488 0.727 0.747 0.303 0.44
Bays net 72.21% 0.492 0.707 0.722 0.32 0.43
Decision table 74.26% 0.605 0.706 0.743 0.34 0.43
Decision table 72.97% 0.614 0.685 0.73 0.351 0.43
Naïve bays 73.30% 0.41 0.734 0.733 0.26 0.5
Part 69.90% 0.486 0.694 0.699 0.3 0.54
Random tree 67.79% 0.392 0.671 0.678 0.32 0.56
Bays net 72.51% 0.451 0.725 0.735 0.27 0.47
Part 71.55% 0.45 0.713 0.716 0.28 0.52
Classifier Accuracy FPR Precision Recall MAE RMSE
Naïve bays 71.88% 0.472 0.71 0.719 0.291 0.47
Decision table 77.57% 0.535 0.76 0.776 0.32 0.41
Cervical cancer diagnosis based on cytology pap smear image classification using … (Madhura Kalbhor)
Naïve bays 74.15% 0.4 0.742 0.742 0.26 0.5
Simple logistic 73.96% 0.641 0.691 0.736 0.35 0.42
Random tree 66.32% 0.527 0.663 0.663 0.337 0.58
of proposed technique with 15×3 feature vector using DCT transform Classifier Accuracy FPR Precision Recall MAE RMSE
Random tree 67.50% 0.457 0.691 0.657 0.32 0.57
With the DCT transformed energy coefficient the minimum fifteen energy coefficients were considered to form the feature vector. Performance of machine learning classifiers is shown in Table 6. Here the decision table has the highest accuracy which is followed by the random forest with 77.57% and 77.02% respectively.Table6.Performance
TELKOMNIKA Telecommun Comput El
Random tree 67.39% 0.4505 0.674 0.674 0.32 0.57
Table 4 shows the results of the variation by considering the first 75×3 features for classification. Bayes net classifiers have the 75.24% highest accuracy. The next Feature vector was formed by considering the first fifty energy coefficients as features. Table 5 shows the results computed where 75.79% highest classification accuracy was given by random forest machine learning classifier
Control
Decision table 71.97% 0.636 0.66 0.72 0.35 0.44
Classifier Accuracy FPR Precision Recall MAE RMSE
Naïve bays 70.99% 0.453 0.71 0.71 0.291 0.52
Bays net 75.24% 0.407 0.747 0.752 0.25 0.46
Simple logistic 74.70% 0.604 0.713 0.747 0.34 0.42
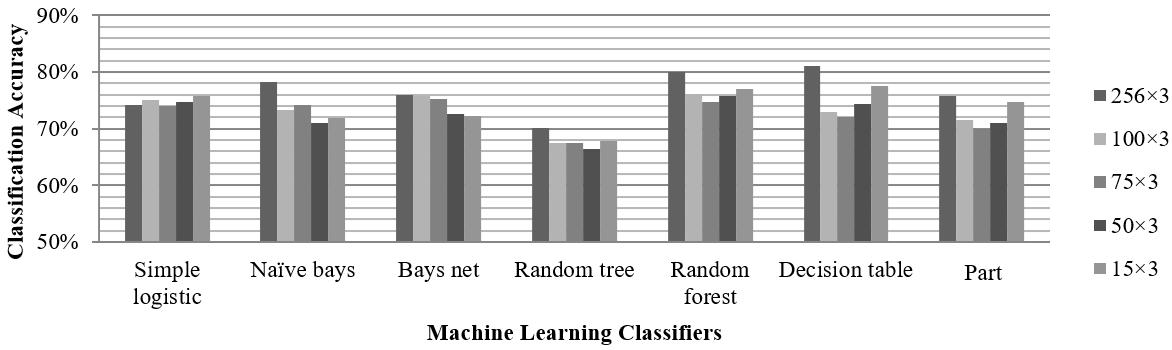
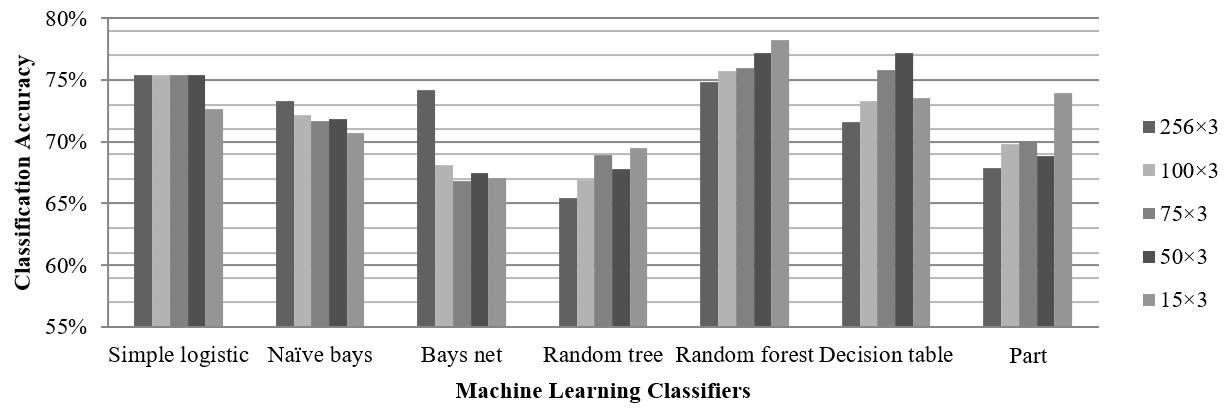
Table 9 shows the results computed with feature vector size of 75×3 where random forest classifier has highest classification accuracy 75.93%. With the feature vector size of 50×3 the highest classification accuracy 77.18% is given by the random forest and decision table which is demonstrated in Table 10. Table 11 shows the performance with 15×3 feature vector size where the highest classification accuracy is 78.24% by random forest classifier. The average overall performance of DCT transform is then Haar transform.
Random forest 75.79% 0.576 0.732 0.758 0.32 0.41
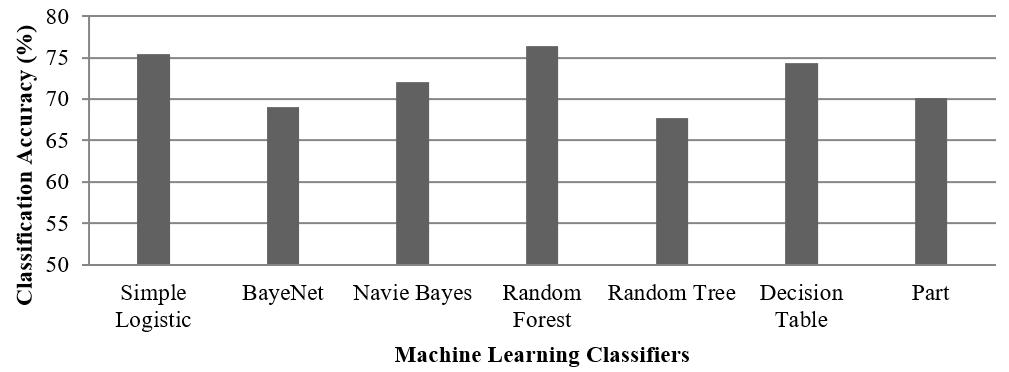
Performance of proposed techniques with the Haar transform is elaborated with the following tables. Similar to the DCT transformed contents Haar transformed energy coefficient is used to generate the feature vector. Table 7 shows the performance of proposed techniques with 256×3 feature vector size where highest classification accuracy is 75.38% by simple logistic classifier. For feature vector size 100×3 the random forest classifier has highest classification accuracy 75.73% which is demonstrated in Table 8.
Random forest 74.70% 0.624 0.716 0.747 0.34 0.42
Table 5. Performance of proposed technique with 50×3 feature vector using DCT transform Classifier Accuracy FPR Precision Recall MAE RMSE
Table 3 Performance of proposed technique with 100×3 feature vector using DCT transform
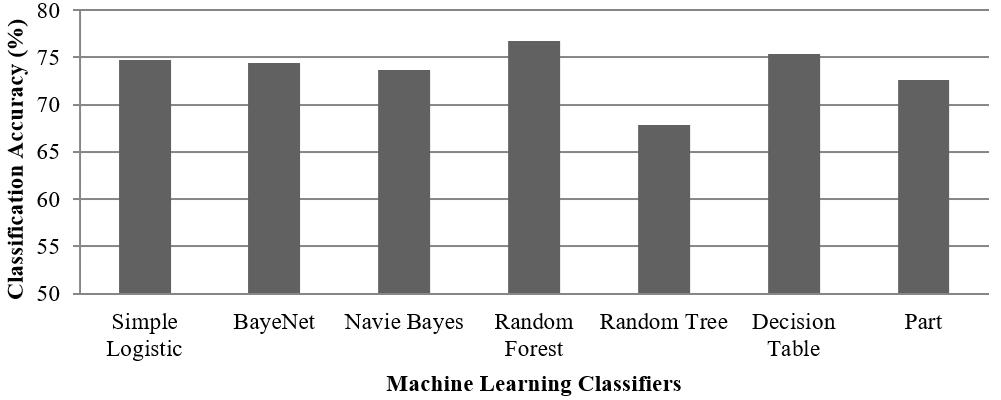
Figure 6 and Figure 7 shows the comparison of the machine learning classifiers with different feature vector sizes for DCT and Haar transform. Among all the experimentation the highest accuracy is given when DCT transform is used with a 256×3 feature vector and decision table is used. By considering the fractional coefficient, an attempt is made to reduce the feature vector size. The performance of considering the fractional coefficients has not shown the better performance than considering the all energy coefficients.
Part 70.02% 0.431 0.711 0.7 0.3 0.53
Random forest 77.18% 0.547 0.755 0.772 0.32 0.41
Simple logistic 75.38% 0.56 0.72 0.75 0.34 0.41
Table 8 Performance of proposed technique with 100×3 feature vector using Haar transform Classifier Accuracy FPR Precision Recall MAE RMSE
TELKOMNIKA Telecommun Comput El Control, Vol. 20, No. 5, October 2022: 1091 1102
Random forest 74.86% 0.622 0.717 0.749 0.34 0.41
Decision table 75.82% 0.59 0.735 0.758 0.34 0.42
Naïve bays 70.71% 0.379 0.702 0.707 0.31 0.48
Naïve bays 73.33% 0.34 0.75 0.73 0.26 0.51
Random tree 66.88% 0.58 0.66 0.66 0.33 0.57
Bays net 66.84% 0.406 0.706 0.668 0.33 0.52
1098
Naïve bays 71.83% 0.392 0.732 0.718 0.291 0.5
Decision table 77.18% 0.588 0.758 0.772 0.34 0.419
Random tree 69.45% 0.382 0.692 0.695 0.3 0.55
Table 12 shows the average classification accuracy for Haar and DCT transforms with different machine learning classifiers. It can be clearly observed that the highest average classification accuracy for Haar transform is given by the random forest classifier. For DCT transform in figure it can be analyzed that the random forest is giving the highest average classification accuracy. So the overall best performance is given by random forest classifier among all the experimented classifiers. Figure 8 and Figure 9 shows the comparative analysis of average classification accuracy of different machine learning classifiers of Haar and DCT respectively.
Part 67.86% 0.51 0.67 0.679 0.322 0.56
Naïve bays 71.66% 0.41 0.725 0.717 0.29 0.51
Part 68.88% 0.468 0.694 0.689 0.31 0.5
Simple logistic 75.38% 0.56 0.72 0.75 0.34 0.41
Bays net 74.20% 0.34 0.75 0.74 0.26 0.49
Table 10 Performance of proposed technique with 50×3 feature vector using Haar transform Classifier Accuracy FPR Precision Recall MAE RMSE
Part 73.91% 0.371 0.73 0.739 0.3 0.46
Decision table 73.50% 0.466 0.742 0.735 0.37 0.43
Naïve bays 72.13% 0.419 0.726 0.721 0.28 0.51
Table 9 Performance of proposed technique with 75×3 feature vector using Haar transform Classifier Accuracy FPR Precision Recall MAE RMSE
Decision table 71.58% 0.639 0.664 0.716 0.35 0.45
ISSN: 1693 6930
Random tree 65.46% 0.509 0.66 0.65 0.34 0.58
Simple logistic 75.37% 0.603 0.73 0.75 0.34 0.41
Bays net 68.08% 0.407 0.711 0.681 0.32 0.52
Decision table 73.33% 0.648 0.683 0.733 0.36 0.44 Part 69.83% 0.482 0.695 0.698 0.31 0.54
Bays net 67.08% 0.394 0.674 0.671 0.32 0.48
Random forest 75.73% 0.59 0.717 0.749 0.34 0.41
Simple logistic 75.43% 0.58 0.726 0.754 0.34 0.41
Table 7 Performance of proposed technique with 256×3 feature vector using Haar transform Classifier Accuracy FPR Precision Recall MAE RMSE
Random forest 78.24% 0.364 0.786 0.782 0.32 0.57
Simple logistic 72.66% 0.439 0.717 0.727 0.37 0.43
Table 11 Performance of proposed technique with 15×3 feature vector using Haar transform Classifier Accuracy FPR Precision Recall MAE RMSE
Random tree 67.79% 0.524 0.671 0.678 0.32 0.56
Bays net 67.46% 0.426 0.701 0.675 0.33 0.51
Random tree 68.92% 0.509 0.682 0.689 0.301 0.55
Random forest 75.93% 0.612 0.743 0.759 0.32 0.41
Figure 7. Performance comparison of machine learning algorithms using Haar features
Figure comparison of machine learning classifiers with DCT
1099
Cervical cancer diagnosis based on cytology pap smear image classification using … (Madhura Kalbhor)
different
Figure 8 Performance comparisons of different machine learning classifiers with Haar transform
TELKOMNIKA Telecommun Comput El Control
transform
9. Performance
Figure 6. Performance comparison of machine learning algorithms using DCT features
[5] L Abualigah, M. A. Elaziz, P. Sumari, Z. W. Geem, A. H. Gandomi, “Reptile Search Algorithm (RSA): A nature inspired meta heuristic optimizer,” Expert Systems with Applications, vol. 191, 2022, doi: 10.1016/j.eswa.2021.116158.
[12] A. Bhargava, P. Gairola, G. Vyas, and A. Bhan, “Computer Aided Diagnosis of Cervical Cancer Using HOG Features and Multi Classifiers”, Intelligent Communication, Control and Devices, pp. 1491 1502, 2018, doi: 10.1007/978 981 10 5903 2_155.
Classifiers Average classification accuracy Haar DCT
[14] Kurnianingsih et al , “Segmentation and Classification of Cervical Cells Using Deep Learning,” IEEE Access, vol. 7, pp. 116925 116941, 2019, doi: 10.1109/ACCESS.2019.2936017.
Simple logistic 75.04% 74.75%
[11] K. Hemalatha, and K. U Rani, “Feature Extraction of Cervical Pap Smear Images Using Fuzzy Edge Detection Method,” Data Engineering and Intelligent Computing, vol. 542, pp. 83 90, 2018, doi: 10.1007/978 981 10 3223 3_8.
Random forest 76.39% 76.71%
5. CONCLUSION
[8] M Arya, N Mittal, and G Singh, “Texture based feature extraction of smear images for the detection of cervical cancer,” IET Computer Vision, vol. 12, no. 8, pp. 1049 1059, 2018, doi: 10.1049/iet cvi.2018.5349
Decision table 74.30% 75.38%
[13] M Sokolova and G Lapalme, “A systematic analysis of performance measures for classification tasks,” Information Processing and Management, vol 45, no. 4, pp. 427 437, 2009, doi: 10.1016/j.ipm.2009.03.002.
1100Table
In this paper, the transform domain is experimented for classification of the pap smear cytology images for diagnosis of cervical cancer. Investigative study is done to analyze if energy coefficients can be used as features with different machine learning classifiers to classify the cytology images. In addition, to reduce the complexity, orthogonal transforms are applied to columns of the cytology images. To reduce the size of the feature vector, fractional energy coefficients are used and different sizes of feature vectors are experimented. Among the different experimented machine learning classifiers, the random forest and decision table classifiers have outperformed over the other classifiers. Comparing the transformed contents of cytology images as features, DCT has given better results than the Haar transform. With the Haar transform, it can be observed that considering the fractional coefficients of just 15×3 features has given better accuracy than using the whole energy coefficients. The Herlev dataset experimented in the study has low image resolutions which might be one of the reasons that affected the overall classification accuracy. In order to further improve the classifier’s performance, additional datasets with good quality of cytology images can be experimented. Also other orthogonal transforms can be experimented for increasing the classification accuracy with less computational complexities.
[9] T. Chankong, N. T. Umpon, and S. Auephanwiriyakul, “Automatic cervical cell segmentation and classification in Pap smears,” Computer Methods and Programs in Biomedicine, vol. 113, no. 2, pp. 539 556, 2014, doi: 10.1016/j.cmpb.2013.12.012
REFERENCES
This project is funded by the Department of Science of Technology, India.
[7] L. Abualigah, A. Diabat, P. Sumari, and A. H. Gandomi, “Applications, Deployments, and Integration of Internet of Drones (IoD): A Review,” IEEE Sensors Journal, vol. 21, no. 22, pp. 25532 25546, 2021, doi: 10.1109/JSEN.2021.3114266
Random tree 67.70% 67.82%
TELKOMNIKA Telecommun Comput El Control, Vol. 20, No. 5, October 2022: 1091 1102
[3] C. W. Wang et al., “Artificial intelligence assisted fast screening cervical high grade squamous intraepithelial lesion and squamous cell carcinoma diagnosis and treatment planning,” Scientific Reports, vol. 11, no. 16244, 2021, doi: 10.1038/s41598 021 95545 y
Navie Bayes 72.03% 73.70%
Part 70.14% 72.58%
[2] S Bobdey, J Sathwara, A Jain, and G Balasubramaniam, “Burden of cervical cancer and role of screening in India,” Indian Journal of Medical and Paediatric Oncology,” vol. 37, no. 4, pp. 278 285, 2016, doi: 10.4103/0971 5851.195751
[10] K. Bora, M. Chowdhur, L. B. Mahanta, M. K. Kundu, and A. K. Das, “Automated classification of Pap smear images to detect cervical dysplasia,” Computer Methods and Programs in Biomedicine, vol. 138, pp. 31 47, 2017, doi: 10.1016/j.cmpb.2016.10.001.
ACKNOWLEDGEMENTS
[4] L Abualigah, D. Yousri, M. A. Elaziz, A. E Ewees, M. A. A. Al qaness, and A. H. Gandomi, “Aquila Optimizer: A novel meta heuristic optimization algorithm”, Computers and Industrial Engineering, vol. 157, 2021, doi: 10.1016/j.cie.2021.107250.
12. Average classification accuracy of Haar and DCT transform for different machine learning classifiers
BayeNet 68.98% 74.37%
[1] P. L. Sachan, M Singh, M L Patel, and R Sachan, “A Study on Cervical Cancer Screening Using Pap Smear Test and Clinical Correlation,” Asia Pacific Journal of Oncology Nursing, vol. 5, no. 3, pp. 337 341, 2018 [Online]. Available: inical_Correlationhttps://www.researchgate.net/publication/325448052_A_Study_on_Cervical_Cancer_Screening_Using_Pap_Smear_Test_and_Cl
[6] L Abualigah, A. Diabat, S. Mirjalili, M. A. Elaziz, and A. H. Gandomi, “The Arithmetic Optimization Algorithm,” Computer Methods in Applied Mechanics and Engineering, vol. 376, 2021, doi: 10.1016/j.cma.2020.113609.
ISSN: 1693 6930
[15] Y. Xiang, W. Sun, C. Pan, M. Yan, Z. Yin, and Y. Liang, “A novel automation assisted cervical cancer reading method based on convolutional neural network,” Biocybernetics and Biomedical Engineering, vol. 40, no. 2, pp. 611 623, 2020, doi: 10.1016/j.bbe.2020.01.016.
[17] E. Hussain, L. B. Mahanta, C. R. Das, and R. K. Talukdar, “A comprehensive study on the multi class cervical cancer diagnostic prediction on pap smear images using a fusion based decision from ensemble deep convolutional neural network,” Tissue and Cell, vol. 65, 2020, doi: 10.1016/j.tice.2020.101347.
[25] C. Anupama et al., “Intelligent Classification Model for Biomedical Pap Smear Images on IoT Environment,” Computers, Materials and Continua, vol. 71, no. 2, pp. 3969 3983, 2022, doi: 10.32604/cmc.2022.022701.
[26] S. D. Thepade and M. M. Kalbhor, “Extended performance appraise of Bayes, Function, Lazy, Rule, Tree data mining classifier in novel transformed fractional content based image classification,” 2015 International Conference on Pervasive Computing (ICPC), 2015, pp. 1 6, doi: 10.1109/PERVASIVE.2015.7087143.
[29] I H. Witten and E. Frank, Data mining Practical Machine Learning Tools and Techniques San Fransisco, USA: Morgan Kaufmann, 2005. [Online]. Available: http://www.academia.dk/BiologiskAntropologi/Epidemiologi/DataMining/Witten_and_ Frank_DataMining_Weka_2nd_Ed_2005.pdf
[30] J. Jantzen, J. Norup, G. Dounias, and B. Bjerregaard, “Pap smear benchmark data for pattern classification,” In Proc. NiSIS 2005 Nature inspired Smart Information Systems (NiSIS), 2005, pp. 1 9. [Online]. Available: https://www.researchgate.net/profile/Jan Jantzen/publication/265873515_Pap smear_Benchmark_Data_For_Pattern_Classification/links/551af0090cf2fdce84383bdb/Pap smear Benchmark Data For Pattern Classification.pdf
[22] H. Chen et al , “CytoBrain: Cervical Cancer Screening System Based on Deep Learning Technology,” Journal of Computer Science and Technology, vol. 36, no. 2, pp. 347 360, 2021, doi: 10.1007/s11390 021 0849 3
BIOGRAPHIES OF AUTHORS
Cervical cancer diagnosis based on cytology pap smear image classification using … (Madhura Kalbhor)

Madhura Kalbhor has completed M.E in Computer Engineering, SPPU, Pune. Currently Pursuing PhD in Computer Engineering under Dr. Swati Shinde in SPPU, Pune. She works as Assistant Professor in Pimpri Chinchwad College of Engineering, Pune. Her research interest is in Image processing, Machine learning, Artificial Intelligence. She has Published 10+ research publications in reputed international conferences and journals. Working on a DST Sanctioned project. She can be contacted at email: madhura.kalbhor@pccoepune.org
[28] S D. Thepade and M M. Kalbhor, “Novel Data Mining based Image Classification with Bayes, Tree, Rule, Lazy and Function Classifiers using Fractional Row Mean of Cosine, Sine and Walsh Column Transformed Images,” 2015 International Conference on Communication, Information and Computing Technology (ICCICT), 2015, pp. 1 6, doi: 10.1109/ICCICT.2015.7045727
Swati Vijay Shinde has completed Ph.D. in Computer Science and Engineering, from Swami Ramanand Teertha Marathwada University, Nanded. She has a total 20 years of teaching experience and currently she is working as a Professor in Pimpri Chinchwad College of Engineering (PCCoE), Pune. She has worked as a HOD IT for seven years in PCCoE. Her research interests include Machine Learning, Deep Learning, Soft Computing, Artificial Neural Network and Fuzzy Logic. She has published 85+ research papers in reputed conferences and journals. Two of these are published in the prestigious SCI indexed Science Q1 Elsevier journals. She received the five Best Paper Awards in different IEEE Conferences. She has filed four research patents. She has received the DST research project grant of almost Rs. 36 lakhs. She also has received the research grant of SPPU University, Pune, International FDP grant by SPPU and also the conference grant by AICTE. She is the certified trainer and ambassador of NVDIA’s Deep Learning Institute. She was conferred with the “Dr. APJ Abdul
[19] H. Basak, R. Kundu, S. Chakraborty, and N. Das, “Cervical Cytology Classification Using PCA and GWO Enhanced Deep Features Selection,” SN Computer Science, vol. 2, no. 369, 2021, doi: 10.1007/s42979 021 00741 2.
1101
[24] T. Haryanto, I. S. Sitanggang, M. A. Agmalaro, and R. Rulaningtyas, “The Utilization of Padding Scheme on Convolutional Neural Network for Cervical Cell Images Classification,” 2020 International Conference on Computer Engineering, Network, and Intelligent Multimedia (CENIM), 2020, pp. 34 38, doi: 10.1109/CENIM51130.2020.9297895.
[20] J. Shi, R. Wang, Y. Zheng, Z. Jiang, H. Zhang, and L. Yu, “Cervical cell classification with graph convolutional network,” Computer Methods and Programs in Biomedicine, vol. 198, 2021, doi: 10.1016/j.cmpb.2020.105807.
TELKOMNIKA Telecommun Comput El Control
[21] A. Tripathi, A. Arora, and A. Bhan, “Classification of cervical cancer using Deep Learning Algorithm,” in 2021 5th International Conference on Intelligent Computing and Control Systems (ICICCS), 2021, pp. 1210 1218, doi: 10.1109/ICICCS51141.2021.9432382

[27] M. Mizianty, L. Kurgan, and M. Ogiela, “Comparative Analysis of the Impact of Discretization on the Classification with Naïve Bayes and Semi Naïve Bayes Classifiers,” 2008 Seventh International Conference on Machine Learning and Applications (ICMLA), 2008, pp. 823 828, doi: 10.1109/ICMLA.2008.29.


[18] O Yaman and T. Tuncer, “Exemplar pyramid deep feature extraction based cervical cancer image classification model using pap smear images,” Biomedical Signal Processing and Control, vol. 73, 2022, doi: 10.1016/j.bspc.2021.103428.
[16] M M Rahaman et al., “DeepCervix : A Deep Learning based framework for the classification of Cervical Cells using Hybrid Deep Feature fusion Techniques,” Computers in Biology and Medicine, vol. 136, 2021, doi: 10.1016/j.compbiomed.2021.104649
[23] A. Manna, R. Kundu, D. Kaplun, A. Sinitca, and R. Sarkar, “A fuzzy rank based ensemble of CNN models for classification of cervical cytology,” Scientific Reports, vol. 11, no. 14538, 2021, doi: 10.1038/s41598 021 93783 8.
TELKOMNIKA Telecommun Comput El Control, Vol. 20, No. 5, October 2022: 1091 1102 1102
Hemant Jude has completed PhD from Karunya University in 2013. Currently, he is working as Professor in the Department of ECE, Karunya University, Coimbatore, India. His research areas include Computational Intelligence and Image processing. He has authored more than 150 research papers in reputed SCIE indexed International Journals and Scopus indexed International Conferences. His Cumulative Impact Factor is more than 250. He has published 37 edited books with reputed publishers such as Elsevier, Springer and IETHe has been serving as Associate Editor/Scientific Editor of SCIE Indexed International Journals such as IEEE Journal of Biomedical and Health Informatics (IEEE JBHI), Soft Computing (Springer), Journal of Intelligent and fuzzy systems, Mathematical Problems in Engineering. IET Quantum Communications and Dyna (Spain). He serves as an Editorial Board member/Guest Editor of many journals with leading publishers such as Springer, Inderscience, MDPI, and IGI Global. He is the series editor of “Biomedical Engineering” book series in Elsevier and “Robotics & Healthcare” book series with CRC Press. He has received a project grant with 35,000 UK Pound from the Government of UK (GCRF scheme) with collaborators from University of Westminster, UK. He has also completed 1 funded research project from CSIR, Govt. of India and 1 ongoing funded project from DST, Govt. of India. He also serves as the “Research Scientist” of Computational Intelligence and Information Systems (CI2S) Lab, Argentina; LAPISCO research lab, Brazil; RIADI Lab, Tunisia and Research Centre for Applied Intelligence, University of Craiova, Romania He has been also the organizing committee member of several international conferences across the globe such as Portugal, Romania, UK, Egypt, and China. He has delivered more than 100 Keynote talks/Invited Lectures in International Conferences/workshops. He holds professional membership with IEEE Technical Committee on Neural Networks (IEEE Computational Intelligence Society) and IEEE Technical Committee on Soft Computing (IEEE Systems, Man and Cybernatics Society) and ACM. He can be contacted at email: judehemanth@karunya.edu

ISSN: 1693 6930
Kalam Women Achievers Award” by IITech Banglore. She was awarded the Indo Global Engineering Excellence Award by Indo Global Chamber of Commerce Industries and agriculture. She has delivered 26+ research talks in various workshops, and STTPs. She was the general chair of IEEE conference ICCUBEA 2018. Currently she is a SPPU approved PhD supervisor and guiding four PhD research scholars. She can be contacted at email: swati.shinde@pccoepune.org