TELKOMNIKA Telecommunication Computing Electronics and Control
Vol. 21, No. 4, August 2023, pp. 846~857
ISSN: 1693-6930, DOI: 10.12928/TELKOMNIKA.v21i4.22251
TELKOMNIKA Telecommunication Computing Electronics and Control
Vol. 21, No. 4, August 2023, pp. 846~857
ISSN: 1693-6930, DOI: 10.12928/TELKOMNIKA.v21i4.22251
Rohana Abdul Karim, Nurul Wahidah Arshad, Yasmin Abdul Wahab Faculty of Electrical and Electronics Engineering Technology, Universiti Malaysia Pahang, Pahang, Malaysia
Article Info
Article history:
Received Nov 16, 2021
Revised Feb 06, 2023
Accepted Feb 16, 2023
Keywords:
Enhancement
Multi-contrast images

Rubeosis iridis
Suppression
Existing researchers for rubeosis iridis disease focused on image enhancement as a collective group without considering the multi-contrast of the images. In this paper, the pre-enhancement process was proposed to improve the quality of iris images for rubeosis iridis disease by separating the image into three groups; low, medium and high contrast. Increment, decrement and maintenance of the images’ original contrast were further operated by noise reduction and multi-contrast manipulation to attain the best contrast value in each category for increased compatibility prior subsequent enhancement. As a result, this study proved that there have three rules for the contrast modification method. Firstly, the histogram equalization (HE) filter and increasing the image contrast by 50% will achieve the optimum value for the low contrast category. Experimental revealed that HE filters successfully increase the luminance value before undergoing the contrast modification method. Secondly, reducing the 50% of theimagecontrast to achieve theoptimumvalue for thehigh contrast category. Finally, the image contrast was maintained for the middle contrast category to optimise contrast. The mean square error (MSE) and peak signal-to-noise ratio (PSNR) of the outputs were then calculated, yielding an average of 18.25 and 28.87,respectively.
This is an open access article under the CC BY-SA license.
Corresponding Author:
Rohana Abdul Karim
Faculty of Electrical and Electronics Engineering Technology, Universiti Malaysia Pahang
Pekan Campus, 26600 Pekan, Pahang, Malaysia
Email: rohanaak@ump.edu.my
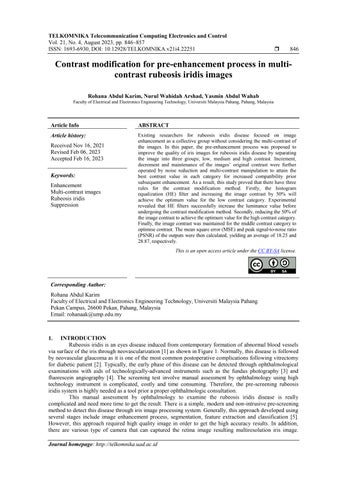
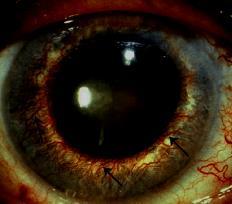
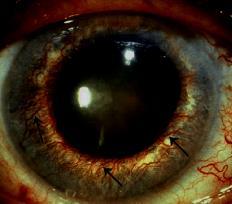
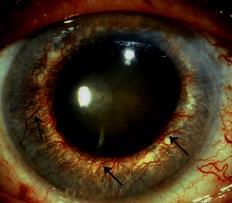
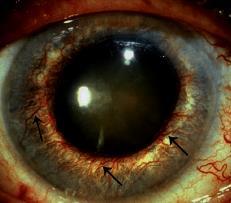
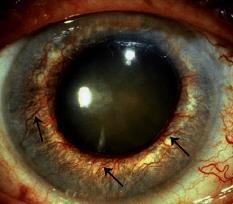
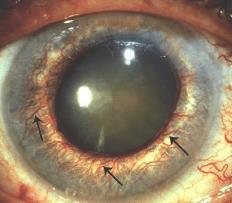
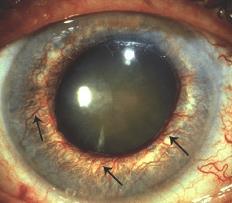
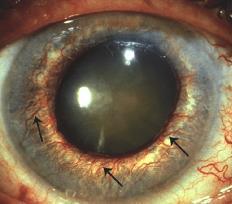
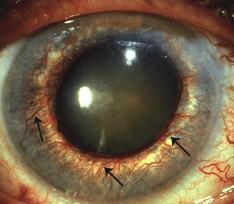
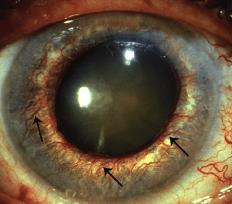
Rubeosis iridis is an eyes disease induced from contemporary formation of abnormal blood vessels via surface of the iris through neovascularization [1] as shown in Figure 1. Normally, this disease is followed by neovascular glaucoma as it is one of the most common postoperative complications following vitrectomy for diabetic patient [2]. Typically, the early phase of this disease can be detected through ophthalmological examinations with aids of technologically-advanced instruments such as the fundus photography [3] and fluorescein angiography [4]. The screening test involve manual assessment by ophthalmology using high technology instrument is complicated, costly and time consuming. Therefore, the pre-screening rubeosis iridis system is highly needed as a tool prior a proper ophthalmologic consultation.
This manual assessment by ophthalmology to examine the rubeosis iridis disease is really complicated and need more time to get the result. There is a simple, modern and non-intrusive pre-screening method to detect this disease through iris image processing system. Generally, this approach developed using several stages include image enhancement process, segmentation, feature extraction and classification [5]. However, this approach required high quality image in order to get the high accuracy results. In addition, there are various type of camera that can captured the retina image resulting multiresolution iris image.
Journal homepage: http://telkomnika.uad.ac.id
Nowadays, current smartphone is not only used as a tool to communicate with others but also built in with camera. Therefore, user can easily use this smart phone camera to capture the iris image and doing the pre-screening of this disease before getting further ophthalmology consultation. However, the common problems that occured in the iris image processing system is the quality of image [6]. The image contrast can be low or high depending on environment factor such as environment, type of camera, surrounding condition and application used [7]. Also, if the image has poor quality, the amount of information required from the iris image may be reduced.
Besides, image enhancement process is one of the crucial considerations in the iris image processing system. For last decades, many image enhancement methods have been studied and one of the popular techniques is enhancement process based on contrast. Basically, the philosophy of the contrast enhancement process i e., to enhance the quality of image by enlarging the gray level image. The common of contrast enhancement process used is based on histogram equalization (HE) method [8]-[11] due to the simplicity and highly effectiveness. However, the major drawback ofthis method is losing the originalityof image, loss of image information, over enhancement of brightness as well as the contrast and amplified the noise from the original image. Many attempts done by researchers to reduce the HE drawback by introducing several methods such as adaptive histogram equalization (AHE) [12], contrast limited adaptive histogram equalization (CLAHE) [13], brightness preserving bi-histogram equalization [14], sub-image histogram equalization method [15], recursive mean separate histogram equalization [16] and bi-histogram equalization [17].
Prior research in rubeosis iridis detection concentrated on image enhancement as a whole, without taking into account the images’ multi-contrast [18]-[22]. The process leads to over-enhancement or downgrade the quality of the image. Thus, this study proposed pre-enhancement process with the two well know contrast enhancement methods which is HE and CLAHE. Basically, the HE method will enhance the entire contrast image by enhancing the whole image histogram into the uniform histogram [8]. Meanwhile the CLAHE method modifies the contrast by each of small windows value based on some characteristics and it is applied to improve the contrast and minimize the noise that presence in the image [23]. Therefore, the main objective of this paper is to develop an algorithm to modify the contrast image in enhancement process by introducing the contrast modification technique for the pre-enhancement process, in order to detect rubeosis iridis disease.
This study was designed using a numerical technique and quantitative analysis. Generally, this study consists of four stages as illustrated in Figure 2. The details of each stage are outlined.
The dataset was downloaded from publicly Google search engine [24]-[29]. Appropriated inputs then comprised 38 images of iris with rubeosis iridis disease from various web-based sources with multiresolution images range from (183×275) up to (1358×2048) pixels. For this study, images with an obvious abnormal blood vessel appeared were chosen as a dataset. Thus, it will lead to a high-performance measurement. The dataset was classified into three groups; low, medium, and high resolution. The classification is based on spatial measurements pixels per inch (������), width (��), and height (ℎ) The (1) defines the group for each of the conditions of the resulted image, ��:
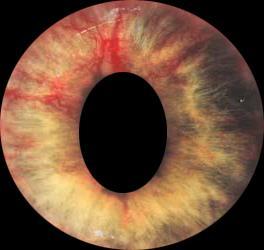
Figure 3 depicts the image contrast measuring procedure. The effectiveness of the luminance and arithmetic mean model was investigated to identify the appropriate model for the dataset. Luminance refers to the brightness of light emitted or reflected from a surface. The (2) shows a mathematical model for luminance, ����:
���� =0299��+0587��+0114�� (2)
Where ��, ��, and �� denote pixel values at the the respective red, green, and blue channels Notably, parameters �� and �� outweigh parameter �� [1] due to the human eye is more sensitive to the green and red colours. Meanwhile, arithmetic mean model which depicts the average luminance, �� of all points on a surface is outlined as in (3):
�� = (��+��+��) 3 (3)
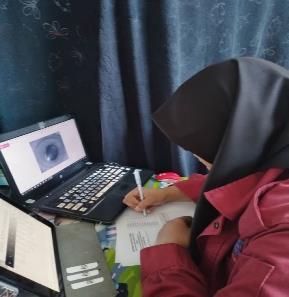
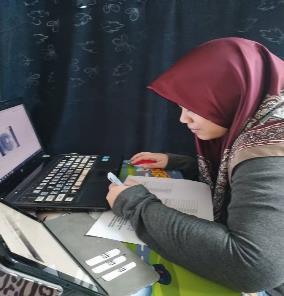
In addition, qualitative output corresponding judgment of the human eye was validated by employment of the questionnaire method among ten voluntary respondents who fulfilled the demographical criteria of:
a) Age: between 20 and 24 years old.
b) Health condition: excellent eyesight condition without the hindrance of colour blindness. This observing procedure is critical for triggering the correct assessment of brightness due to human eyes are sensitive to the light and colour space. Herewith, scaled responses were requested from each respondent upon appraising the brightness of virtually displayed images through sole judgment of their naked eyes. Engaged process concerning independent answering of the questionnaire has been further depicted in Figure 4. Each responder had one chance to decide for each of the 38 images. Each brightness assessment category; low, medium, and high was randomly arranged in the image sets. The setting in the room was controlled by using the same location for all of the respondents and the fluorescent lamp served as the light source. The display panel was calibrated by setting the brightness to zero. It is useful to avoid any concerns about the eye’s light adaptation that will decrease the accuracy of judgement.
2.3.
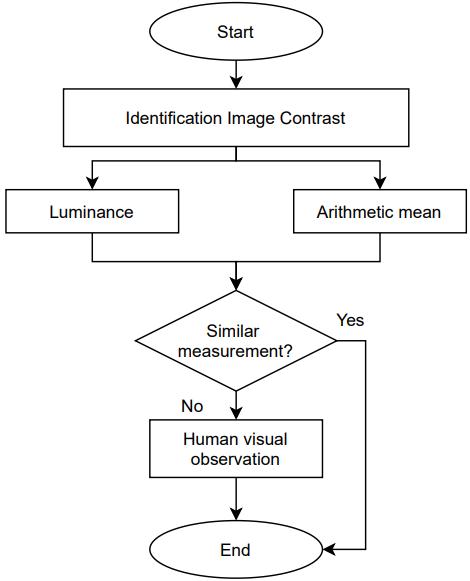
Figure 5 shows the entire flowchart used in this stage. Many researchers enhance the contrast images by applying the HE and CLAHE method without identifying the suitable images needed to apply the enhancement process. Therefore, this study proposed the pre-enhancement process that includes 2 steps: classification of the contrast scale category and contrast modification method.
2.3.1.
The iris images were divided into three contrast levels: low, medium, and high. As demonstrated in Table 1, this classification was based on the Ansel Adam zone system [2]. Using the (1), the luminance value, ����, was used to determine the contrast scale value and identify the grey name and contrast category.
Contrast modification for pre-enhancement process in … (Rohana Abdul Karim)
The best contrast value for the human eye’s is around 60% to 70% from the maximum contrast scale value (255) [3], which is categorized as medium contrast. Therefore, this step aims to manipulate the contrast value up to the range of middle contrast scale value from 127 203. In the low contrast group, there are five grey names: pure dark, near black, dark black, very dark gray, and medium dark gray. All images in the low contrast category were divided into two groups based on scales: a) 0 101 and b) 102 126 for analysis. These two groups were formed since the results of the 0 101 contrast modification technique did not show any increments in contrast value. But, the results of images in the range 102 126 showed an improvement in contrast value. In the filter step, HE and CLAHE approaches were applied to increase the contrast value for images on the scale of 0 101. After the enhancement process, all the images on a scale of 0 101 need to undergo the contrast modification method, which involves increasing the contrast value 10%, 20%, 30%, 40%, and 50% from the original contrast. The red channel was utilised in this analysis in order to extract the data region of interest (ROI), which represents the colour of the blood vessels. After that, the contrast modification method was applied to the images in the middle and high contrast categories. The process is done by increasing the contrast by 10%, 20%, 30%, 40%, and 50% or decreasing the contrast by 10%, 20%, 30%, 40%, and 50%.
The final step is the performance measurement between the enhancement and original images using mean square error (MSE) and peak signal to noise ratio (PSNR) shown in the (4) and (5), respectively. MSE is a technique to measure the mean value of error that occurs between the original image and the output image. While, PSNR represents the ratio between maximum value of contrast (��) and MSE of the output image.
Where �� and �� are denoted for number of rows and columns respectively. ��1 is the original image and ��2 is the enhanced image.
The suggested algorithm had been verified using a contrast enhancement assessment dataset that was available to the public (CEED2016). The dataset was created to evaluate the efficacy of image enhancement [30]-[32]. The image in the dataset was divided into three categories according to its luminance value. Synthetic data was generated to increase the number of high contrast datasets by manipulating the contrast value of the middle contrast images. There are a total of 24 images for validation.
Table 2 shows the results of a similarity contrast measurement between brightness and arithmetic mean, which corresponded to the contrast scale value and gray name. The first image (43 264×357), for example, has a different contrast value between brightness and arithmetic mean, but the range in the middle gray is identical. Hence, the similarity status is similar. Figure 6 depicted a summary of similarity image contrast measurement between luminance and arithmetic mean for three groups. Group medium resolution yielded comparable results between similar and different. While for low and high resolution the status similar is lower than the status different. Finally, the similarity findings demonstrated that quantitative measurement is insufficient for presenting the characteristics of the gray image. Additionally, qualitative measurements as obtained from the visual observation of ten individual respondents on both luminance and arithmetic calculations have been outlined in Table 3. The qualitative results indicated that the human eye distinguishes colour could be easily detected using the luminance approach compared to the arithmetic mean. Therefore, the luminance technique was used for further processing.
Table 4 shows the results of 38 iris images based on category, contrast scale, a gray name based on Ansel Adam zone system, resolution, luminance value before and after the pre-enhancement process. Red text indicates that it achieved the medium contrast category. Based on the luminance value after contrast modification method results in Table 4, images in the contrast scale 0 101 (pure black, near black, dark black, and very dark gray) did not achieve the optimum range scale. In addition, only three iris images that are very dark gray with contrast increment by 50% meet the medium category. Meanwhile, the resulting contrast modification method in medium dark gray(102 126) satisfies the mediumcontrast categoryafter a contrast increment of50%.
Previous results showed that the luminance value after the contrast modification method in the pure black, near black, dark black, and very dark gray (0 101) categories did not achieve the luminance value in the middle contrast category. Therefore, this study proposed two well known contrast enhancement methods which are HE and CLAHE. These methods applied only to all images in pure black, near black, dark black, and very dark gray categories. Table 5 shows the outcomes after using HE and CLAHE.
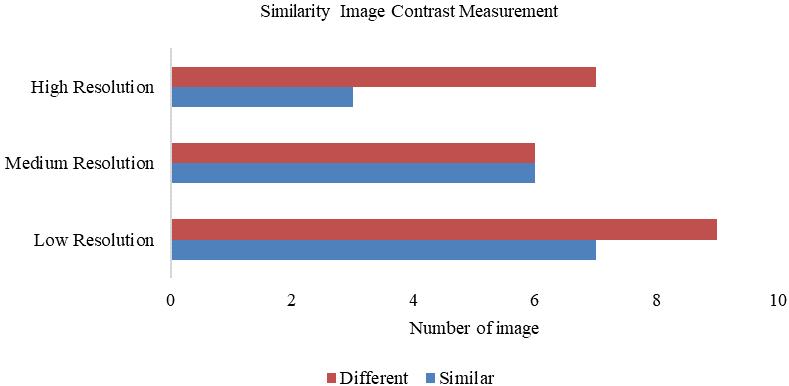
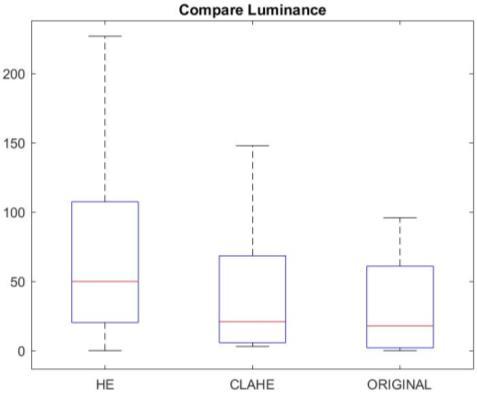
Figure 7 shows a boxplot illustrating the further analysis of the results in Table 6. The boxplot displays the median score for CLAHE compares to the original images are slightly different. Therefore, it’s not shown a very significant image enhancement to the original images. Besides, the interquartile ranges between CLAHE and the original have a constant size. These indicate that the dispersion of luminance is low. Images with a luminance value greater than 100 have a high tendency to improve the contrast from low to the middle range. Meanwhile, the median score for HE has a significant output compare to the original images and the dispersion of luminance exceeding 100. Thus, these results showed that the HE method is a suitable technique compared to the CLAHE method for improving the luminance value in low contrast categories, particularly for scale values between 0 101.
Contrast modification for pre-enhancement process in … (Rohana Abdul Karim)
852
Table 4. Result on enhancement process based on category
TELKOMNIKA Telecommun Comput El Control, Vol. 21, No. 4, August 2023: 846-857
ISSN: 1693-6930
After that, the iris images after the HE method will go through the contrast modification method to improve the luminance value. Table 6 shows that the luminance value after contrast modification method in the (0 101) scale with HE method. From the results, images with the HE method after contrast increment by 30% 50% achieved the optimum contrast scale. HE method enhances the image contrast based on the entire image histogram with low computational. However, images in the 0 24 scale did not show any improvement for luminance value. The decrement contrast after HE method did not perform well at this stage due to the iris images in the (0 101) categories are not suitable for decrement contrast.
Finally, the performance measure is calculated based on the MSE and PSNR values. Figure 8 shows that the MSE and PSNR are low based on the recommendation method. The proposed method yields an average MSE 18.25 and an average PSNR of 28.87. Low MSE indicates that the image quality is good because an error in the image became decreasing while the higher PSNR value indicates the better quality of an image. Figure 9 shows a visual output of the image enhancement. The original image is depicted in Figure 9(a), Figure 9(b) illustrates a contrast reduction of 10%, Figure 9(c) a contrast reduction of 20%, Figure 9(d) a contrast reduction of 30%, Figure 9(e) a contrast reduction of 40%, and Figure 9(f) a contrast reduction of 50%. On the other hand, Figure 9(g) presents a contrast increment of 10%, Figure 9(h) demonstrates a contrast increment of 20%, Figure 9(i) has a contrast increment of 30%, Figure 9(j) has a contrast increment of 40%, and Figure 9(k) depicts a contrast increment of 50%.
Contrast modification for pre-enhancement process in … (Rohana Abdul Karim)
(a) original image, (b) contrast decrement by 10%, (c) contrast decrement by 20%, (d) contrast decrement by 30%, (e) contrast decrement by 40%, (f) contrast decrement by 50% respectively, (g) contrast increment by 10%, (h) contrast increment by 20%, (i) contrast increment by 30%, (j) contrast increment by 40%, and (k) contrast increment by 50% respectively

TELKOMNIKA Telecommun Comput El Control, Vol. 21, No. 4, August 2023: 846-857
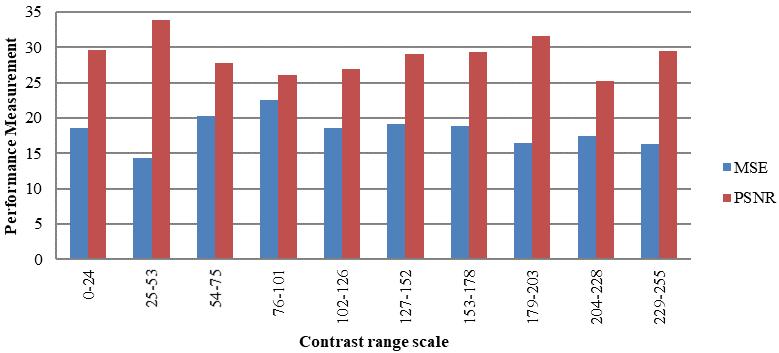
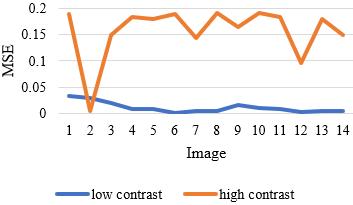
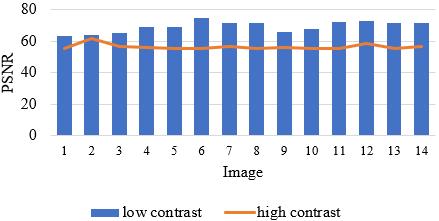
Figure 10 illustrates the PSNR validation results for the enhancement of low and high contrast measurements. The graph has shown a consistence performance with a maximum PSNR is 74.68 and a minimum PSNR is 63.1. A greater PSNR indicates a good quality performance for the enhancement image. Meanwhile, the results obtained from the MSE are shown in Figure 11. The average value for low and high contrast being 0.012 and 0.15 respectively. It indicates that the proposed method produces high-quality images.
This study shows that many iris images have poor luminance value due to the low lighting during the capturing of iris images. The contrast adjustment in the pre-enhancement step is critical to avoid over-enhancement, which results in the loss of iris image information. In conclusion, a 50% increment of contrast is suitable for images with luminance values from the scale 102 126. The combination of HE method with a 50% contrast increment is appropriate for images scale 25 101. Meanwhile, for images in the middle contrast category, the original contrast is preserved. Finally, images in the high contrast category must decreasing contrast by 50%. The noise was minimised after the pre-enhancement procedure by contrast increment or decrement, resulting in low MSE and PSNR values. Besides that, the result shows that the proposed method was valid for all multiresolution images. In future, human assessment validation of the contrast category with scale and the gray name is needed to clarify the results.
We would like to acknowledge funding from Universiti Malaysia Pahang research grant (RDU200323).
ISSN: 1693-6930
[1] D. Pagoulatos and C. Georgakopoulos, “Rubeosis iridis,” Pan African Medical Journal, vol. 28, no. 279, 2017, doi: 10.11604/pamj.2017.28.279.13717.
[2] X. Liang, Y. Zhang, Y. -P. Li, W. -R. Huang, J. -X. Wang, and X. Li, “Frequency and risk factors for neovascular glaucoma after vitrectomy in eyes with diabetic retinopathy: An observational study,” Diabetes Therapy, vol. 10, pp. 1801-1809, 2019, doi: 10.1007/s13300-019-0644-0.
[3] G. R. Slean, A. D. Fu, J. Chen, and A. Kalevar, “Neovascularization of the iris in retinoschisis,” American Journal of Ophthalmology Case Reports, vol. 7, pp. 99-101, 2017, doi: 10.1016/j.ajoc.2017.06.019.
[4] L. Laatikainen, “Development and classification of rubeosis iridis in diabetic eye disease,” British Journal of Ophthalmology, vol. 63, no. 3, pp. 150-156, 1979, doi: 10.1136/bjo.63.3.150.
[5] R. Aminah and A. H. Saputro, “Diabetes prediction system based on iridology using machine learning,” in 2019 6th International Conference on Information Technology, Computer and Electrical Engineering (ICITACEE), 2019, pp. 1-6, doi: 10.1109/icitacee.2019.8904125.
[6] R. Hassan, S. Kasim, W. A. Z. W C Jafery, and Z. A Shah, “Image enhancement technique at different distance for iris recognition,” International Journal on Advanced Science, Engineering and Information Technology, vol. 7, no. 4-2, pp. 1510-1515, 2017, doi: 10.18517/ijaseit.7.4-2.3392.
[7] R. K. Hapsari, M. I. Utoyo, R. Rulaningtyas, and H. Suprajitno, “Comparison of histogram based image enhancement methods on iris images,” Journal of Physics: Conference Series, 2020, vol. 1569, doi: 10.1088/1742-6596/1569/2/022002.
[8] Sanpachai H. and S. Malisuwan, “A study of image enhancement for iris recognition,” Journal of Industrial and Intelligent Information, vol. 3, no. 1, pp. 61-64, 2015, doi: 10.12720/jiii.3.1.61-64.
[9] C. Liu, X. Sui, X. Kuang, Y. Liu, G. Gu, and Q. Chen, “Adaptive contrast enhancement for infrared images based on the neighborhood conditional histogram,” Remote Sensing, vol. 11, no. 11, 2019, doi: 10.3390/rs11111381.
[10] S. Das, T. Gulati, and V. Mittal, “Histogram equalization techniques for contrast enhancement: A review,” International Journal of Computer Applications, vol. 114, no. 10, pp. 32-36, 2015, doi: 10.5120/20017-2027.
[11] K. G. Suma and V. S Kumar, “A quantitative analysis of histogram equalization-based methods on fundus images for diabetic retinopathy detection,” Computational Intelligence and Big Data Analytics, pp. 55-63, 2018, doi: 10.1007/978-981-13-0544-3_5.
[12] F. Mustaghfirin, Erwin, H. K Putra, U. Yanti, and R. Ricadonna, “The comparison of iris detection using histogram equalization and adaptive histogram equalization methods,” Journal of Physics: Conference Series, 2019, vol. 1196, doi: 10.1088/17426596/1196/1/012016.
[13] N. B. A. Mustafa, W. M. D. W. Zaki, A. Hussain, and J. C Hamzah, “Modified curvature-based trigonometric identities for retinal blood vessel tortuosity measurement in diabetic retinopathy fundus images,” International Journal of Engineering and Technology, vol. 7, no. 4.11, pp. 133-139, 2018, doi: 10.14419/ijet.v7i4.11.20788.
[14] Q. Cao, Z. Shi, R. Wang, P. Wang and S. Yao, “A brightness-preserving two-dimensional histogram equalization method based on two-level segmentation,” Multimedia Tools and Applications, vol. 79, pp. 27091-27114, 2020, doi: 10.1007/s11042-020-09265-y.
[15] U. K. Acharya and S. Kumar, “Directed searching optimized mean-exposure based sub-image histogram equalization for grayscale image enhancement,” Multimedia Tools and Applications, vol. 80, pp. 24005-24025, 2021, doi: 10.1007/s11042-021-10855-7.
[16] S. Yelmanov and Y. Romanyshyn, “Image enhancement in automatic mode by recursive mean-separate contrast stretching,” Data Stream Mining & Processing, 2020, vol. 1158, pp. 288-306, doi: 10.1007/978-3-030-61656-4_19.
[17] A. Paul, T. Sutradhar, P. Bhattacharya, and S. P. Maity, “Adaptive clip-limit-based bi-histogram equalization algorithm for infrared image enhancement,” Applied Optics, vol. 59, no. 28, pp. 9032-9041, 2020, doi: 10.1364/AO.395848.
[18] R. A. Karim, N. A. A. A. Mobin, N. W. Arshad, N. F. Zakaria, and M. Z. A. Bakar, “Early rubeosis iridis detection using feature extraction process,” Lecture Notes in Electrical Engineering, Singapore: Springer, 2020, vol. 632, pp. 379-387, doi: 10.1007/978981-15-2317-5_32.
[19] J. F. Banzi and Z. Xue, “An automated tool for non-contact, real time early detection of diabetes by computer vision,” International Journal of Machine Learning and Computing, vol. 5, no. 3, pp. 225-229, 2015, doi: 10.7763/ijmlc.2015.v5.511.
[20] A. Bansal, R. Agarwal, and R. K. Sharma, “Determining diabetes using iris recognition system,” International Journal of Diabetes in Developing Countries, vol. 35, pp. 432-438, 2015, doi: 10.1007/s13410-015-0296-1.
[21] N. Padmasini, R. Umamaheswari, R. Kalpana and M. Y. Sikkandar, “Comparative study of iris and retinal images for early detection of diabetic mellitus,” Journal of Medical Imaging and Health Informatics, vol. 10, no. 2. pp. 316-325, 2020, doi: 10.1166/jmihi.2020.2973.
[22] P. Samant and R. Agarwal, “Machine learning techniques for medical diagnosis of diabetes using iris images,” Computer Methods and Programs in Biomedicine, vol. 157, pp. 121-128, 2018, doi: 10.1016/j.cmpb.2018.01.004.
[23] R. Fan, X. Li, S. Lee, T. Li, and H. L. Zhang, “Smart image enhancement using CLAHE based on an F-shift transformation during decompression,” Electronics, vol. 9, no. 9, 2020, doi: 10.3390/electronics9091374.
[24] M. Oller, C. Esteban, P. Pérez, M. À. Parera, R. Lerma, and S. Llagostera, “Rubeosis iridis as a sign of underlying carotid stenosis,” Journal of Vascular Surgery, vol. 56, no. 6, pp. 1724-1726, 2012, doi: 10.1016/j.jvs.2012.06.073.
[25] V. S. E. Jeganathan, A. Wirth, and M. P. MacManus, “Ocular risks from orbital and periorbital radiation therapy: A critical review,” International Journal of Radiation Oncology, Biology, Physics, vol. 79, no. 3, pp. 650-659, 2011, doi: 10.1016/j.ijrobp.2010.09.056.
[26] Iris image dataset (2018). Accessed: Dec. 25, 2018. [Online]. Available: http://photos1.blogger.com/blogger/3488/1320/1600/DSC07882.jpg
[27] Iris image dataset (2018). Accessed: Dec. 25, 2018. [Online]. Available: http://www.adeluque.com/images/textos/f5aa26_Rubeosis%20iris.JPG
[28] D. Hannouche and T. H -Xuan. “Chapter 6 Acute Conjunctivitis.” Ento KeyFastest Otolaryngology & Ophthalmology Insight Engine https://entokey.com/acute-conjunctivitis/ (accessed: 25, 2018)
[29] Rubeosis of the iris: Causes (2020). https://www.informacionopticas.com/rubeosis-del-iris/ (accessed: Dec. 25, 2018)
[30] M. A. Qureshi, A. Beghdadi, and M. Deriche, “Towards the design of a consistent image contrast enhancement evaluation measure,” Signal Processing: Image Communication, vol. 58, pp. 212-227, 2017, doi: 10.1016/j.image.2017.08.004.
[31] M. A. Qureshi, A. Beghdadi, B. Sdiri, M. Deriche, and F. A. -Cheikh, “A comprehensive performance evaluation of objective quality metrics for contrast enhancement techniques,” in 2016 6th European Workshop on Visual Information Processing (EUVIP), 2016, pp. 1-5, doi: 10.1109/euvip.2016.7764589.
[32] A. Beghdadi, M. A. Qureshi, and M. Deriche, “A critical look to some contrast enhancement evaluation measures,” in 2015 Colour and Visual Computing Symposium (CVCS), 2015, pp. 1-6, doi: 10.1109/cvcs.2015.7274888.
Rohana Abdul Karim is a Senior Lecturer at Faculty of Electrical & Electronic Engineering Technology, Universiti Malaysia Pahang (UMP). She received the Bachelor Degree in Electrical Engineering from Universiti Teknologi Tun Hussein Onn (UTHM) in 2005 and a Master of Computer Science from Universiti Putra Malaysia in 2007. Her PhD from the National University of Malaysia (UKM) in 2017. Her research interests include biomedical engineering, computer vision, image processing, pattern recognition, video analysis and artificial intelligent techniques. Dr. Rohana research’s work has been awarded the best paper award at International Conference and Exhibition of Women Engineers (ICEWE11’) and International Conference on Electrical, Control and Computer Engineering (InECCE2017). Her research work has won several international and local innovation competitions including the International Invention, Innovation and Technology Exhibition (ITEX 2010), International Engineering Invention and Innovation Exhibition (i-envex 2011), BIOMALAYSIA 2011, International Festival of Innovation on Green Technology (i-finog 2018 and 2019). She can be contacted at email: rohanaak@ump.edu.my
Nurul Wahidah Arshad is a Lecturer at Faculty of Electrical & Electronic Engineering Technology, Universiti Malaysia Pahang (UMP). She received a B. Eng. (Hons) degree in Electrical Engineering (Electronics) from Universiti Teknologi Tun Hussein Onn (UTHM) in 2006, and M.Sc. degree in Communications and Signal Processing from Newcastle Upon Tyne University, United Kingdom, in 2008. Her research interests include computer vision, image processing, speech processing, artificial intelligent and engineering education. Nurul Wahidah research’s work has been won several international and local innovation competitions including the British Invention Showcase (BIS 2013), International Invention, Innovation and Technology Exhibition (ITEX 2010, 2013 and 2019), and International Engineering Invention & Innovation Exhibition (i-envex 2014). She can be contacted at email: wahidah@ump.edu.my

Yasmin Abdul Wahab received a B. Eng. (Hons) degree in Electrical Engineering (Control and Instrumentation), M. Eng. and Ph.D. degrees in Electrical Engineering from Universiti Teknologi Malaysia (UTM), Johor, Malaysia, in 2008, 2010, and 2017, respectively. In 2010, she joined Universiti Malaysia Pahang (UMP), Pahang, Malaysia, as a teaching staff member and at present she holds the position of senior lecturer. Her research interests include process tomography, electrical tomography, sensors technology and instrumentation, and applied electronics and computer engineering. She can be contacted at email: yasmin@ump.edu.my