TELKOMNIKA Telecommunication Computing Electronics and Control
Vol. 21, No. 4, August 2023, pp. 742~749
ISSN: 1693-6930, DOI: 10.12928/TELKOMNIKA.v21i4.22759

TELKOMNIKA Telecommunication Computing Electronics and Control
Vol. 21, No. 4, August 2023, pp. 742~749
ISSN: 1693-6930, DOI: 10.12928/TELKOMNIKA.v21i4.22759
Siti Monalisa, Yosie Juniarti, Eki Saputra, Fitriani Muttakin, Tengku Khairil Ahsyar Information System Department, Faculty of Science and Technology, Sultan Syarif Kasim State Islamic University, Pekanbaru, Riau, Indonesia
Article Info
Article history:
Received Jan 05, 2022
Revised Jul 20, 2022
Accepted Oct 26, 2022
Keywords:

Customer segmentation
DBSCAN
Demographic
RFM
Silhouette index
ABSTRACT
The aims of this research was to identify prospective customers by conducting customer segmentation based on recency, frequency, monetary (RFM) values and demographic variables. The step were selected the data and normalized. The normalized data were clustered using the density based spatial clustering of applications with noise (DBSCAN) algorithm. The k-dist graph was utilized with RStudio tools to identify the best values for epsilon and MinPts. The outcome of utilizing epsilon 0.06 and MinPts 3 was the identification of 5 clusters and 31 data points considered as noise, resulting in a silhouette index (SI) value of 0.4222. Based on the average RFM values, cluster 1 was categorized as prospective customers, while clusters 2, 3, 4, and 5 were designated as loyal customers. Furthermore, according to demographic analysis, the majority of customers are between the ages of 35 to 45, female, married, and housewives. Women, groceries, such as rice and cooking oil, were the most popular products. Besides, the customers were mostly lecturers and lived in Pekanbaru. This was compatible with the customer target of people from upper middle class, such as lecturers, and with the location of the mart as well, which was near a campus.
This is an open access article under the CC BY-SA license.
Corresponding Author:
Siti Monalisa
Information System Department, Faculty of Science and Technology
Sultan Syarif Kasim State Islamic University, Pekanbaru, Riau, Indonesia
Email: siti.monalisa@uin-suska.ac.id
Customer segmentation is the process of classifying customers into separate categories based on shared characteristics [1], [2]. The customer segmentation gives the understanding about customers which is needed by the company, helps to identify the prospective customers [3], and helps to classify the customers with similar characteristics. In customer segmentation, there is segmentation based on behavior with the most commonly used segmentation models being recency, frequency, and monetary [4]. The field of retail marketing and retail decision-making has extensively researched customer behavior [5]. For the past two decades, this model has been utilized to categorize customer databases according to their purchasing behavior [6].
Hughes introduced the of recency, frequency, and monetary (RFM) model in 1994 as a means of analyzing customer behavior [7]. The model factors in a customer’s recency (the interval since their most recent purchase), frequency (the number of purchases they make in a particular time period), and monetary value (the amount they spend on each transaction) to determine their value [2]. As a result, businesses can determine which customers are worth engaging and maintaining by using this effective method of predicting customers’ future purchasing behavior [8].
212 mart is a retail business that focuses on the monetary aspect when it comes to customer segmentation. 212 mart only gave a special treatment to the customers who had high monetary value, or the
Journal homepage: http://telkomnika.uad.ac.id
customers who made large transaction value. 212 mart had done nothing from the recency and frequency side, which made it ineffective to identify the prospective customers. As a result, a recency variable needed to be added to provide information about the interval between the latest transaction time and analysis time. Also, a frequency variable was needed to provide information that the customers with high frequency showed bigger customer loyalty. The prospective customers can be identified effectively by using those three RFM variables and can also be used as a development of an effective marketing strategy [8]. In the RFM model, the customers are categorized into 4 characteristics based on the RFM average value. They are prospective customers, new customers, lost customers, and loyal customers [9]
Aside from the segmentation based on RFM, the segmentation can also be analyzed based on demographic, which is the most common form of market segmentation and the easiest to understand as well. The information obtained from demographic segmentation is easy to interpret, collect, and transfer from one study to another due to the ease of collecting such information [10]. The variables of demographic that are commonly used are age, gender, family size and type, income, occupation, education level, race, and nationality [11]. Demographic is a statistic defined for the customer population data set. Also, demographic is used in marketing and public opinion polls or public view of a trend [12].
Clustering is a data mining method employed to group data into various segments according to their characteristics. The data with similar characteristics will be in the same segment, while those who do not have similar characteristics will be separated into a different segment [13]. One of the commonly used algorithm in clustering techniques is density based spatial clustering of applications with noise (DBSCAN) The algorithm can find clusters of any shape at one density condition [14] and can handle large-scale data, can detect an outlier and categorize bigger data with different form and size [15]
This research consisted of 5 steps, the first step was preprocessing data. The data were selected based on the RFM criteria, and then were transformed into the RFM. After that, the data were normalized so that the data scale would not be too far, as the �� value was currency value in rupiah. Unlike �� and �� values [16], whose values were normalized with the Min-Max method and a range of 0 to 1, this method used a range of 0–1 [16] In this study RN is normalized for recency, RF is normalized for frequency and MN is normalized for monetary. Here is the formula for calculating the normalization number :
The second one is clustering the data by using the DBSCAN algorithm. We need to determining the optimal values of epsilon and MinPts. In order to do it, a k-dist graph was used, by observing the shift of epsilon values from �� values. The points that experienced drastic shift or change in the k-dist graph were used as the epsilon values, while the �� values were used as MinPts [15]. The third step is measuring the cluster quality using silhouette index (SI). After obtaining the best cluster, the fourth step is determining the rank symbol of each cluster. The average value of the RFM attribute for each cluster was used to look for the rank symbol. Finally, in the fifth step, an analysis based on the demographic variable was performed.
Hughes introduced the RFM model in 1994, which is a behavior-based customer segmentation technique that evaluates a customer’s past behavior. It segments customers based on recency (the time their most recent buy and the current), frequency (the volume of transactions during a specific time period), and monetary value (how much was spent on transactions) [8]. The RFM model enables companies to easily assess customer loyalty towards their products and services, allowing them to optimize their profits [17] In order to determine customer value based on RFM value, clusters of customers with an RFM value higher than average are denoted with ‘↑’, while clusters with a lower RFM value are denoted with ‘↓’ The cluster of customers denoted by �� ↑ �� ↑ �� ↑ is referred to as loyal customers, while those denoted by �� ↓ �� ↓ �� ↓ are considered lost of customers. Customers denoted by �� ↑ �� ↓ �� ↓ are new customers, and those denoted by �� ↑ �� ↑ �� ↓ are prospective customers. Table 1 provides an explanation of customer characteristics based on their RFM value [9].
DBSCAN is a density-based clustering algorithm that clusters data points with high density into a group [18]. The algorithm is guided by two essential parameters, epsilon and MinPts. Epsilon represents the greatest distance within a cluster of data values, while MinPts represents the minimum number of data points required to form a cluster within the epsilon radius [19].
The followings are the steps of the DBSCAN algorithm:
a) Randomly select a data point from the dataset as the starting point for the core point candidate.
b) Establish the values for epsilon and MinPts.
c) If the starting point which has been selected is sufficient with the core point based on the user-defined epsilon and MinPts values, a cluster will be formed with its neighboring object. The distance between the object in the core point and neighboring object can be measured by using euclidean equation:
d) If the beginning point object is a border point and the starting point object does not have a density-reachable connection with it, the DBSCAN will visit the following object from the data set to become the following core point.
e) Do process 3 and 4 again until all points have been visited.
f) If the selected object is not sufficient as a center point or border point in the formed cluster, then it will belong to the outlier data, which are the data that have bigger distance than the distance between epsilon and core point, but have less number of objects than the specified MinPts.
1 R↑ F↑ M↑ Loyal customers
The customers who have a high average monetary value indicate that the amount of money issued for the companies is great in value as well. Also, the high average of frequency and recency indicates that the customers often make transactions.
2 R↓ F↓ M↓ The lost of customers Customers in this segment have low average values for monetary, frequency, and recency, indicating that they seldom make transactions and spend less money than the average customer.
3 R↑ F↓ M↓ New customers This segment is designated for customers who have recently started purchasing, with a lower number of transactions and total spending amount than the average transaction.
4 R↑ F↑ M↓ Prospective customers This segment shows the customers who have high average recency and frequency values, but have low average monetary value. They have a high level of response, just recently make transactions which are quite often, and thus, make them become the prospective customers for the companies.
Silhouette index was firstly introduced by Rousseeuw in 1987, who combined the polymerization factor of intra-cluster and resolution between clusters to evaluate the cluster quality [20], [21] in order to better represent the separability of clusters, and to be cluster validity. Silhouette index is useful when the data are on a ratio scale (euclidean distance) and when looking for a clearly separated data set [22]. Silhouette index describes a description of the accuracy of an object in its occupied cluster The optimal cluster has a high silhouette index value or close to 1. If the si value is close to 1, it means that the cluster is very dense. However, If the si value is near to -1, the cluster that contains object i is not dense [23] Here is the equation used to measure the silhouette index value: ��(��) = ��(��) ��(��) (��(��),��(��))
The data used were the transaction data of the customers who have member cards in 212 mart and made transactions on January December 2020. There were 1,205 customers who met these criteria. The data were selected based on the RFM criteria and was normalized using by using (1) with range 0 1. The result is shown in Table 2 and Table 3.
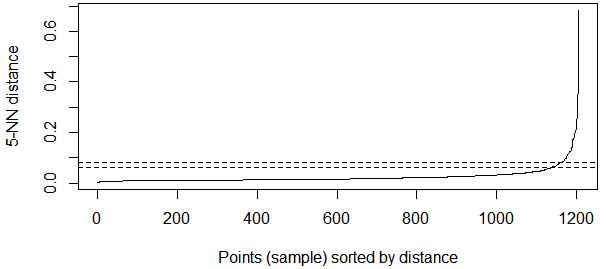
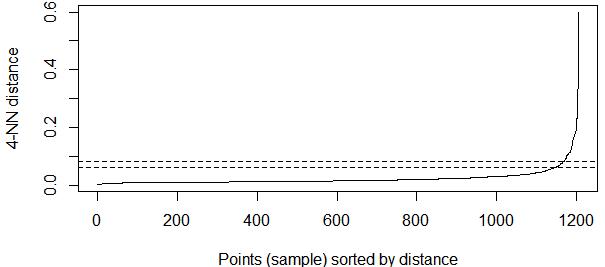
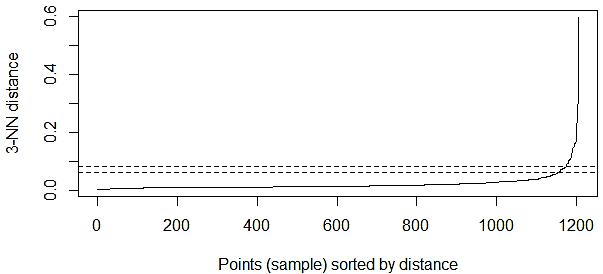
The next step was clustering the data using the DBSCAN algorithm. To determining the optimal values of epsilon and MinPts, a k-dist graph was used. K-dist was searched at �� =3, �� =4, and �� =5 using �� studio. The results of k-dist graph values are as shown in Figure 1, Figure 2, and Figure 3.
Based on Figure 1, Figure 2, and Figure 3, the points which experience the drastic change are at 0.06 until 0.08. Therefore, the optimal values of epsilon and MinPts are in the range 0.06 and 0.08 with MinPts 3, 4, and 5. The DBSCAN results can be seen in Table 4. After obtaining the results of the clusters, the next thing to do was validating the cluster to know the optimal number of clusters, as well as the quality and power of clusters in each epsilon and MinPts values. The results of the cluster validation are in Table 5.
Based on Table 5, the highest SI value is at Eps 0.06 and MinPts 3 whose SI value is close to 1. It is 0.4222 and, hence, can be said as the most optimal cluster. The epsilon value 0.06 and MinPts 3 produce 5 clusters with 31 noisy data. The next consist of 1,118 customers in cluster 1, 7 customers in cluster 2, 14 customers in cluster 3, 9 customers in cluster 4, and 26 customers in cluster 5.
The next step was determining the rank symbol of each cluster. The average value of the RFM attribute for each cluster was used to look for the rank symbol. The cluster whose average value of frequency and monetary was higher than the average value of frequency and monetary before clustering was given the symbol ↑, while the cluster whose average value of frequency and monetary was lower than the average value of frequency and monetary before clustering was given the symbol ↓ [9]. In contrast to frequency and monetary,
Customer segmentation with RFM models and demographic variable using … (Siti Monalisa)
if the average value of recency after clustering was higher than the one before clustering, it was given the symbol ↓. On the contrary, if the average value of recency after clustering was lower than the one before clustering, it was given the symbol ↑. This was because the shorter the interval between the last purchase time and analysis period, the greater the recency value [24]. Table 6 displays the RFM average value prior to clustering, Table 7 displays the best RFM cluster average values, and Table 8 displays the rank symbol findings for each cluster.
Based on Table 8, the group of customers in cluster 1 is the customers categorized as prospective customers (�� ↑ �� ↑ �� ↓). Customers in this group have higher average �� and �� values than the average transaction value, which indicate that those customers have recently shopped in a frequent or repeated period of time. The 212 mart party can actively contact these customers to offer new products accompanied by promotional activities and various new gifts which aim at increasing the customers’ interest in buying the products and increasing the sum of money paid.
Cluster 2, 3, 4, and 5 have the same rank symbol (�� ↑ F ↑ M ↑), which shows that the customers in those clusters belong to the category of loyal customers. The customers in this segment are highly retainable customers. The 212 mart party must maintain the customers’ loyalty by regularly giving information on the latest products. Through transactions, we can better comprehend their purchasing behavior and needs and providing benefits which the customers can get every time they make a transaction on a certain value.
The company can also increase the reward program for the customers according to the spending made by them. The analysis of customer segmentation based on demographic variables, such as gender, age, employment, address, and marital status, was the next task after getting the RFM rank for each cluster. Table 9 and Table 10 show the consumer demographics.
Based on Table 9 and Table 10, the information is obtained that the majority of the customers are from the prospective customers category (cluster 1) and consist of 1118 customers. It is many of them are middle-age customers with an age range of 35 44 years (34%), dominated by female (744 67%), work as a lecturer (312 28%), live in Pekanbaru (95%), and, mostly, is married (1029 92%). Meanwhile, the number of the customers from the category of loyal customers (cluster 2, 3, 4, and 5) are 56 people in total, and most of them are 35 44 years old (30%), female, which as many as 42 people (75%), mostly work as a lecturer (41%), live in Pekanbaru (95%), and almost all of them are married (92%).
This study segmented the customers of 212 mart based on RFM and demographics using the DBSCAN algorithm. Customer data were clustered into different segments based on RFM variables. Then, the data were analyzed based on RFM rank and estimating each cluster’s average value categorizing consumers based on their traits in accordance with the theory [9]. Two customer segments were obtained, namely loyal and potential category. Then, both customer characteristics were analyzed based on demographics. The demographic variables used were age, gender, occupation, address and marital status. This analysis produces an understanding of customers and proposed strategies that will be applied to each customer segment based on their characteristics.
A research on RFM and demographic-based consumer segmentation had previously been carried out [25] using customer data of five-star hotels in Antalya, Turki. The difference with this study is the algorithm used for the clustering process, which was the self-organizing map (SOM) and K-means algorithm. Also, the demographic variables used here were gender, age, nationality and travel companion. The findings showed 8 clusters, with the majority of customers belonging to the “lost customers” segment, who remain for a shorter amount of time, and being predominately male. Results showed that RFM clusters the customers effectively, which might encourage senior managers to develop original suggestions for improving their customer relationship management (CRM) abilities.
This study provides information that from the existing 5 clusters, 2 categories of customers are generated based on customer characteristics, namely loyal customers and prospective customers. Customers who belonged in the loyal category made repetitive transactions and often spent large amount of money. Customers belong to this category are very worthy of being maintained by the company by providing the best service, so that these customers will stay and not become targets by other companies. Based on demographic analysis, the majority of 212 mart’s customers were middle-age customers (35 44; 34%), female (786; 67%), and married (1080; 92%), which showed that the majority of 212 mart’s customers are housewives. This can also be seen from the products sold at 212 mart were products that were related to women or housewives. Besides that, the mostly purchased items were groceries such as rice and oil, as well as household items such as washing supplies and toiletries. In addition, the majority customers of 212 mart worked as lecturers (335; 25%), and stayed in Pekanbaru. It was because the target customers of 212 mart were the upper middle class, such as lecturers, and also the locationof212 mart was close to the campus.
[1] J. Zhou, J. Wei, and B. Xu, “Customer segmentation by web content mining,” Journal of Retailing and Consumer Services, vol. 61, 2021, doi: 10.1016/j.jretconser.2021.102588.
[2] H. Abbasimehr and A. Bahrini, “An analytical framework based on the recency, frequency, and monetary model and time series clustering techniques for dynamic segmentation,” Expert Systems with Applications, vol. 192, 2022, doi: 10.1016/j.eswa.2021.116373.
[3] A. J. Christy, A. Umamakeswari, L. Priyatharsini, and A. Neyaa, “RFM ranking – An effective approach to customer segmentation,” Journal of King Saud University - Computer and Information Sciences, vol. 33, no. 10, 1251-1257, 2021, doi: 10.1016/j.jksuci.2018.09.004.
[4] N. Antonio, A. de Almeida, and L. Nunes, “A hotel’s customers personal, behavioral, demographic, and geographic dataset from Lisbon, Portugal (2015–2018),” Data in Brief, vol. 33, 2020, doi: 10.1016/j.dib.2020.106583.
[5] M. A. Rahim, M. Mushafiq, S. Khan, and Z. A. Arain, “RFM-based repurchase behavior for customer classification and segmentation,” Journal of Retailing and Consumer Services, vol. 61, 2021, doi: 10.1016/j.jretconser.2021.102566.
[6] R. G. Martínez, R. A. Carrasco, J. G -Madariaga, C. P. Gallego, and E. H -Viedma, “A comparison between Fuzzy Linguistic RFM Model and traditional RFM model applied to Campaign Management. Case study of retail business,” Procedia Computer Science, vol. 162, pp. 281–289, 2019, doi: 10.1016/j.procs.2019.11.286.
ISSN: 1693-6930
[7] R. W. S Brahmana, F. A. Mohammed, and K. Chairuang, “Customer Segmentation Based on RFM Model Using K-Means, K-Medoids, and DBSCAN Methods,” Lontar Komputer : Jurnal Ilmiah Teknologi Informasi, vol. 11, no. 1, 2020, doi:10.24843/lkjiti.2020.v11.i01.p04.
[8] J. -T. Wei, S -Y. Lin, and H. -H. Wu, “A review of the application of RFM model,” African Journal of Business Management, vol. 4, no. 19, pp. 4199–4206, 2010. [Online]. Available: https://academicjournals.org/article/article1380555001_Wei%20et%20al.pdf
[9] J. T. Wei, M. -C. Lee, H. -K. Chen, and H. -H. Wu, “Customer relationship management in the hairdressing industry: An application of data mining techniques,” Expert Systems with Applications, vol. 40, no. 18,pp. 7513–7518, 2013, doi: 10.1016/j.eswa.2013.07.053.
[10] J. Joung and H. Kim, “Interpretable machine learning-based approach for customer segmentation for new product development from online product reviews,” International Journal of Information Management, vol. 70, 2023, doi: 10.1016/j.ijinfomgt.2023.102641.
[11] T. P. Beane and D. M. Ennis, “Market Segmentation: A Review,” Europen Journal of Marketing, vol. 21, no. 5, pp. 20–42, 1987, doi: 10.1108/EUM0000000004695
[12] P. A. Sarvari, A. Ustundag, and H. Takci, “Performance Evaluation of Different Customer Segmentation Approaches Based on RFM and Demographics Analysis,” Kybernetes, vol. 45, no. 7, pp. 1129-1157, 2016, doi: 10.1108/K-07-2015-0180
[13] M. Verma, M. Srivastava, N. Chack, A. K. Diswar, and N. Gupta, “A Comparative Study of Various Clustering Algorithms in Data Mining,” International Journal of Engineering Research and Applications, vol. 2, no. 3, pp. 1379–1384, 2012. [Online]. Available: https://www.ijera.com/papers/Vol2_issue3/ID2313791384.pdf
[14] W. Jing, C. Zhao, and C. Jiang, “An improvement method of DBSCAN algorithm on cloud computing,” Procedia Computer Science, vol. 147, pp. 596–604, 2019, doi: 10.1016/j.procs.2019.01.208.
[15] S. Monalisa and F. Kurnia, “Analysis of DBSCAN and K-means algorithm for evaluating outlier on RFM model of customer behaviour,” Telkomnika (Telecommunication Computing Electronics and Control), vol. 17, no. 1, pp. 110–117, 2019, doi: 10.12928/TELKOMNIKA.v17i1.9394.

[16] E. W. T. Ngai, L. Xiu, and D. C. K. Chau, “Application of data mining techniques in customer relationship management: A literature review and classification,” Expert Systems with Applications, vol. 36, no. 2, pp. 2592–2602, 2009, doi: 10.1016/j.eswa.2008.02.021.
[17] S. M. S. Hosseini, A. Maleki, and M. R. Gholamian, “Cluster analysis using data mining approach to develop CRM methodology to assess the customer loyalty,” Expert Systems with Applications, vol. 37, no. 7, pp. 5259–5264, 2010, doi: 10.1016/j.eswa.2009.12.070.
[18] M. Ester, H. -P. Kriegel, J. Sander, and X. Xu, “A Density-Based Algorithm for Discovering Clusters in Large Spatial Databases with Noise,” KDD-96 Proceedings, 1996, pp. 226–231. [Online]. Available: https://file.biolab.si/papers/1996-DBSCAN-KDD.pdf
[19] A. L -Pakdehi and N. Daneshpour, “DBHC: A DBSCAN-based hierarchical clustering algorithm,” Data & Knowledge Engineering, vol. 135, 2021, doi: 10.1016/j.datak.2021.101922.
[20] X. Wang and Y. Xu, “An improved index for clustering validation based on Silhouette index and Calinski-Harabasz index,” IOP Conference Series: Materials Science and Engineering, 2019, vol. 569, no. 5, doi: 10.1088/1757-899X/569/5/052024.
[21] A. M. Bagirov, R. M. Aliguliyev, and N. Sultanova, “Finding compact and well-separated clusters: Clustering using silhouette coefficients,” Pattern Recognition, vol. 135, 2023, doi: 10.1016/j.patcog.2022.109144.
[22] P. J. Rousseeuw, “Silhouettes: A graphical aid to the interpretation and validation of cluster analysis,” Journal of Computational and Applied Mathematics, vol. 20, pp. 53–65, 1987, doi: 10.1016/0377-0427(87)90125-7.
[23] F. Batool and C. Hennig, “Clustering with the Average Silhouette Width,” Computational Statistics & Data Analysis, vol. 158, 2021, doi: 10.1016/j.csda.2021.107190.
[24] C. -H. Cheng and Y. -S. Chen, “Classifying the segmentation of customer value via RFM model and RS theory,” Expert Systems with Applications, vol. 36, no. 3, pp. 4176–4184, 2009, doi: 10.1016/j.eswa.2008.04.003.
[25] A. Dursun and M. Caber, “Using data mining techniques for profiling profitable hotel customers: An application of RFM analysis,” Tourism Management Perspectives, vol. 18, pp. 153–160, 2016, doi: 10.1016/j.tmp.2016.03.001.
Siti Monalisa Institut Teknologi Sepuluh November (ITS Surabaya), Indonesia, awarded Siti Monalisa a S.Kom. in informatics engineering in 2009, and in 2013 she earned a master’s degree in information system. She presently teaches and serves as the information system department secretary for the Science and Technology faculty at UIN Suska Riau. Her research interests are in Customer Relationship Management, Business Modelling, Information system Management. She can be contacted at email: siti.monalisa@uin-suska.ac.id.
Yosie Juniarti was born on June, 1998. She is the fifth child of five siblings. She educational experience has started from elementary school in 2005, continued at junior high school in 2011, then continued in high sxhool in 2014. She received the S.Kom. degree in information system from UIN Suska Riau, Pekanbaru, in 2021 with a 3.66 GPA. While undergoing status as a student, she had an internship at the Dinas Tenaga Kerja dan Transmigrasi Provinsi Riau in 2019. She also attended an Kuliah Kerja Nyata (KKN) in 2020. During collage, she also active in campus organization. She can be contacted at email: 11753202009@students.uin-suska.ac.id.

Eki Saputra is one of the lecturers who has been teaching at UIN Suska Riau since 2011. He teaches in the Information Systems Program at the Faculty of Science and Technology. In addition to being a lecturer, he has also served as the Head of the Information Systems Program at UIN Suska Riau. He obtained his Master’s degree in Computer Science at UPI Padang with his research interests being in Information Systems, Computer Networks, and Usability Testing. He also as a supervisor for the ISNC research team until now. He can be contacted at email: eki.saputra@uin-suska.ac.id
Fitriani Muttakin is a lecture and researcher at Universitas Islam Negeri Sultan Syarif Riau’s Information System Department since 2018. She earned her undergraduate degree in information systems from Universitas Islam Negeri Sultan Syarif Riau in 2007 and her master’s degree in computer science from the University of Gadjah Mada Yogyakarta in Indonesia. (2014). Business modeling and decision support systems are the main topics of her study. She can be contacted at email: fitrianimuttakin@uin-suska.ac.id.
Tengku Khairil Ahsyar learned his M.Kom in Computer Science from Indonesia’s Institut Pertanian Bogor (IPB) and his S.Kom in Information Systems from UIN Suska Riau. He began working as a lecture in 2011 at the UIN Suska Riau Information System Department. Information systems, human-computer interaction, networking, and organizational culture are among his areas of interest. The Information System Networking Club was founded by him (ISNC) He can be contacted at email: tengkukhairil@uin-suska.ac.id.