NATIONAL UPHEAVAL in the technology industry 3
During 2022 and 2023 the media reported widely on “The Great Tech Layoff” with large layoffs at many of the big tech firms including Alphabet (Google), Amazon, Apple, Meta, and Microsoft cutting around 112,000 employees in 2021-2022. However, this was after record expansions and these companies collectively have 719,000 more employees now than before the pandemic. As of January 2024, employment in the broader tech industry is growing with a tech unemployment rate of 3.3%, below the overall U.S. rate of 3.7%. Also, Bureau of Labor Statistics, estimates that between 2021 and 2031 jobs for software developers will grow by 25% and data scientists by 35%, far outpacing the 3% growth for all occupations, demonstrating the continued growth rate anticipated for key tech occupations.
0 5 10 15 20 25 30 35
Security Analysts
developers, quality assurance analysts, and testers
Developers All Occupations Percent change in employment, projected 2022-32 Bureau of Labor Statistics 2022-2032 US Job Outlook 32% 26% 17% 14% 3% Data: BLS Employment Projections Computer Occupations Data Scientists 35% 5
Information
Software
Web
MARKET Occupations St. Louis MSA –Employment U.S. –Employment St. Louis MSA –1 Yr Growth U.S. –1 Yr Growth Computer & Math Occupations 43,087 5,275,299 1.3% 3.0% TechSTL Occupations 89,187 11,300,476 2.0% 3.7% All Occupations 1,409,819 163,908,932 1 5% 2 2% TOTAL LABOR MARKET Summary of St. Louis MSA employment vs. USA 6 U.S. – 1 Year Growth AllOccupations Computer&Math TechSTLOccupations 0 1 2 3 4 1.3% 3.0% 2.0% 3.7% 1.5% 2.2% Growth in Employment – Year Ending Q3 2023 - JobsEQ STL US STL STL US US Growth in Employment – Year Ending Q3 2023 Growth in Employment – Year Ending Q3 2023
Area Occupations 2021 2022 % Change 2021-22 2023 % Change 2022-23 % Change 2021-23 St. Louis MSA Computer & Math 5,833 5,101 -12.5% 3,348 -34.4% -42.6% St. Louis MSA TechSTL Occupations 9,633 8,524 -11.5% 5,895 -30.8% -38.8% U.S. Computer & Math 517,858 433,300 -16.3% 318,696 -26.4% -38.5% U.S. TechSTL Occupations 899,664 760,270 -15.5% 586,190 -22.9% -34.8% ACTIVE TECH JOB POSTINGS Summary of St. Louis MSA vs. U.S. jobs 5 7 2021 - 2022 2022 - 2023 -35 -30 -25 -20 -15 -10 -5 0 Active Tech Job Postings, % Change Source: "Real Time Intelligence" JobsEQ, Chumura Economics, Accessed 1/25/24. Computer Computer Computer Computer & Math & Math & Math & Math STL STL STL STL US US US US TechSTL TechSTL TechSTL TechSTL Occupations Occupations Occupations Occupations Active Tech Job Postings, YTD 2021-23 (end of December) -12.5% -11.5% -16.3% -15.5% -34.4% -30.8% -26.4% -22.9%
POSTINGS
POSTINGS ACTIVE TECH JOB POSTINGS
A dashboard of total job postings in 2023 YTD
45% 2022 vs. 2023
2022 vs. 2023
13% 2022 vs. 2023
2022 vs. 2023
3% 2022 vs. 2023
4% 2022 vs. 2023

39,020
55

TOTAL JOB POSTINGS
TECH OCCUPATIONS
5,637
REGIONAL EMPLOYERS
UNIQUE JOB TITLES 10,000
356
REQUESTED CERTIFICATIONS
1,612 REQUESTED HARD SKILLS
JobsEQ Labor Market Research 2023 & 2022 8 Note: Based on job postings active 1/1/2022-12/31/23

Computer and Information Systems Managers 1. Software Developers 2. Computer User Support Specialists 3. Management Analysts 4. Network and Computer Systems Administrators 5. Computer Systems Engineers/Architects 6. Business Operations Specialists, All Other 7. Marketing Managers 8. Financial and Investment Analysts 9. Operations Research Analysts 10. Information Technology Project Managers 11. Information Security Analysts 12. Computer Systems Analysts 13. Software Quality Assurance Analysts and Testers 14. Market Research Analysts and Marketing Specialists 15. Computer and Information Research Scientists 16. Logistics Analysts 17. Database Administrators 18. Search Marketing Strategists 19. Web Developers 20. Business Intelligence Analysts 21. Graphic Designers 22. Geographic Information Systems Technologists 23. Financial Risk Specialists 24. Web and Digital Interface Designers 25. Fraud Examiners, Investigators and Analysts 26. Statisticians27. 6,335 5,199 4,211 3,267 2,738 2,292 2,194 1,531 1,252 1,242 1,206 1,039 909 680 646 532 407 404 353 337 298 290 249 141 130 117 107 JobsEQ Labor Market Research 2023 POSTINGS total postings in MSA by occupation in 2023 YTD JOB POSTINGS 23 ACTIVE TECH JOB POSTINGS 9 OCCUPATION Need more data? Contact Emily@TechSTL.com -44% -53% -34% -50% -47% -56% -32% -40% -39% -48% -42% -43% -39% -34% -35% -32% -42% -26% -48% -47% -40% -40% -27% -40% -52% -39% -22% 22v23

28. Logisticians 29. Database Architects 30. Data Warehousing Specialists 31. Computer Programmers 32. Computer Network Architects 33. Special Effects Artists and Animators 34. Business Continuity Planners 35. Computer Hardware Engineers 36. Document Management Specialists 37. Online Merchants 38. Sustainability Specialists 39. Financial Quantitative Analysts 40. Data Scientists 41. Health Informatics Specialists 42. Computer, Automated Teller, and Office Machine Repairers 43. Web Administrators 44. Telecommunications Engineering Specialists 45. Biostatisticians 46. Penetration Testers 47. Information Security Engineers 48. Blockchain Engineers 49. Digital Forensics Analysts 50. Clinical Data Managers 51. Logistics Engineers 52. Financial Specialists, All Other 53. Security Management Specialists 54. Computer Network Support Specialists 55. Video Game Designers 106 104 83 67 62 57 45 38 37 36 33 32 32 30 24 22 21 18 17 13 7 6 6 5 5 4 OCCUPATION JobsEQ Labor Market Research 2021-2022 2 2 JobsEQ Labor Market Research 2023 POSTINGS 10 Need more data? Contact Emily@TechSTL.com 22v23 -52% -53% -18% -71% -37% -35% -2% -82%-31% -13% -46% -35% -41% +9% +144% -36% -59% -60% -7% -56% -54% -25% -38% -17% -89% -67% -33% ACTIVE TECH JOB POSTINGS total postings in MSA by occupation in 2023 YTD JOB POSTINGS 23






MSA EMPLOYERS posting tech occupations
JobsEQ Labor Market Research 2023 8 9 10 1,706 1,034 782 1 2 3 st nd rd 653 574 506 488 470 456 390 354 11 4 5 6 7 11
EMPLOYERS TOP
in 2023





MSA EMPLOYERS posting tech occupations
JobsEQ Labor Market Research 2023 325 13 341 288 198 191 165 162 158 157 153 150 12 12 14 15 16 17 18 19 20 21 22
EMPLOYERS TOP
in 2023
EMPLOYERS
53%
5

47%
2019 2020 2021 2022 2023 0 2000 4000 6000 8000 10000 12000 Software Developers Software Developers Computer and Information Systems Managers Management Analysts Computer User Support Specialists Network and Computer Systems Administrators GROWTH GROWTH RATE of total job postings for top 5 occupations YEAR P O S T E D J O B S COVID-19 PANDEMIC 13 Network and Computer Systems
Computer and Information Management Computer User Support JobsEQ Labor Market Research | 1/1/2022 - 12/31/2023 Systems Managers Administrators Analysts Specialists 2023 2023
34% 56% 50%
YEAR GROWTH RATE OF TOTAL JOB POSTINGS BY TOP OCCUPATIONS - --2022 vs 2023 GROWTH RATES

2% WAGES AVERAGE ANNUAL WAGES of top 5 tech occupations in 2023 14 JobsEQ Labor Market Research 2023 | 1/1/2023 - 12/31/2023 Computer and Information Systems Managers $108K Average STL Salary $114,400 Average US Salary 5% LOWER Software Developers $115K Average STL Salary Average US Salary $117,200 LOWER Management Analysts $84K Average STL Salary Average US Salary $82,300 2%HIGHER Computer User Support Network and Computer Specialists System Administrators $44K $79K Average STL Salary Average US Salary $47,700 Average US Salary $82,400 Average STL Salary 8% LOWER 5% LOWER










EDUCATION HIGHER EDUCATION 15 "Integrated Post Secondary Education Data System" National Center for Education Statistics
UNIVERSITY UNIVERSITY UNIVERSITY UNIVERSITY UNIVERSITY UNIVERSITY UNIVERSITY COLLEGE
UNIVERSITY UNIVERSITY UNIVERSITY UNIVERSITY
UNIVERSITY COLLEGE
STL institutions offering tech certificates or degrees UNIVERSITY COLLEGE
COLLEGE


COLLEGE COLLEGE



COLLEGE


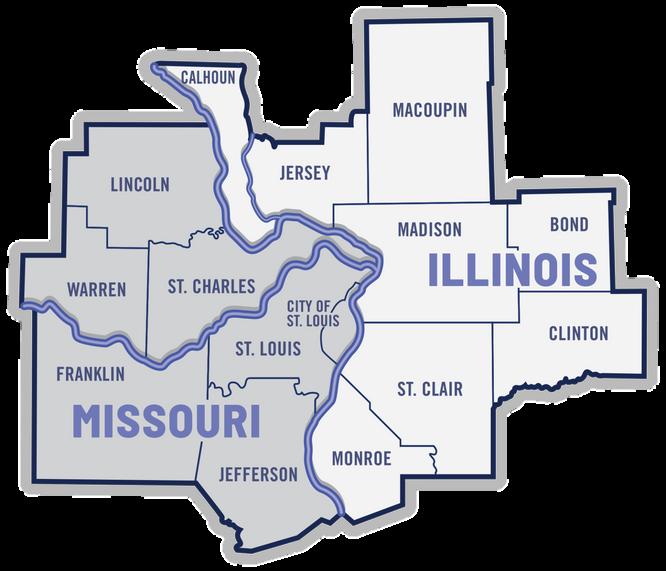
The St. Louis Metro
The 15 county bistate and
Metropolitan Statistical Area
COLLEGE
16 "Integrated Post Secondary Education Data System" National Center for Education Statistics
COLLEGE COLLEGE EDUCATION HIGHER EDUCATION
STL institutions offering tech certificates or degrees

Secret Clearance 1. Certified Information Systems Security Professional (CISSP) 2. Project Management Professional (PMP) 3. Cisco Certified Network Associate (CCNA) 4. CompTIA Security+ CE (Continuing Education) Certification 5. Certified Public Accountant (CPA) 6. Certified Information Security Manager (CISM) 7. Systems Security Certified Practitioner (SSCP) 8. Certified Information Systems Auditor (CISA) 9. GIAC Security Essentials Certification (GSEC) 10. Driver's License 11. Cisco Certified Network Professional (CCNP) 12. Certified ScrumMaster (CSM) 13. Microsoft Certified Solutions Expert (MCSE) 14. CompTIA A+ Certification (A+ Certification) 15. Chartered Financial Analyst (CFA) 16. CompTIA Advanced Security Practitioner (CASP) 17. Certified Cloud Security Professional (CCSP) 18. Series 66 - Uniform Combined State Law (Series 66) 19. Certification in Risk and Information Systems Control (CRISC) 20. GIAC Certified Incident Handler (GCIH) 21. GIAC Security Leadership Certification (GSLC) 22. Network+ Certification 23. Microsoft Certified Solutions Associate (MCSA) 24. Certified Internal Auditor (CIA) 25. Series 63 26. Series 7 27. 1,906 525 462 369 304 245 220 217 214 204 184 147 125 97 89 79 74 73 68 62 58 56 56 50 48 46 45 JobsEQ Labor Market Research 2023 SKILLS top requested certificates of 2023 TECH SKILLS DEMAND 17 CERTIFICATE TOTAL JOB ADS Need more data? Contact Emily@TechSTL.com

28. Cisco Certified Internetwork Expert (CCIE) 29. Amazon Web Services Certification (AWS Certification) 30. Certified Fraud Examiner (CFE) 31. AWS Certified Solutions Architect 32. GIAC Certified Intrusion Analyst (GCIA) 33. Offensive Security Certified Professional (OSCP) 34. Microsoft Certified Professional (MCP) 35. Certified System Administrator (CSA) 36. Certified Management Accountant (CMA) 37. Licensed Professional Engineer 38. Vmware Certified Professional (VCP) 39. GIAC Certified Enterprise Defender (GCED) 40. Certified Financial Risk Manager (FRM) 41. Certified Security Software Lifecycle Professional (CSSLP) 42. Implementation Specialist Certification 43. Information Systems Audit and Control Association Certification 44. Certified Financial Planner (CFP) 45. Fellow, Life Management Institute (FLMI) 46. PMI Agile Certified Practitioner (PMI-ACP) 47. Associate of the Society of Actuaries (ASA) 48. Certified Scrum Professional (CSP) 49. Microsoft Office Specialist (MOS) 50. Certified Business Continuity Professional (CBCP) 51. Cisco Certified Networking Technician (CCENT) 52. Microsoft Certified Solution Developer (MCSD) 53. Certification in Cardiopulmonary Resuscitation (CPR) 54. Salesforce Certified Administrator 40 36 31 30 30 30 29 28 27 27 24 23 22 22 22 22 21 21 21 19 19 19 18 18 18 17 17 JobsEQ Labor Market Research 2023 SKILLS top requested certificates of 2023 TECH SKILLS DEMAND 18 CERTIFICATE TOTAL JOB ADS Need more data? Contact Emily@TechSTL.com

Agile1. Microsoft Excel 2. Structured Query Language (SQL) 3. Microsoft Office 4. Computer Programming/Coding 5. Java6. Python7. Amazon Web Services (AWS) 8. Microsoft PowerPoint 9. Microsoft Azure 10. Linux11. Oracle12. JavaScript13. Information Security 14. Scrum15. Atlassian JIRA 16. Change Management 17. Presentation18. Data Analysis 19. Git20. Finance21. Microsoft Outlook 22. Mathematics23. Microsoft Word 24. Software Development 25. Computer Networking 26. Tableau27. 6,508 6,329 6,242 5,043 4,650 4,582 4,021 3,240 3,121 2,779 2,767 2,694 2,473 2,361 2,311 2,289 2,161 2,051 2,010 1,993 1,925 1,918 1,840 1,747 1,717 1,606 1,572 JobsEQ Labor Market Research 2023 SKILLS top requested hard skills of 2023 TECH SKILLS DEMAND 19 HARD SKILL TOTAL JOB ADS Need more data? Contact Emily@TechSTL.com

28. Statistics 29. UNIX 30. Salesforce 31. Marketing 32. Extract, Transform, Load (ETL) 33. Customer Relationship Management (CRM) 34. CSS 35. SAP 36. Microsoft SharePoint 37. Kubernetes 38. Extensible Markup Language (XML) 39. Microsoft Power BI 40. Personal Computers (PC) 41. Information Technology Infrastructure Library (ITIL) 42. Angular 43. Microsoft Active Directory 44. Systems Development Life Cycle (SDLC) 45. Docker 46. Application Development 47. IT Support 48. Configuration Management 49. Microsoft PowerShell 50. Pivotal Spring Boot 51. ServiceNow 52. Google 53. Machine Learning 54. Telecommunications 1,403 1,330 1,309 1,305 1,272 1,263 1,257 1,223 1,142 1,119 1,109 1,099 1,086 1,072 1,058 1,052 1,051 1,047 1,046 1,043 1,015 910 904 857 853 819 807 JobsEQ Labor Market Research 2023 SKILLS top requested hard skills of 2023 TECH SKILLS DEMAND 20 HARD SKILL TOTAL JOB ADS Need more data? Contact Emily@TechSTL.com


