Appendix ERA-co Research
Definition of Study Frame
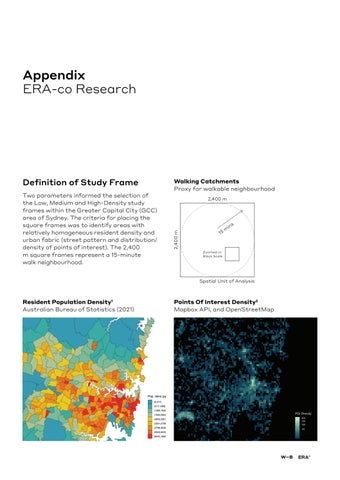
Two parameters informed the selection of the Low, Medium and High-Density study frames within the Greater Capital City (GCC) area of Sydney. The criteria for placing the square frames was to identify areas with relatively homogeneous resident density and urban fabric (street pattern and distribution/ density of points of interest). The 2,400 m square frames represent a 15-minute walk neighbourhood.
Walking Catchments
Proxy for walkable neighbourhood
m 2,400 m
Resident Population Density1
Australian Bureau of Statistics (2021)

Spatial Unit of Analysis
Points Of Interest Density2
Mapbox API, and OpenStreetMap


Zoomed-in Black Scale 15mins 2,400
Built Form Urban Configuration
& Built Up Density
The Low, Medium and High-density characterisations is a study of contrasts: from the low-density suburban forms that are typified by detached houses with spacious yards to denser environments made of mid-tohigh rise developments set within mixed-use neighbourhoods close to transport.
The spatial arrangement from the low to the high density yields a less built-up area punctuated by private open spaces to a greater built-area proportion with larger publicly open space (total street length). These contrasts create experiential environments that are very different. The daily experience of living across these densities will vary, impacting daily activities, feeling of community.
Built Mass & Height
Building heights in low and medium-density areas are comparable. However, their building footprint coverage has a considerable impact on the built-up mass, with a ratio of 8 to 13.
High and mid-rise typologies cause the large increase in the built-up intensity of the highdensity area.
0 75 100m Buildings 0 75 100m


LOW 15% 26% 29%
HIGH
MEDIUM
Site-Area Coverage 66km of streets 8m Avg. height 29m Peak height 8,000,000 m3 Built up mass 7m Avg. height 28m Peak height 13,000,000 m3 Built up mass 20m Avg. height 274m Peak height 52,000,000 m3 Built up mass 78km of streets 147km of streets
Coverage Site-Area Coverage
Zoomed-in Black Scale
Site-Area
Zoomed-in Black Scale
Zoomed-in Black Scale
Population
Densely inhabited areas typically have a smaller proportion of children and elders. Children, on the other hand, are more abundant in areas with lower population density.
POPULATION DENSITY
Population
(>65)
(<18)
Highest share of children
3,003 pp / sqkm
6,164 pp / sqkm
Smallest share of seniors & children
9,970 pp / sqkm
Total
Age
Distribution 60,000 Senior
Adult Child
40,000 20,000
Group
0
LOW MEDIUM HIGH
Household sizes and types follow a similar trend, with lone households accounting for nearly half of all households in high density areas. Family households predominate in areas with low population density.
HOUSEHOLD COMPOSITION
pp / sqkm
Highest share of familes
Most singleperson households
pp / sqkm
pp / sqkm
2.82
2.70
1.85
Total Households Household Type 30,000 Family Group Lone 20,000 0 10,000
LOW MEDIUM HIGH
Walkability & Mobility
Walkability
How alleys, roads and streets connect exerts a strong influence on how people move and experience their surroundings. Measuring their Spatial Accessibility values give us an indication of pedestrian comfort and the potential of their use for localised movement.
Walking & Cycling 5 Min Catchments
Shaped by how the movement network is connected the walking and cycling catchments represent the reachable area in a 5 minutes trip. Smaller areas show higher fragmentation or severance of the transport network.
Proximity to Transport
These are proportions of people within walking distance to high-medium frequency public transport stops/stations in 2017. Walking distance is defined as 800 metres for heavy rail, and 400 metres for all other modes.
Area reachable by transport mode Potential to attract localised pedestrian movement Points of interest High Low
0 250 500m Walking Cycling 0 250 500m


LOW 0.44 5.02 0.58 4.58 82% 96% 98% 19% 25% MEDIUM HIGH 0.31 1.92 sqkm sqkm sqkm sqkm sqkm sqkm 10% 15min walk scale Comfortably host pedestrian movement Transport Accessibility Transport Accessibility Transport Accessibility Comfortably host pedestrian movement Comfortably host pedestrian movement 15min walk scale 15min walk scale
Community Natural
Surveillance & Safety
Varying degrees of visibility, natural surveillance, activation and co-presence can collectively influence crime activity. Low accessed and spatially isolated parts of the street network (blue lines) can shape perceptions of safety.
Relationship with Neighbours
Residents in densely populated urban areas live closer to their neighbours. This statistic estimated the number of people who may cross paths during typical walking trips (based on the distance along the street network required to connect each residential building* - proxy for social contact between neighbours).
Green Space Per Capita
At lower population density there is more urbanised greenspace area per capita (15 sqm / pp). The built-form compactness of the higher density area still allows for a rate of 13 sqm of greenspace per person, typically due to large metropolitan scale parks.3
* Based on 1% of residents being on the street Urbanised green space area (human scale proportions) 1% total pop. avg. distance to N x 100m Isolated parts of the street network with low accessibility scores Points of interest Low accessible & isolated
0 250 500m
Green Space per captita


People could be met in 100m on typical walking trips
1,815m
avg. distance to all neighbours (* 2047 X 2047 connections)
People could be met in 100m on typical walking trips
1,765m
avg. distance to all neighbours (* 2047 X 2047 connections)
15 sqm/pp 7 sqm/pp
People could be met in 100m on typical walking trips
1,439m
avg. distance to all neighbours (* 2047 X 2047 connections)
13 sqm/pp
The World Health Organization recommends a minimum of 9 m2 of green space per individual with an ideal of 50 m2 per capita
10% 12 20 31 Low access
LOW MEDIUM HIGH
and isolated
6% 4% Low access and isolated Low access and isolated
Vibrancy
Density of Non-Residential Urban Functions
The abundance of street-level services and businesses (Points of Interests, POIs) represent mix of use and ground floor activation.
The proximity to a Mall and the CBD is correlated with the higher values, 74 and 467 (low and high population density) when weighted by population demand.

Proximity to Key Facilities
The average distance from all residences to key facilities is a proxy for a ’15-minutes city’.
Medical: Dentist, clinic, doctors
Education: School, kindergarten
Convenience: Food and drink stores, commercial services
Land Use Distribution
The proportion of building footprints4 area classified by land use, provides an overview of the mix and balance of uses. Multifunctional urban areas often promote diverse social interactions and liveliness.
0 250 500m Density Type of Facility Medical Mixed Use Residential Commercial Business Community Use Transport Infrastructure Recreated Open Space Industrial Utilities Other Education Convenience *10 most proximate High Low

128 POIs

185 POIs

2,682 POIs


LOW
MEDIUM HIGH Mall High Street CBD 74 POI/s 10,000 pp uses uses uses 52 POI/s 10,000 pp 467 POI/s 10,000 pp
5 6 8
Walking time in minutes at a speed of 80 m/min 2,000 Distance (m) 27 15 21 23 22 21 2 10 1,500 1,000 500 0
References
ERA-co
Census Data
1 Australian Bureau of Statistics (2021) Census (https:// www.abs.gov.au/census), accessed 12/03/2024.
Points Of Interest
2 Mapbox API, 2024
Green Assets
3 State Government of NSW and NSW Department of Planning (2016), Housing and Infrastructure (https://www. planningportal.nsw.gov.au/opendata/dataset/existinggreen-assets), accessed 12/03/2024.
Building Footprints
4 Geoscape (2018), Archival Data (https://geoscape.com. au/building-footprints/), accessed 12/03/2024.
Disclaimer
This document has been produced by Woods Bagot and ERA-co for general information purposes only. While care has been taken in preparing this document, Woods Bagot and ERA-co do not make any representations or warranties as to its accuracy or completeness and expressly excludes to the maximum extent permitted by law all those that might otherwise be implied. Woods Bagot and ERA-co accept no responsibility or liability for any loss or damage as a result of acting or refraining from acting as a result of, or in reliance on, anything contained in this document.

© 2024 Woods Bagot Pty Ltd and ERA Co Pty Ltd. All rights reserved.