Destiny
is
Density.
Renewing the Great Australian Dream.
Woods Bagot and ERA-co are leading a growing discourse in Los Angeles on “Renewing the Dream”, exploring the forces propelling the City of Angels’ shift from a car-oriented, low-rise landscape into a more diverse, dense, and complex metropolis.
Once a population that dreamed on four wheels, Angelenos are relinquishing their autotopian fantasy in favour of a more sustainable, affordable, and technologically-enabled model, renewing their dream to keep pace with the fast realities of a changing world.
Combining original research, design studies, and cultural essays, Renewing the Dream: The Mobility Revolution and the Future of Los Angeles allowed writers, urban planners, architects, and policy experts to put forward a multidisciplinary understanding of LA that considers how
Our Destiny Density?
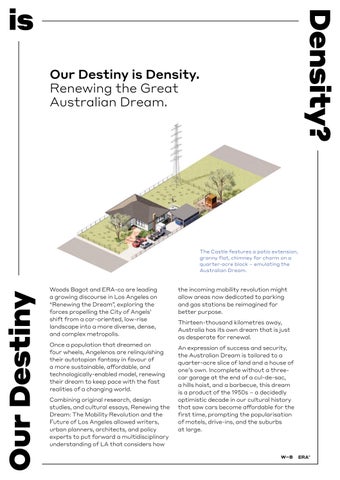
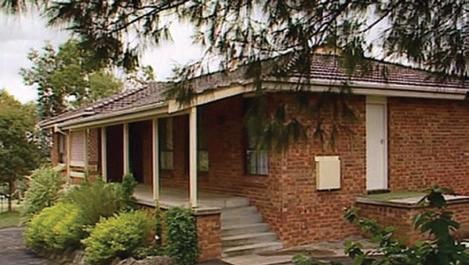
The Castle features a patio extension, granny flat, chimney for charm on a quarter-acre block – emulating the Australian Dream.
the incoming mobility revolution might allow areas now dedicated to parking and gas stations be reimagined for better purpose.
Thirteen-thousand kilometres away, Australia has its own dream that is just as desperate for renewal.
An expression of success and security, the Australian Dream is tailored to a quarter-acre slice of land and a house of one’s own. Incomplete without a threecar garage at the end of a cul-de-sac, a hills hoist, and a barbecue, this dream is a product of the 1950s – a decidedly optimistic decade in our cultural history that saw cars become affordable for the first time, prompting the popularisation of motels, drive-ins, and the suburbs at large.
is
Our Destiny
What will it take for Australians to understand the value of density?
The rise of the Australian Dream prompted a country-wide suburban sprawl that continued through the 60s and 70s and up until today, where it has become clear that – as an urban model – the dream is not sustainable.
Despite this, many Australians still view home ownership as the ultimate symbol of success. The perceived space, privacy, prestige, and freedom associated with owning a detached house with a yard big enough for kids and a dog is as compelling now as it was 80 years ago.
Profoundly ingrained in Australia’s psyche, the ongoing appeal of the Australian Dream is partly owed to a fondness nurtured by seminal Australian film and TV depictions. Running for 39 and 36 years respectively, Australian soaps Neighbours and Home and Away explore small (and big) dramas in a suburban setting, while Kath and Kim and The Castle – a 1997 film voted the best expression of Australian identity in 20101 – provide beloved-if-satirical
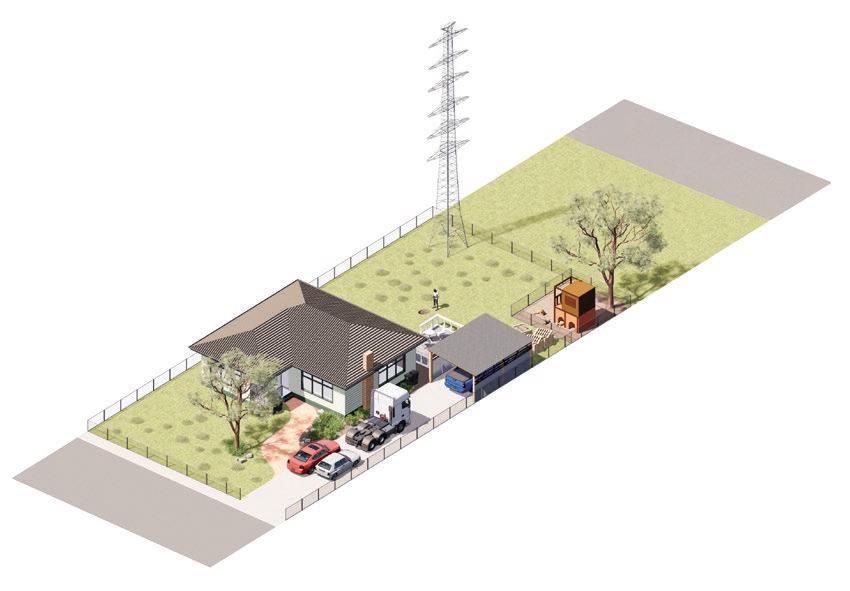
Australian stamp depicting the Chrysler Valiant R Series sedan, 1962 (Australia 1997). In it, a couple enjoy the experience of drive-in cinema, showing the perks of mobile accessibility.
takes on the habits and values of modern suburban Australians.
What will it take for Australians to understand the value of density and the energy, community and vibrancy that comes from living in a neighbourhood with amenity and concentration?
Australians needn’t search too hard for examples of the value that density can bring. New York, Vancouver, Tokyo, Hong Kong, and Seoul are all thriving examples of the incredible value of density. Highly liveable and thrumming with personality, each city allows people to live in neighbourhoods where everything is at their doorstep, where cars are for weekend excursions only and a walk to the corner store involves many ‘good mornings’ to friends and neighbours. Varied, interesting and sociable, this lifestyle could be the antidote to the loneliness epidemic afflicting more populations in contemporary society.
Short Lane, for example – a Woods Bagotdesigned apartment building in Sydney’s Surry Hills – offers an exemplar for low scale, mixed-use city living, seeking to integrate nature and community within a compact, urban context.
Knowing this, why is Australia still leading the global average in largest house size?2 The typical suburban detached dwelling necessitates car use, eliminating the incidental pedestrian interactions that enable community and connection. Add a high fence to the scenario and the Australian Dream can become a fortress of loneliness and seclusion – a weighty problem when we consider that loneliness is linked to shorter life spans, poor physical and mental health, greater psychological distress, and general dissatisfaction.3
is
The cracks in the Australian Dream don’t stop there: the pressures urban sprawl place on our cities from both an infrastructure perspective and environmental cost are astronomical. Increased urban heat, congestion, pollution and waste, as well as mounting pressure on increasingly scarce resources like water and energy, combine with detriment to our natural environment.
Inspired by our work in the US, Woods Bagot and ERA-co have undertaken a comparison of low-, middle- and high-density living – not just from an urban perspective, but at an individual level.
Mindful that people are the driving force behind successful places, our team measured the qualitative factors that
Density?
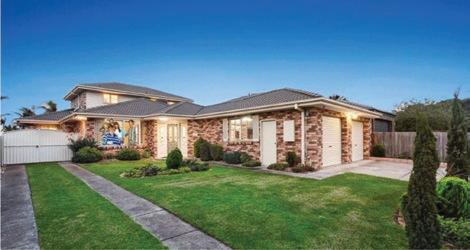
Kath and Kim’s home, located in Patterson Lakes, was bulldozed in 2022 after selling in 2016 for $1.485 million. It was replaced with a brand new two storey family home.
matter to the individual. Our research considers the new parents deciding where to raise their family; the 25-year-old choosing where they will live in a new and lonely city; and the empty-nesters looking for their place to grow old. This lens has allowed us to focus on the elements of community, mapping how density makes a difference, from access to key facilities, to our sense of belonging within a wider group (high-density can mean the difference between meeting 30 people on a typical 100-metre walking trip compared to 12 in low-density areas).
We hope that the outcomes of this study might help to shift some hearts and minds to a new Australian dream: one that prioritises sustainability, community, accessibility, and vibrancy.
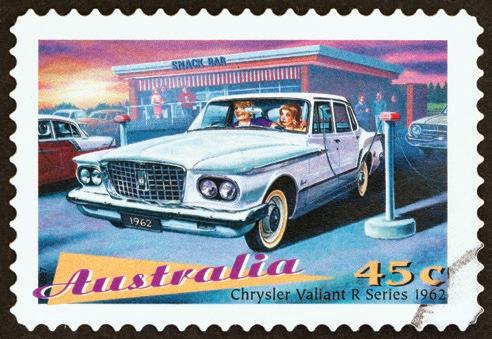
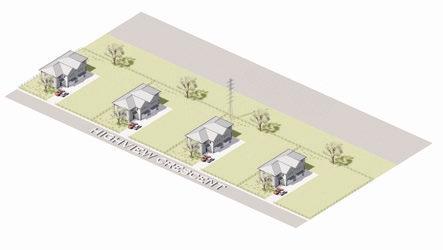
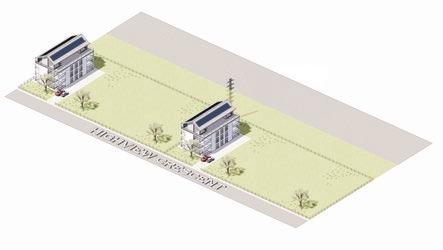
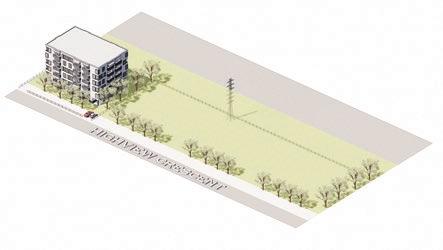
Alf Stewarts house, Home and Away, is a classic example of the type of freestanding home the Australian Dream currently aspires to. High Density: 384 People with 9072m2 open green space. Medium Density: 256 People with 3560m2 open green space. Low Density: 64 People with 5016m2 open green space.Medium - High Density Communities
Woods Bagot
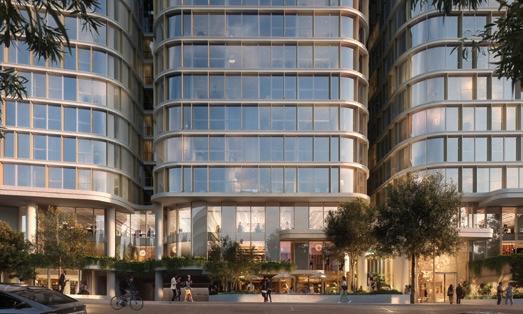
AURA by Aqualand is a 28-storey tower comprising 386 properties in North Sydney. Woods Bagot designed the tower with ample communal amenity, offering residents spaces to gather and connect.
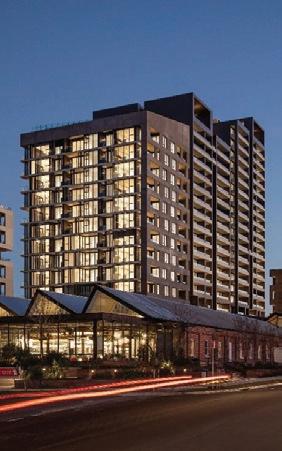
The Paper Mill, designed by Woods Bagot with Coronation Property, is 882 apartments across four residential buildings and a retail precinct in Liverpool. The site was selected for its connection to major road networks and public transport stations.
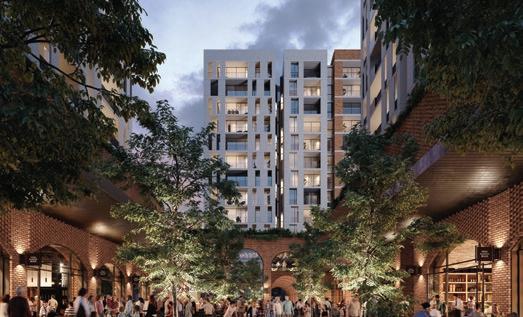
Designed by Woods Bagot, Coronation Property’s Mason & Main in Merrylands comprises five residential buildings featuring retail, commercial and childcare, as one of Sydney’s largest build-to-rent developments.
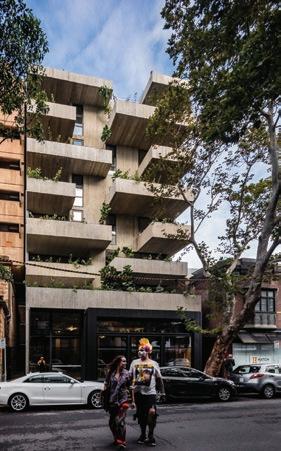
Woods Bagot designed Short Lane - a 22-apartment building in Sydney's Surry Hills - for client Komplete Construction in 2019. This mixed-use building is an exemplar for low scale, mixed-use city living, seeking to integrate nature and community within a compact, urban context.
Appendix ERA-co Research
Definition of Study Frame
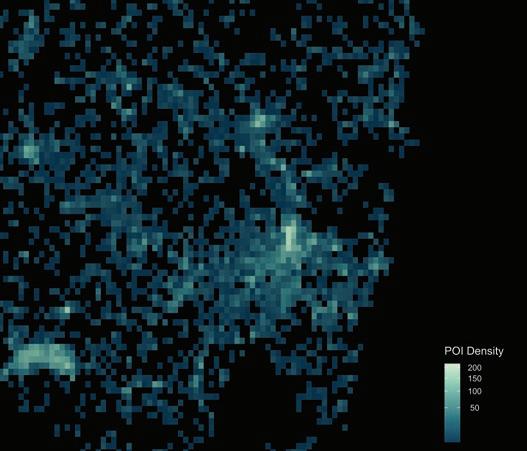
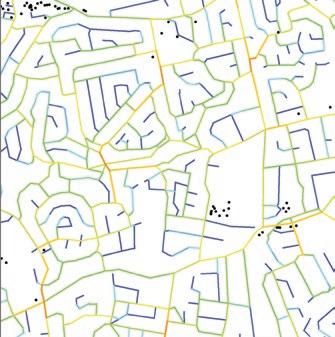
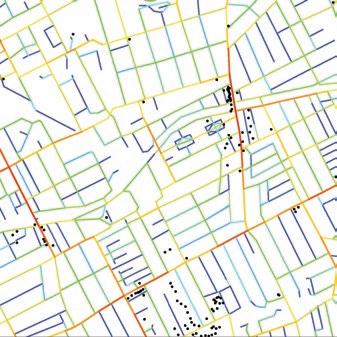
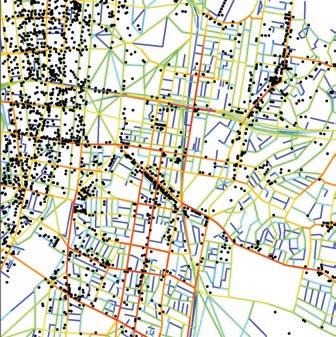
Two parameters informed the selection of the Low, Medium and High-Density study frames within the Greater Capital City (GCC) area of Sydney. The criteria for placing the square frames was to identify areas with relatively homogeneous resident density and urban fabric (street pattern and distribution/ density of points of interest). The 2,400 m square frames represent a 15-minute walk neighbourhood.
Walking Catchments
Proxy for walkable neighbourhood
m 2,400 m
Resident Population Density1
Australian Bureau of Statistics (2021)
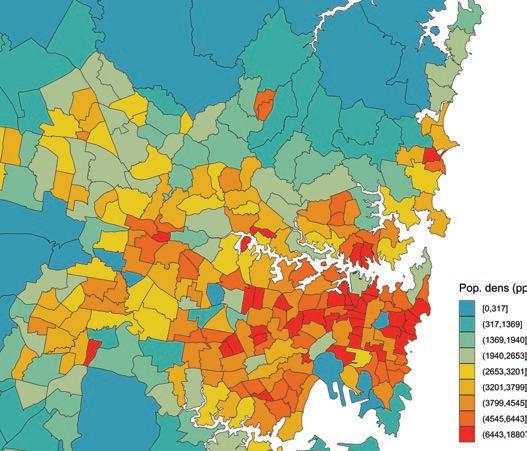
Spatial Unit of Analysis
Points Of Interest Density2
Mapbox API, and OpenStreetMap
Zoomed-in Black Scale 15mins 2,400
Built Form Urban Configuration
& Built Up Density
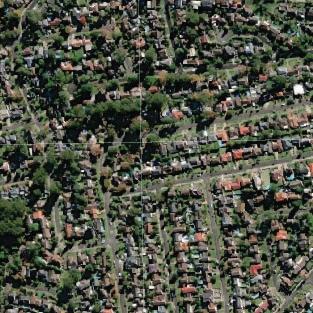
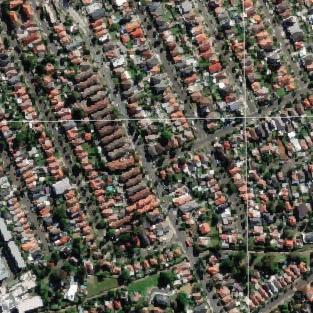
The Low, Medium and High-density characterisations is a study of contrasts: from the low-density suburban forms that are typified by detached houses with spacious yards to denser environments made of mid-tohigh rise developments set within mixed-use neighbourhoods close to transport.
The spatial arrangement from the low to the high density yields a less built-up area punctuated by private open spaces to a greater built-area proportion with larger publicly open space (total street length). These contrasts create experiential environments that are very different. The daily experience of living across these densities will vary, impacting daily activities, feeling of community.
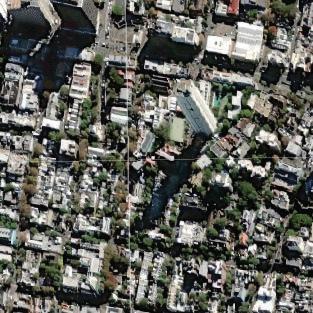
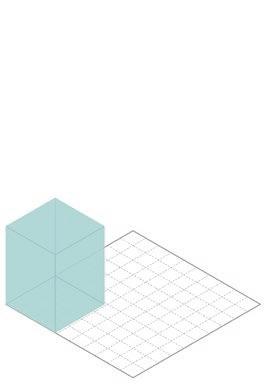
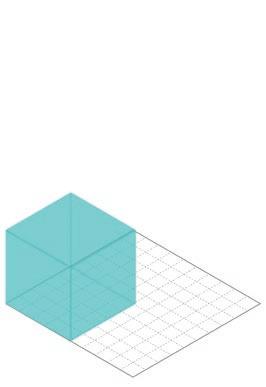
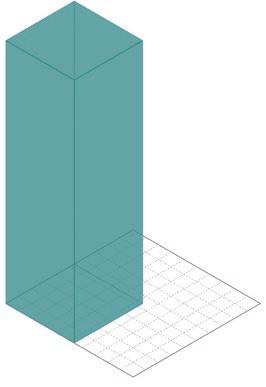
Built Mass & Height
Building heights in low and medium-density areas are comparable. However, their building footprint coverage has a considerable impact on the built-up mass, with a ratio of 8 to 13.
High and mid-rise typologies cause the large increase in the built-up intensity of the highdensity area.
0 75 100m Buildings 0 75 100m


LOW 15% 26% 29%
HIGH
MEDIUM
Site-Area Coverage 66km of streets 8m Avg. height 29m Peak height 8,000,000 m3 Built up mass 7m Avg. height 28m Peak height 13,000,000 m3 Built up mass 20m Avg. height 274m Peak height 52,000,000 m3 Built up mass 78km of streets 147km of streets
Coverage Site-Area Coverage
Zoomed-in Black Scale
Site-Area
Zoomed-in Black Scale
Zoomed-in Black Scale
Population
Densely inhabited areas typically have a smaller proportion of children and elders. Children, on the other hand, are more abundant in areas with lower population density.
POPULATION DENSITY
Population
(>65)
(<18)
Highest share of children
3,003 pp / sqkm
6,164 pp / sqkm
Smallest share of seniors & children
9,970 pp / sqkm
Total
Age
Distribution 60,000 Senior
Adult Child
40,000 20,000
Group
0
LOW MEDIUM HIGH
Household sizes and types follow a similar trend, with lone households accounting for nearly half of all households in high density areas. Family households predominate in areas with low population density.
HOUSEHOLD COMPOSITION
pp / sqkm
Highest share of familes
Most singleperson households
pp / sqkm
pp / sqkm
2.82
2.70
1.85
Total Households Household Type 30,000 Family Group Lone 20,000 0 10,000
LOW MEDIUM HIGH
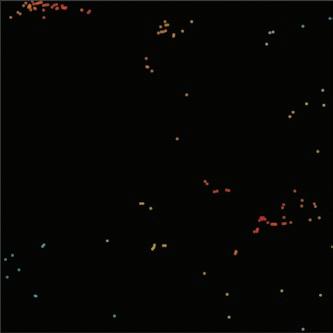
Walkability & Mobility
Walkability
How alleys, roads and streets connect exerts a strong influence on how people move and experience their surroundings. Measuring their Spatial Accessibility values give us an indication of pedestrian comfort and the potential of their use for localised movement.
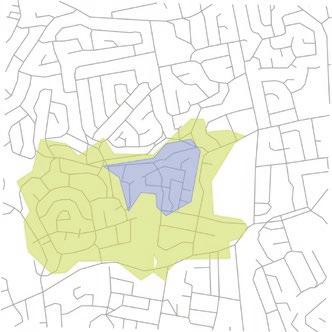
Walking & Cycling 5 Min Catchments
Shaped by how the movement network is connected the walking and cycling catchments represent the reachable area in a 5 minutes trip. Smaller areas show higher fragmentation or severance of the transport network.
Proximity to Transport
These are proportions of people within walking distance to high-medium frequency public transport stops/stations in 2017. Walking distance is defined as 800 metres for heavy rail, and 400 metres for all other modes.
Area reachable by transport mode Potential to attract localised pedestrian movement Points of interest High Low
0 250 500m Walking Cycling 0 250 500m
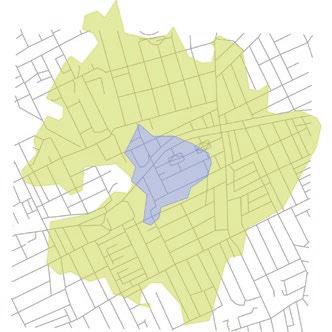
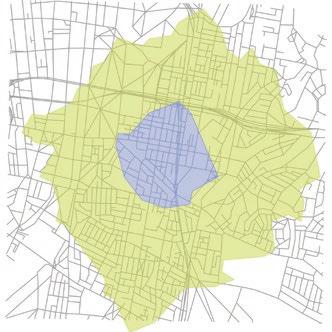
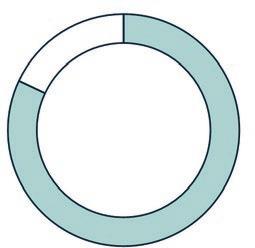
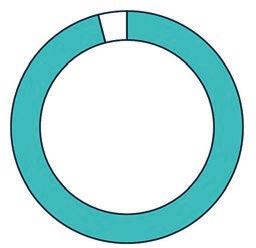
LOW 0.44 5.02 0.58 4.58 82% 96% 98% 19% 25% MEDIUM HIGH 0.31 1.92 sqkm sqkm sqkm sqkm sqkm sqkm 10% 15min walk scale Comfortably host pedestrian movement Transport Accessibility Transport Accessibility Transport Accessibility Comfortably host pedestrian movement Comfortably host pedestrian movement 15min walk scale 15min walk scale
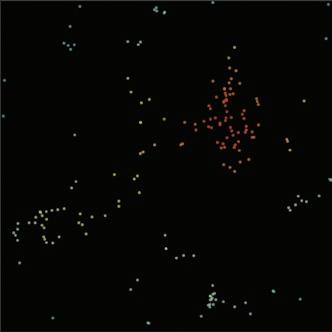
Community Natural
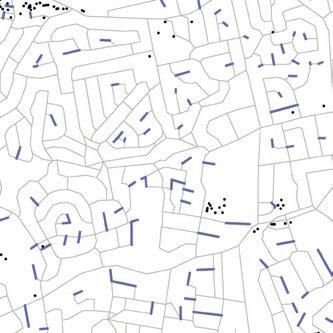
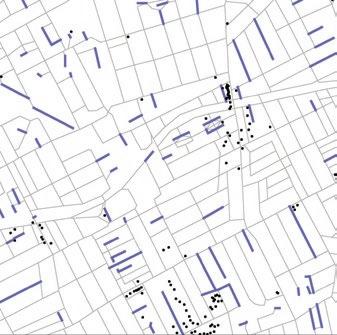
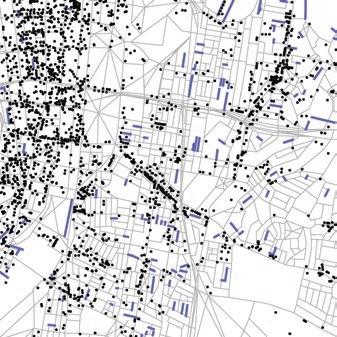
Surveillance & Safety
Varying degrees of visibility, natural surveillance, activation and co-presence can collectively influence crime activity. Low accessed and spatially isolated parts of the street network (blue lines) can shape perceptions of safety.
Relationship with Neighbours
Residents in densely populated urban areas live closer to their neighbours. This statistic estimated the number of people who may cross paths during typical walking trips (based on the distance along the street network required to connect each residential building* - proxy for social contact between neighbours).
Green Space Per Capita
At lower population density there is more urbanised greenspace area per capita (15 sqm / pp). The built-form compactness of the higher density area still allows for a rate of 13 sqm of greenspace per person, typically due to large metropolitan scale parks.3
* Based on 1% of residents being on the street Urbanised green space area (human scale proportions) 1% total pop. avg. distance to N x 100m Isolated parts of the street network with low accessibility scores Points of interest Low accessible & isolated
0 250 500m
Green Space per captita
People could be met in 100m on typical walking trips
1,815m
avg. distance to all neighbours (* 2047 X 2047 connections)
People could be met in 100m on typical walking trips
1,765m
avg. distance to all neighbours (* 2047 X 2047 connections)
15 sqm/pp 7 sqm/pp
People could be met in 100m on typical walking trips
1,439m
avg. distance to all neighbours (* 2047 X 2047 connections)
13 sqm/pp
The World Health Organization recommends a minimum of 9 m2 of green space per individual with an ideal of 50 m2 per capita
10% 12 20 31 Low access
LOW MEDIUM HIGH
and isolated
6% 4% Low access and isolated Low access and isolated
Vibrancy
Density of Non-Residential Urban Functions
The abundance of street-level services and businesses (Points of Interests, POIs) represent mix of use and ground floor activation.
The proximity to a Mall and the CBD is correlated with the higher values, 74 and 467 (low and high population density) when weighted by population demand.
Proximity to Key Facilities
The average distance from all residences to key facilities is a proxy for a ’15-minutes city’.
Medical: Dentist, clinic, doctors
Education: School, kindergarten
Convenience: Food and drink stores, commercial services
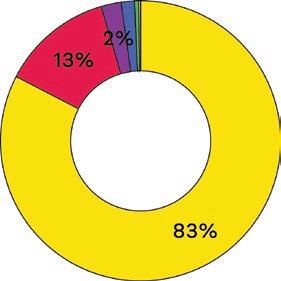
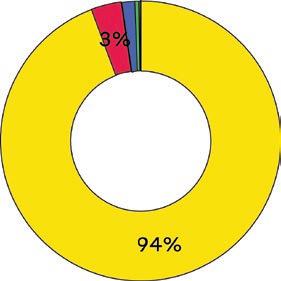
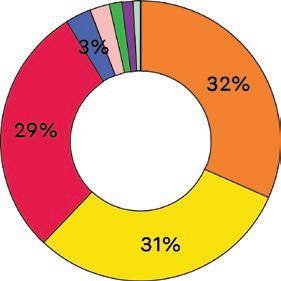
Land Use Distribution
The proportion of building footprints4 area classified by land use, provides an overview of the mix and balance of uses. Multifunctional urban areas often promote diverse social interactions and liveliness.
0 250 500m Density Type of Facility Medical Mixed Use Residential Commercial Business Community Use Transport Infrastructure Recreated Open Space Industrial Utilities Other Education Convenience *10 most proximate High Low
128 POIs
185 POIs
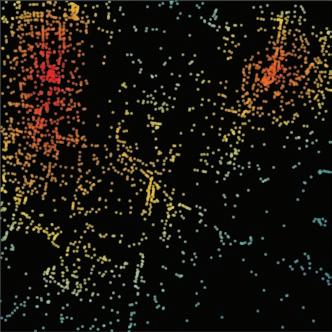
2,682 POIs
LOW
MEDIUM HIGH Mall High Street CBD 74 POI/s 10,000 pp uses uses uses 52 POI/s 10,000 pp 467 POI/s 10,000 pp
5 6 8
Walking time in minutes at a speed of 80 m/min 2,000 Distance (m) 27 15 21 23 22 21 2 10 1,500 1,000 500 0
References
ERA-co
Census Data
1 Australian Bureau of Statistics (2021) Census (https:// www.abs.gov.au/census), accessed 12/03/2024.
Points Of Interest
2 Mapbox API, 2024
Green Assets
3 State Government of NSW and NSW Department of Planning (2016), Housing and Infrastructure (https://www. planningportal.nsw.gov.au/opendata/dataset/existinggreen-assets), accessed 12/03/2024.
Building Footprints
4 Geoscape (2018), Archival Data (https://geoscape.com. au/building-footprints/), accessed 12/03/2024.
Non-Residential Urban Functions
"Restaurant", "Cafe", "Apartments", "Fast Food", "Pub", "Bar", "Residential", "Hotel", "Clothes", "Convenience", "Retail", "Park", "Memorial", "Parking", "Hairdresser", "Bank", "Pitch", "Supermarket", "Toilets", "Hostel", "Alcohol", "Pharmacy", "Swimming Pool", "Shoes", "Company", "Jewellery", "Coffee", "Place Of Worship", "Beauty", "Estate Agent", "Playground", "Fitness Centre", "Mall”, etc.
Woods Bagot
1 A nationwide survey in which over one third of people (37 percent) voted The Castle as the best representation of Australia. Australia Day Council of NSW (ADCNSW), 2010.
2 World Population Review (2024), Country Rankings, House size by country, accessed 12/03/2014, https:// worldpopulationreview.com/country-rankings/housesize- by-country.
3 In August 2022 more than one-third (36%) of Australian adults reported experiencing loneliness at least some of the time in the week before the survey (during lockdown, the percentage was 46%). Australian Institute of Health and Welfare (2023), Australia’s welfare 2023 data insights, catalogue number AUS 246, AIHW, Australian Government.
Contacts
Sarah Kay
sarah.kay@woodsbagot.com
M +61 2 9249 2547
John Prentice
john.prentice@woodsbagot.com
M +61 2 9249 2590
Amanda Stanaway
amanda.stanaway@era-co.com
M + 61 2 9249 2570
Disclaimer
Anthony Nelson
anthony.nelson@era-co.com
M +61 3 8680 6733
Atakan Guven
atakan.guven@era-co.com
M +44 20 7637 6907
© 2024 Woods Bagot Pty Ltd and ERA Co Pty Ltd. All rights reserved.
This document has been produced by Woods Bagot and ERA-co for general information purposes only. While care has been taken in preparing this document, Woods Bagot and ERA-co do not make any representations or warranties as to its accuracy or completeness and expressly excludes to the maximum extent permitted by law all those that might otherwise be implied. Woods Bagot and ERA-co accept no responsibility or liability for any loss or damage as a result of acting or refraining from acting as a result of, or in reliance on, anything contained in this document.