


Information plays a very crucial role when it comes to managing a business. In fact, a person with perfect information is always successful. Management accounting focuses on providing necessary information to management that can help them in planning, performance evaluation, control and decision-making. Management accounting is a very broad area of study and it is interesting to see how it overlaps with Financial and Cost Accounting, Operational Research, Tax Planning, etc. This book aims to introduce the world of Management Accounting to the readers.
This book is as per the latest syllabus prescribed under the National Education Policy (NEP). It is divided into seven chapters that align with the syllabus of B.Com. (Hons.) and B.Com., University of Delhi. Particularly, it covers topics such as Budgeting, Standard Costing, Variance Analysis, Absorption and Variable Costing, CVP Analysis, Decision-Making and Responsibility Accounting.
A variety of examples, illustrations, and solved problems are incorporated in an attempt to explain the concepts lucidly. The book extensively covers the examination questions for B.Com. (Hons.), B.Com., C.M.A. and C.A.
The unique feature of the book is that it has a specific focus on logically explaining the formulas used.
An ‘Appendix’ is included, wherever required, to provide more details related to some specific points/topics.
The ‘Real-Life Episode’ section is included in every chapter to provide a real-life snapshot through some cases, examples, etc.
‘Excel Applications’ are incorporated to explain some Excel features useful for management accountants.
We are pleased to present the readers with the second edition of our book ‘Management Accounting (with excel applications)’. A wholehearted attempt has been made to present the concepts in a simple manner, ensure the correctness of formulas, equations, and solutions, and add references as footnotes in the relevant places. Despite best efforts, readers might come across some inadvertent mistakes/omissions. We will be highly obliged if such errors can be brought to our notice. We look forward to suggestions for the improvement of our textbook.
Writing a textbook is quite a challenging task that cannot be accomplished without the support of others. While working on this book, we have drawn ideas from several authors who have enriched the area of ‘Management Accounting’. We are thankful to them and have tried our
best to acknowledge them in the text. Special thanks to Taxmann Publications for continuous support and speedy publication of the book.
Prof. C.P. Gupta Dr. Vidisha Garg guptacp@gmail.com
vgarg@maitreyi.du.ac.in


Data Table
Graphical Representation
Spin Button
Regression Analysis
Scenario Manager Goal Seek Solver
Excel is a versatile tool that comes in handy for basic calculations, graphical representation, studying the impact of change in variables, etc. Some Excel features that can serve as valuable tools for management accountants are discussed here.
BASIC CALCULATIONS, DATA TABLE AND GRAPHICAL REPRESENTATION
Let’s consider the data presented here:
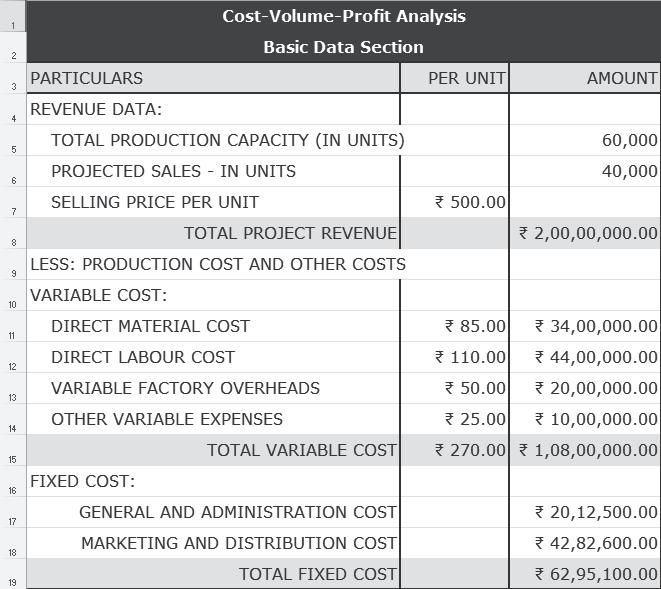
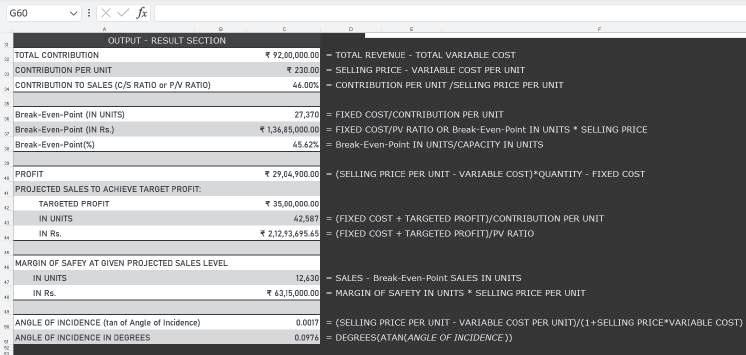
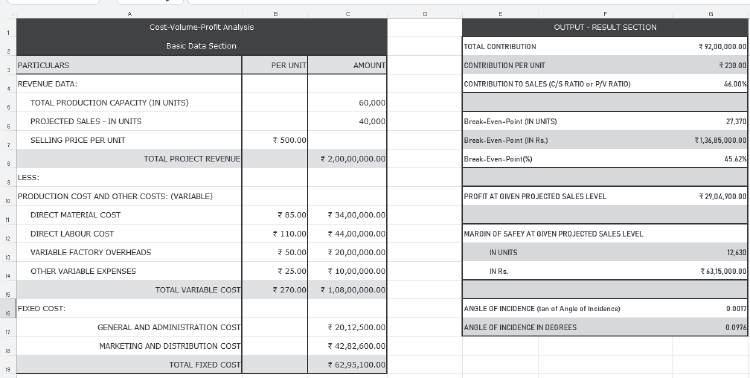
Basic Calculations: The basic data can be used for computing contribution, break-even point, profit, margin of safety, angle of incidence, etc., as shown below:
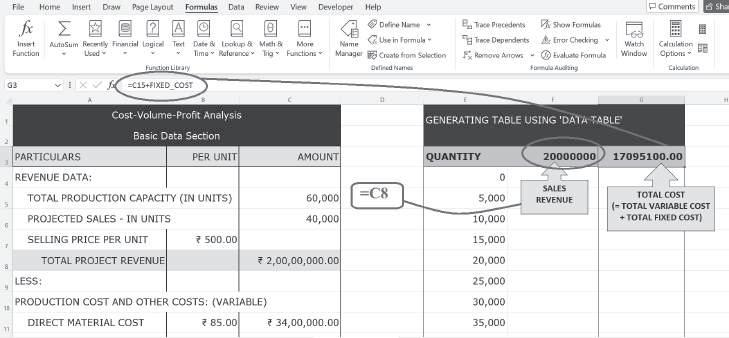
Data Table1: Using the ‘Data Table’ feature of Excel, sales revenue and total cost for the various levels of output can be presented in the form of a table. For this, a tabular format is created specifying the various levels of output (i.e. Quantity). In the adjacent columns, ‘sales revenue’ and ‘total cost’ are computed:
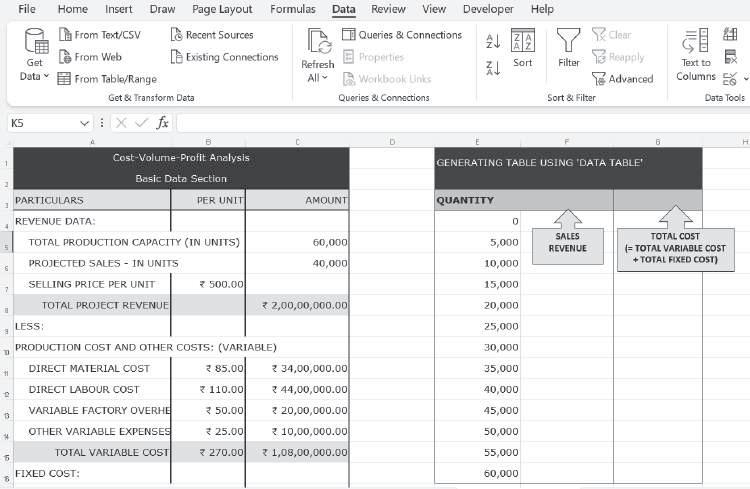
In F3, enter the reference for the cell that contains the formula for calculating ‘sales revenue’ (i.e. C8). Similarly, in G3 enter the reference for the cell where ‘total cost’ is calculated:
1 The ‘Data Table’ feature also comes in handy to study the impact of changing variables (discussed later under ‘Spin Buttons and Data Table’).
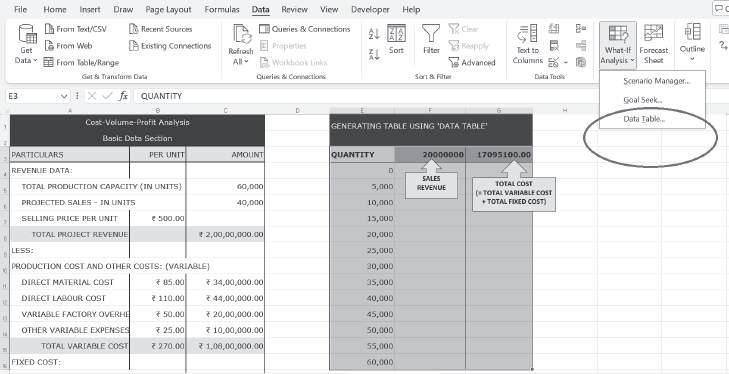
To use ‘Data Table’, select the three columns (i.e. quantity, sale revenue and total cost), then go to the Data tab, choose ‘What-If Analysis’ and click ‘Data Table’:
Next, enter the ‘Column input cell’, i.e. reference for the cell where ‘Quantity’ is mentioned in the basic data section (C6 in this case):
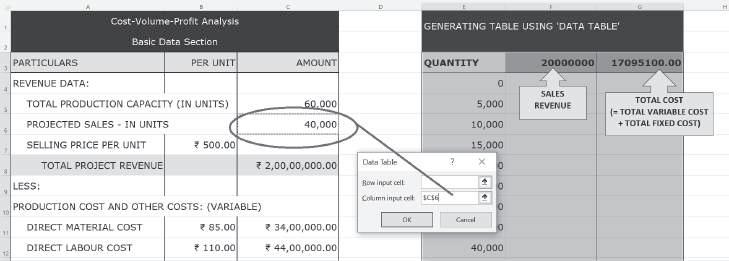
Click OK to get sales revenue and total cost for the various quantity levels:
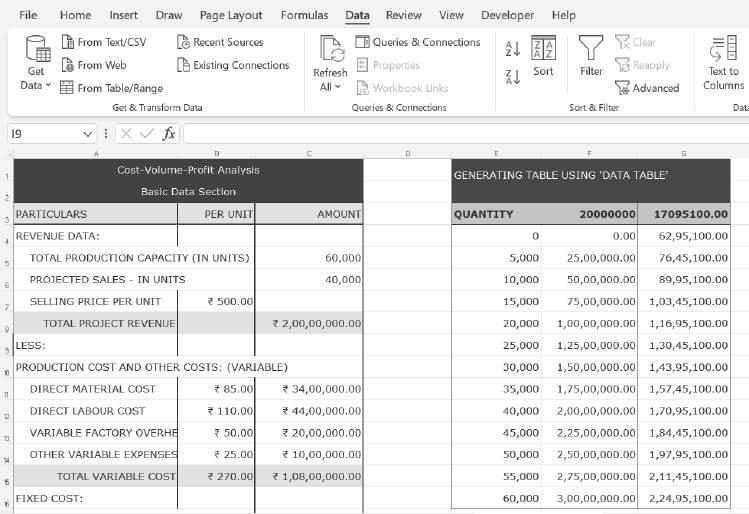
Finally, we can add a proper heading for the sales revenue column without impacting the table values. For this, the format of the cell F3 can be changed as shown below:
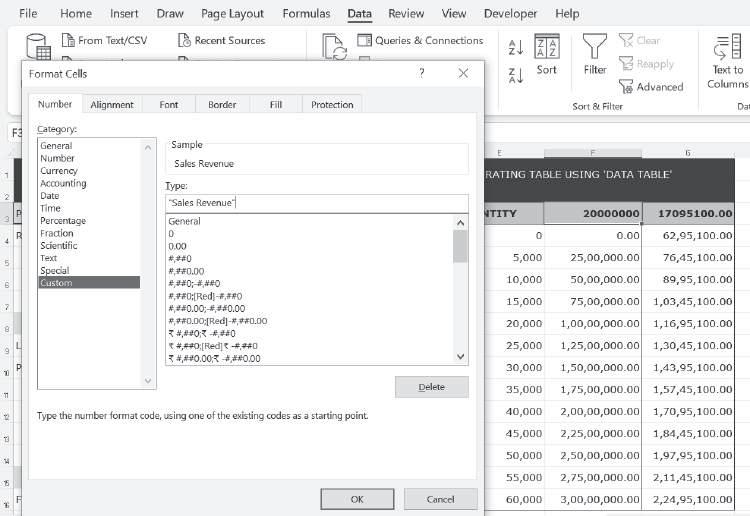
Similarly, the format of cell G3 can be changed to generate the final table with proper headings:

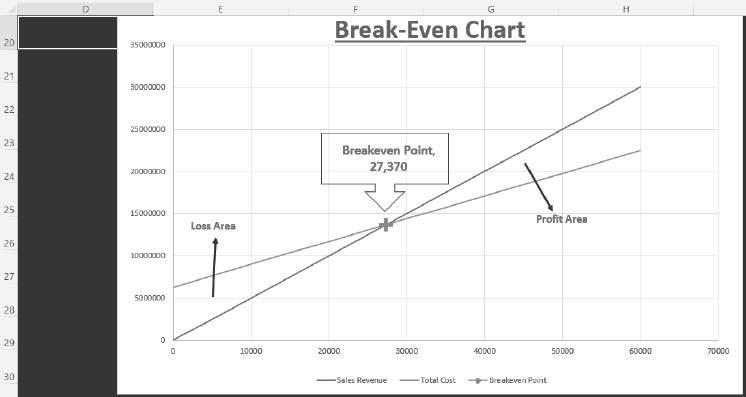
Graphical Representation: Excel is a valuable tool for graphically representing the CVP relationships:
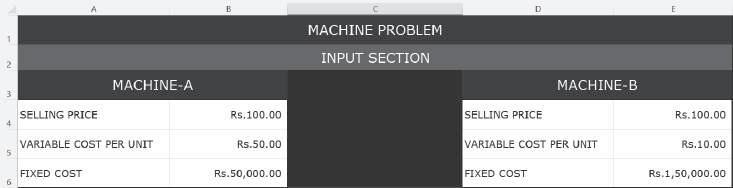
Graphical Representation of Cost Indifference Point: The graphical representation of the cost indifference point gives a clear picture of the total cost at the various output levels, which helps in deciding the alternative that should be chosen in a particular situation. Let’s consider a simple example. Suppose a firm manufacturing bags has an option to purchase either Machine A or B. The selling price and cost data are as follows:
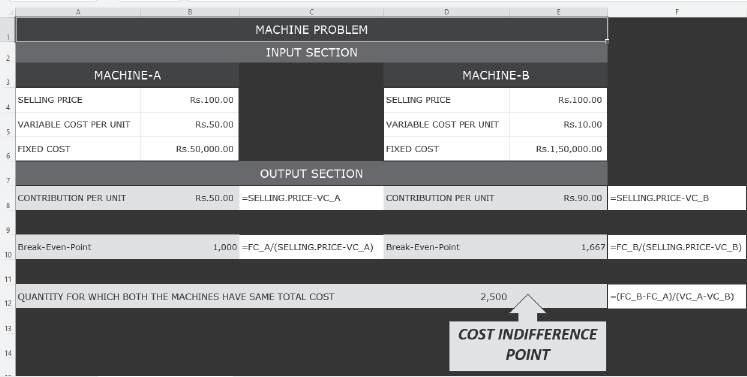
The break-even point of individual machines and cost indifference point can be computed as shown below:
Using the ‘Data Table’ feature of Excel, the total cost for various levels of output for the two machines can be represented in a tabular format:
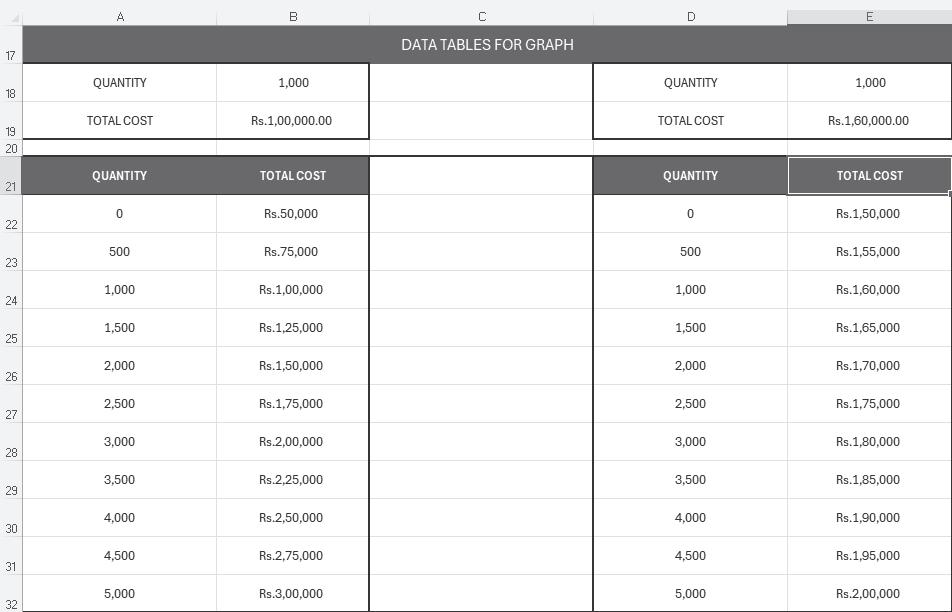
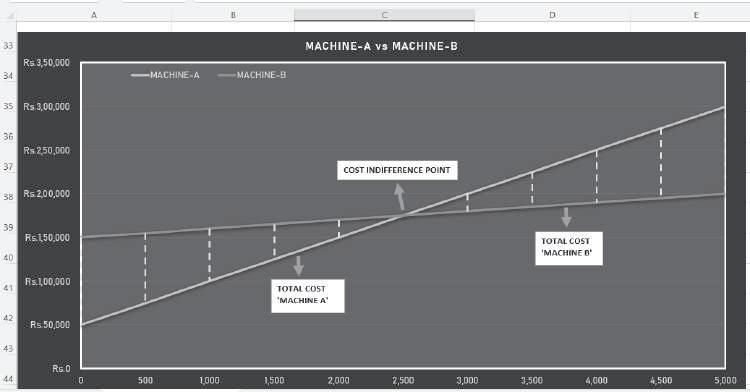
The total cost for the two machines can be graphically represented to depict the cost indifference point. The choice of machine depends on the output level, and the graphical representation gives a clear picture of the total cost at the various output levels. For output levels higher than 2,500 units,
the total cost curve of Machine B lies below the total cost curve of Machine A. Since Machine B involves lower costs, it should be selected by the company if output is expected to exceed 2,500 units. However, for output levels less than 2,500 units, Machine A should be chosen as it leads to lower costs.
Excel is an excellent tool for studying how a change in one CVP variable impacts other variables. Two useful features of Excel in this context are ‘Spin Button’ and ‘Data Table’.
Spin Button: Using Spin Buttons, one can change any CVP variable by choosing a value from the specified range, and see the impact of the change on other variables.
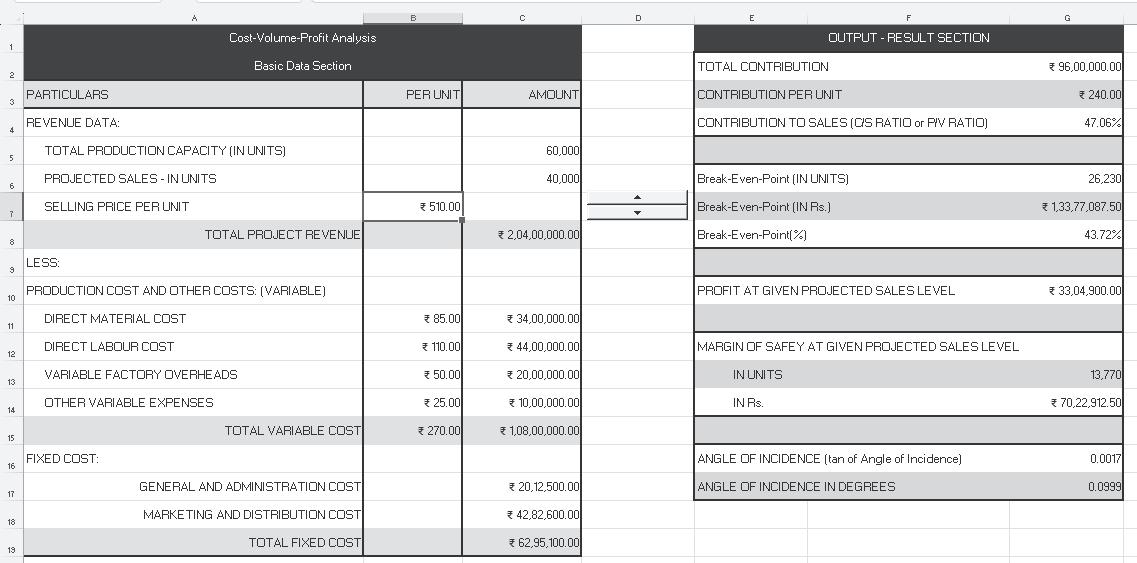
To use Spin Button, let’s consider the basic data and existing results/output:
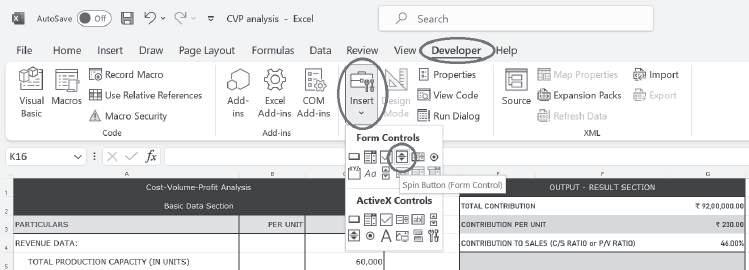
Let us study the impact of a change in selling price. A spin button can be inserted to show the changes in selling price. To insert a spin button, go to the ‘Developer’ tab, then ‘Insert’ and choose ‘Spin Button’:
Insert ‘Spin Button’ in the relevant place, right-click the spin button, and select Format Control. In ‘cell link’, enter the reference for the cell that contains ‘selling price’ and provide the relevant inputs related to changes in the selling price:
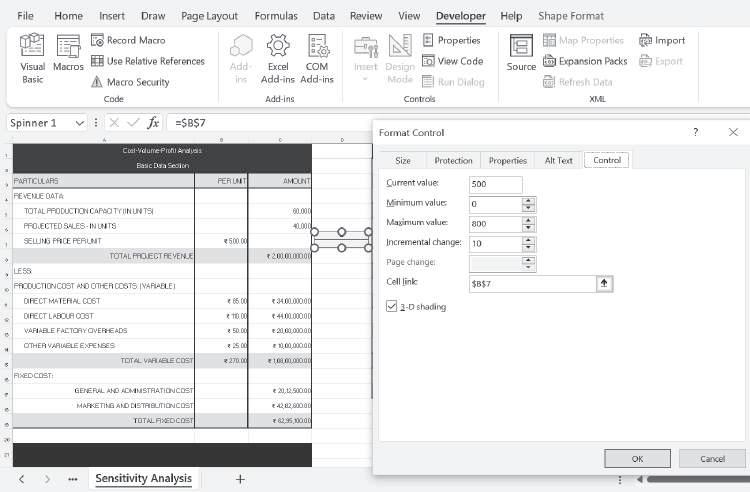
Press OK to activate the Spin Button. Up arrow (and down arrow) can be used to increase (and decrease) the selling price. When the spin button changes the selling price, all other variables linked on the ‘Output – Result Section’ is as shown below:
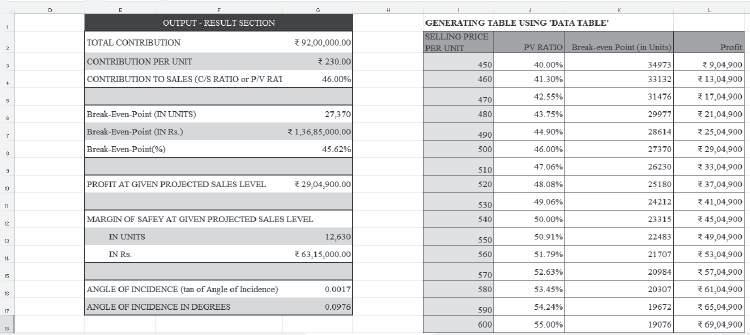
Data Table: Using the same basic data as above, suppose we want to know the values of some important CVP variables (for instance, P/V ratio, break-even point and profit) at the various possible selling prices. For this, the ‘Data Table’ feature can also be used:
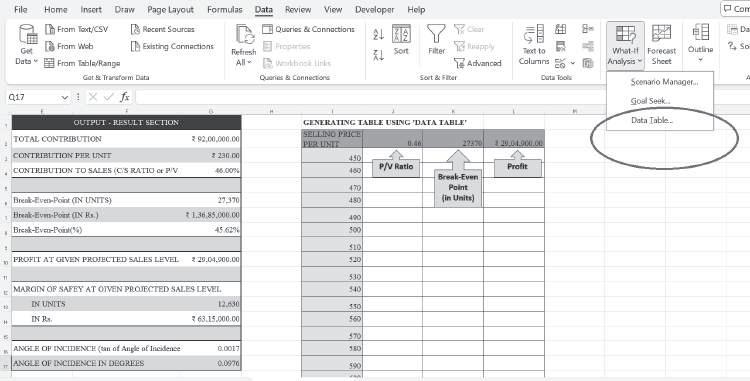
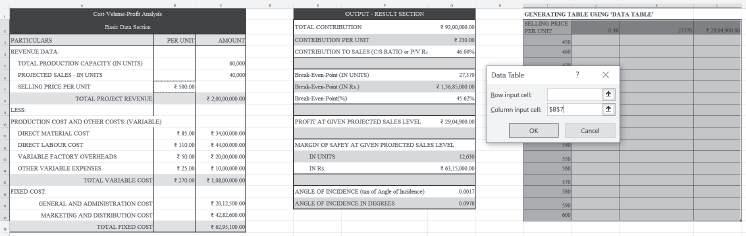
Finally, a table can be generated presenting the P/V ratio, break-even point and profit at various possible selling prices, as shown below:
A change in one variable might bring a change in several other variables. For instance, a change in cost might lead to a change in selling price as well as sales quantity. Thus, multiple variables often change simultaneously. The impact of change in multiple variables on different parameters of CVP analysis under various possible scenarios can be analysed using the ‘Scenario Manager’ tool.
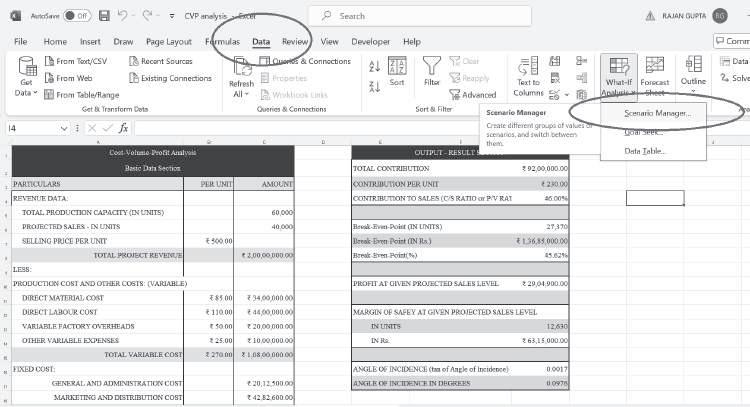
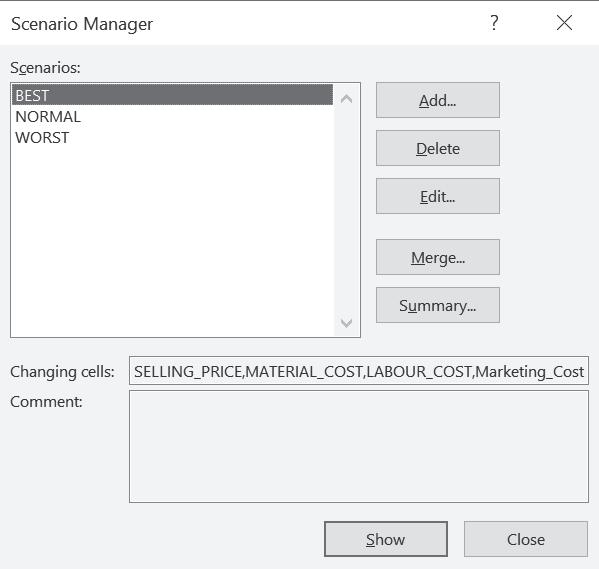
Let’s use the same basic data as above. Go to the Data tab, click What-If Analysis and choose Scenario Manager:
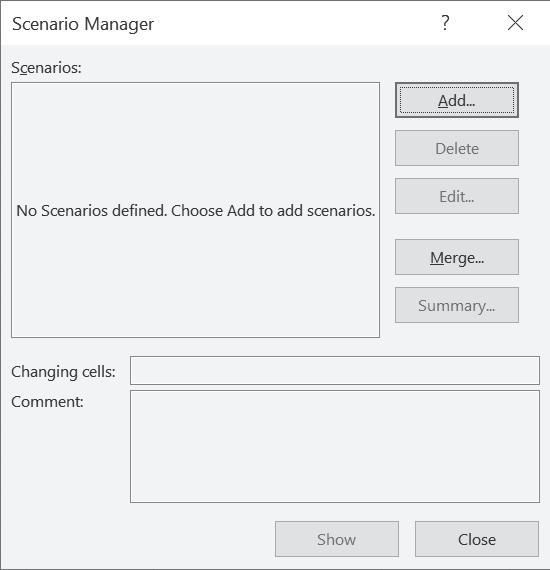
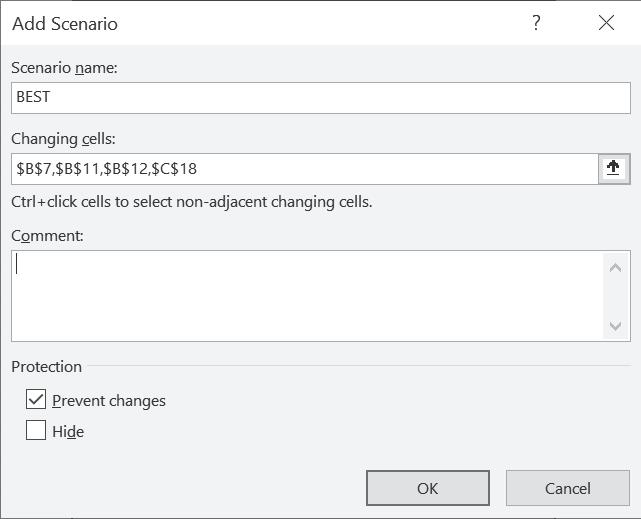
In scenario manager, the following need to be added:
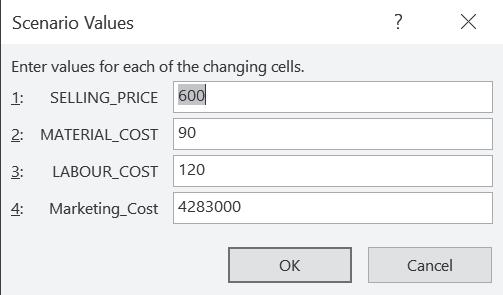
Different possible scenarios.
Changing cells, i.e., the variables that change in different scenarios Values for each of the changing cells.
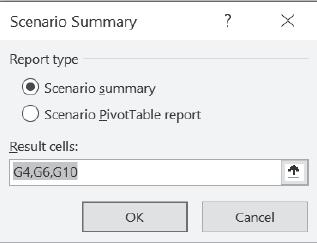
After adding the details for all the possible scenarios, click ‘Summary’. Before generating the summary, the scenario manager asks for the ‘Result Cells’, i.e., enter the reference for the cells that contain formulas for results that are based on ‘Changing cells’. Here, the ‘Results Cells’ specified are the P/V ratio (G4), break-even point (G6) and profit (G10):
The final scenario summary is generated on a separate Excel sheet:
AUTHOR : C.P. GUPTA, VIDISHA GARG
PUBLISHER : TAXMANN
DATE OF PUBLICATION : JUNE 2025
EDITION : 2ND EDITION
ISBN NO : 9789371266840
NO. OF PAGES : 472
BINDING TYPE : PAPERBACK
Management Accounting with Excel Applications Based on NEP presents a concise yet comprehensive introduction to management accounting, covering essential topics such as budgeting, standard costing, decision-making, and responsibility accounting. Throughout its chapters, it integrates Excel applications, practical examples, and illustrations to bridge theory with managerial challenges.
This book is intended for the following audience:
• Undergraduate Students (B.Com. (Hons.)/B.Com.) under the latest NEP guidelines
• Professional Course Aspirants (CMA, CA, etc.)
• Educators & Instructors seeking a structured, student-friendly textbook
• Business Professionals & Managers desiring quick reference tools for informed decisionmaking
The Present Publication is the 2nd Edition, authored by Prof. (Dr) C.P. Gupta and Dr Vidisha Garg, with the following noteworthy features:
• [Lucid Explanations & Worked Examples]
• [Logical Formula Explanations] emphasising derivation and application
• [Real-Life Episode] featuring practical caselets and scenarios
• [Excel Applications] focusing on budgeting, variance analysis, CVP analysis, and scenario planning
• [Comprehensive Exam Coverage] (B.Com. (Hons.), B.Com., CMA, CA)
• [Appendices] for advanced or supplementary topics
• [Accurate & Clear] with verified solutions, references, and footnotes