BEYOND COVID-19: THE MĀORI RECOVERY


 Prepared for Te Pūtea Whakatupu Trust
September 2020
Beyond COVID-19: the Māori Recovery Te Pūtea Whakatupu Trust


Prepared for Te Pūtea Whakatupu Trust
In nine short months, the SARS-CoV-2 novel coronavirus which emerged in the China’s Hubei province in late 2019 (COVID-19) has transformed the world. How we work, socialise, mourn and celebrate have changed and, globally at least, there is no foreseeable point at which reversion to ‘normal’ seems likely. In addition to how we behave, COVID-19 has affected how we see ourselves. For some, Aotearoa New Zealand is a team of five million who united against the common threat. For others, we have isolated ourselves from the rest of the world who are “learning to live with the virus”. For Māori, it was recognised as a threat to our whakapapa: to iwi and hapū with our kaumātua and their mātauranga at risk; to our whānau with the potential loss of parents and tamariki and iwi Māori more generally who, already suffering from health inequities, are more at risk of severe illness and long-term impacts from the virus which are, as yet, uncertain.
Whatever your perspective, this is by some margin the most significant shared challenge faced, in common, by the entire globe in at least 100 years. The last major, true pandemic, the Spanish Flu, lasted just over two years and resulted in an estimated 500m infections and 17m – 50m deaths. God-willing, the death toll from COVID-19 is unlikely to approach that number. However, it should be noted that we are a full century of communications and medical technology ahead of where we were with the Spanish Flu. One wonders what might have happened had COVID-19 hit a hundred years ago.
New Zealand is in an enviable position after having technically eliminated the virus and, until the most recent resurgence, life had resumed a level of normality unimaginable in other developed countries at this time. However, this success has come as a result of a shared sacrifice with the country committing to weeks at lockdown levels four and three. An element of the public discourse is questioning whether our elimination strategy is worth the associated economic costs and propose following less restrictive approaches implemented elsewhere.
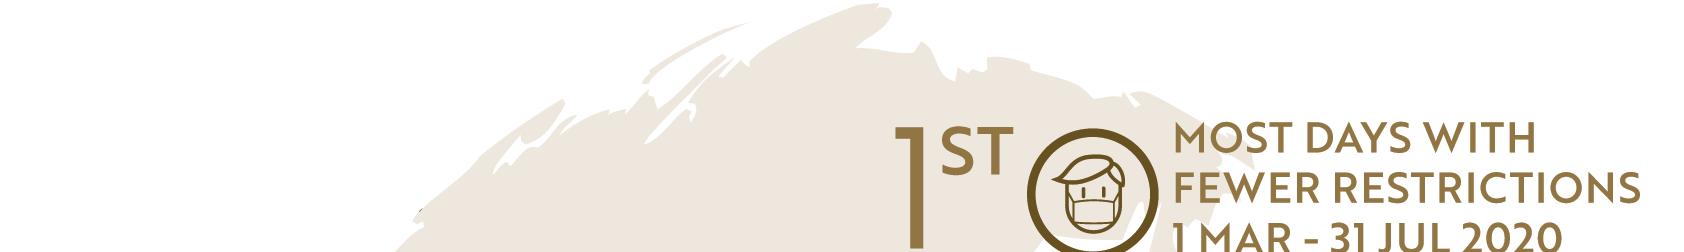
Looking around the world, governments have responded in a wide variety of ways – from very early border closures and lockdowns through to much more permissive approaches which encourage personal responsibility and eschew locking down society. Essentially, the schools of thought can be distilled down to “going hard, going early, short and sharp” as compared to “going soft, going late, long and gentle”. However, these descriptions can create the impression that the first group are very restricted and the second are wide open. The evidence shows that neither of these views is correct. Between 1 March and 31 July, New Zealand had less stringent measures in place on more days than any other country in the OECD. That includes Sweden, the poster child for a relaxed response which is now actually operating at, or just above, New Zealand’s Level 2.
Indigenous peoples have also been active in leading and coordinating responses to protect their communities. As with Māori, all of the evidence is that they are more at risk of severe illness and death from COVID-19. Native Americans have put in place checkpoints, testing and ongoing communications for residents on their reservations and off-reservation members of their tribes. Canadian First Nations are distributing food, supporting those self-isolating and returning to their ancestral lands to avoid higherdensity living in the cities. Australian Aboriginal and Torres Strait Islanders are establishing quarantine facilities for use in remote locations to avoid intrafamilial transmission and leading local lockdown efforts along with State and Federal government responses to keep their peoples safe.
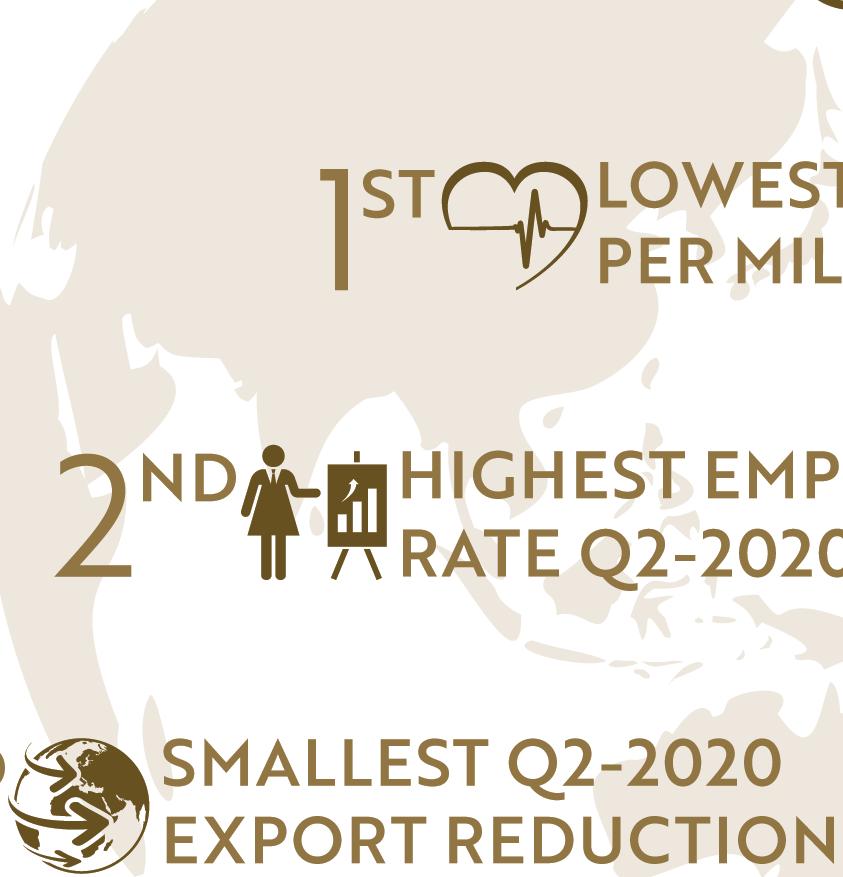
As for the economic costs of our response relative to other developed countries, it is clear that by almost every measure for which we have data, New Zealand is in a strong position. Based on what we know right now, GDP, exports and labour force indicators are all holding up very well relative to other developed countries. In fact, our employment rate is second-highest in the OECD. This can be regarded as extraordinarily successful given the structure of our economy. It is true that the Wage Subsidy and subsequent Extensions will have played a significant role in keeping people in employment (that is the
Beyond COVID-19: the Māori Recovery Te Pūtea Whakatupu Trust
policy working as intended) but all forecasts expected our unemployment figures to have risen in the second quarter to June 2020. Some estimates were that it would be over 10% by June. Instead, it dropped from 4.2% to 4%. With those unemployed and not looking for work as a result of COVID-19, it had risen to 4.6%. The variance between predictions and reality is an indication of just how unpredictable the pandemic environment is – the most recent resurgence adding yet more uncertainty. While we are doing much better than forecast, there is general agreement that things are going to get worse before they get better. The only question is, how much worse and for how long?
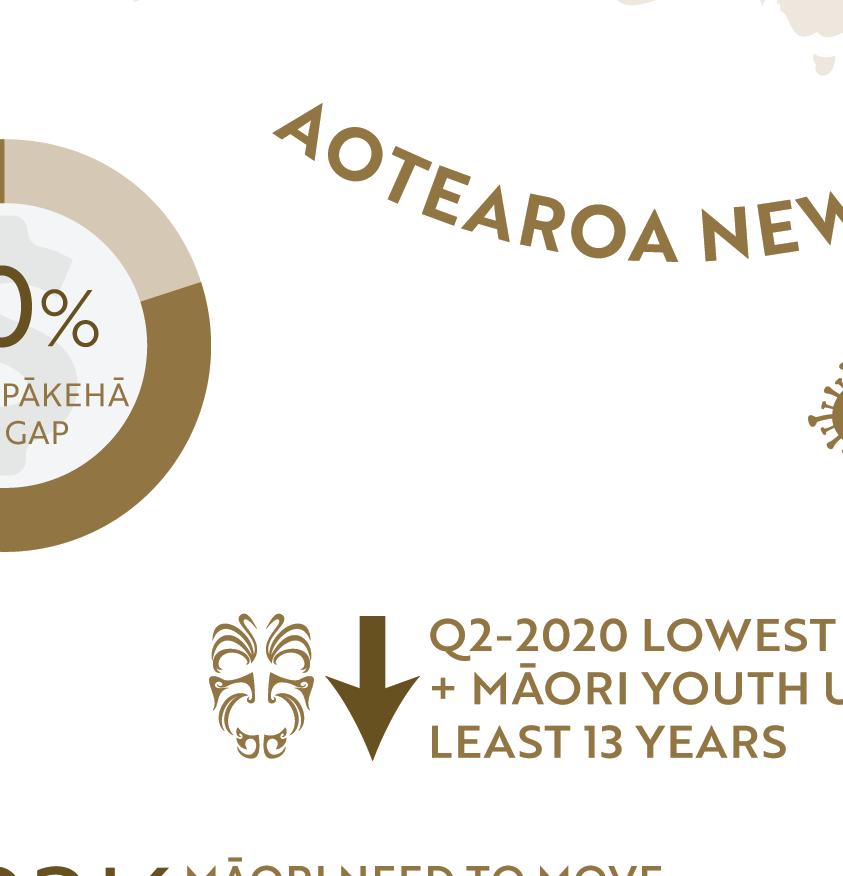
In looking to answer those questions, comparisons with other developed countries are helpful but a deeper understanding is also facilitated by looking inward at what is happening within Aotearoa and how things compare historically Taking this perspective, New Zealand is also doing really well given we are in the grip of a once-in-a-century crisis. Careful to re-emphasise the uncertainty of the environment and the view that things are likely to get worse, the June quarter Māori unemployment and Māori youth unemployment figures were the lowest they have been in at least 13 years. Even Māori underutilisation (the broadest measure of unmet employment need) is low by historical standards, with 45 of the last 50 quarters (11.25 years of 12.5 years) having a higher rate than Q2-2020. If things are to deteriorate from here, there are times in recent history which would have made for a much worse starting point for Māori.
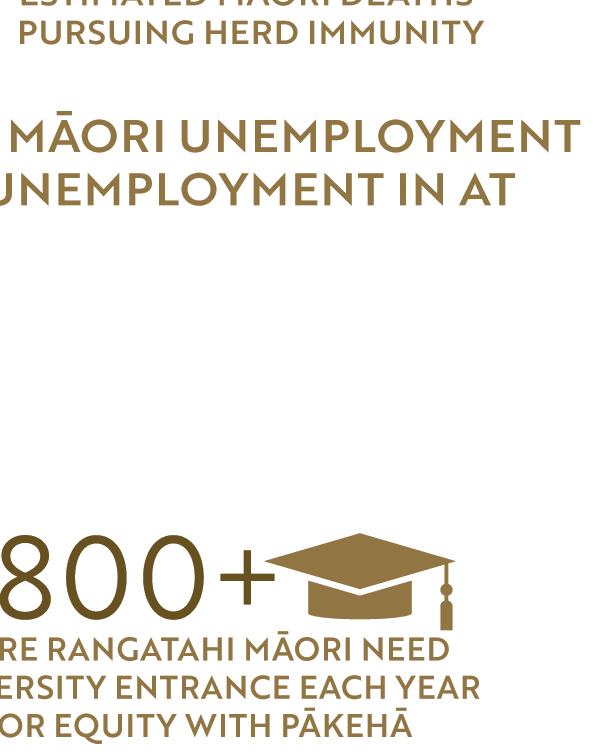
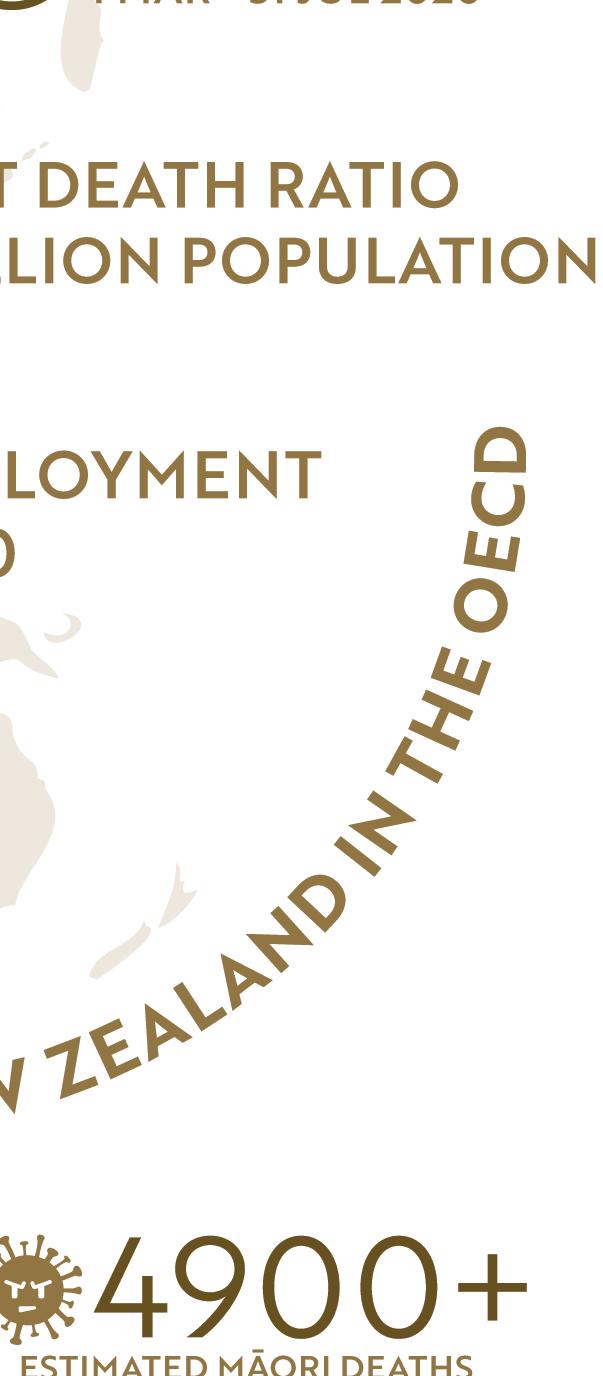
However, the focus on COVID-19, its relatively limited impacts in these early stages and the fact Māori are doing better than we have in the past (so far) does not remove or reduce the need to act to further protect our whakapapa. The international evidence and our own history is clear on what will happen if/when there is any social, health or economic reckoning with this virus – Māori will be hit hardest and take the longest to recover. This report estimates that over 4,900 Māori could die in the event New Zealand decided to pursue herd immunity through naturally acquired infection, amounting to between 24% - 31% of deaths despite Māori comprising only 16.5% of the population – a consequence of the prevalence of comorbidities known to exacerbate the impacts of the virus. Māori are also over-represented in occupations regarded as more at risk of retrenchment (e.g. low-paid, ‘low-skill’ and casual occupations) and, for those Māori who retain employment, they are more likely to be in roles which are front-line, thereby placing them, their whānau and communities (particularly combined with crowded and intergenerational housing arrangements) at elevated risk of infection.
This sounds dire – and it is – at least, potentially so. However, if it were not for the added risk dimensions of illness, long-term conditions and death, the COVID-19 pandemic is just another social and economic contagion to which our people are more vulnerable than non-Māori. One hundred years on from the Spanish Flu, we remain in the same position. The stock market crash, the Global Financial Crisis also impacted Māori more than Pākehā. Subsequent responses focused on the immediate symptoms – usually that meant finding employment and normally in occupations just as vulnerable as the ones that were lost in the aftermath of the event. As we look to the future, in addition to any short-term treatments for symptoms, there needs to be an effort to address the underlying illness: inequality.
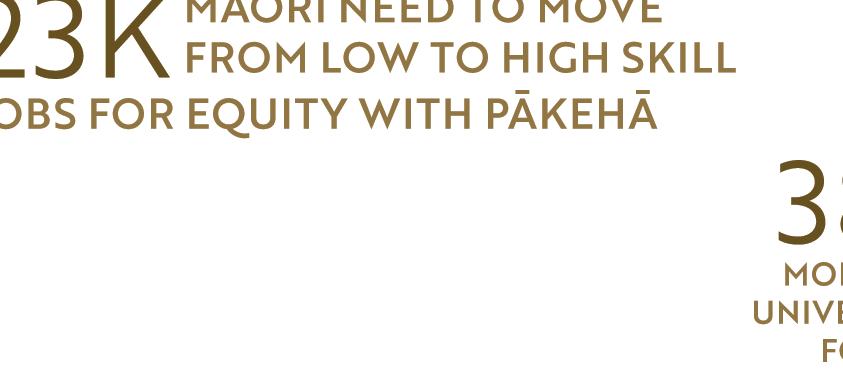
Māori earn approximately 20% less than non-Māori through their peak earning years, amounting to about $10,000 per person and $2.6 billion nationally per year. Most of the gap has been attributed to qualifications and occupations. Māori are leaving school earlier and leaving with less than Pākehā. As just one example, if the same proportion of Māori left school with University Entrance (UE) as Pākehā, that would mean another 3,800 rangatahi leaving with UE every year That is 2.3x the number of Māori who currently get UE each year. Furthermore, it is estimated that 22,500 Māori would need to move from ‘lowskill’ to high-skill employment to achieve parity with Pākehā
Improving education and employment outcomes for Māori, supported and enabled by whānau, will ensure our people are never in this position again. It is the vaccine against future threats that will both protect our whakapapa, and honour it, as we claim an equal share of our nation’s prosperity, here, on this the whenua of our ancestors.


Beyond COVID-19: the Māori Recovery Te Pūtea Whakatupu Trust
INTRODUCTION 9
Beyond COVID-19: the Māori Recovery Te Pūtea Whakatupu Trust
RĀRANGI PUKAPUKA 59
FIGURES & TABLES 69 APPENDICES 72
Beyond COVID-19: the Māori Recovery Te Pūtea Whakatupu Trust
This report will analyse the global impacts of COVID-19 and review forecast implications for the world generally and Indigenous peoples more particularly. The intention is to identify any issues or responses which may apply to Aotearoa New Zealand and iwi Māori. The COVID-19 pandemic is a fast-moving health and economic contagion and so it is important that this report is set in the context of what is happening now, at the time of writing.
Taking a global view, Aotearoa is in an enviable position. Following seven weeks of one of the world’s most stringent lockdowns, widespread cooperation with the restrictions and implementation of quarantine and managed isolation measures at the border, the country achieved its goal of eliminating COVID-19 before its re-emergence in the second week of August. There are 116 active cases, with the majority in the community (77) and the remainder with people who have recently returned from overseas (39)1 (Ministry of Health, 2020)
For a couple of months, for the most part, life returned to normal. People were able to congregate with no limitation on numbers, bars and restaurants were open for business (New Zealand Government, 2020) and most dispensed with wearing masks and other precautions which were commonplace between March and June The latest resurgence is a setback and it remains to be seen what its social and economic impacts may be. However, relative to most other countries around the world, New Zealand remains in a strong position.
Meanwhile, the COVID-19 pandemic continues to rage and gather strength around the world. The global case count exceeds 27,000,000 and over 884,000 have died. Over half the deaths come from just four countries: the United States, Brazil, India and Mexico (Worldometer, 2020a) Many states in the USA opened up only to reintroduce restrictions in response to a surge in case numbers (e.g. Abbott, 2020). The death toll in Sweden, which decided not to impose many restrictions early on, now exceeds 5,800 from a population of only 10m people (Worldometer, 2020a) Prior to its own resurgence in the State of Victoria, Australia had a very similar outcome to New Zealand’s but conditions have since deteriorated. Most State borders remain closed in Australia
While many of the countries Aotearoa would typically reference in times like these continue to struggle with COVID-19, there are examples of extraordinary success as well. The Pacific Islands have either kept the virus out entirely or managed those cases which have arisen very effectively. These include the Realm countries (Niue, Cook Islands and Tokelau) and others with a close relationship with New Zealand such as Samoa, Fiji and Tonga. Further afield, Vietnam, Hong Kong, Taiwan and Thailand have also had extremely successful responses(Worldometer, 2020a)
It is said that COVID-19 has a ‘long tail’ – the time lag between interventions and when the benefits start to show up in case, hospitalisation and mortality can be lengthy. While there is much uncertainty about what the future holds, the tail is likely to be even longer in relation to the economic and social impacts of the virus.
New Zealand’s overall unemployment rate rose from an 11-year low of 4% at the end of 2019 to 4.2% for the March 2020 quarter before returning to 4% in the June quarter (Statistics New Zealand, 2020l) It is important to note, though, that Government initiatives such as the Wage Subsidy and subsequent Extensions will have kept people connected to employment. The policy appears to have worked as intended. However, there are those who have received it who may not have a job in the weeks and
1
As at Sunday, 6 September 2020.
Beyond COVID-19: the Māori Recovery Te Pūtea Whakatupu Trust
months to come. There is general agreement that, economically at least, the worst is yet to come (Olsen, 2020; The Treasury, 2020)
We are in a once-in-a-century event and so much is uncertain. How long will the pandemic last? How many loved ones might be lost? What will happen to the global economy and how will that impact our lives? We do not have a crystal ball but we can look at how we are tracking and make the best judgements we can about steps we might take to look after ourselves and one another.
The emergence of the novel coronavirus SARS-CoV-2 in China’s Hubei Province in late 2019 (COVID-19) was the beginning of a chain of transmission and a chain reaction which has led to widespread health, economic and social devastation across the globe. New Zealand is among a small group of countries which achieved the epidemiological definition of ‘eliminating’ the virus It then re-emerged in August and, with only days in the community, it has spread to over 159 cases Despite suffering a further two deaths in the last couple of days, at this stage, our health outcomes are very good However, this outbreak is a reminder that elimination is not a point in time and will be an ongoing enterprise. Likewise, the economic recovery is going to be an endeavour with a duration measured in years.
While the work to recover and rebuild our economy will be a national effort, the negative impacts of economic shocks are not evenly distributed. Māori own fewer assets and are disproportionately employed in low-income, low-skilled occupations in industries which are more exposed in disruptive times (Shulze & Green, 2017). The average peak income for Māori is 20% lower than non-Māori between the ages of 35 and 49 years old (Reid, Schulze, Green, Groom, & Dixon, 2020) This means that Māori came into the COVID-19 pandemic more vulnerable to begin with and historical patterns suggest Māori will be hit hardest in terms of unemployment impacts and among the last to recover.
The purpose of this compendium of papers is to explore statistics, trends and literature in order to better understand the COVID-19 recovery landscape for Māori. The intention is that this both informs the response to the current crisis and provokes thinking around longer-term strategies for building Māori immunity to future economic shocks. Whether it be a financial crisis, stock market crash, global military conflict or another pandemic, as a people, it is important that actions are taken today to ensure that longstanding social disparities do not leave Māori disproportionately disadvantaged once more.
We begin by examining what is transpiring around the world. This is important for a number of reasons. Firstly, it properly positions the COVID-19 pandemic as a global challenge – no matter how perfect our response is, or for how long we are able to prevent community transmission, as long as the virus continues to spread across the globe the impacts will continue to be felt here in Aotearoa. Further to this, as conditions worsen, societies and their leaders are having to re-think everything from ways of working to how social services and indeed entire economies are organised. Fundamental, long-held beliefs are being challenged and the shortcomings of cultural mores are writ large from Sweden to the United States. There is much we can learn from others and, in our effort to do so, we take a particular interest in the impacts of and responses to COVID-19 which relate to Indigenous peoples and ethnic minorities in other parts of the world.
From there, in Part II, we take a closer look at what is happening at home here in Aotearoa. In general, the COVID-19 discourse is held at the national level. While all of the national indicators are important, we set out to drill down on factors which illustrate the current reality and future implications for Māori. This is intended to inform the definition and prioritisation of challenges for the Māori response to the fallout from the virus.
Part III of this report looks to the future. Building on Parts I and II, this section makes recommendations for how to improve short-term recovery outcomes for Māori along with ideas for how the longer-term issues of Māori economic vulnerability might be addressed.
We are still in the very early days of this pandemic and we still have much to learn – about the virus, its impacts and our response. However, it is important that we continue to adopt an approach of continuous enquiry and as we all work to recover and rebuild. This report is a contribution to that effort.


Beyond COVID-19: the Māori Recovery Te Pūtea Whakatupu Trust
The novel coronavirus SARS-CoV-2 (COVID-19) is the first truly global pandemic to emerge in over a century. As Aotearoa begins its journey towards recovery, it is timely that we consider how the impacts of the virus have affected the rest of the world and how different countries are responding.
In many ways, rather than being a catalyst for change, the virus has behaved as more of an accelerant for phenomena which were observable before it arrived: racial inequality, gender bias and labour force disparities. In healthcare parlance, it has exacerbated pre-existing conditions more than it has introduced a new one. Certainly, the relationship between health and economic outcomes has become very clear; each impacting the other.
This section explores the current state and forecast implications of the pandemic in countries around the world, examining statistics, trends and literature to help understand the global situation and how Indigenous peoples and minority ethnicities are faring.
To a great extent, it is a predictable story of how disadvantage begets disadvantage. While an analysis of poverty correlates is beyond the scope of this paper, it is important to point out that poverty is closely linked with poor education outcomes, poor employment outcomes and poor health outcomes. Historical racist practices (including asset confiscation and discrimination) are perpetuated through racist institutions today, creating conditions which disproportionately ensure Indigenous and minority ethnicities find themselves disadvantaged, unemployed, employed in low-paid, vulnerable and insecure occupations
In order to properly contextualise much of what follows, it is important to note that the government responses to the pandemic have varied widely across the globe. There have been a variety of theories as to the wisdom of “locking down” or “opening up”, the degree and timing of those two actions and the associated social, economic and health impacts. It has been a time in which the values of countries have come to the fore as they have formulated their strategies for suppressing or eliminating the virus.
US President Donald Trump said “We cannot let the cure be worse than the problem itself” (NPR, 2020) while in New Zealand, Prime Minister Jacinda Ardern has been guided by a philosophy or belief that “the best economic response is a strong health response” (RNZ, 2020) For all the talk of how hard we have been as compared to how open other countries have been, it is useful to look more closely at the evidence. Has our response really been that hard overall?
New Zealand imposed a five-week Level 4 lockdown in which all non-essential businesses were ordered to close before gradually easing restrictions over the course of another month or so (Jamieson, 2020). To date, it has been the most stringent response to the pandemic in the OECD (Blavatnik School of Government, 2020). During this period, the Government took steps to keep employees connected with their employers through the Wage Subsidy and its subsequent Extension. Covering a total of 20 weeks, the scheme has provided $585.50 per week to full-time employees and $350 to part-time employees (including the self-employed) (Ministry of Social Development, 2020) and low-interest loans offered to small businesses (Inland Revenue Department, 2020)
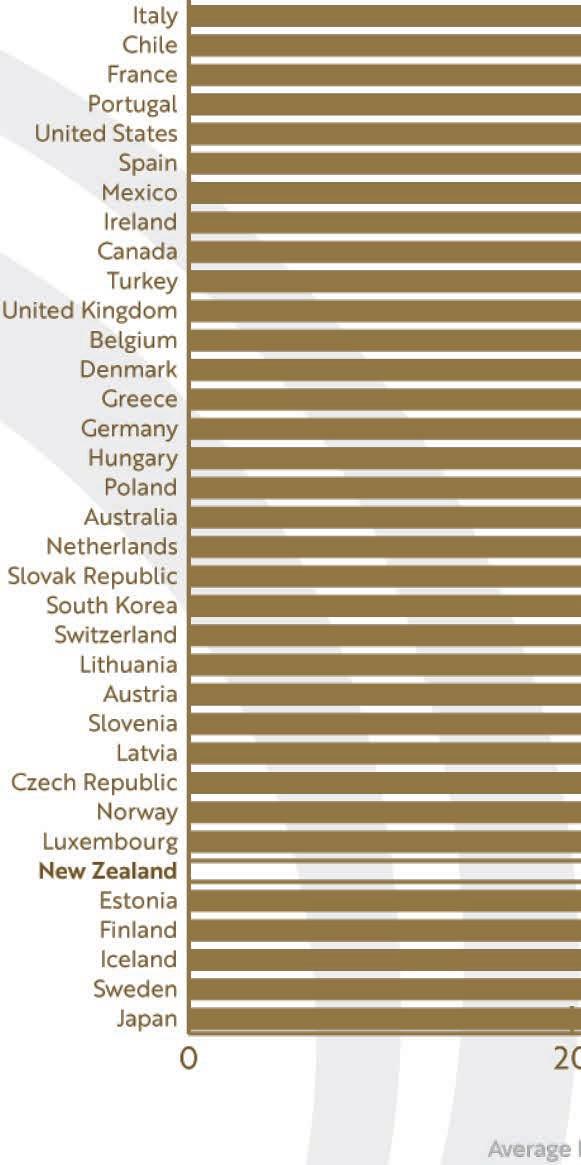
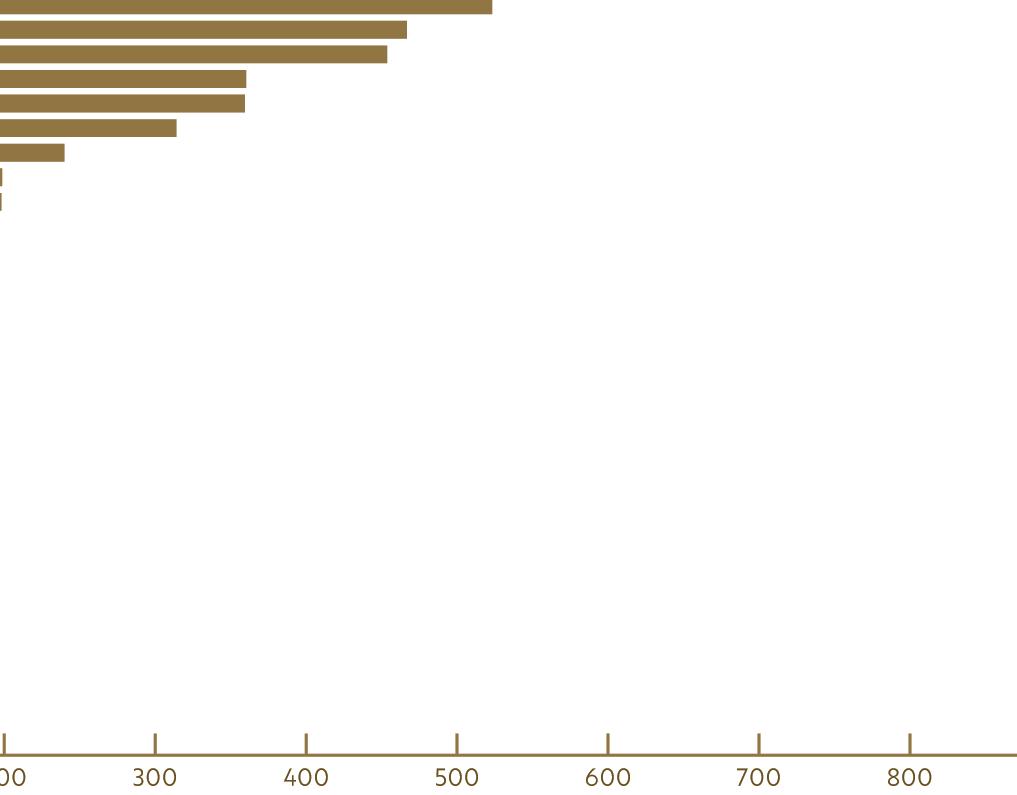
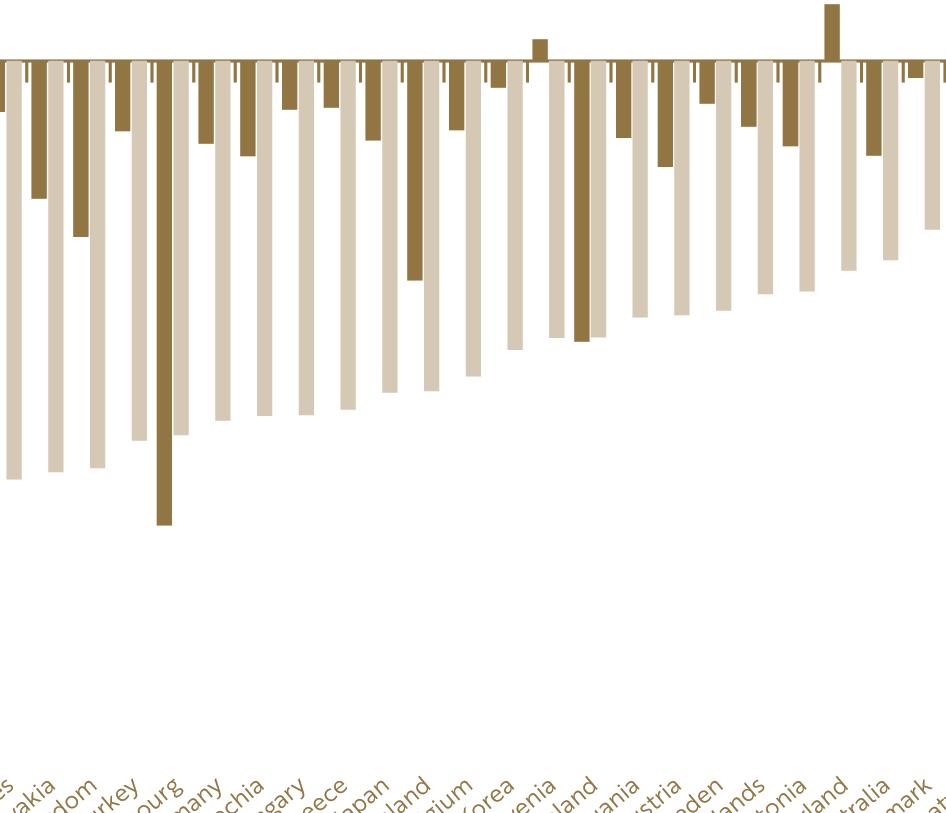
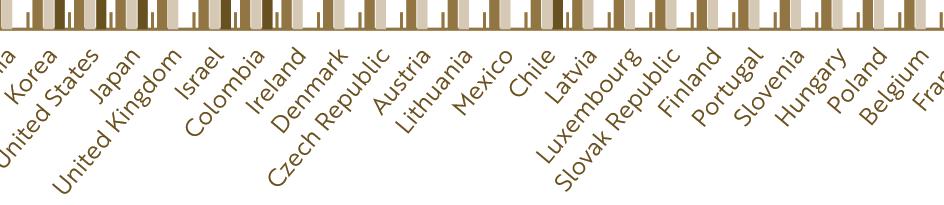
Adopting a high level of restrictions with a stated goal of elimination earned New Zealand a reputation for its hard-line approach. This is not without justification. The Blavatnik School of Government (2020) has been monitoring the stringency of government responses across the globe. The figure below shows the maximum stringency level for countries in the OECD, along with the number of days they spent at that level.
Beyond COVID-19: the Māori Recovery Te Pūtea Whakatupu Trust

Figure 1: Maximum government stringency by days at maximum, OECD countries, 1 March – 31 July 2020 Source: Blavatnik School of Government, Oxford University (2020)
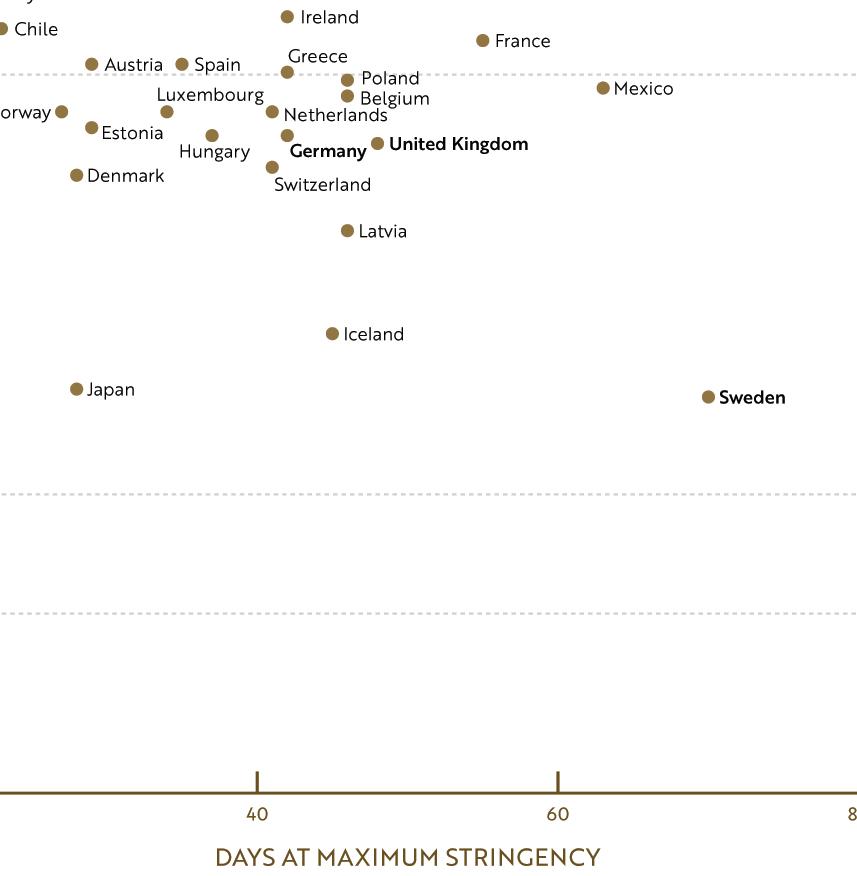
In the level 4 lockdown, New Zealand was the most locked-down country of any in the OECD. From 25 March, we were at that level for 33 days before easing restrictions over the following few weeks2 .
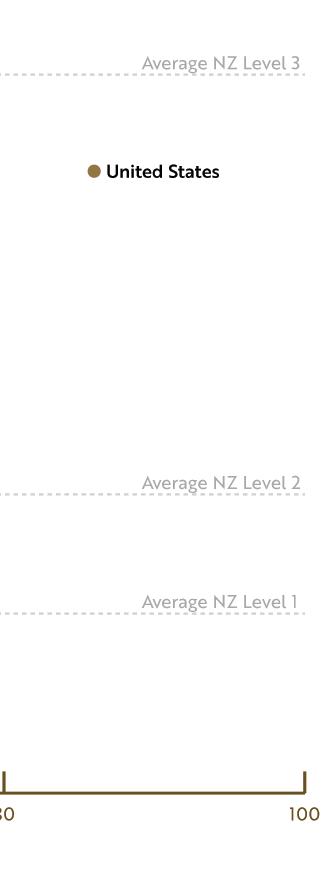
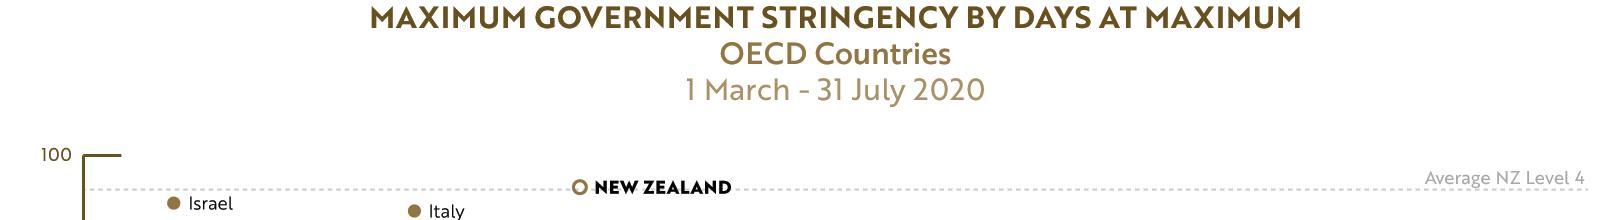
What Figure 1 also shows, however, is that while we went “hard and early” on our elimination strategy, we were at that level for a relatively short period of time. For example, France had a peak stringency level of 88 (compared to ours of 96) but they were at that level for more than three weeks longer. 2
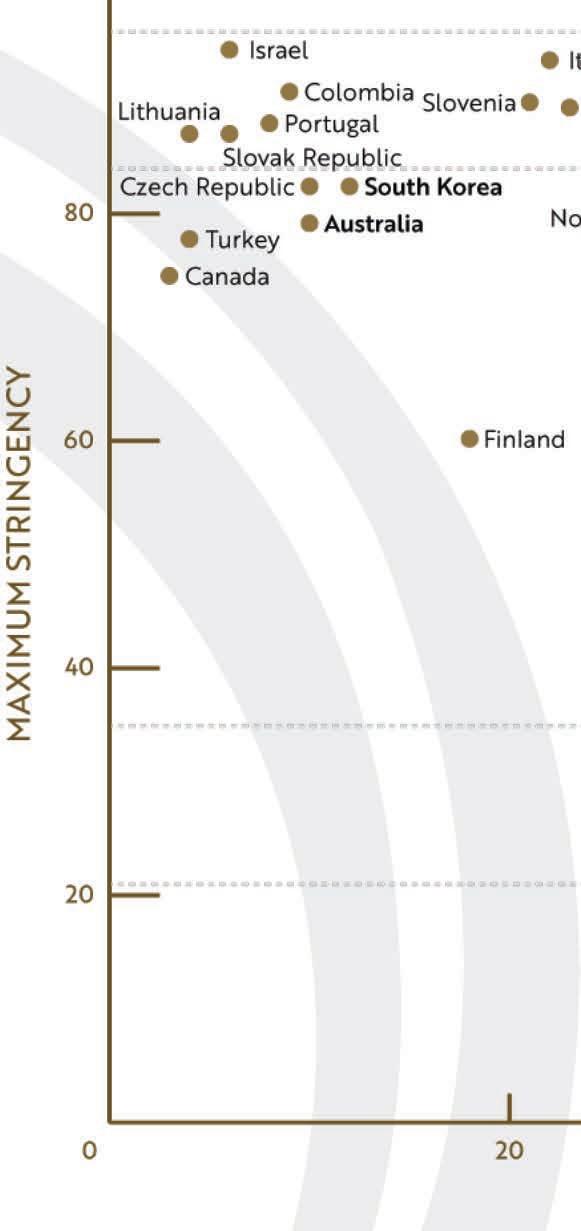
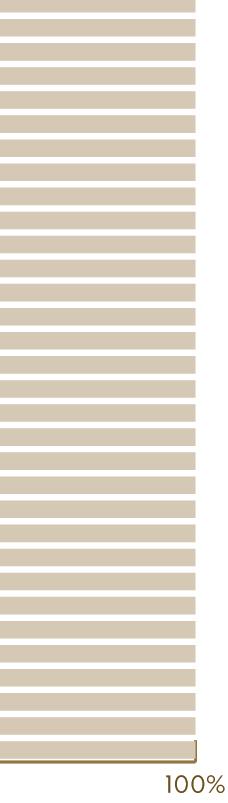

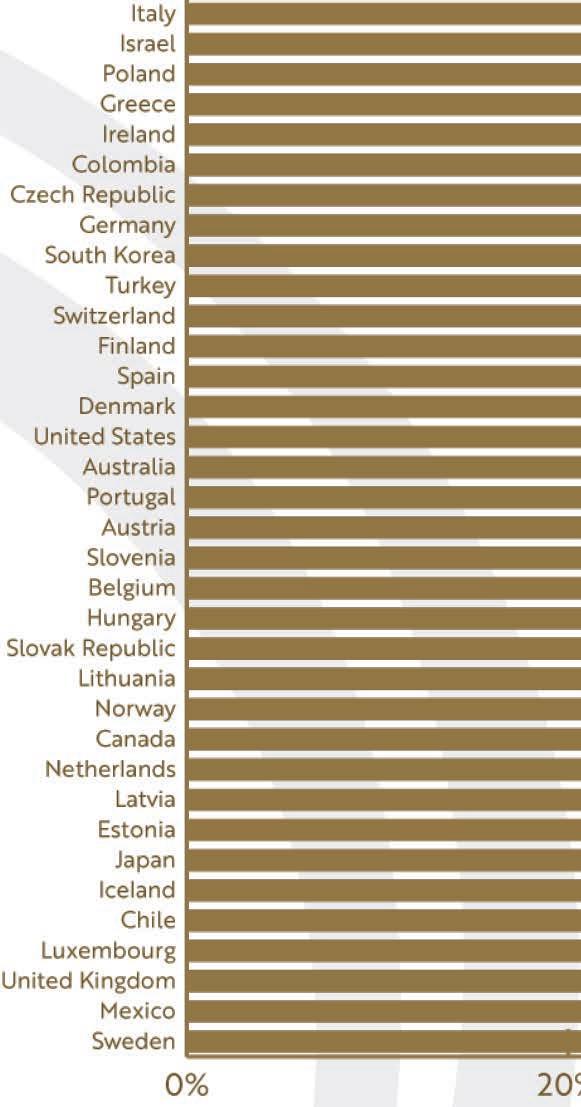
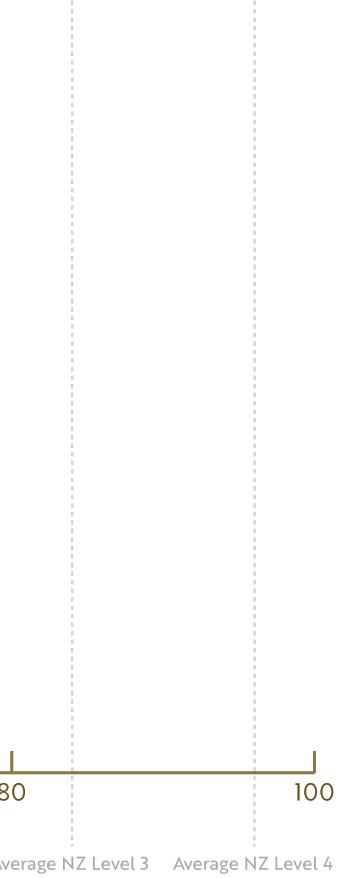
Figure 2: Days of more/less stringency than New Zealand, OECD countries, 1 March – 31 July 2020
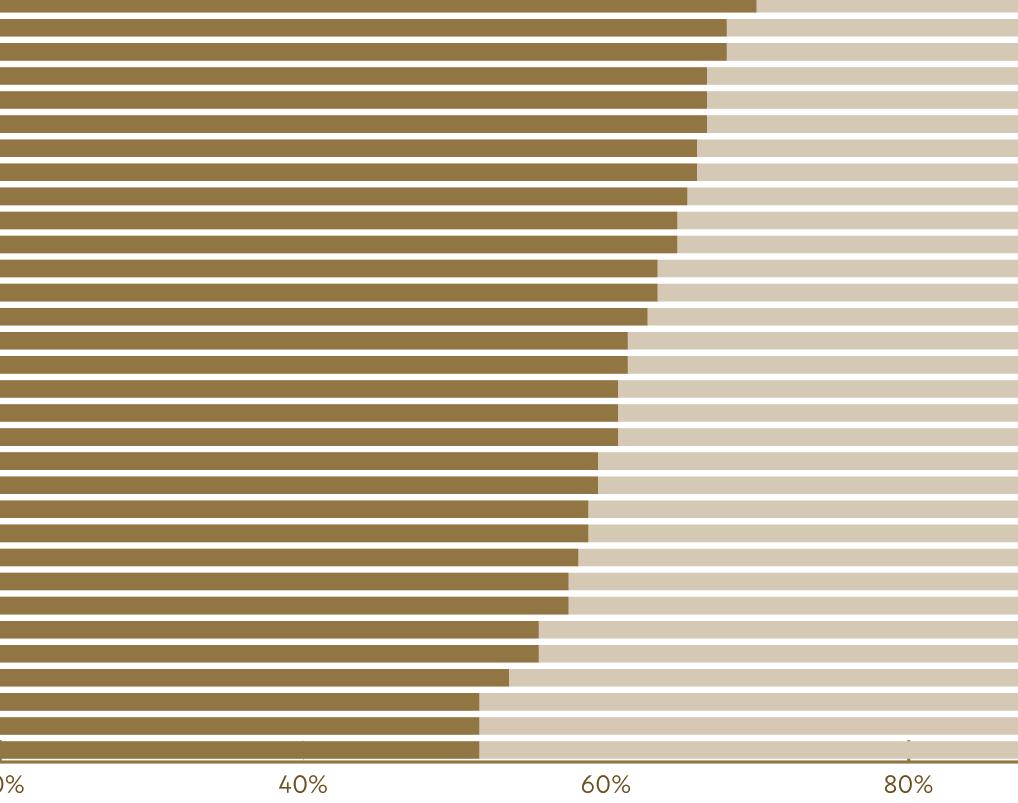
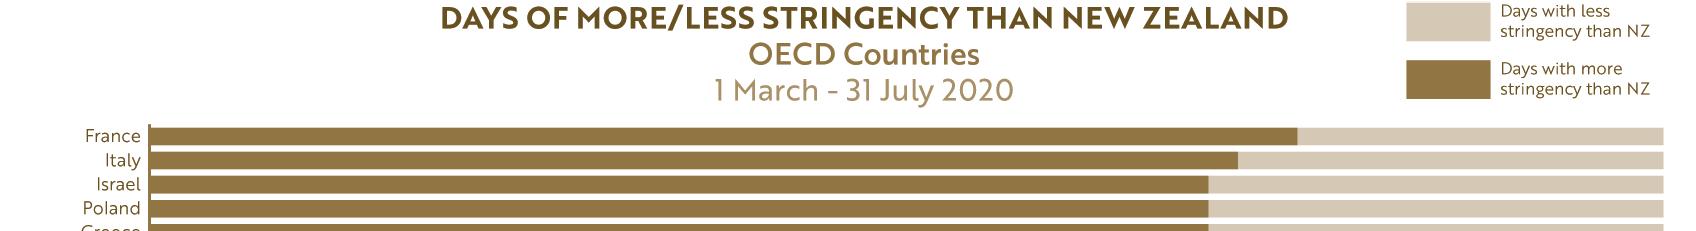
Source: Blavatnik School of Government, Oxford University (2020)
Figure 2 shows the number of days between 1 March and 31 July that countries were more, or less, stringent than New Zealand. It shows that every single country in the OECD spent more days with higher restrictions than New Zealand – including Sweden. Put another way, we had more days with more freedoms than any other country in the OECD3
Taking the average stringency for the period also provides a sense of the overall level of restrictions imposed in those five months. 3 Please see Appendix A for the calculation method.
Beyond COVID-19: the Māori Recovery Te Pūtea Whakatupu Trust
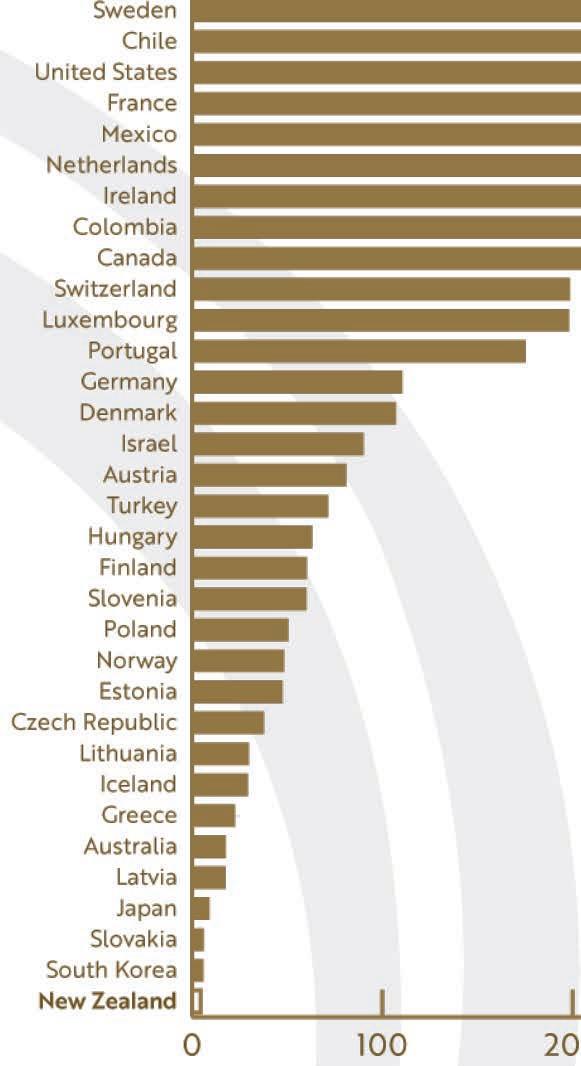
Figure 3: Average government stringency, OECD countries, 1 March – 31 July 2020
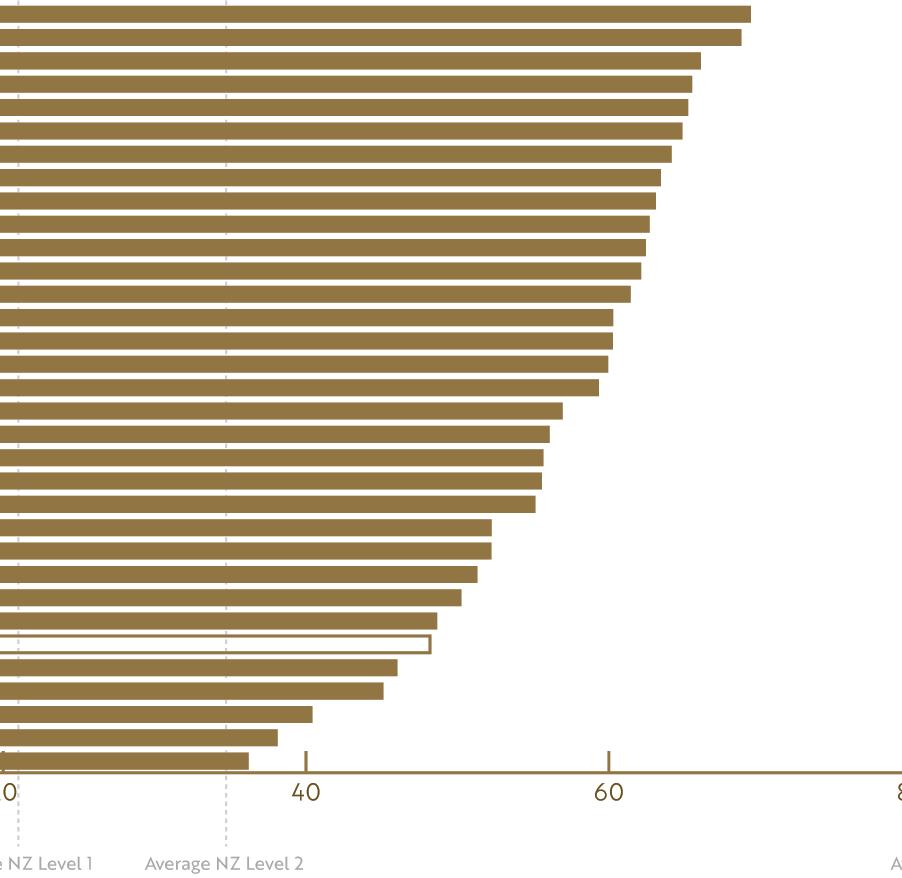
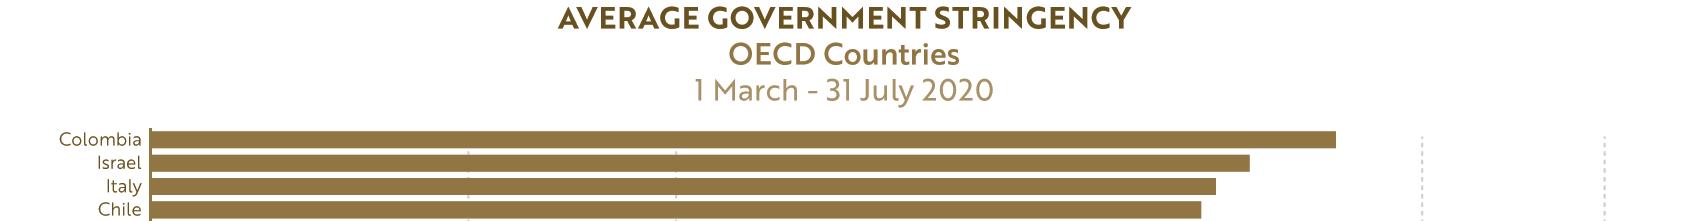
Source: Blavatnik School of Government, Oxford University (2020)
What Figure 3 shows is that New Zealand has, on balance, been less restricted than our reputation might suggest. Our strategy has been to go hard and go early, for short, sharp periods of time – and then open up. Others have gone softer, later and remained restricted for longer periods of time but at a lower level of stringency
In contrast to our approach, Sweden has been one of the most permissive of the countries listed but that should not be interpreted as it having imposed no restrictions. It has. They have not used lockdowns and they have had an average level of stringency approximately equivalent to New Zealand’s Level 2. Their government encourages its citizens to take responsibility for social distancing and have introduced other precautions more recently, such as bans on mass gatherings and closing nightclubs and theatres. The current limit on gatherings is 50 people (Folkhälsomyndigheten Public Health Agency of Sweden, 2020) Sweden had an explicit goal of protecting the economy by remaining open and a more implicit one of achieving herd immunity.
Meanwhile, the United Kingdom has shifted its approach a number of times. It entered the pandemic with a herd immunity strategy much like Sweden and changed tack when modelling suggested they would suffer many thousands of deaths (Ferguson, et al., 2020). Despite this change and adopting a more strict lockdown - although not as strict as NZ (Blavatnik School of Government, 2020) – at the time of writing, the UK has had over 41k deaths as a result of COVID-19 (Worldometer, 2020a)
The United States and Australia are a federation of States and, in the absence of a strong federal strategy, individual States have taken their own approaches to COVID-19. Some have opted for stricter lockdowns for shorter periods, while others have decided to impose fewer restrictions (for example, closing bars but not restaurants or imposing customer limits) but have done so for longer. In general, though, Australia,
Beyond COVID-19: the Māori Recovery Te Pūtea Whakatupu Trust
took a middle road between New Zealand’s stringent Level 4 lockdown and no restrictions (Blavatnik School of Government, 2020). It kept more of its economy open, imposing gentler restrictions but for longer, and also introduced a Wage Subsidy scheme (on which NZ based ours). With the exception of the States of Victoria (which has experienced a significant second wave of cases) and New South Wales, Australia has largely eliminated the virus.
The United States remains the global virus epicentre in terms of case numbers, regularly recording in excess of 50k new cases per day (Worldometer, 2020a). States’ responses to the pandemic have varied a great deal
Finally, it is important to note that New Zealand’s response has not just been about lockdowns, although that was a crucial component of bringing the first wave under control – and, we hope, the second. The Prime Minister, Jacinda Ardern, and the Director-General of Health, Dr Ashley Bloomfield, have both led an extraordinary public health communications effort. This “combination of inspiring rhetoric and clear instructions” (Jamieson, 2020, p. 603) has been crucial to creating a sense of unity and talking the country through changes which have been necessary as the Government has adapted to changing circumstances.
Governments have not been the only ones taking action. The emergence of COVID-19 has seen Indigenous communities respond to protect their families, their communities and their tribes.
By mid-May of this year, the Navajo nation had developed an extremely high infection ratio – more than 4,000 confirmed cases in their population of approximately 170,000 people (Silverman, Toropin, & Sidner, 2020) By mid-August 2020, the Navajo nation had over 9,500 total cases of COVID-19 (including recovered) and 494 deaths (Navajo Nation Department of Health, 2020)
It is important to remember the Navajo context - their lands cross four State boundaries – New Mexico, Arizona, Utah and Colorado which, combined, have a population of 18,400,000 people. Those four states have had approximately 330,000 cases of COVID-19 with almost 8,000 deaths (Worldometer, 2020b). At present, with just under 1% of the population of these four States, the Navajo account for nearly 3% of the total cases of COVID-19 and more than 6% of the deaths.
The absence of a federal strategy, institutional racism and poor access to basic resources (in many cases including running water) required strong interventions from the Navajo Nation Department of Health They have provided leadership and direction for their people on their 6.8-million-hectare reservation by introducing some strict public health measures. Some of those measures include mandatory wearing of masks in public spaces (with basically 100% compliance) and overnight and weekend curfews Unnecessary travel is discouraged with hefty penalties including incarceration and fines. Isolation measures have also been introduced to contain the spread The result is that they have “flattened the curve” and believe their experience is a case study, with both a cautionary tale and a guide on what public health measures can achieve in responding to COVID-19 (Power, et al., 2020; NBC, 2020)
Meanwhile, in South Dakota, the Cheyenne River Sioux and Oglala Sioux responded to the pandemic by restricting movement into and out of their reservations in early April, over the objections of the Governor (Walker & Cochrane, 2020) At the time, South Dakota “only” had a few hundred cases (Argus Leader, 2020) Since then, the Cheyenne River Sioux have implemented their own COVID-19 Response Plan, complete with a 5-level alert system. (Cheyenne River Sioux Tribe, 2020a) and a website with daily updates on case numbers, hospitalisations, deaths, testing and more (Cheyenne River Sioux Tribe, 2020b)
The combination of these measures, curfews and more stringent lockdowns from time to time (Rickert, 2020) seems to have been largely successful, with the tribe recording a total of 108 cases and one death by
Beyond COVID-19: the Māori Recovery Te Pūtea Whakatupu Trust
August 23 (Cheyenne River Sioux Tribe, 2020b) in a population of approximately 12,000 (Bureau of Indian Affairs, 2020; U.S. Department of Transportation, 2020) This has been achieved despite an outbreak in early July being caused by a reservation resident being inadvertently exposed off-reservation at an approved medical appointment and bringing it back, leading to a spike in cases in July (Rickert, 2020).
The State of South Dakota, by comparison, has recorded a total of 11,276 cases and 161 deaths by August 23 (New York Times, 2020b) from a population of approximately 885,000 (U.S. Census Bureau, 2020)
The result of this is that the Cheyenne River Sioux have a lower infection ratio and a lower Case Fatality Ratio than the rest of South Dakota. Confidence in this conclusion can be drawn from the fact that the Cheyenne River Sioux also have a much higher testing ratio (54%) (Cheyenne River Sioux Tribe, 2020b) than the State (17%) (John Hopkins University, 2020)
In Canada, as their ancestors did during viral outbreaks in the 1800s, First Nations peoples are responding by drawing on their connection to their land and to each other. Returning to their lands with months of dry store supplies, they hunt for their protein (waterfowl, fish, caribou (reindeer), moose) and those with knowledge of traditional medicine gather supplies like cedar and Labrador tea (Banning, 2020)
“This is a very unique situation with COVID-19,” says [Adrian] Sutherland [from the Attawapiskat First Nation]. “It’s sort of forcing some families to reconnect and go back to the way it used to be.” His experiences on the land have helped him to overcome fear and build courage in adversity, he adds. “No matter what’s in front of you, you find a way to go around it, to get through it. It’s always guided me.” (p. 787)
In addition to more people returning to the land, and planning to stay for months rather than weeks, Canada’s First Nations band councils have put in place bans on social gatherings and have asked people to stay home. At the same time, efforts are being made to support those who need it, including food supplies (Banning, 2020). Thisis particularly important as, prior to the pandemic, more than half of First Nations adults living in First Nations communities described their households as food insecure (First Nations Information Governance Centre as cited in Deaton & Deaton, 2020)
Closer to home, in Australia, Aboriginal leaders and organisations across the country have, in many instances, been ahead of Federal and State governments in leading local responses to the pandemic as demarcation issues between the two slowed things down. As in New Zealand, this leadership has often taken the form of closing or restricting access to remote communities.
“After several large Indigenous communities across Australia took measures into their own hands to limit incoming visitors, on March 26, 2020, the National Cabinet provided in-principle agreement to the Commonwealth Minister for Health taking action under the Biosecurity Act 2015 to restrict travel into remote Indigenous communities to prevent the spread of COVID-19 (Hunt & Wyatt, 2020). The previous day, on March 25, the Australian Government announced an allocation of [AUD]$57.8m to 110 communities under a new ‘Remote Community Preparedness and Retrieval Package’ primarily focusing on health assessment and care initiatives (Hunt, 2020).” (Smith, 2020, pp. 10-11)
In addition to these local lockdowns, medical centres and others with in-depth local knowledge:
! formed teams to evacuate high-risk individuals either confirmed or suspected of having COVID-19; ! completed surge planning for health services should an outbreak eventuate; and ! identified isolation and quarantine facilities, often in remote areas, along with accommodation facilities in larger centres for high-risk individuals should relocation prove necessary (Smith, 2020)
Beyond COVID-19: the Māori Recovery Te Pūtea Whakatupu Trust
Food security is also a challenge in remote areas, with a third of adult Aboriginal people reporting running out of food and being unable to afford more even prior to the pandemic. This is a problem exacerbated by food costing as much as 60% more than in a regional town – a consequence of transport costs, limited access, few stores (often only one) and, sometimes, price gouging (Power, et al., 2020). With lockdowns making regional travel impossible, local Aboriginal organisations and leaders have also worked to put in place services to improve food security for people in these remote settings (Smith, 2020)
Effective public health communication about the risk factors associated with COVID-19, and the actions necessary to mitigate those risks, is central to a successful response (Jamieson, 2020). However, in an environment where Aboriginal trust in government is not high (Power, et al., 2020), Aboriginal Community Controlled Health Organisations are helping get the public messages out to the people. These organisations are creating and disseminating information resources (including things like infographics) to keep people informed and providing advice on infection prevention. Knowing their people, they understand deeply the kind of motivations needed to change behaviour, the type of imagery which will support the public health messages and deliver it in the best language(s) for their target audience (Finlay & Wenitong, 2020)
Finally, part of Australia’s national response has included Indigenous voice. The Australian Government convened the Aboriginal and Torres Strait Islander Advisory Group on COVID-19 to advise the Government on preparedness, responses and recovery. It operates on the principles of “shared decision-making, power-sharing, two-way communication, self-determination, leadership and empowerment” (Crooks, Casey, & Ward, 2020, p. 1) and the scope of their advocacy, advice and action includes:
! legislative change;
! development of national guidelines, including a focus on Indigenous peoples in the response;
! planning and developing health services, including expansion of infrastructure (e.g. isolation and quarantine facilities to avoid overcrowded housing with infections);
! establishment and expansion of testing in remote communities, including mobile and rapid testing options; and
! contact tracing in the Indigenous community to help prevent spread (Crooks, Casey, & Ward, 2020)
Looking forward, Dillon (2020) argues that Aboriginal “precrisis normality… was deeply compromised” (p. 28) and that the longer-term reconstruction needs to focus on the social determinants of health and building economic resilience. The same could be said for Māori.
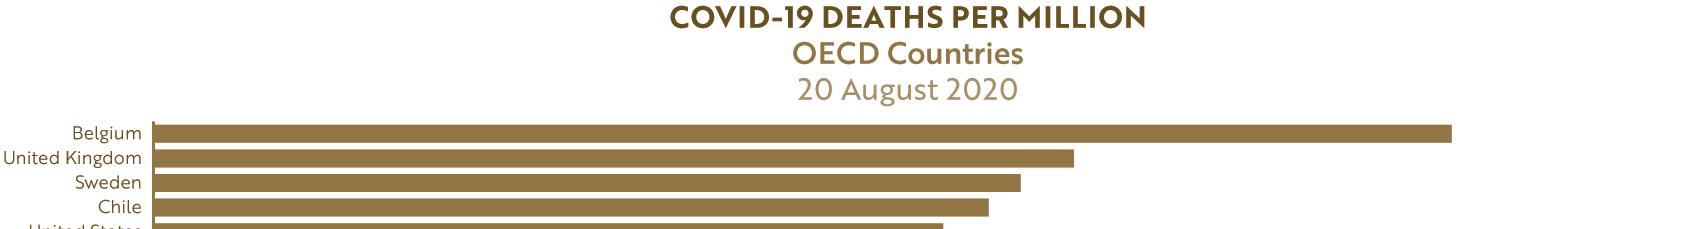
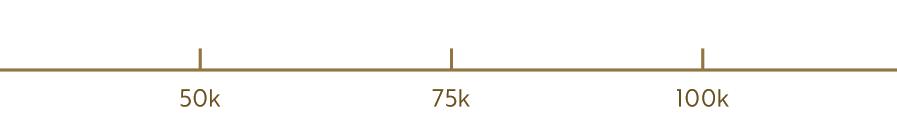
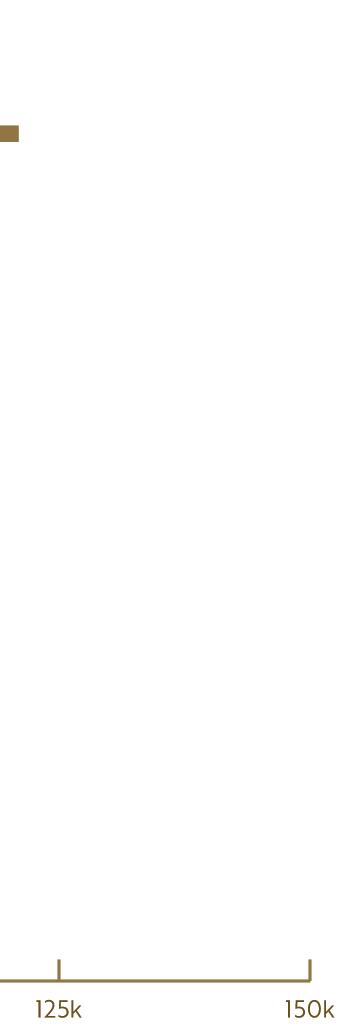
In terms of health outcomes in general, and mortality in particular, it seems that New Zealand’s approach has served us well. It is worth noting (and will no doubt be the subject of research for years to come) how Japan has managed to keep such a low mortality rate with comparatively low stringency levels throughout the pandemic. Early research suggests that the Japanese may have greater immunity due to an historical encounter with a similar coronavirus. It is thought that this, combined with cultural openness to the use of masks, social distancing and following government directions may have led to their low mortality ratio (Wingfield-Hayes, 2020)
Beyond
Figure 4: COVID-19 deaths per million of population, OECD countries, 20 August 2020
Source: Our World in Data (2020)
Still, New Zealand has the lowest death rate in the OECD (Our World in Data, 2020). We have unarguably done a very good job on the health front. This is particularly true in respect of Māori, making up 16.5% of the population (Statistics New Zealand, 2019) but only 10% of cases – so far (Ministry of Health, 2020) Historically, Black, Indigenous and People of Colour (BIPOC) peoples have been hit much harder by pandemics than non-Indigenous peoples the world over and the signs are that, beyond our borders, this one will be no different (Power, et al., 2020; van Dorn, Cooney, & Sabin, 2020; McMeeking & Savage, 2020; Tai, Shah, Doubeni, Sia, & Wieland, 2020). So, it is encouraging for Māori to be in what is an extraordinarily strong position. It will take a collective effort to keep it that way. But what of the economic cost? What do we know and how do we compare to the rest of the world? How are other Indigenous peoples faring? It will be some time before we have definitive answers to these questions but the sections that follow explore the early signals coming through and identify any lessons New Zealand and iwi Māori might take from experiences around the world.
Beyond COVID-19: the Māori Recovery Te Pūtea Whakatupu Trust


Overall, the economy is performing as well as might be expected under the circumstances. There are a number of ways of looking at this in terms of how we compare with others. Alongside unemployment, Gross Domestic Product (GDP) is the measure used most frequently and describes the value of all the finished products and services produced by a country within a given period. The idea is that the more that is produced, the better.
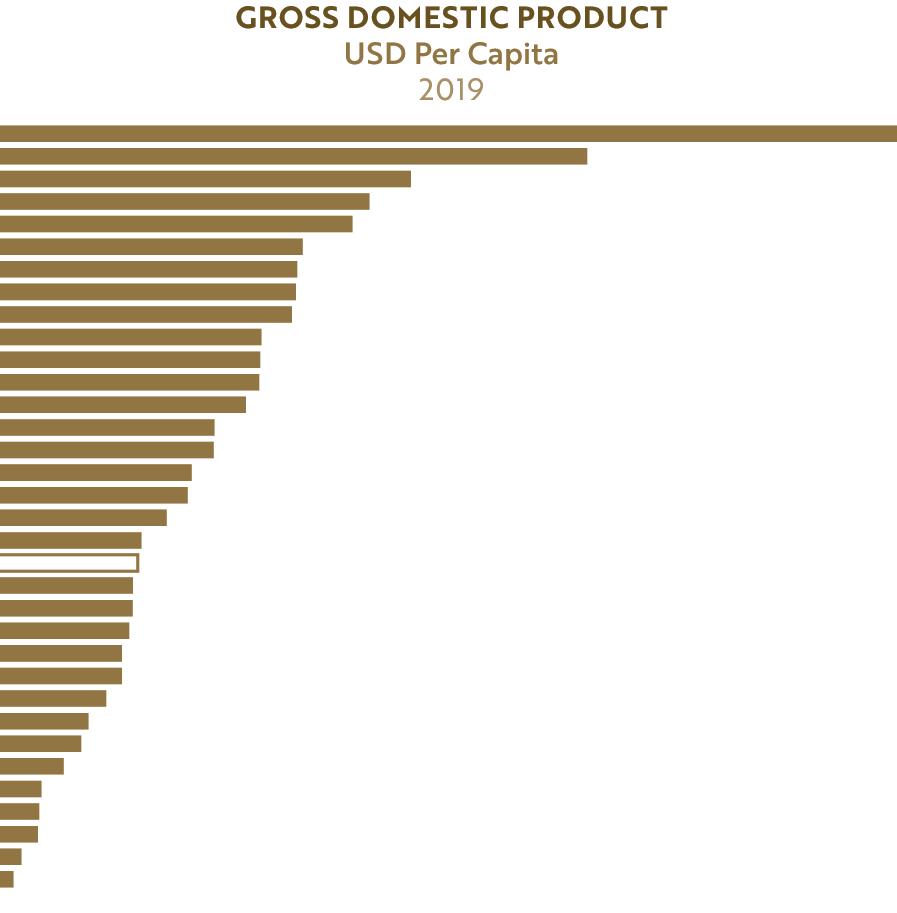
It is difficult this early on in the pandemic to provide meaningful comparisons between countries in terms of GDP. However, we can begin to assess our early performance against that of others. In order to do that, we need to first establish the baseline – where we were in relation to other countries in terms of GDP per capita prior to the start of the pandemic – in order to evaluate how things have gone from there.
The graph above shows our 2019 placing in the OECD in terms of GDP per capita – production output per head of population. Although we are in good company (e.g. Japan, Korea and innovation darling Israel), we are below the OECD average. Just on the other side of the average are the United Kingdom, France and Canada.
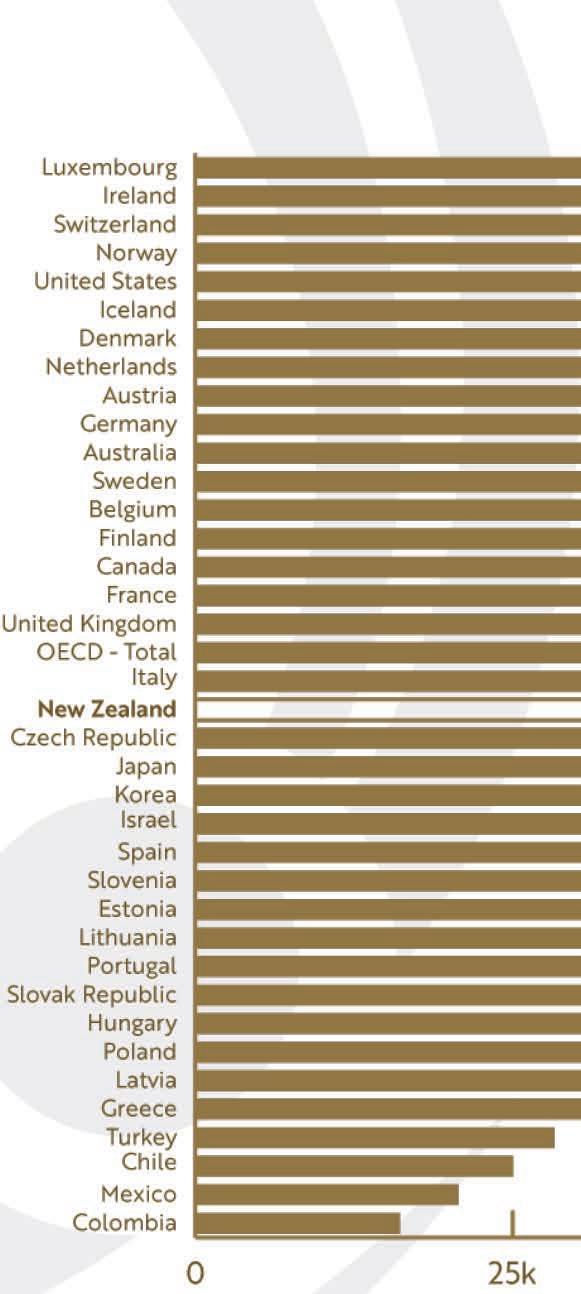
Our per capita GDP has long been a focus for successive governments and provided part of the impetus for the 2011 establishment of New Zealand’s Productivity Commission which is tasked with advising the Government on how to improve productivity (Productivity Commission, 2020)
While a full economic impact analysis will be some years away, at this stage there is some early data which makes clear that no country will escape COVID-19 with its economy unharmed.
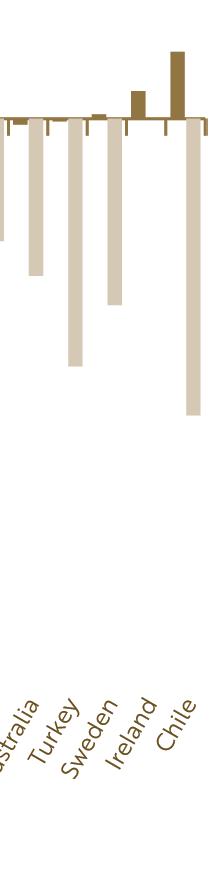
Figure 6: GDP growth on previous quarter, expenditure approach, OECD countries, Q1 & Q2 2020 Source: Organisation for Economic Co-operation and Development (2020d)
The graph above shows that, for the first quarter at least, New Zealand’s negative GDP growth was less than the OECD average. But it also shows that it is early days. In those countries for which Q2 data is available, significant drops have been recorded, even in countries with comparatively permissive responses to the virus like the United States and Sweden
It is important to note that, in Sweden, “only” 146 people had died by the end of the first quarter. That number stands at more than 5,800 today and Sweden has recorded a contraction of 8.6% for the quarter to June 2020. This reinforces the fact that the economic fallout from COVID-19 is not something that can be completely avoided – even without full lockdowns.
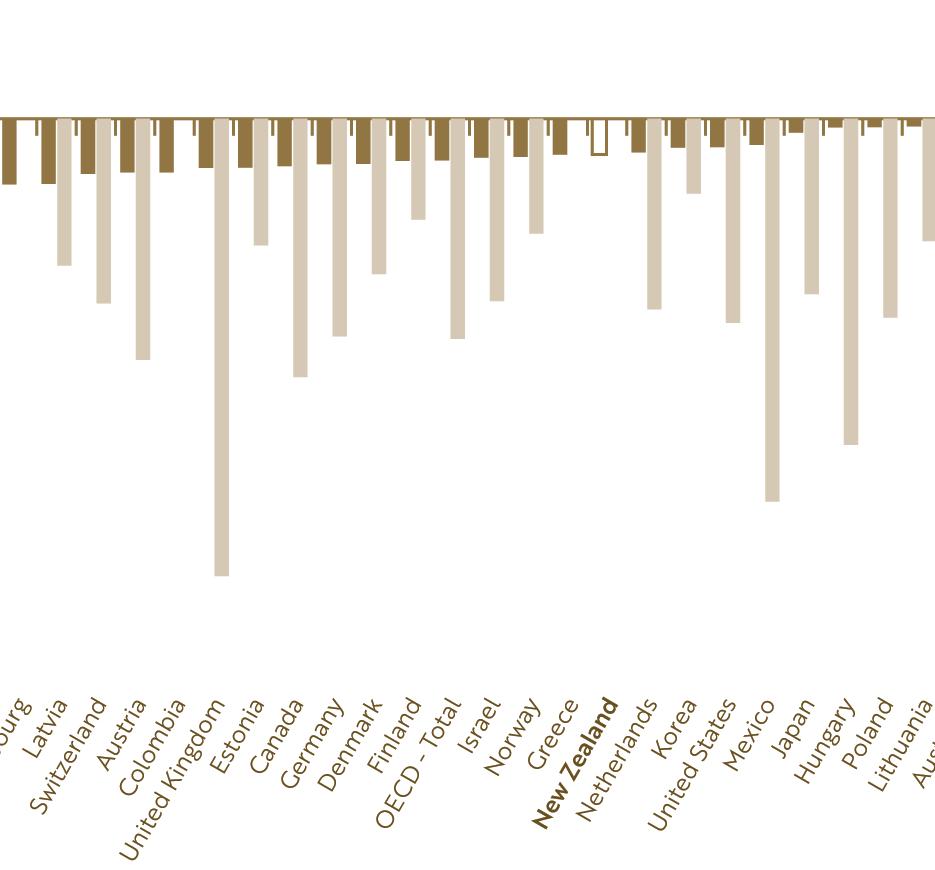
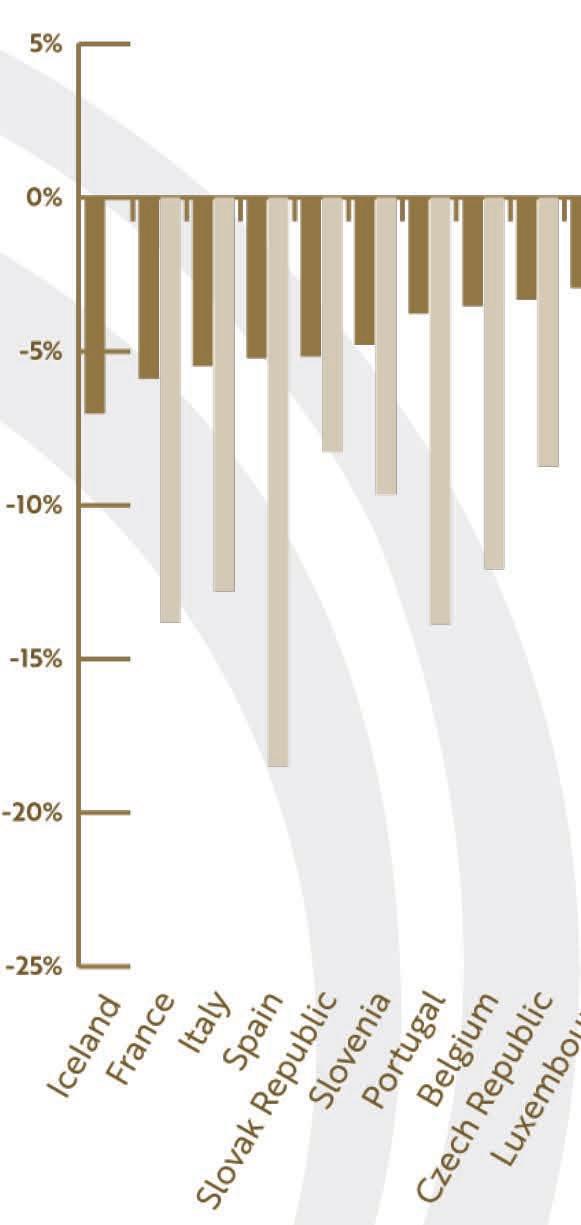
Overall, New Zealand’s exports are holding up reasonably well against the pressures of the pandemic as compared to others in the OECD4 . A useful way of evaluating performance is to consider movements between quarters in previous years. For example, comparing Q2 2020 to Q2 2019. While comparisons with the previous quarter in the same year (comparing Q2 2020 to Q1 2020) can provide some insight, it does not allow for seasonal differences and can therefore be misleading when viewed in isolation.
The graph below shows the movements between Q1 2020 and Q1 2019, and between Q2 2020 and Q2 2019.
4 OECD figures do not match those prepared by Statistics New Zealand. However, they are prepared in a way that enables comparisons across countries. As that is the focus of this section, OECD figures have been used.
Beyond COVID-19: the Māori Recovery Te Pūtea Whakatupu Trust

Figure 7: Exports, OECD countries, percentage change in 2020 from same quarter 2019
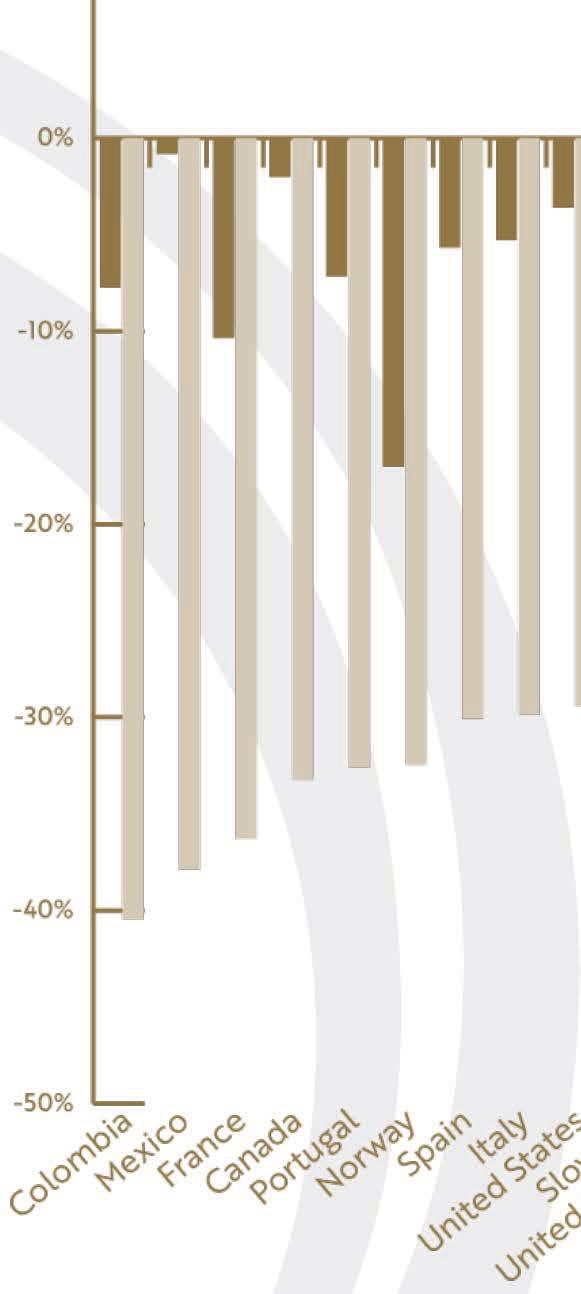
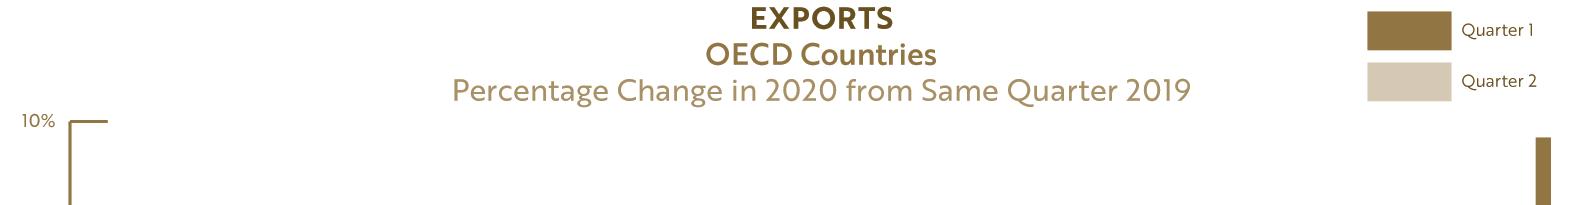
Source: Organisation for Economic Co-operation and Development (2020c)
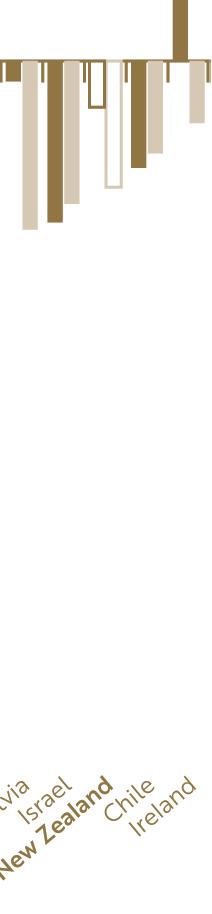
It is clear from this that economies around the world have been impacted seriously, without exception, by COVID-19. However, once again, New Zealand finds itself, comparatively, in a better position than most of our peers.
Perhaps this is not surprising. In their paper entitled Pandemics Depress the Economy, Public Health Interventions Do Not: Evidence from the 1918 Flu, Correia, Luck and Verner (2020) studied the nonpharmaceutical interventions (NPIs) (e.g. social distancing, school closures) employed in 43 cities across the United States in response to the 1918 pandemic. The authors found that those cities that implemented stricter NPIs had a shorter period of economic disruption and a quicker, stronger recovery
There are a number of aspects to the labour force discourse associated with COVID-19 and its impacts worth exploring. There are the high-level indicators, such as rising or falling unemployment, which are proxies for the economic health of a nation, its virus response and its likely economic future. However, it is also important to examine how COVID-related unemployment is distributed within a society, who it affects, at what cost and why this is the case. It is clear from observations around the world that the economic pain from job-losses tends to be unevenly distributed (Dinku, 2020)
Equally, it is worth noting the different working conditions of those who remain employed – who has it better, who has it worse and the consequences of that disparity.
Beyond COVID-19: the Māori Recovery Te Pūtea Whakatupu Trust


In any discussion of the labour force, it is important to understand how different relevant metrics are calculated When official figures are released there is often a great deal of commentary, much of it misleading or incomplete (e.g. Cook, 2020). Part of the reason for this is that there is a tendency to focus on the unemployment rate, to the exclusion of other measures. In times of great flux, like this pandemic period, it becomes even more crucial to ensure a wide range of data is considered before drawing any conclusions.

In order to support that, this section illustrates the measures used to analyse how a labour force is performing and provides a detailed explanation of those ones used most frequently. Most developed countries use a common set of definitions from the International Labour Organisation (ILO).
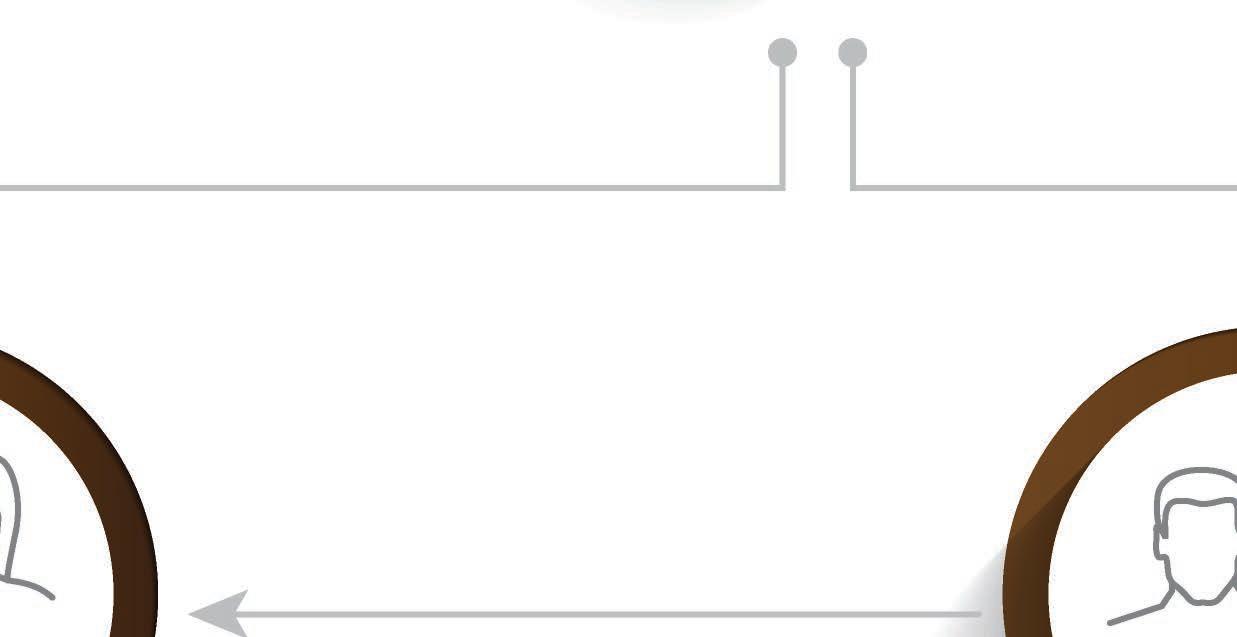
In order to calculate the unemployment rate, country populations are divided as follows:


Beyond COVID-19: the Māori Recovery
Te Pūtea Whakatupu Trust
! Persons in the Labour Force
! Persons employed in the Labour Force
! Persons not employed in the Labour Force
! Persons not in the Labour Force
People can have a range of reasons for not being in the Labour Force. They include:
! retired people;
! people with personal or family responsibilities such as unpaid housework and childcare;
! people attending educational institutions;
! people permanently unable to work due to physical or mental disabilities;
! people who were temporarily unavailable for work in the survey reference week; and
! people who are not actively seeking work
The unemployment rate is calculated as follows:
Persons not employed in the Labour Force
Total Labour Force
It is important to note here that the Total Labour Force does not include people who are not actively seeking work for any reason. This means those who are available but have been unsuccessful in their search for a job and have given up are not considered to be in the Labour Force. Furthermore, in economic downturns, people will frequently turn to higher education when they are unable to find a job. These people are also not considered to be part of the Labour Force. Neither of these undermine the validity of the unemployment rate as a measure, but it is important to understand the calculus.
While the unemployment rate is a very useful metric, care should be taken by considering it alongside the Labour Force Participation Rate, which is calculated as follows:
Persons the Labour Force
Working-age Population
This measurement, along with changes over time, provide important context for a country’s unemployment rate. If a large number of people fall into unemployment and stop looking for work, this will have the effect of reducing the overall size of the Labour Force without that being reflected in the unemployment rate. This issue is discussed later in this document.
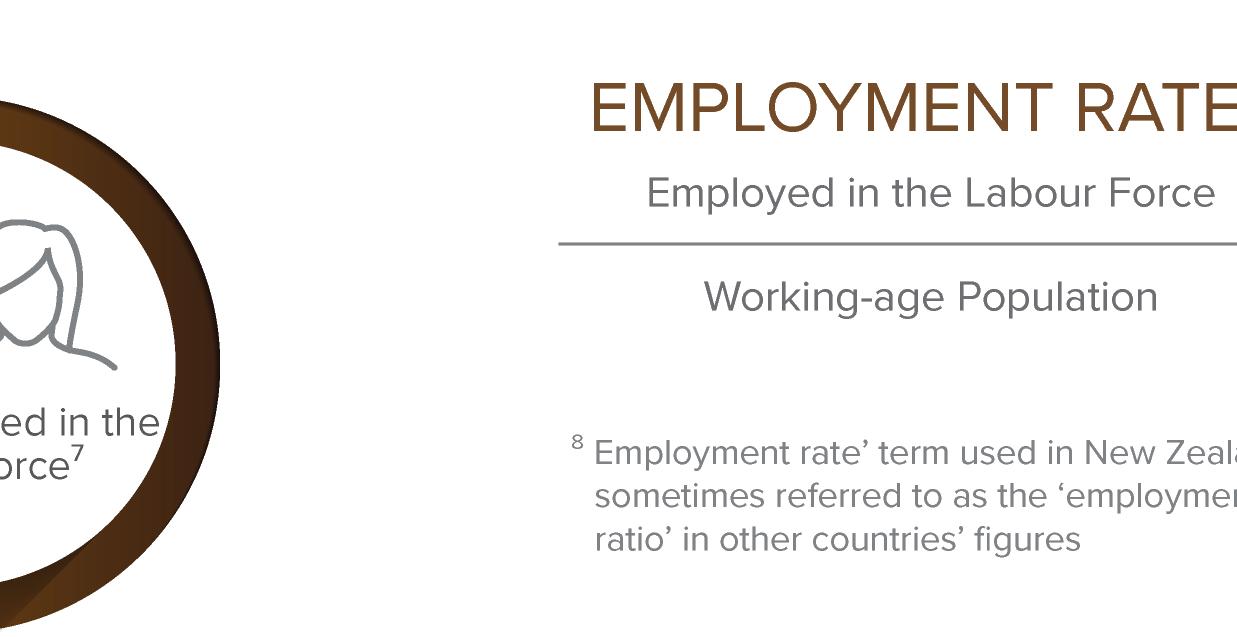
The employment rate measure provides further perspective and information on the employment situation. While it sounds similar to “unemployment rate”, the basis of its calculation is completely different. While the unemployment rate measures those unemployed as a proportion of the labour force (those in or looking for employment), the employment rate measures those employed as a proportion of the working-age population
This means that it is not as susceptible to seasonal or short-term fluctuations in the same way and takes into account those people not in the workforce, including those employable but who have given up looking for work. It is regarded as a more reliable indicator of job growth or shrinkage because it shows the proportion of the working-age population who are employed/not employed.
Beyond COVID-19: the Māori Recovery
Te Pūtea Whakatupu Trust
However, as with other indicators, it has limitations too – or at least cautionary notes. Those who have retired early or who are studying at university are included in the basis of the calculation whereas the unemployment rate excludes those people.
It is important that a range of indicators are considered when examining employment and unemployment to get a fair picture of the situation.
Impacts of economic downturns do not always result in the binary result of retention or loss of jobs. Frequently, employers will look to cut costs by having everyone “share the pain” by cutting hours across the board or by reducing the hours of casual employees. Therefore, examining underemployment is an important aspect of any COVID-19 labour force analysis.
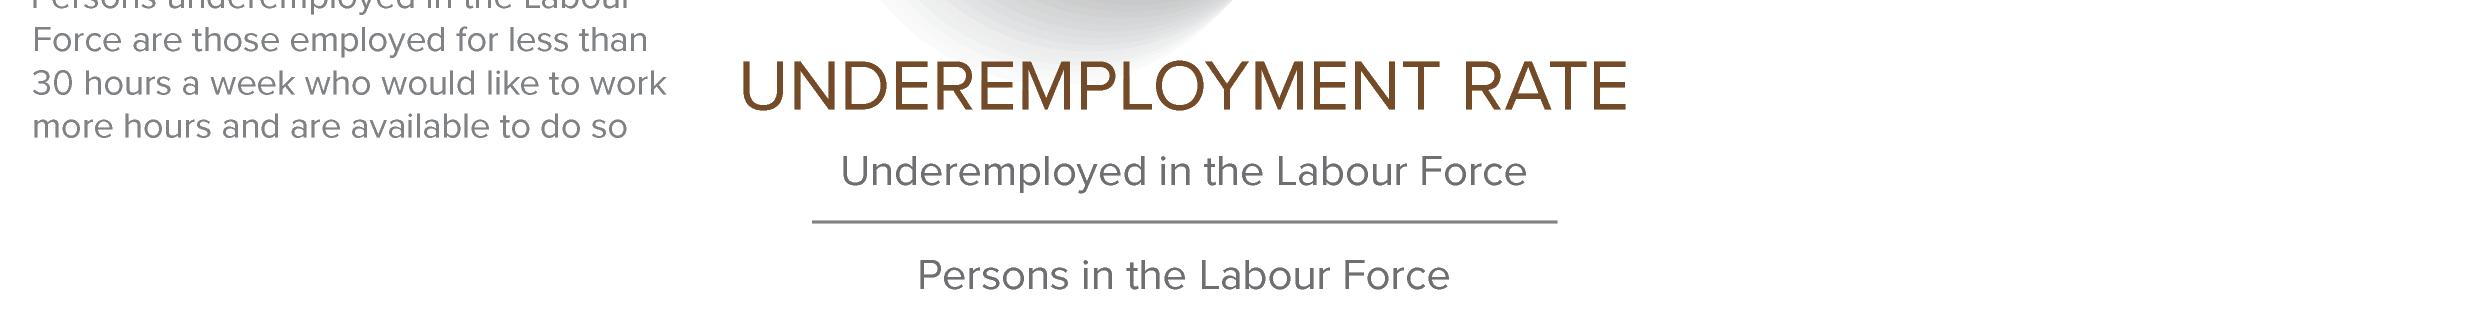
Someone is considered underemployed in New Zealand if they work fewer than 30 hours a week but would like to work more and they are available to do so.
The underemployment rate is calculated as follows:
Persons underemployed in the Labour Force
Persons employed in the Labour Force
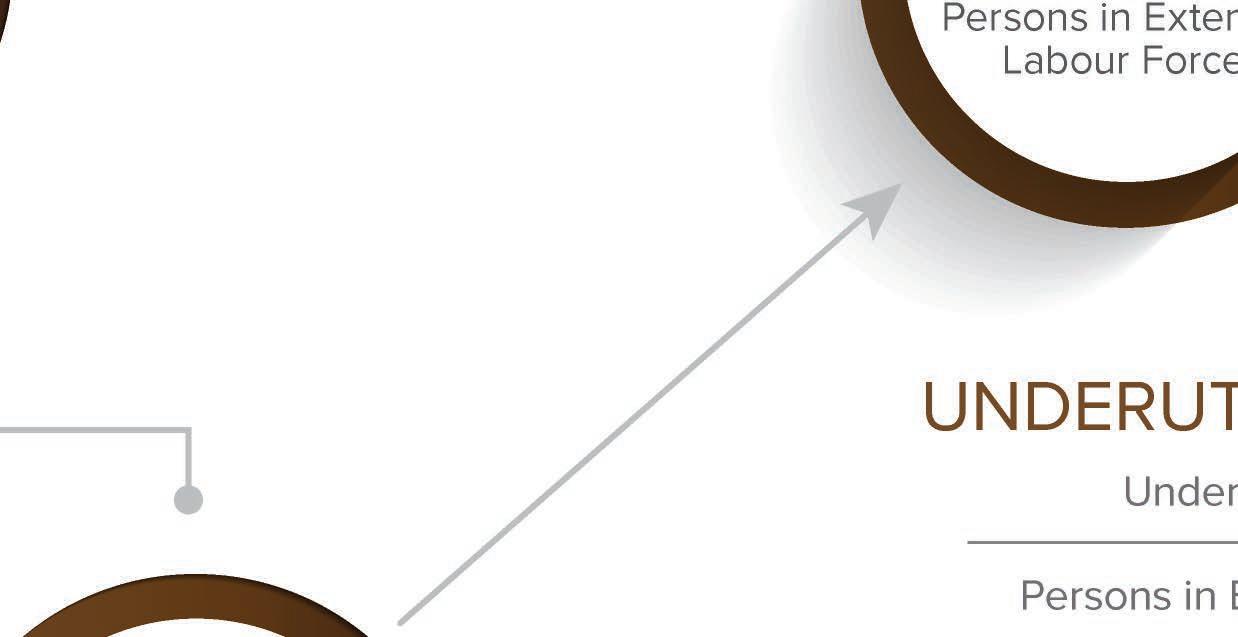
As mentioned earlier, one of the limitations of the unemployment rate is that it does not include those people who are not considered part of the Labour Force. People who are no longer employed, are available to work but have given up looking for employment are included in this group. Likewise, those who have not been in the Labour Force but are intending to look for work in the near future are considered “Not in the Labour Force” until they find a job. People in these categories are described as the “Potential Labour Force”.
This group can be added to two further groups to make up larger groups:
1. Potential Labour Force + Persons in the Labour Force = Extended Labour Force
2. Potential Labour Force + Underemployed Persons in the Labour Force + Unemployed Persons in the Labour Force = Underutilised Persons
In order to calculate the Underutilisation Rate, the following calculation is made: Underutilised Persons
Persons in the Extended Labour Force
Along with Gross Domestic Product (GDP), a country’s unemployment rate is frequently used as a proxy for the overall health of a nation’s economy. The most obvious challenge with this is that those who have lost their jobs and have stopped looking do not count in the unemployment rate. Likewise, those who choose to enrol in higher education are excluded from the unemployment rate calculation. Though imperfect, it remains a useful macro-indicator of prosperity when examined in conjunction with other measures
This section looks at unemployment around the world since the end of last year in an effort to understand how Aotearoa New Zealand is faring relative to others as we all grapple with the impacts of COVID-19. Where the information is available, it also includes figures, commentary and literature which relates to Indigenous peoples and ethnic minorities to contextualise the Māori reality with the experiences of other tangata whenua.
Beyond COVID-19: the Māori Recovery Te Pūtea Whakatupu Trust
The comparisons begin with other countries in the Organisation for Economic Co-operation and Development (OECD). The graph below shows where New Zealand is placed in terms of unemployment against other countries in the OECD, in ascending order based on Q2 levels
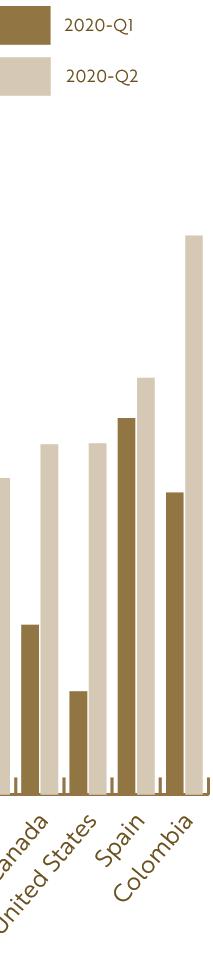
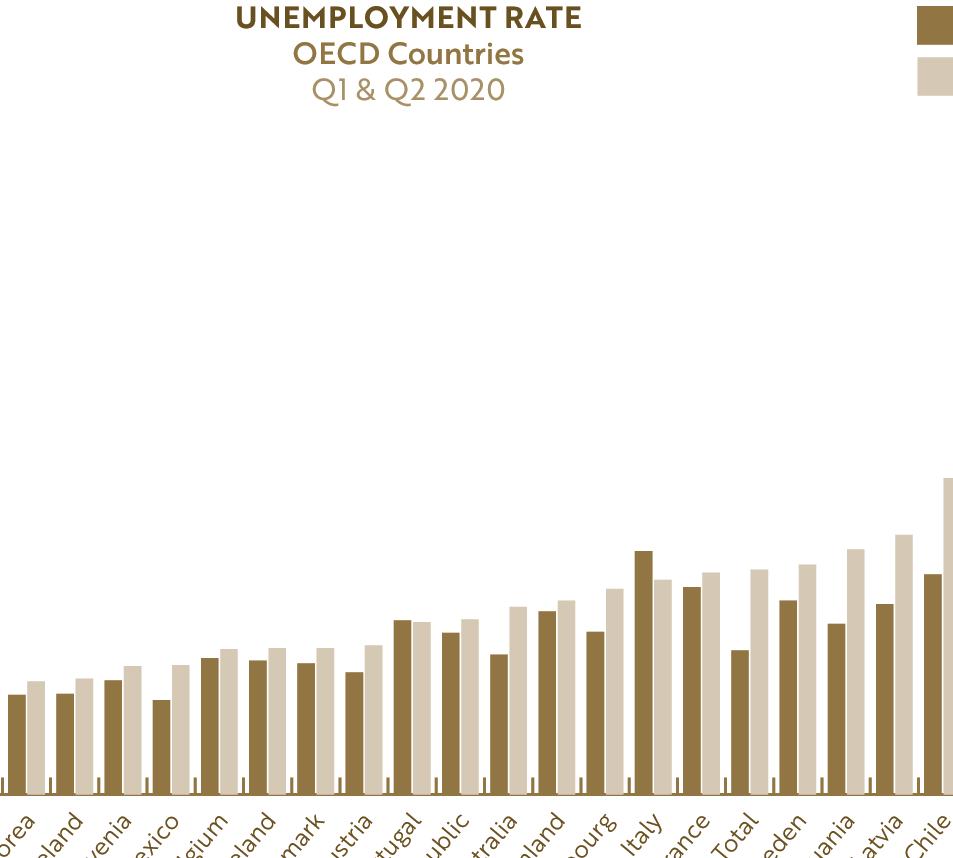
Figure 9: Unemployment rate, OECD countries, Q1 & Q2 2020
Source: Organisation for Economic Co-operation and Development (2020e)
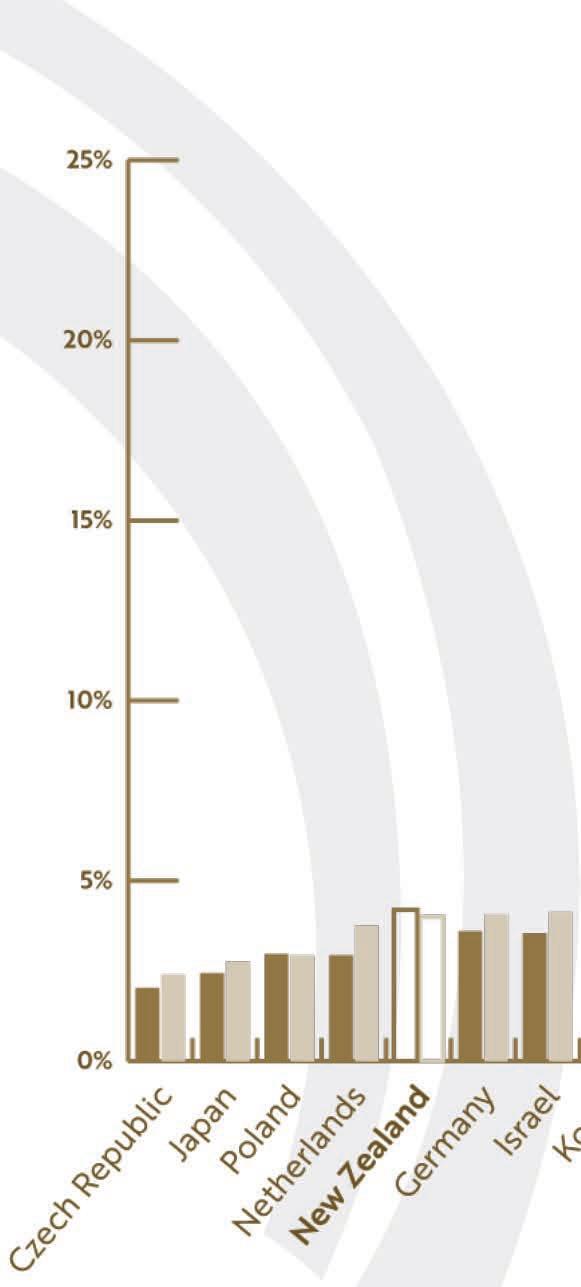

The first-quarter unemployment rate of 4.2% placed us 14th out of the 37 member countries. Based on our second-quarter results so far, we currently have the fifth-lowest unemployment rate behind the Czech Republic, Japan, Poland and the Netherlands as the employment costs of COVID-19 and the different government responses begin to play out. Countries which have taken a more permissive response to the virus in pursuing a suppression strategy, rather than one of elimination, are not outperforming New Zealand in terms of unemployment. The United States, Sweden and Australia are all far worse off.
There are a seven countries missing from that ranking as they did not have their Q2 rates recorded. They include: ! Greece; ! Estonia;
Hungary; ! Norway; ! Switzerland; ! Turkey; and ! United Kingdom.
Beyond
Of these, the UK, Norway and Hungary had slightly lower unemployment rates than New Zealand in the first quarter. Assuming they maintain that lead (which is not a given), New Zealand will have the eighthlowest unemployment rate out of 37 member countries. Even in that scenario, New Zealand is doing well. What is perhaps more interesting is that out of the 30 countries which have reported Q2 unemployment rates, only four have seen their unemployment rates drop from Q1 – Italy, Poland, Portugal and New Zealand.
Prior to the recent resurgence, the unemployment trajectory had been very encouraging. New Zealand’s official unemployment rate for the second quarter of 2020 is 4%, representing a drop from the first quarter’s rate of 4.2% (Statistics New Zealand, 2020b) As a consequence of the definitional considerations discussed earlier, the New Zealand Government also released an “extended unemployment rate”, in which it included people who were unemployed and not looking for work as a result of COVID-19. That rate was calculated to be 4.6% (Statistics New Zealand, 2020a) which is still a remarkable result under the circumstances
Appearances can be deceiving, though. Top-line indicators can conceal the fact that not everyone shares equally in national fortunes. Even without a pandemic, this is an observable reality for Black, Indigenous and People of Colour (BIPOC) the world over. To some extent, in terms of unemployment at least, the COVID-19 pandemic is ‘just’ another economic downturn. All economic downturns see those in casual, ‘low-skilled’ and lower-paid occupations pay a disproportionate price in terms of job-losses. They are among the least able to absorb the financial shock of even short periods of unemployment, the first to lose their jobs and the last to regain employment when the economy recovers (Heyes, 2014; Hunter, 2009; Pollmann-Schult as cited in Dinku, 2020)
This section examines differences in unemployment for BIPOC in select countries. The table below shows the unemployment rates of countries against which we would typically compare ourselves. The table contains the national rates along with rates for BIPOC populations where available.
Country December 2019 March 2020 June 2020
New Zealand5 4.0% 4.2% 4%6
Māori 8.4% 8.7% 6.7% Pacific Peoples 7.2% 7.9% 6.4%
Asian 3.5% 5.1% 4.4% Pākehā 3.3% 3.5% 3.3% Australia7 5.1% 5.2% 7.2%8 Aboriginal9 11.2% Unknown Unknown
United States of America10 3.5% 4.4% 11.1%
Native American Unknown Unknown Unknown African American11 5.9% 6.7% 15.4% Hispanic/Latino 4.2% 6.0% 14.5% White 3.2% 4.0% 10.1%
United Kingdom12 3.7% 3.9% 3.8% Ethnic Minority 5.8% 6.3% 6.1% White 3.4% 3.6% 3.5%
Based on the top-line figures for each country, it is clear that New Zealand is performing well. However, this breakdown by ethnicity tells more of the story Most surprising, perhaps, is how the unemployment gap between Māori and Pākehā compares to similar ones in other countries. At this early stage in the pandemic, we can only estimate the longer-term impacts of COVID-19. However, as at the time of writing, even with Māori unemployment in NZ at 6.7% (which is unusually low) it is still more than twice that of Europeans on 3.3% (Statistics New Zealand, 2020f) This gap is greater than the one between White Americans and African Americans/Latinx peoples, and between White and ethnic minorities in the United Kingdom. Only Australia has a larger gap between Aboriginal unemployment and the overall national figure (U.S. Bureau of Labor Statistics, 2020b; Statistics New Zealand, 2020b; Office for National Statistics, 2020; Australian Bureau of Statistics, 2020a; Statista, 2020)
A good working assumption of conditions that should lead to a reduced gap in unemployment would include positive race relations in a country. On that basis, Australia’s situation is not surprising. However, while New Zealand is certainly not without our issues, we would likely compare ourselves favourably to the United States and the United Kingdom in that regard. And yet, there is a smaller unemployment rate gap between their BIPOC population and the majority white population than the one we typically see in Aotearoa. Further analysis of hours worked, underemployment and earnings may indeed prove that the
5 (Statistics New Zealand, 2020b) 6 (Statistics New Zealand, 2020e) 7 (Australian Bureau of Statistics, 2020a)
8 The figure of 7.1% is the May 2020 figure as June’s figure is not yet available. 9 (Statista, 2020)
10 (U.S. Bureau of Labor Statistics, 2020a) 11 (U.S. Bureau of Labor Statistics, 2020b) – this is the source for all ethnicities listed for the USA. 12 (Office for National Statistics, 2020)
Beyond COVID-19: the Māori Recovery Te Pūtea Whakatupu Trust

BIPOC labour force reality is worse overall in the US and UK. It also may not. In that case, it could be a useful area for further research as we look for ways to achieve equity for Māori in New Zealand. We may not wish to emulate them, but they could still have lessons for us to learn
That being said, Māori unemployment is at its lowest quarterly level for at least 13 years (Statistics New Zealand, 2020f). This will be examined later in this report.
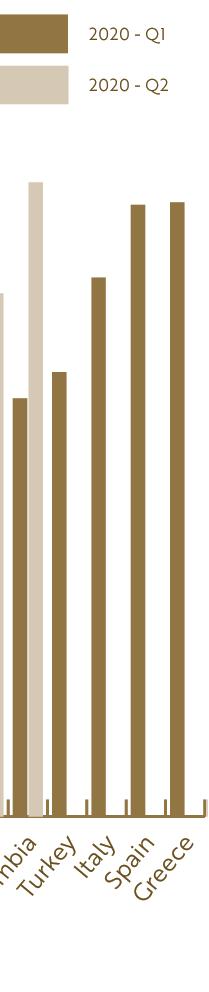
Young people in the workforce are projected to suffer more from job-losses or vulnerable employment than older people as a result of the pandemic (Olsen, 2020) It is therefore useful to see how New Zealand is doing in comparison to others with regards to youth unemployment
Figure 10: Youth unemployment rate, OECD countries, Q1 & Q2 2020
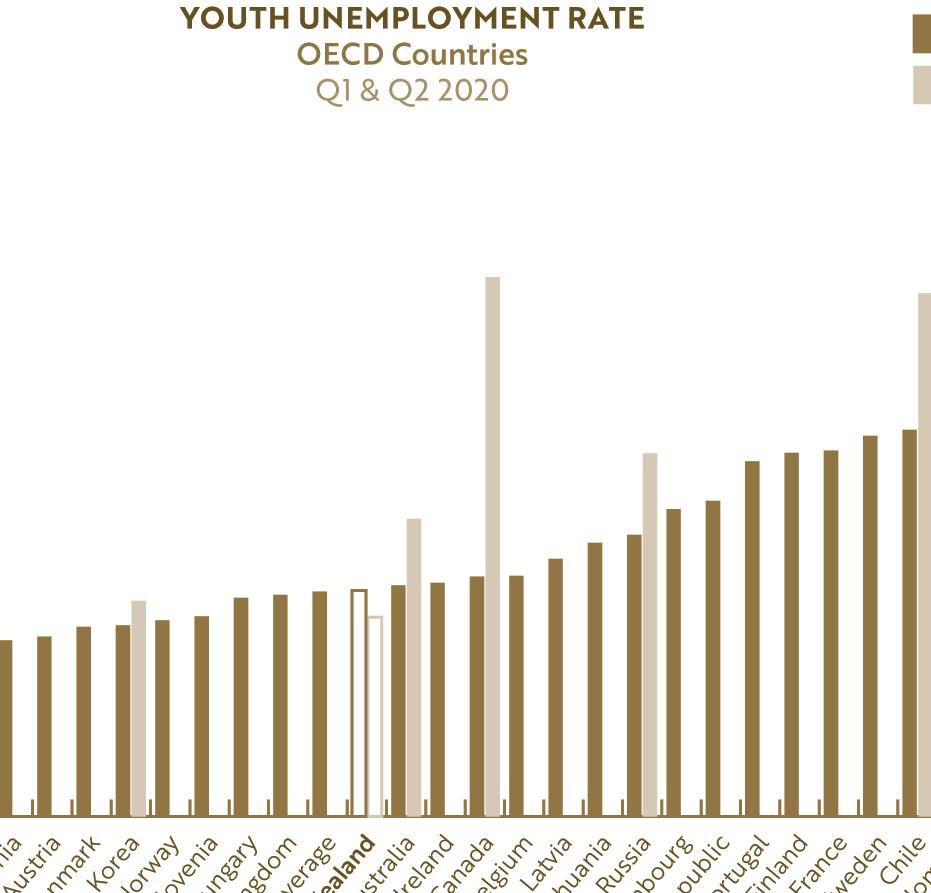
Source: Organisation for Economic Co-operation and Development (2020e)
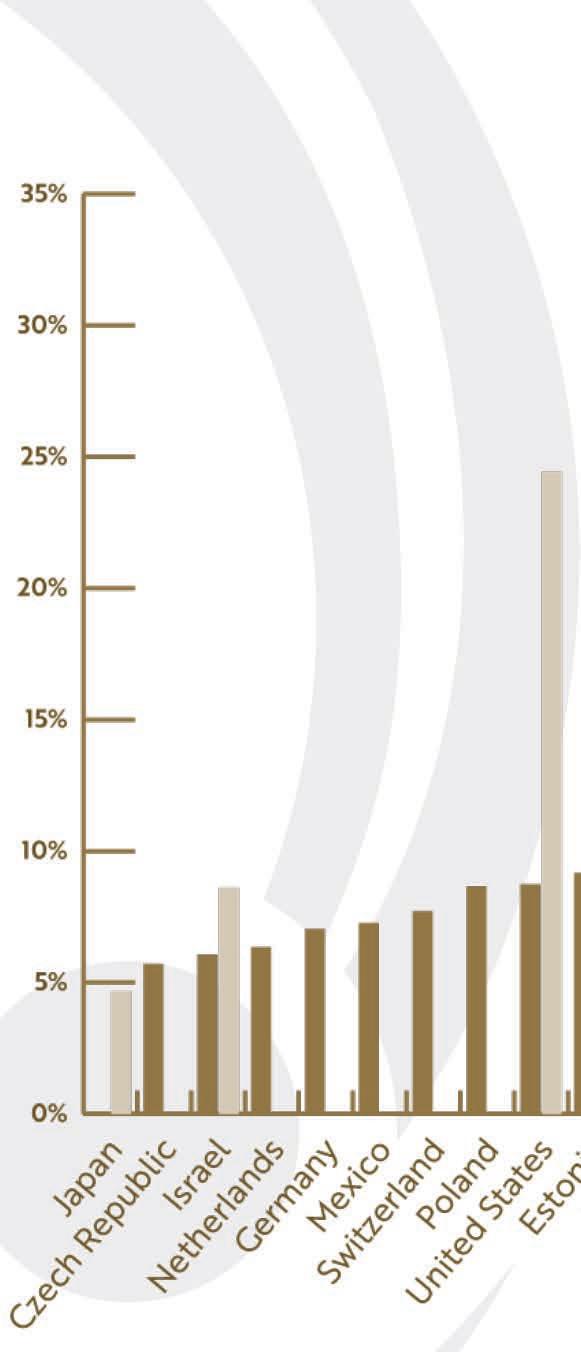
The graph above shows that we are not doing as well with youth unemployment as we are with unemployment more generally. Still, we were sitting at about the OECD average in the first quarter but improved for the quarter to June to 10.4% (Organisation for Economic Co-operation and Development, 2020e). This is significant because it is one of our lowest rates of youth unemployment in 35 years (Statistics New Zealand, 2020c). This will be discussed further in the next section of this report. For now, though, the most interesting observation to make in relation to how youth unemployment is performing internationally is that, so far, we are the only country for which the OECD has Q2 data that has seen a drop since the first quarter. All others have seen a rise in youth unemployment; the United States and Canada by significant amounts.

Alongside the challenge of unemployment, it is important to be aware of underemployment and it takes a couple of forms
One form of underemployment relates to skill or income and would include anybody working in roles beneath their skill level, typical income level or working more hours than they might otherwise. This is also known as “inadequate employment” (Wilkins & Wooden as cited in Lloyd-Cape, 2020)
The second form is the most common and easily measured. It is known as “time-related underemployment” – those who are working part-time but who want, and are available, to work more hours than they are currently. In New Zealand, someone is considered to be underemployed if they work fewer than 30 hours per week but would like to be working more (Statistics New Zealand, 2018)

The reason that a full analysis of a labour force needs to include examination of the underemployed is that it can reveal weaknesses in the economy that a strong unemployment rate on its own may conceal. Further to this, the stress that less than full-time earnings can create for individuals, families and communities is significant (Noble, Hurley, & Macklin, 2020) This is particularly true in the context of a post-COVID-19 world with rolling shutdowns impacting sectors like hospitality which have a high proportion of hourly or casual employees. BIPOC populations are also disproportionately overrepresented in these occupations.
The graph below shows the International Labour Organisation’s (ILO) estimates of OECD countries’ underemployment rates in 2020, so far
Figure 11: Underemployment rate, OECD countries, ILO modelling estimate 2020
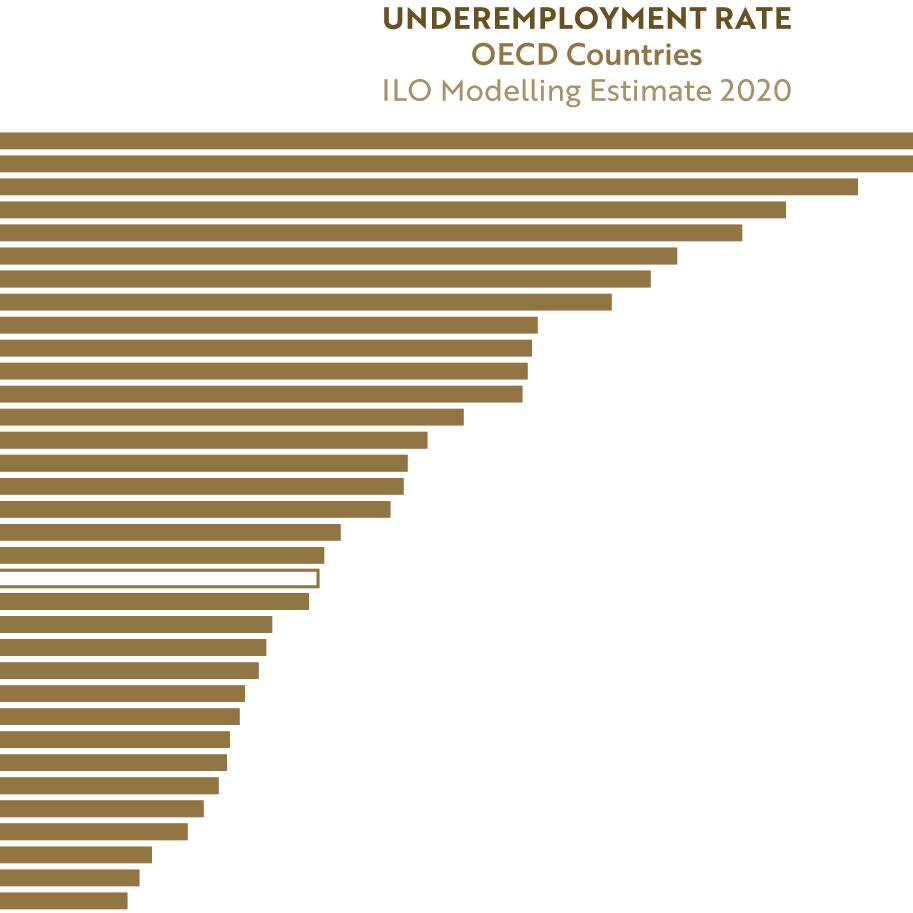
Source: International Labour Organisation (2020c)
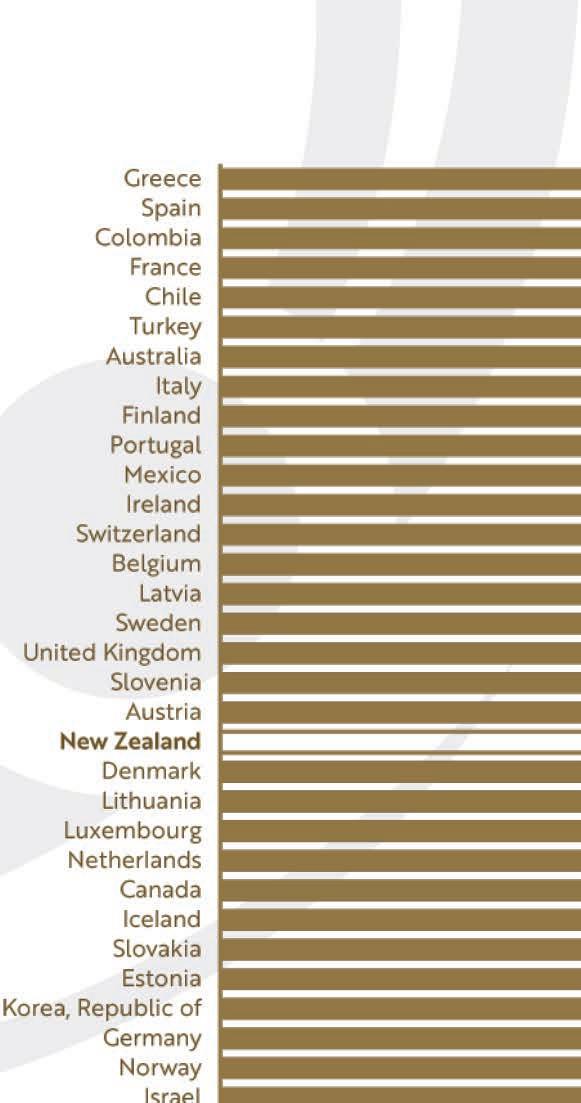
The ILO use a combination of observed and imputed data to estimate the underemployment rate in order to strengthen comparisons across countries and address issues which arise as a consequence of missing

Beyond COVID-19: the Māori Recovery Te Pūtea Whakatupu Trust

data from reporting countries (such as urban/rural coverage). For this reason, the results will not always match the nationally reported figures – particularly in such a volatile environment (e.g. New Zealand currently has underemployment at 4.6% (Statistics New Zealand, 2020j) but the ILO estimate has it at 8.1%). However, even if the figures themselves are debatable, this modelling is intended to make comparisons between countries generally more accurate. Based on the ILO estimates, New Zealand finds itself right in the middle of the OECD, performing better than the United Kingdom, Sweden and Australia.
While this result supports the notion that our low unemployment rate on its own does not tell the full story and that we have room to improve, we are still performing reasonably well when compared to countries we consider our peers.
But how have we performed over time in relation to others?
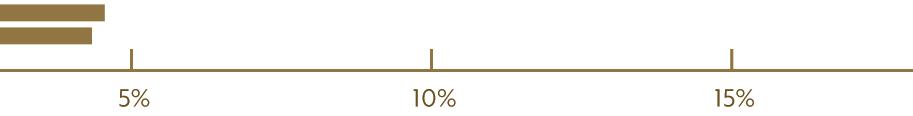
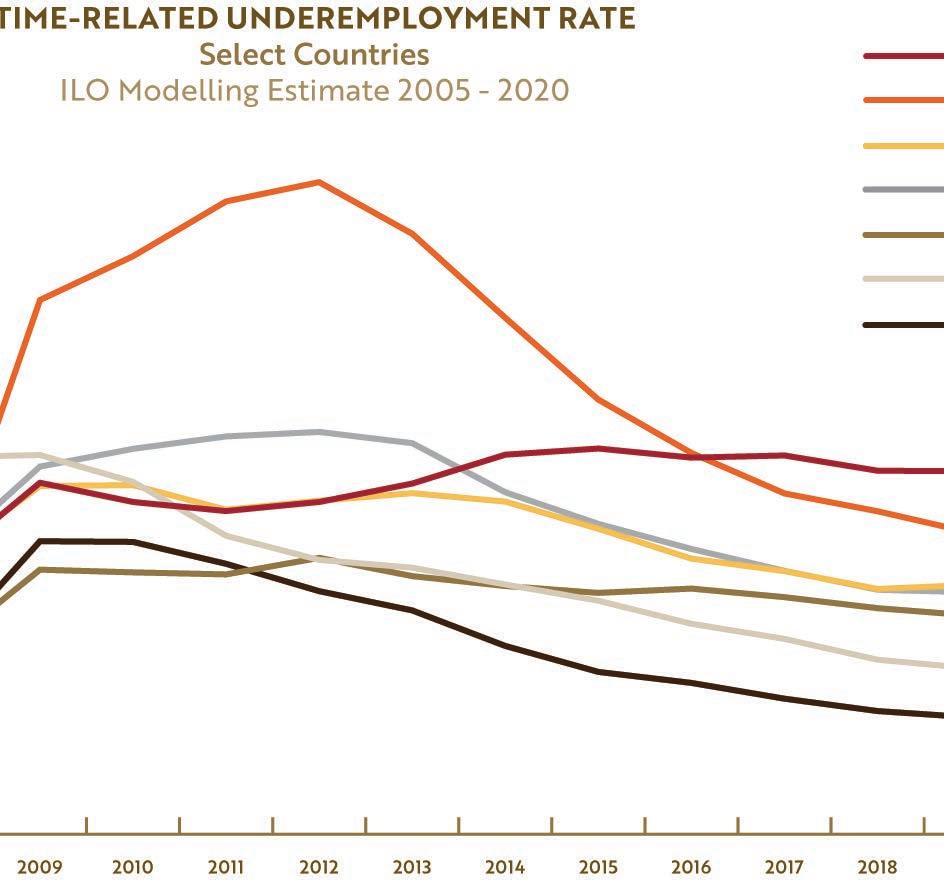
Figure 12: Time-related underemployment rate, select countries, ILO modelling estimate 2005 - 2020 Source: International Labour Organisation (2020c)
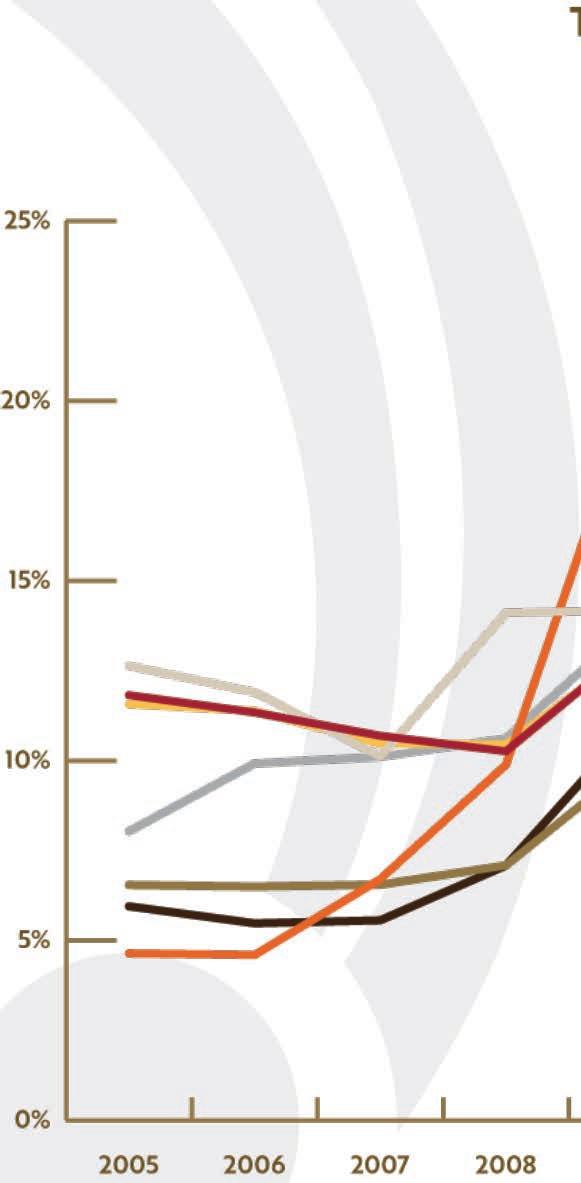
At first glance, New Zealand appears to be performing reasonably well with respect to underemployment – about middle of the road. The GFC clearly had an impact on all countries, with an observable increase in underemployment from 2007/8. However, there are a couple of points to note which indicate we could be doing better than we are.
Firstly, despite more than a decade of economic recovery and growth, our underemployment levels are not yet back to where they were prior to the start of the GFC. Only Australia and Ireland are in this position with us and, to be fair, Ireland has seen a heroic decline from a high in 2012. Germany, the United States, Sweden and the United Kingdom entered this pandemic period from a stronger position than they were in when the GFC hit. Meanwhile, Australia faced COVID-19 with an underemployment rate which was actually as bad/worse than it was immediately after the GFC.
The fact we are doing relatively well compared to others should not distract us from the fact that our modest post-GFC decline in underemployment should be a source of concern. Higher underemployment adds to family stress, prevents families from saving and building financial resilience to economic shocks like the one we are currently experiencing (Noble, Hurley, & Macklin, 2020) Other countries (even some of
Beyond COVID-19: the Māori Recovery Te Pūtea Whakatupu Trust

those which currently have higher rates than we do) have managed to significantly reduce underemployment. When (and if) we emerge into a post-COVID-19 world, conscious and deliberate efforts must be made to reduce our underemployment rate and, it seems, there are a number of countries which have lessons to offer us. How did they do it?
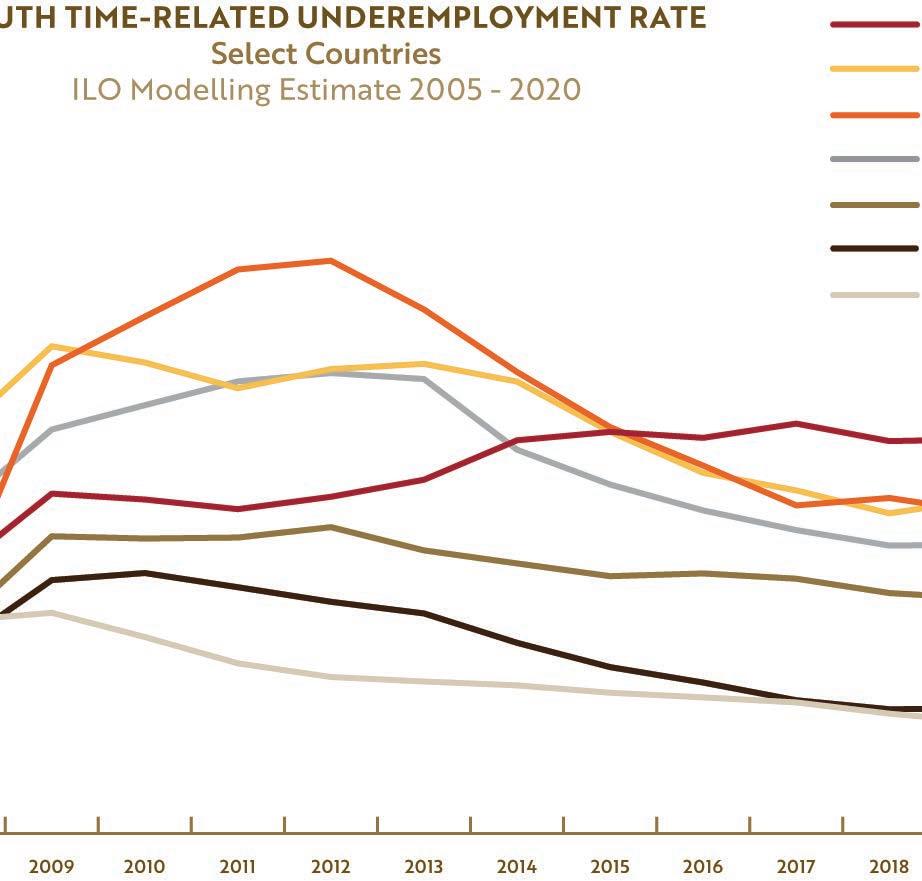
The answer may well be found in how many countries responded to youth underemployment. As shown in the graph below, the overall contours of countries’ youth underemployment performance is the same as for the countries as a whole, just at higher levels.
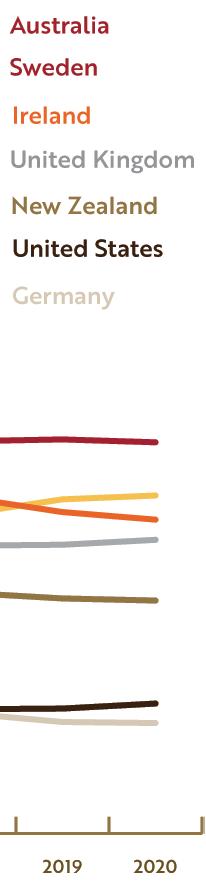
Figure 13: Youth time-related underemployment rate, select countries, ILO modelling estimate 2005 - 2020 Source: International Labour Organisation (2020c)
In response to high youth underemployment, from Japan to the Nordic economies, many countries took a conscious and deliberate approach to reducing youth underemployment, smoothing transition from education to employment. Noble et al. (2020) explain that countries including Germany, The Netherlands, Austria and Switzerland instituted a ‘dual system’ of education which combines on-the-job training with formal training.
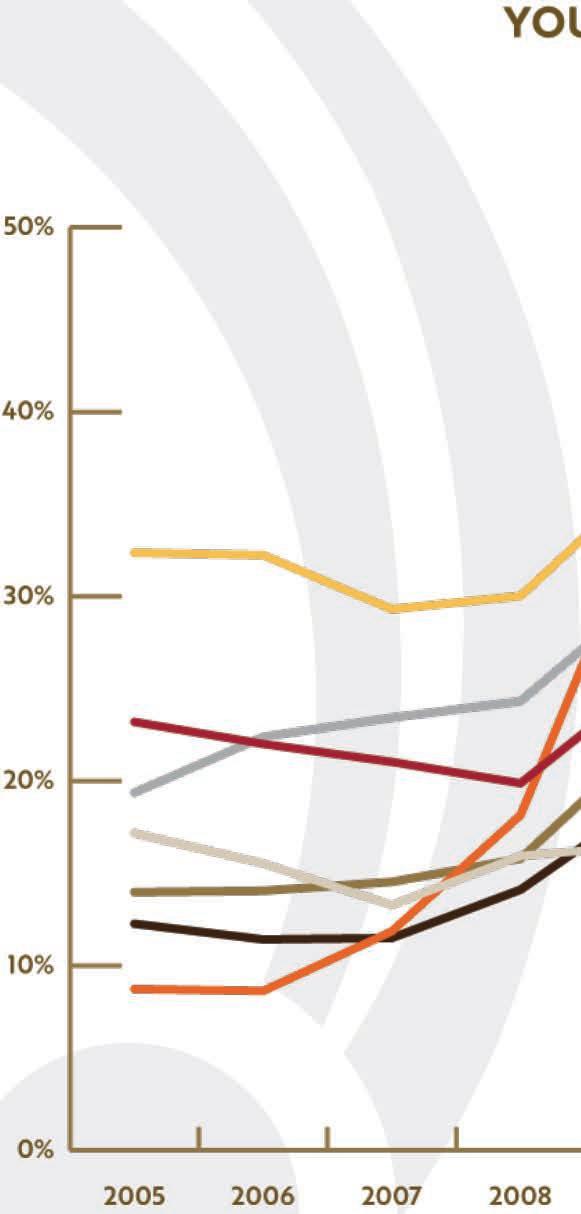
“Under these systems, high school students can apply to firms for temporary paid positions; once accepted, they split their time between work and mastering a curriculum that has been specifically designed with the input of employers to meet industry standards” (p. 10)
Very much like apprenticeships, Germany offers hundreds of learning pathways towards careers for which we have similar opportunities (e.g. automotive engineering) but also those for which we would typically see young people enrol at university (e.g. finance and computer science) (Noble, Hurley, & Macklin, 2020) Using this practical, earn-while-you-learn, work-based learning or learning-focused work approach has always had this potential for broad application. However, in New Zealand we have tended to direct this style of education towards the trades only and, in more recent times, with a huge emphasis on Māori and Pacific youth It may well be that our reduction in youth underemployment (however modest it may be) is
Beyond
as a consequence of programmes such as Māori and Pasifika Trades Training. This will be discussed further later in this document.
For now, underemployment information on BIPOC populations is difficult to find – particularly across multiple countries. However, the literature is clear that BIPOC are more likely to be employed in industries more susceptible to underemployment (e.g. retail, hospitality and accommodation) than nonBIPOC (Dinku, 2020). It is also worth noting that those countries which have successfully suppressed underemployment (with the exception of the United States) have greater homogeneity in their population (e.g. Switzerland, Austria, Germany, The Netherlands). Therefore, it is possible that any successful strategies they have employed will need considerable rework to be effective in an Aotearoa context.
A still broader look at performance in a labour force is underutilisation. This is a measure which includes the: ! unemployed; ! underemployed; and the ! potential workforce.
The potential workforce is also known as the “marginally attached workforce” and includes those people who are available but have not been actively seeking employment. In New Zealand we refer to these people as “available potential job-seekers” and, in other jurisdictions, they are known as “discouraged workers”. The other group included in the potential workforce are those who have not been available to work but intend to seek employment in the next month. In Aotearoa, we refer to this group as “unavailable job-seekers”.
The underutilisation rate represents the most all-encompassing view of unmet need for employment; those who are available to work but are unemployed no matter what the reason is and those who are not working as much as they would like. So, how does New Zealand compare?
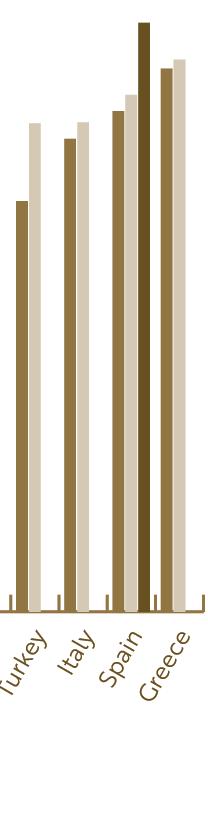
Figure 14: Underutilisation rate, OECD countries, Q4 2019 - Q2 2020
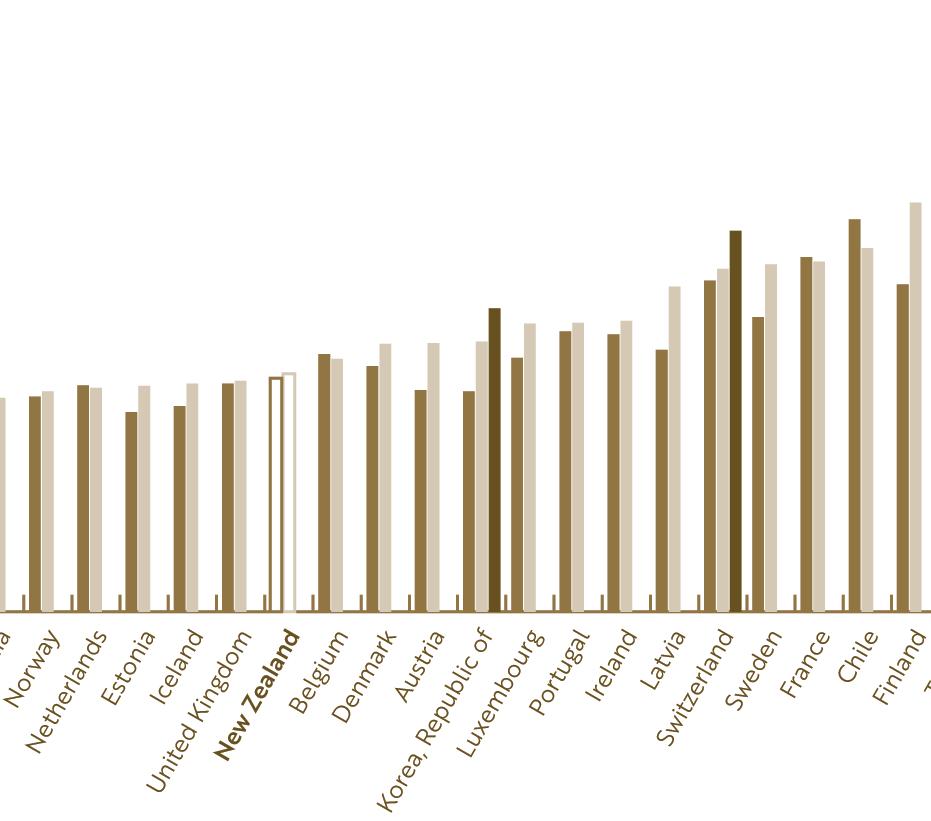
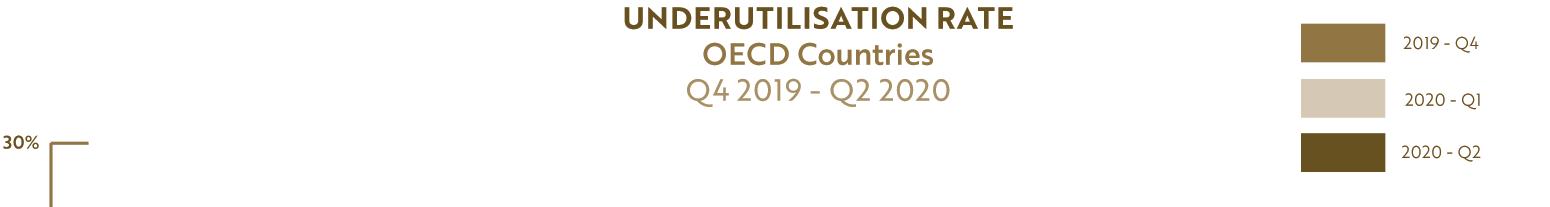
Source: International Labour Organisation (2020a)
Our first quarter underutilisation rate places us 13th out of the 30 countries for which the ILO has data, or slightly better than middle of the pack. However, assuming that no country worse off than us in the first quarter does better in the second, this placing is likely to improve. The reason is that the United States and Canada have seen a significant increase in underutilisation in the quarter to June and others may well follow.
This comparison is also useful as some of the domestic media commentary has been misleading. The quarterly increase in our underutilisation rate from 10.6% to 11.8% (Statistics New Zealand, 2020d) has been described by the Kiwibank Chief Economist as a “staggering increase” (Cook, 2020). Meanwhile, having peaked in April at a truly staggering 22.8% (U.S. Bureau of Labor Statistics, 2020c), the United States has seen a 12.4% increase for the same quarterly period to 18.3% It was also noted that our quarterly increase was the largest since 2004. It wasn’t. The article also omitted the fact that in the ten years to the end of 2018, there were only three quarterly periods which had underutilisation lower than the current rate of 11.8% - and for two of those quarters the rate was 11.7% (Statistics New Zealand, 2020d)
The upshot of all of this is that, despite the commentary, New Zealand’s underutilisation rate is not yet at a level which may be cause for alarm. We are performing well compared to others in terms of the absolute rate, the amount it increased between quarters and even as compared to historical levels here in New Zealand. That is not to say it cannot, or will not, get worse.
So, we know that New Zealand’s unemployment rate compares favourably with our peers and our underemployment and underutilisation rates are about middle of the pack. Still, it is necessary to dig in further to add further proof points to this generally positive story.
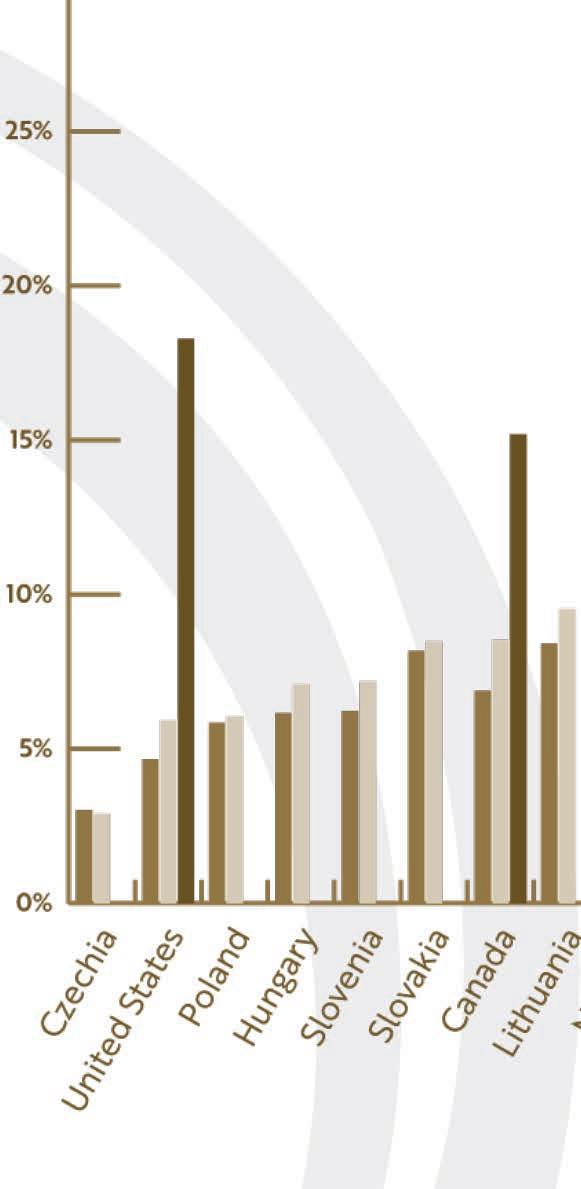
The employment rate is regarded as a strong indicator of a country’s ability to create employment and, for many, it can provide a better insight into the labour force than the unemployment rate. As with all other indicators, on its own, a high employment rate does not tell the full story. For example, a society may have a high employment rate but low earnings, poor work conditions and high underemployment. It is also possible that, in a setting where there are few high-quality education options, young people may elect to proceed straight to employment rather than pursue higher education (International Labour Organisation, 2020b). However, particularly given that this latter point is not applicable to New Zealand, comparisons of employment rates across similar countries is a useful exercise.
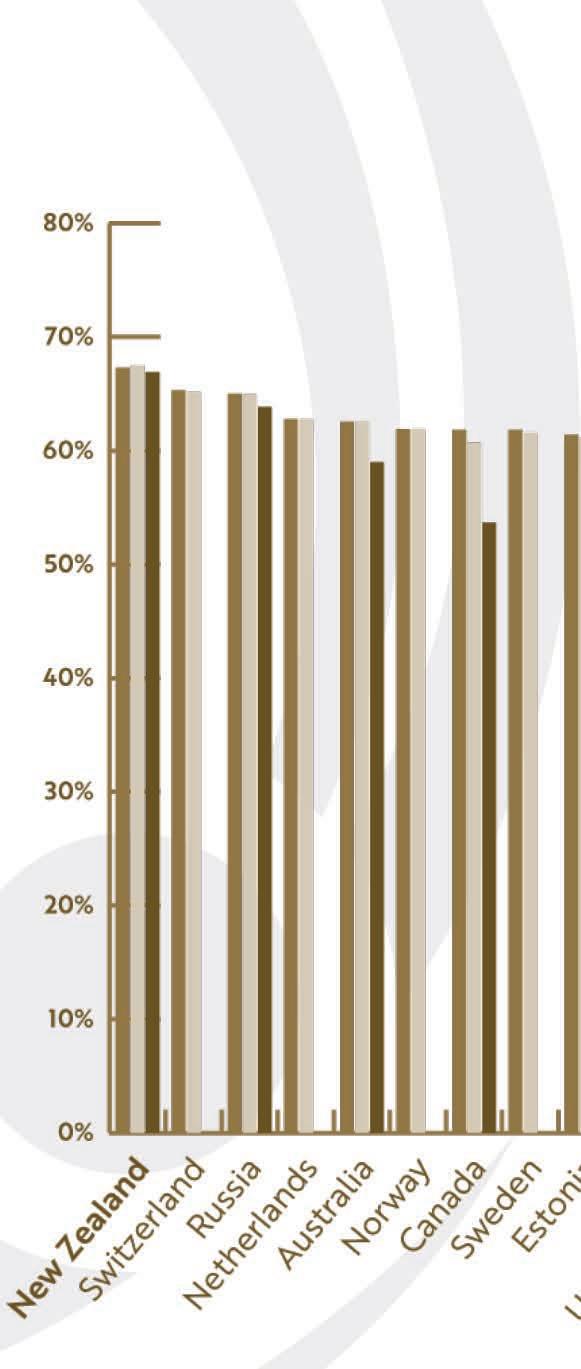
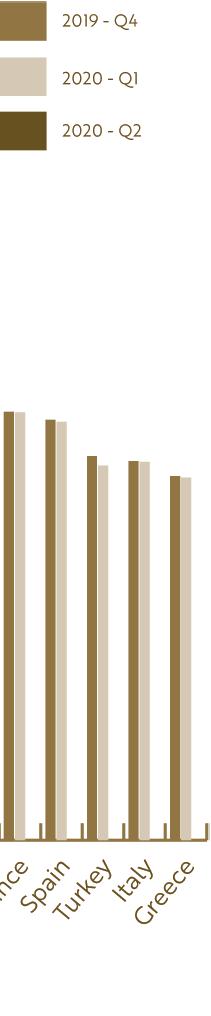
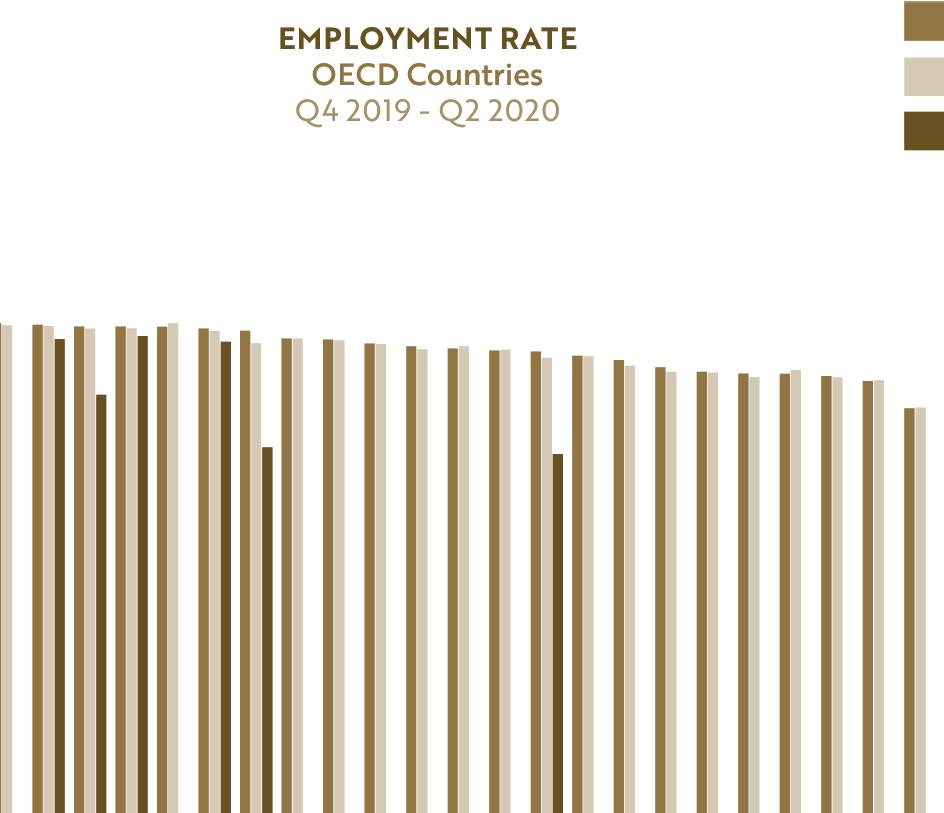
Figure 15: Employment rate, OECD countries, Q4 2019 - Q2 2020
Source: Organisation for Economic Co-operation and Development (2020f)
For those countries with employment rate data held by the OECD for the first and second quarters of 2020, New Zealand has the highest employment rate13
When examining the difference between Q1 and Q2, we also experienced the lowest drop in employment rate among countries for which data is available. The countries with the largest decreases include Canada, 13 Only Iceland and Germany are missing and only Iceland (population 364,000) had a higher employment rate at the end of 2019.
Beyond
the United States, Colombia and Chile. It remains to be seen how things will play out for the remaining 27 member states.
Taken together, having the highest employment rate and the lowest quarterly drop (so far) is an excellent result for Aotearoa and speaks to the comparative underlying health of our economy.
That being said, it is noteworthy that we saw any drop at all given our unemployment rate dropped in the same period. The shift of -0.6% is small but it means that the proportion of the working-age population who are employed has dropped slightly. That could be because the working-age population has grown and/or because the number of people employed in the labour force has dropped. In our case, it is both. Our working-age population grew by 0.5% and the number of people employed dropped by 1%.
It is in this detail that the value and wisdom of Statistics New Zealand’s decision to publish the extended unemployment rate of 4.6% (the standard being 4%) (Statistics New Zealand, 2020a). The effect of the 4.6% rate is to assume that more than two-thirds of the drop in the number of people employed between the first and second quarter is attributable to COVID-19. If all of the reduction was attributed to the pandemic (which is not realistic) it would still only give an unemployment rate of 4.9%.
The effect of this result is to strengthen the weight we can place on the unemployment rate (both standard and extended). The reason is that if a much larger increase in unemployment had been masked by large numbers of people exiting the labour force and, therefore, not being included as “unemployed”, that would be reflected in a larger decrease in the employment rate. Again, our quarterly decrease was the lowest of the countries for which the OECD has data.
In the context of a pandemic, though, low unemployment, reasonable underemployment and a high employment rate again only tell part of the story. There are a couple of extraordinary additional factors at play with the COVID-19 environment which make it unique.
First of all, as distinct from other crises (for example, a financial crisis), lockdown and social distancing measures employed in many countries (either as a requirement or a recommendation) have had an outsized impact on those in more vulnerable employment. Retail stores have been unable to trade, restaurants have struggled to cover their costs with socially distanced capacity arrangements, supply chains have been disrupted and people have been more careful with money. In New Zealand, as a result of border closures, jobs that relied on international tourism disappeared overnight. However, in many places around the world, retaining employment can be as problematic as losing it (van Dorn, Cooney, & Sabin, 2020; Dinku, 2020)
Those low-skilled workers who retained their jobs and kept working during various restriction levels were, by definition, “essential”. These people included supermarket and grocery staff, logistics workers, security personnel, public transport staff, cleaners, healthcare workers (including residential mental health and aged care staff), and so on.
Again, BIPOC workers around the world disproportionately find themselves employed in these roles and, as a consequence, are on the front lines and at elevated risk every day of contracting COVID-19 and spreading it to their families and communities (van Dorn, Cooney, & Sabin, 2020; Dinku, 2020; Coibion, Gorodnichenko, & Weber, 2020)
In discussing the disproportionate impact COVID-19 has had on communities of colour in the United States, van Dorn et al. (2020) state:
“These front-line workers, disproportionately black and brown, then are typically a part of residentially segregated communities… They don’t have that privilege of quote unquote ‘staying at home’” (p. 1243)
Beyond COVID-19: the Māori Recovery Te Pūtea Whakatupu Trust
When this is combined with the fact that Indigenous and minority communities experience higher prevalence of comorbidities known to exacerbate the illness associated with COVID-19 (such as diabetes, obesity and heart disease) (van Dorn, Cooney, & Sabin, 2020; Meneses-Navarro, et al., 2020), the magnitude of the risk contained in such an unbalanced workforce becomes clear. Indigenous and minority ethnicity women are at even greater risk (Wenham, Smith, & Morgan, 2020) Therefore, those “lucky” enough to retain employment in low-paid jobs are most at risk of exposure to the virus, most at risk of severe illness and death and most at risk of passing it on within their whānau and communities.
Of those who have retained employment, there is a group of people all over the world who have not felt the impacts to the same extent or who have had them mitigated: white-collar workers. For the most part, office-based jobs and those in service industries have been able to transition to telecommuting, with staff working from home and attending meetings virtually (van Dorn, Cooney, & Sabin, 2020). Even in ‘normal’ downturn circumstances, high-skilled jobs are less vulnerable to retrenchment and furlough. During this pandemic, though, there were many who simply started working from home without any disruption. While those who are parents have had the added challenge of attempting to manage children while also working, their income has been uninterrupted meaning they can continue to provide for their families while being protected from exposure to the virus Indigenous and minority ethnicities are underrepresented in these professions, which is likely to further exacerbate pre-existing inequalities.
The key insights and questions from this analysis of what is transpiring around the world include:
1. New Zealand’s “go hard, go early” Alert Level 4 response was the most stringent in the OECD but the “short and sharp” nature of it meant that, over a five-month period, New Zealand had less stringent measures in place, for more days, than any other country in the OECD;
2. Indigenous peoples around the world are responding to protect their people – disseminating information, restricting movement, sharing resources, using technology to retain whānau connection, leading responses ahead of government interventions and partnering with government in the interests of a sustainable, effective response;
3. Our response seems to have allowed Aotearoa’s economy to remain (so far) somewhat buoyant compared to others;
4. Despite the pandemic and the lockdowns, New Zealand’s labour force is, at this stage, in good health as compared to others in the OECD;
5. But Indigenous peoples are more at risk of severe illness and death from the disease, more at risk of being in insecure employment and those who remain employed are at greater risk of exposure and passing it on to their families and communities.


Beyond COVID-19: the Māori Recovery Te Pūtea Whakatupu Trust
It is clear that, when situated in the context of what is transpiring around the world, Aotearoa is doing well. Our health outcomes and, so far, our economic performance as measured by labour force and macroeconomic indicators fall somewhere between outstanding (e.g. mortality rate, employment rate) and slightly better than average (e.g. underemployment rate). At a national level, we have every reason to have confidence that we are on the right track.
At the same time, the global analysis also reinforced the need to explore a subject from more than one angle. An unemployment rate in isolation can provide a false sense of security. The fact New Zealand locked down hard and early could leave the impression that we have lived with more restrictions than anybody else over the period as a whole. So, too, international comparisons only tell part of the story. It is important that, in addition to those comparisons, we look at ourselves in relation to ourselves and to our own past.
While the COVID-19 pandemic represents the most significant threat to global health and economic wellbeing in a century, it is easy to narrow the focus onto the virus itself – in terms of the time it has been with us, government responses and its impact on our lives. Those impacts include higher unemployment, increased risk in health settings, growing reliance on State support, reduced access to services and negative education outcomes. These are not new phenomena. Māori have lived with them for generations. The only difference is that they are now being discussed more frequently and the tone of the discourse has shifted or, perhaps more accurately, it has been segmented.
An example of this segmentation is the phrase which has been used repeatedly to refer to those who have found themselves unemployed as a result of the pandemic. They are deemed to be unemployed “through no fault of their own”. The implication, of course, is that those who are without a job for another reason are, somehow, at fault. The reality is that life can serve all sorts of unexpected circumstances which lead to job-losses but, for now, the narrative of the deserving/undeserving poor/unemployed is being perpetuated by our political leaders and the media.
Given how familiar Māori are with all the negative impacts of COVID-19, another view is that this is just another social and economic contagion like a GFC, stock market crash or housing crisis – it just happens to be the COVID-19 strain. This is helpful when thinking about the future and how we might respond.
The Spanish Flu was brutal in its assault on iwi Māori in 1918, targeting our young men in particular. The Māori death rate was at least seven times higher than those for Pākehā, with 1200 of our people dying in one three-month period from a total of more than 2160 Māori deaths This total is likely to be an underestimate because of undocumented Māori deaths (Summers, Baker & Wilson as cited in Power, et al., 2020) During the 2009 H1N1 pandemic, Māori were nearly three-times as likely to die than Pākehā (Charania & Turner, 2018; Wilson, Telfar-Barnard, Summers, Shanks, & Baker, 2012; Christchurch City Libraries, n.d.)
To put these pandemics in perspective, the estimated death toll from Spanish Flu is at between 17m – 50m people worldwide. In that case, though, it is important to note that most of the deaths were not caused by the virus itself, but by secondary bacterial pneumonia as antibiotics were not available at the time (Charania & Turner, 2018). In the case of the 2009 H1N1 pandemic, confirmed-case fatalities were reported as over 18,449 (World Health Organisation, 2010) across 214 countries. However, Charania and Turner (2018) note that the true figure is likely to be closer to 300,000.
Beyond COVID-19: the Māori Recovery Te Pūtea Whakatupu Trust
Assuming the current daily mortality rate does not decline, COVID-19 will reach 1,000,000 confirmed-case fatalities by late September 2020 and 1,600,000 by the end of the year14 However, there are signs that this is an underestimation of deaths caused by COVID-19. An analysis of all-cause excess mortality figures (the difference between expected deaths based on historical averages and actual deaths), some countries have had a significant increase in 2020. For example, by the end of May, the United Kingdom had recorded 37,385 deaths from COVID-19 but all-cause excess deaths (above the historical average) of 66,745 (New York Times, 2020a). As at the time of writing, the United States has recorded 191,058 COVID-19 deaths (Worldometer, 2020a) while the number of deaths (for any reason) is, so far, 253,841 above the historical average (Centers for Disease Control & Prevention, 2020)
It seems that more time will need to pass before a true picture of the COVID-19 cost in human lives becomes clear. What is clear is that, consistent with previous pandemics, Māori and Pacific peoples are particularly at risk.
In April, with COVID-19 a very real threat and the country in the midst of lockdown at Level 4, a group of expert modellers used data from around the world to understand the potential impact of the virus on iwi Māori and Pacific peoples (Steyn, et al., 2020) by determining the likely Infection Fatality Ratios (IFRs) Their findings are sobering.
“If age is the dominant factor determining IFR, estimated IFR for Māori is around 50% higher than non-Māori.
If underlying health conditions are more important than age per se, then estimated IFR for Māori is more than 2.5 times that of New Zealand European, and estimated IFR for Pasi fika is almost double that of New Zealand European.
IFRs for Māori and Pasifika are likely to be increased above these estimates by racism within the healthcare system and other inequities not reflected in official data.” (p. 1)
This is consistent with other models which have included estimated mortality rates for Māori at twice that of non-Māori (Newton as cited in McMeeking & Savage, 2020)
At a time when we have a very low case rate and the lowest deaths per million of population in the OECD (Our World in Data, 2020), it is challenging to imagine a world where these estimates become real. What would having an Infection Fatality Ratio more than twice Pākehā actually mean?
One way of visualising this is through modelling what it would look like for New Zealand to achieve herd immunity through infection (rather than a vaccine). Using Steyn et al.’s (2020) model, the figure below shows an estimated number of deaths from COVID-19 which would be caused on our way towards infection-based herd immunity
Note & Disclaimer: The scenario that follows is not advocating for herd immunity. It is not clear that such a thing is even possible and no major political party in Aotearoa is considering a herd immunity response to the virus The scenario is presented to illustrate the real-life meaning of statements regarding the likely higher Infection Fatality Ratio of Māori compared to Pākehā – moving it from the abstract to what it could mean in terms of actual deaths. Furthermore, while due care has been exercised in the calculations, the author is not an epidemiologist and does not claim that expertise. However, in the absence of an illustrative scenario relevant to Māori being available from expert sources, this is offered as an honest effort to provide an approximate one with full transparency on each calculation made The detailed working can be found in Appendix A 14 This also assumes that testing rates do not decline as these deaths are confirmed cases.
Beyond COVID-19: the Māori Recovery Te Pūtea Whakatupu Trust
In order to produce the graph, Statistics New Zealand’s population estimates were used for ethnicities, broken down by age group. Then, using an immunity threshold of 46%15 to obtain the number of people who would need to be infected and recover to achieve herd immunity, the Infection Fatality Ratios from Steyn, et. al. (2020) were applied to obtain the number of infections and deaths that would be involved with achieving that 46% coverage.
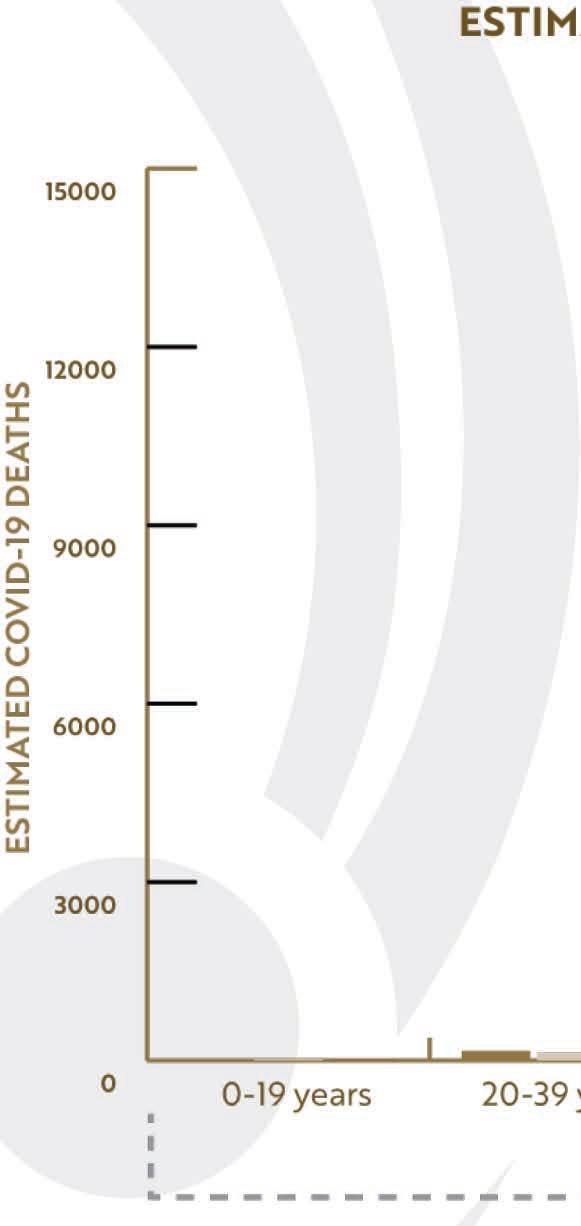
The two scenarios are:
1. Infection Fatality Ratios for different age groups for each ethnicity
If age proves to be the primary factor, these ratios are likely to be more accurate.
2. Infection Fatality Ratios for each ethnicity based on comorbidity rates
If the age effect observed in mortality is driven by increased comorbidity with age, these ratios are likely to be more accurate.
Figure 16: Estimated COVID-19 deaths to achieve herd immunity by scenario, age-group and ethnicity
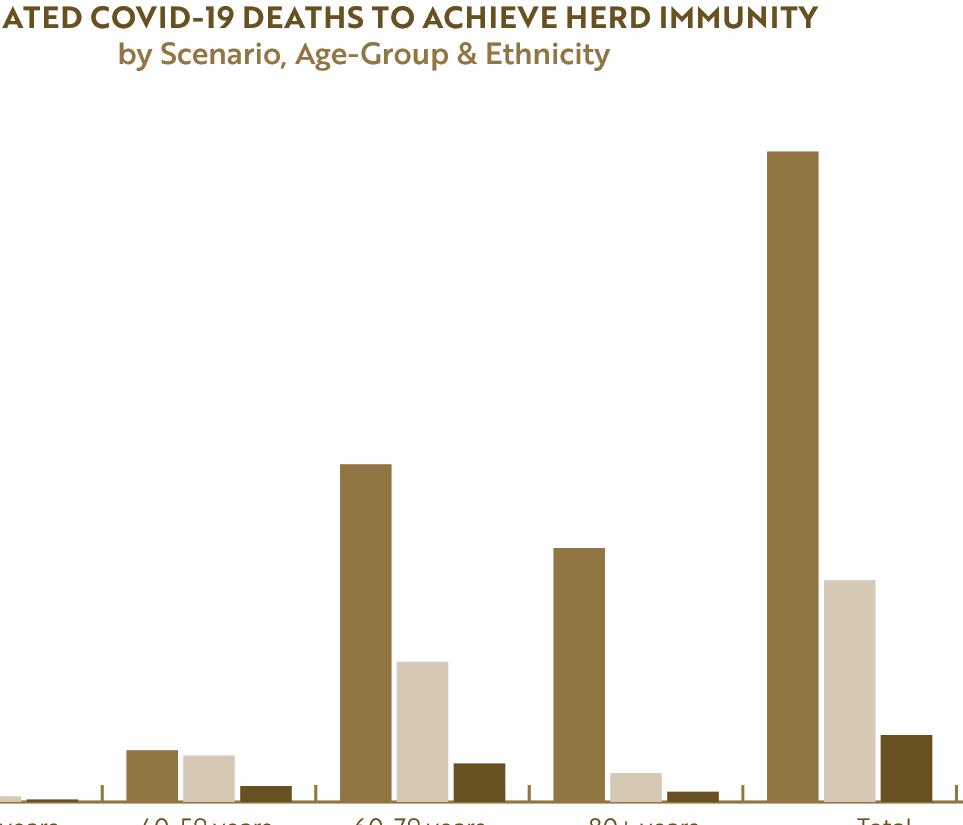
Sources: Steyn, et al. (2020); Binny, et al. (2020); Randolph & Barreiro (2020); Statistics New Zealand (2020i); Statistics New Zealand (2020h)
In total, New Zealand could expect to lose in the region of 19,000 – 21,000 people. Māori make up 16.5% (Statistics New Zealand, 2019) of the population but could be expected to make up 24% - 31% of the losses, estimated at with approximately 4,900 - 6,400 deaths. The detailed method for making these calculations can be found in Appendix A
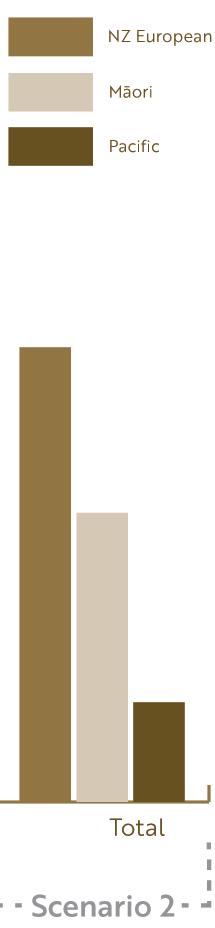
15 A herd immunity threshold of 46% was used based on an pre-Level-4-lockdown estimated effective reproduction number (Rt) of 1.8 (Binny, et al., 2020; Kwok, Lai, Wei, Wong, & Tang, 2020). This threshold of 46% is lower than what was believed necessary earlier in the pandemic as, at that stage, the estimate of the New Zealand reproduction number was approximately 2.5. That would have required a herd immunity threshold of 60% (Ministry of Health, 2020, p. 7)
Beyond COVID-19: the Māori Recovery Te Pūtea Whakatupu Trust
As bad as it sounds, the cost of achieving herd immunity by infection (and it is not even clear immunity is always achievable this way or for how long immunity might last (Seow, et al., 2020)) is not just measured in death but in the health and lost productivity costs associated with those who develop long-term issues caused by the illness. The literature on those longer-term issues is scarce at the present time but there are reports of an unusual number of otherwise-healthy young people having strokes (Rabin, 2020) and experiencing headaches and trouble breathing months after first contracting COVID-19 (Ducharme, 2020)
Steyn et al. (2020) also note that, in the case of an uncontained outbreak, the incidence of COVID-19 is likely to be higher among Māori and Pacific communities as over-crowded housing and intergenerational living arrangements would exacerbate spread The Ministry of Social Development (2016) notes that household crowding is estimated to be responsible for 17% of Māori hospital admissions for infectious diseases.
This “residential segregation” (van Dorn, Cooney, & Sabin, 2020)has come up recently with the August reemergence of COVID-19. Media reports identified the ethnicity and location of the first family to contract the virus – Pacific Islanders from South Auckland. The reason given for identifying them in this way was that the Pacific community is close-knit and, the logic goes, the virus was more likely to spread more rapidly within it and they should be aware of the need to exercise extra precautions. However, it has also become fuel for racist abuse and false allegations of quarantine breaches (Pickering-Martin, 2020)
To date, during this August resurgence, Māori and Pacific peoples comprise most of the 175,000 COVID-19 tests completed and the community attribute this to community leadership, rather than media awarenessraising or efforts from the Ministry of health.
“the high rates of testing amongst Māori and Pacific people wasn’t because of the efforts of health authorities. It came down to the pastors, matai, iwi leaders, kaumatua and health providers on the ground rallying their communities to be tested.
‘The reality is there is no way the ministers or people at the Beehive would have access to the kinds of people we know and have the networks we do,’ says [Ōtara Health chief executive Sosefina] Paletaoga” (Parahi, 2020a)
As at the time of the writing, the 159 cases in the Auckland August cluster include 34 Māori (21%) and 93 Pacific people (62%) (Ministry of Health, 2020) This is the situation just five and a half weeks on from the earliest-reported symptom-onset (31 July 2020) and is a good indicator of how quickly COVID-19 could spread within Māori and Pacific communities without active measures in place to prevent it.
Beyond COVID-19: the Māori Recovery Te Pūtea Whakatupu Trust
When looked at overall, New Zealand’s unemployment rate was around 4% at the beginning of the Global Financial Crisis. It then rose to approximately 6% and has been trending down since its peak in 2012 and is now, once again, around 4%.
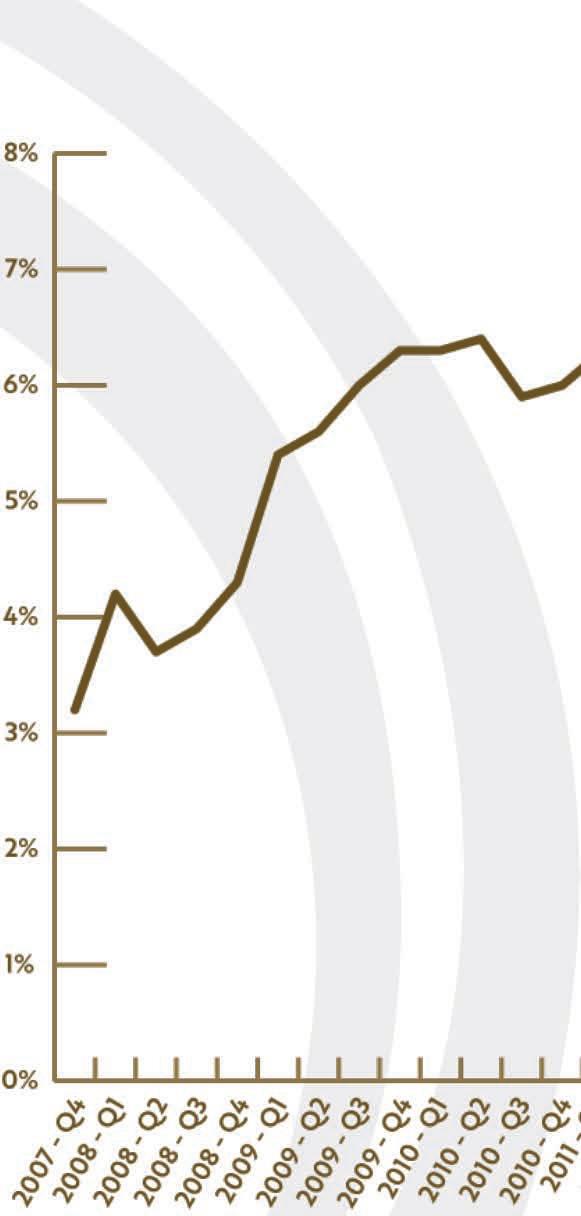
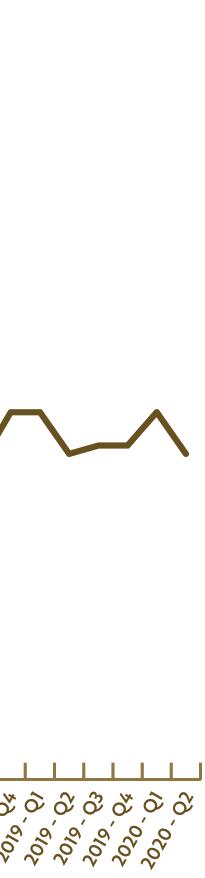
Figure 17: Quarterly employment in NZ, Q4 2007 - Q2 2020 Source: Statistics New Zealand (2020c)
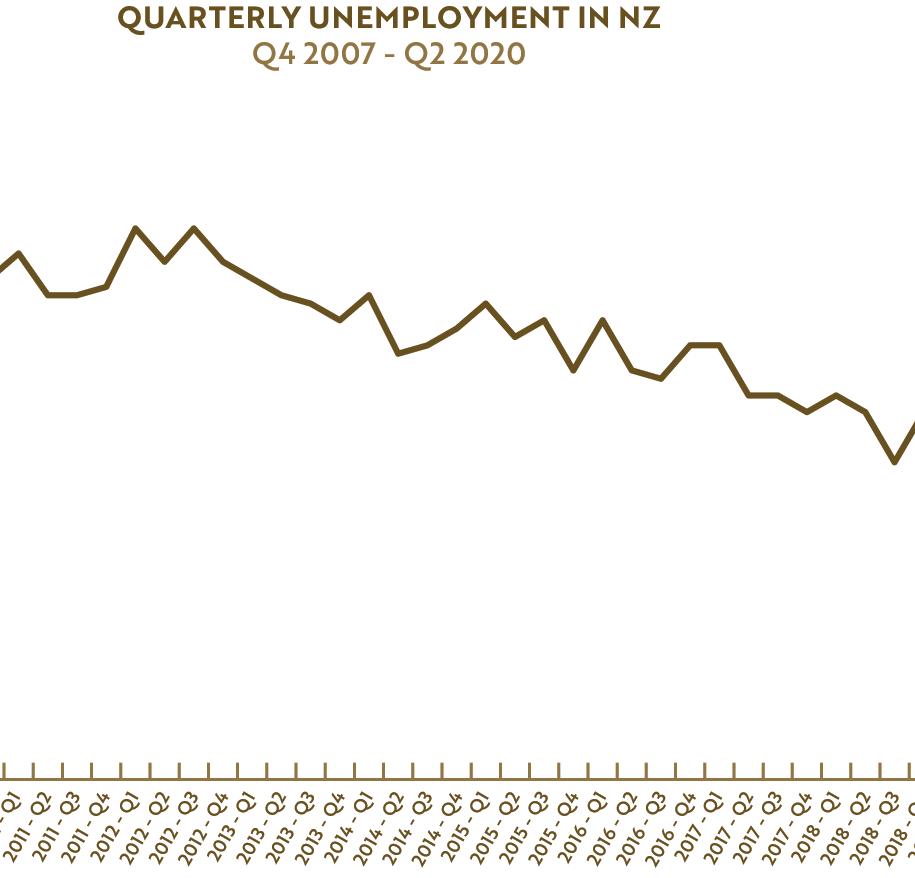
On its own, and in comparison to other countries, this suggests that New Zealand has performed relatively well.
However, scratch the surface and another story emerges. It is one of how the bounty of prosperous times is unequally shared and that some groups are asked to shoulder the bulk of the costs that times of scarcity bring.
Beyond COVID-19: the Māori Recovery Te Pūtea Whakatupu Trust
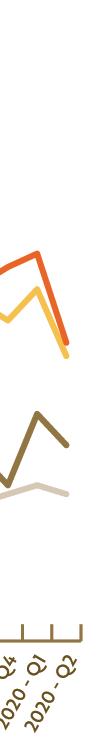
Figure 18: Quarterly unemployment in NZ by Ethnicity, Q4 2007 - Q2 2020
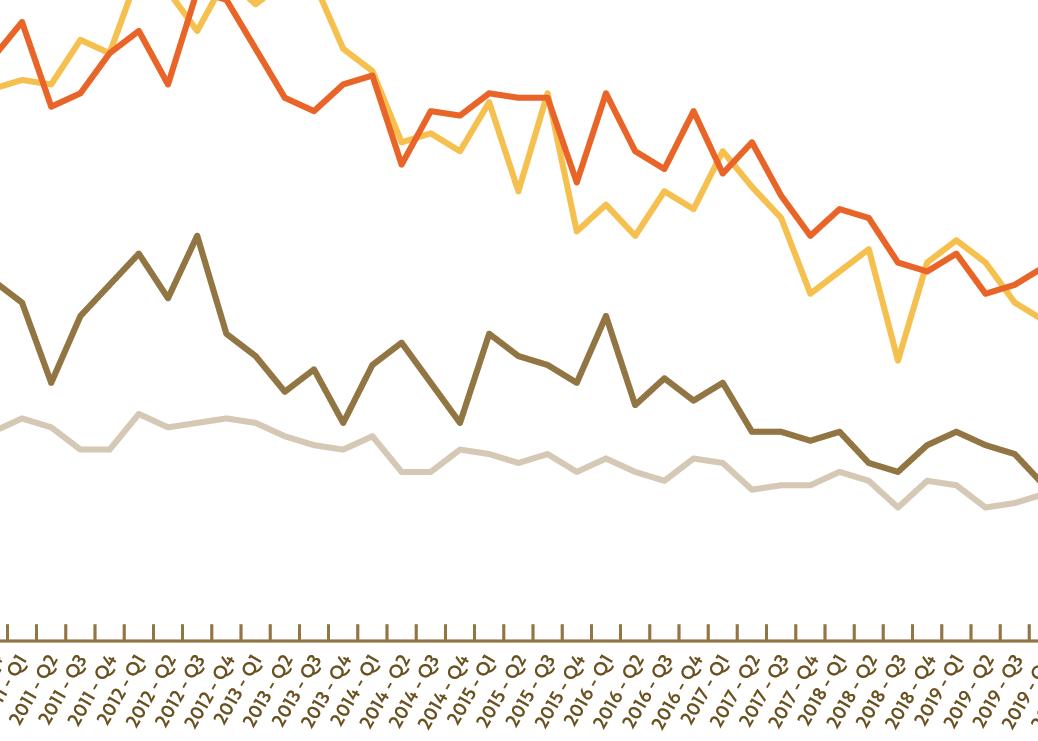
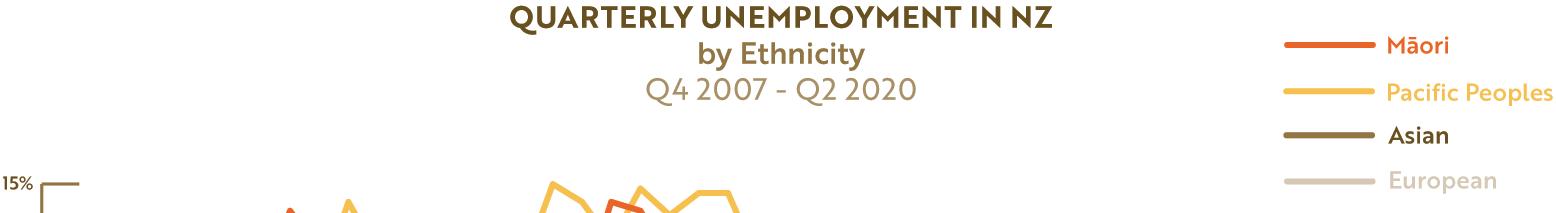
Source: Statistics New Zealand (2020f)
At the time European unemployment hit its peak in the first quarter of 2012 at 5.1%, Asian unemployment was at 8.7%, Māori unemployment was at 13.7% and Pacific unemployment was at 15%. Strangely, in the midst of a worldwide pandemic, the gap between Māori and Pākehā unemployment has never been smaller and the Māori unemployment rate is at its lowest level for the period. However, the GFC has some lessons for us about what might be coming, just how bad things can get and how long it can take to recover. It is only in the last year or so that Māori unemployment returned to pre-GFC levels. More than a decade has been spent fighting our way back to being unemployed at twice the rate of Pākehā, rather than three times.
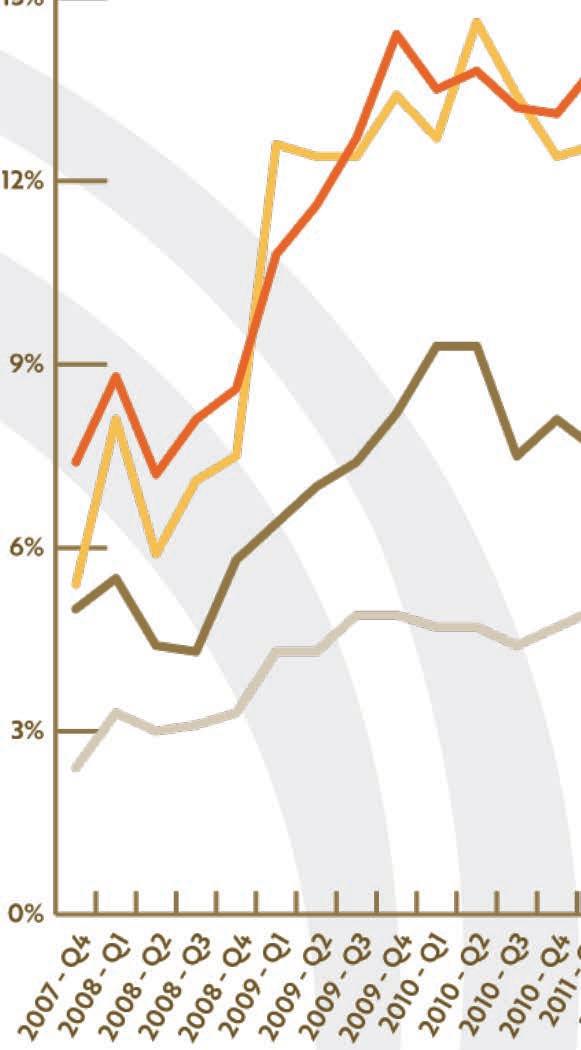
Although we are six months or more into this pandemic, the economic impacts are yet to fully manifest themselves in the data. The Wage Subsidy and Extension appear to have been successful in achieving their primary objective: keeping employees connected to their place of employment. It is interesting to note, though, that until this resurgence there was an underspend on the Wage Subsidy Extension (New Zealand Government, 2020), which may indicate that the economic recovery after the lockdown was enough to keep businesses afloat.
Beyond COVID-19: the Māori Recovery Te Pūtea Whakatupu Trust
Figure 19: Quarterly youth unemployment in NZ by Māori/European, Q4 2007 - Q2 2020 Source: Statistics New Zealand (2020f)
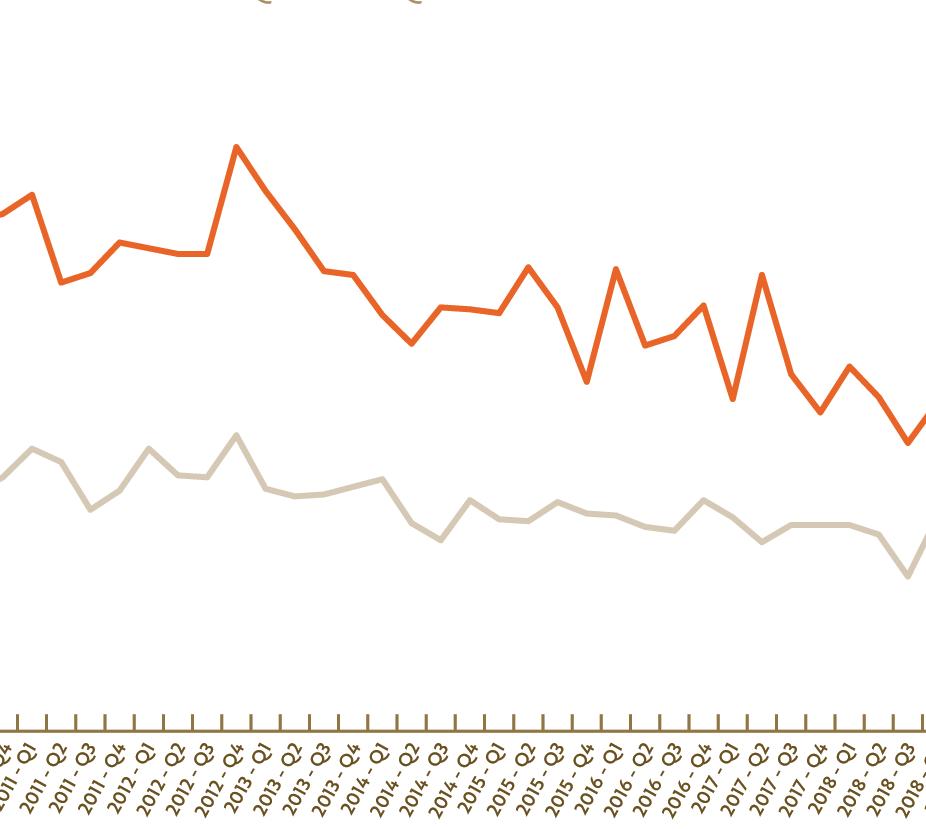
The rangatahi Māori unemployment rate is at an historic low. However, the historic highs of the GFC are still fresh in the memories of many leaders as they turn their minds to what an environment of employment scarcity will mean for our rangatahi They are considering what might be done to ameliorate the situation in the short-term while advancing a longer-term strategy to bolster Māori economic resilience.
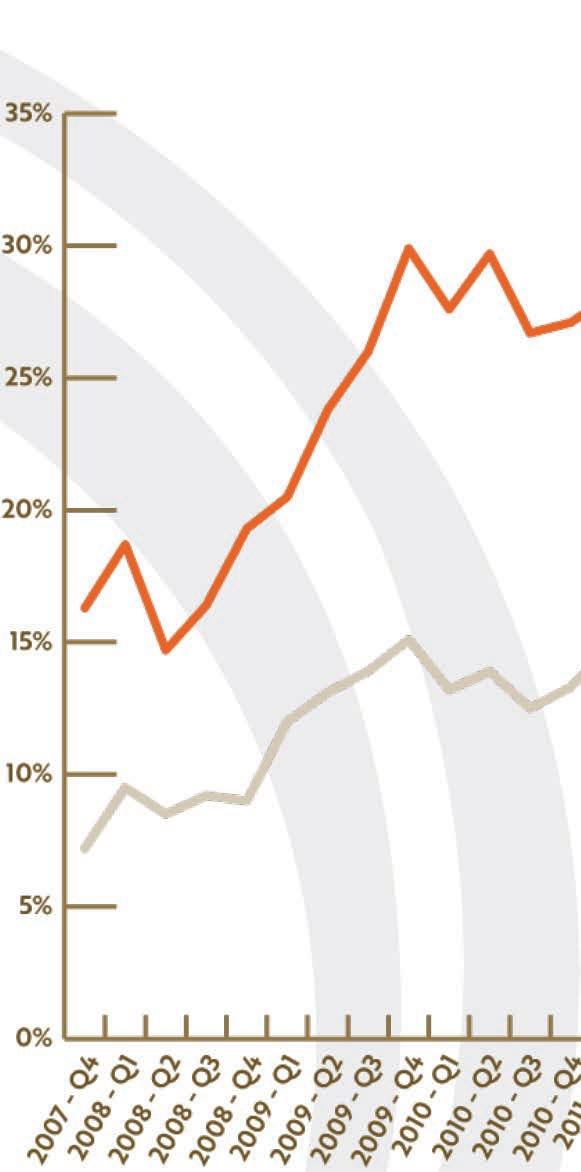
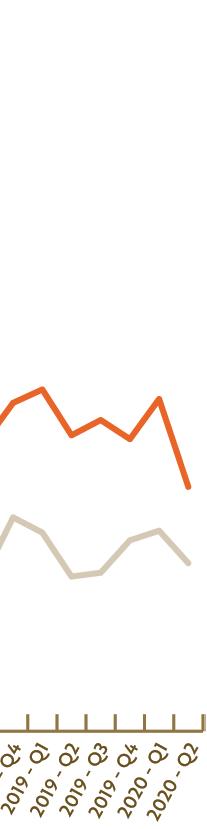
Beyond COVID-19: the Māori Recovery
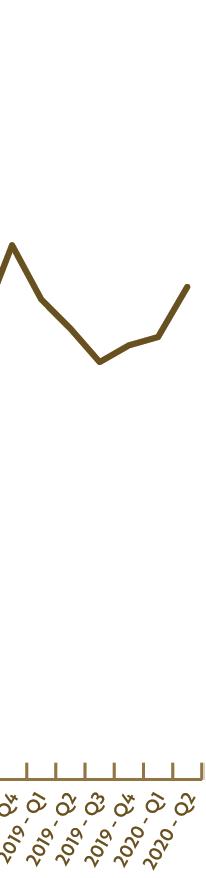
Te Pūtea Whakatupu Trust
The limitations or definitional considerations related to the unemployment rate mean that – as we did globally – it is also worthwhile to look at the broader measure of underutilisation. This includes the: ! unemployed; ! underemployed; and ! potential labour force (including those not available but not looking for work). The underutilisation rate is the most all-encompassing measure of unmet employment need.
Figure 20: Quarterly underutilisation in NZ, Q4 2007 - Q2 2020
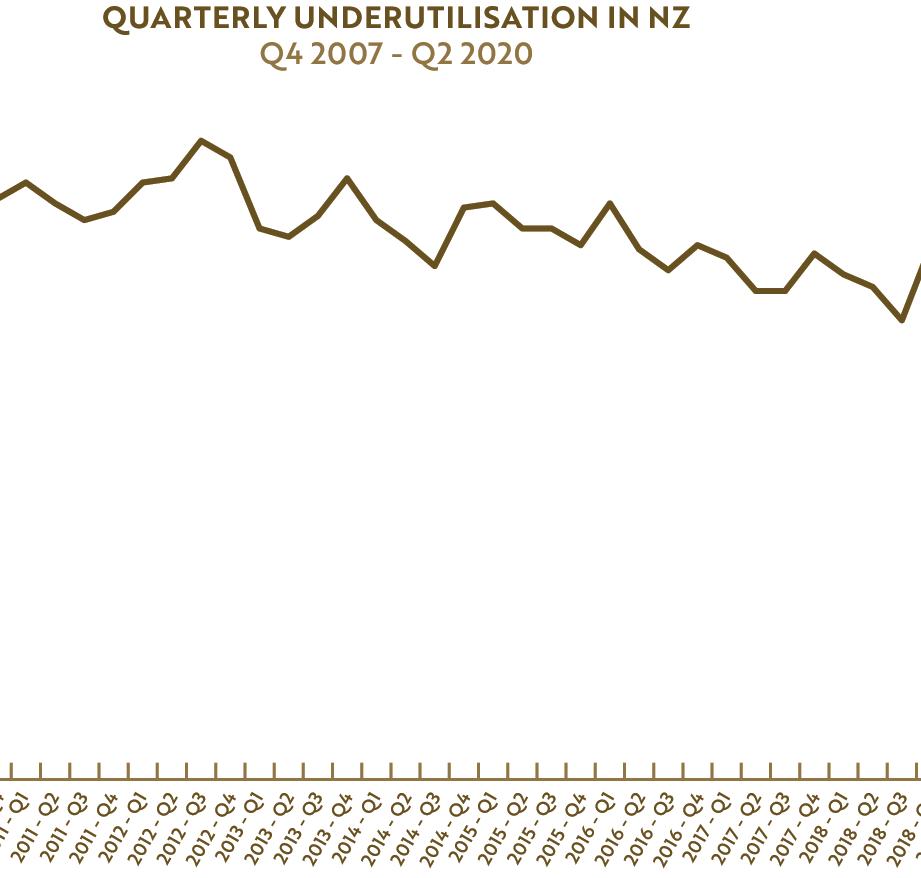
Source: Statistics New Zealand (Statistics New Zealand, 2020k)
In contrast to the unemployment rate, it is true that underutilisation has risen this year and a 1.2% quarterly increase is not insignificant. However, while the rate may continue to grow, for now, it is useful to keep it in perspective. We spent a decade at a higher underutilisation rate than what we currently have.
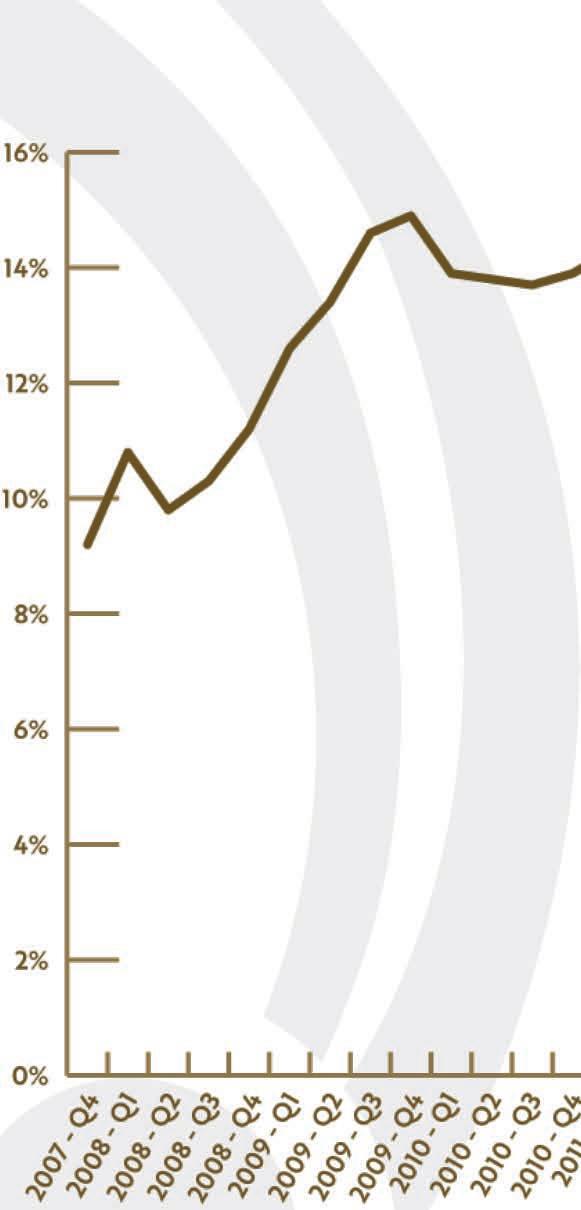
Figure 21: Quarterly underutilisation in NZ by Ethnicity, Q4 2007 - Q2 2020
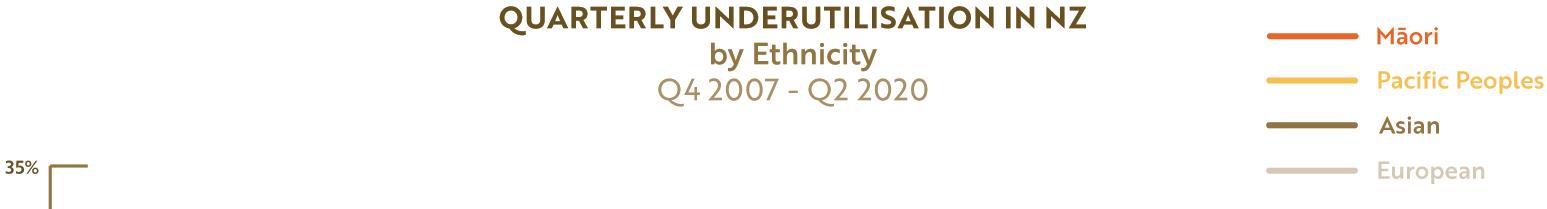
Source: Statistics New Zealand (2020k)
Breaking things down by Ethnicity, the underutilisation rate follows basically the same contours as the unemployment rate and (aside from the obvious ethnicity gap) supports the conclusion that the current situation is not as bad as much of the commentary might suggest (e.g. Cook, 2020). This is not to say it will not get worse, just that it is not that bad right now. Aside from two quarters last year, the last time Māori underutilisation was this low was in 2008.
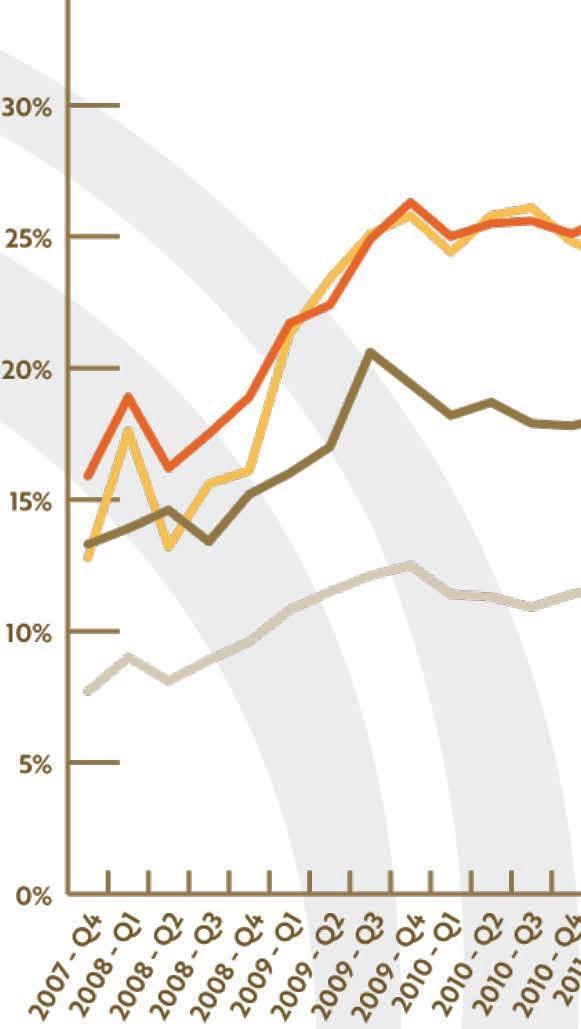
While recognising the suppression effects of the Wage Subsidy and Extension, upon reviewing all of these figures, it has been difficult to understand why the discourse and media narrative seems to be so negative. It is an election year, but it feels like more than partisan hackery. One possibility lies in the most recent data points – and there are only a couple. Between the end of last year and the second quarter of 2020, something very rare happened and did so at an unprecedented scale: Māori and Pacific underutilisation actually dropped while Pākehā (and Asian) underutilisation rose. Almost always, underutilisation rates move in lock-step. When they don’t, more frequently, Pākehā underutilisation will drop while Māori and Pacific underutilisation will rise. Usually, though, they move in the same direction
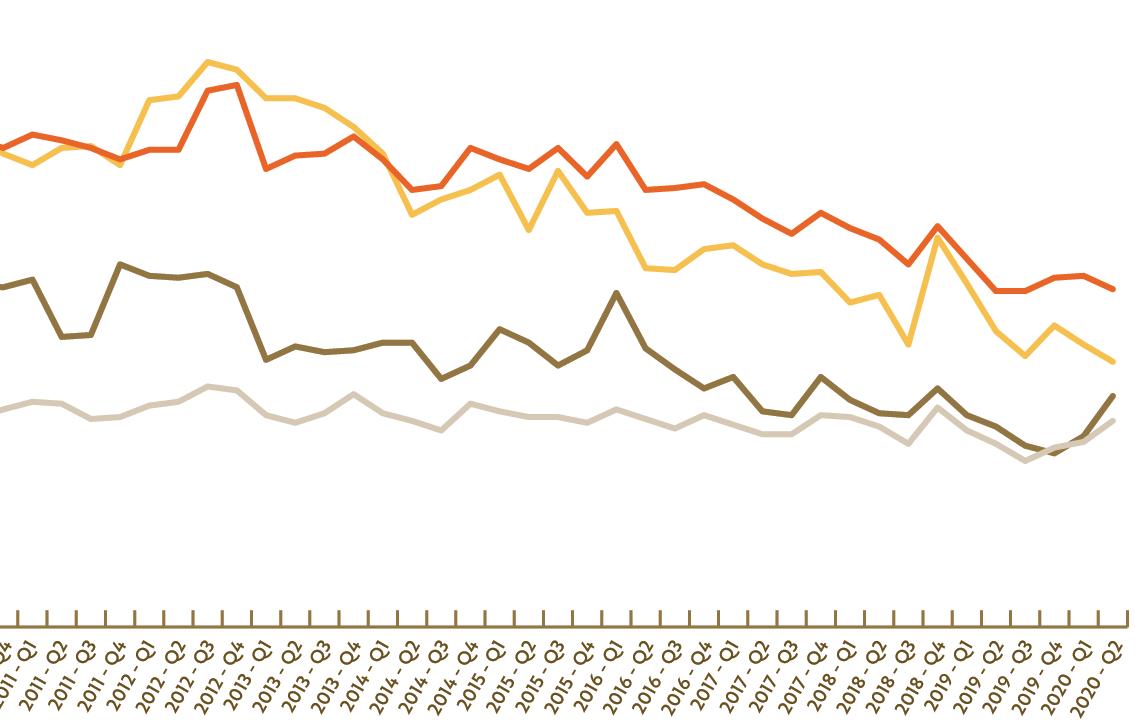
What does this mean? In Q1 2019 and Q2 2020, the total number of underutilised persons (unemployed, underemployed and potential workforce) had the following movements with reference to Q4 2019 by Ethnicity:
! Māori reduced by 500 people;
! Pacific reduced by 4,900 people
! Asian increased by 24,300 people
! European increased 61,900 people (Statistics New Zealand, 2020k)
Quarterly shifts in underutilisation are routine. Pākehā underutilisation usually increases in the fourth quarter and decreases in the first and second each year. An exception to this was Q1 and Q2 2009,
Beyond COVID-19: the Māori Recovery Te Pūtea Whakatupu Trust
following the GFC, which saw Pākehā underutilisation grow by 45,900. For Pākehā underutilisation to have grown by 35% more in the first two quarters of this year may be a signal of how serious the future impacts of this pandemic could be
All of the forecasts, the literature regarding social and economic downturns and, indeed, common sense have indicated that low-skilled, casual, low-paid employment suffer the greatest job-losses at times like these. We also know that Māori and Pacific are disproportionately over-represented in these groups. Therefore, the underutilisation movements over the last couple of quarters are a surprise
The question from here is will underutilisation continue to grow? Are the underutilisation increases we are seeing for Pākehā a lead indicator of what is to come for Māori?
While rangatahi Māori employment is currently at a record low (Statistics New Zealand, 2020f), it is unlikely that this will continue. The employment market as a whole is forecast to contract and skills will be crucial (Olsen, 2020)
In their report Ka whati te tai: a generation disrupted, Shulze and Hurren (2020) note that approximately 70,000 rangatahi will be leaving formal secondary education as the economy grapples with the fallout from COVID-19. Entry-level jobs in typical sectors such as retail, hospitality and tourism are unlikely to be available in the numbers they were. Further education is one possible alternative but it is an expensive investment to make (in terms of fees, cost of living and the opportunity cost) for an uncertain return from an uncertain employment market.
The problems for Māori begin long beforeentry to the job market and the performance of the education system in this regard is well established. Even prior to COVID-19, emerging challenges such as the employment threat posed by increasing automation had underlined the need for new thinking regarding education and, more broadly, skills development (AlphaBeta Strategy & Economics, 2017). Within that, there has been long-standing recognition of Māori educational underachievement or, perhaps more accurately, poor service from the education system. On average, Māori leave school sooner and leave with less (Reid, Schulze, Green, Groom, & Dixon, 2020; Ministry of Education, 2020). COVID-19 has simply accentuated the pain of a pre-existing condition.
Universities New Zealand (2018) explored some of the main disparities in their paper Achieving Parity for Māori and Pasifika – the University Sector View. They note that 73% of Pākehā who leave school in a given year have completed their expected schooling16, compared to only 54% of Māori. Not everyone who completes their schooling achieves University Entrance, but it is an indicator of the range of short-term learning opportunities available to rangatahi in the years immediately after they leave. In 2019, 44% of Pākehā left school having attained University Entrance, compared to just 19% of Māori (Ministry of Education, 2020) If there was parity between Māori and Pākehā, an additional 3,800 Māori would have left school with University Entrance – more than 2.3 times the number of Māori who actually did
16 This
Figure 22: School leavers in 2019, by highest attainment and ethnicity
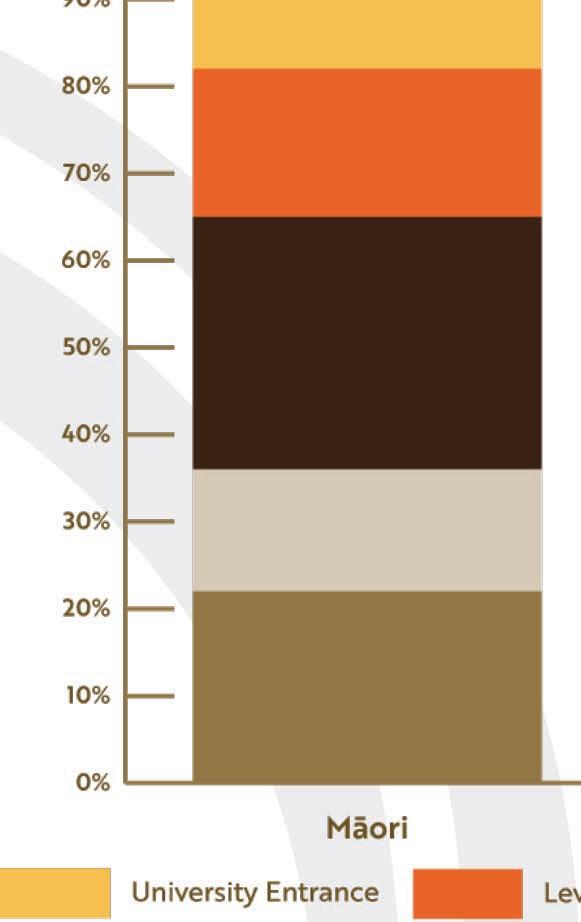
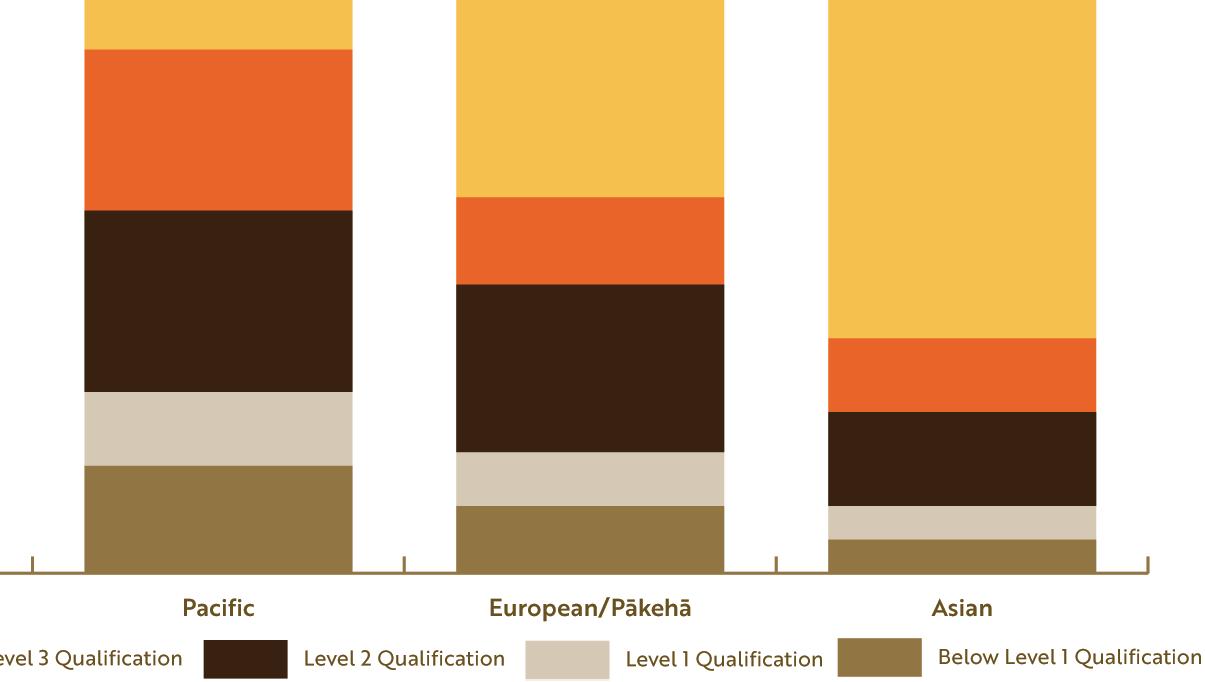
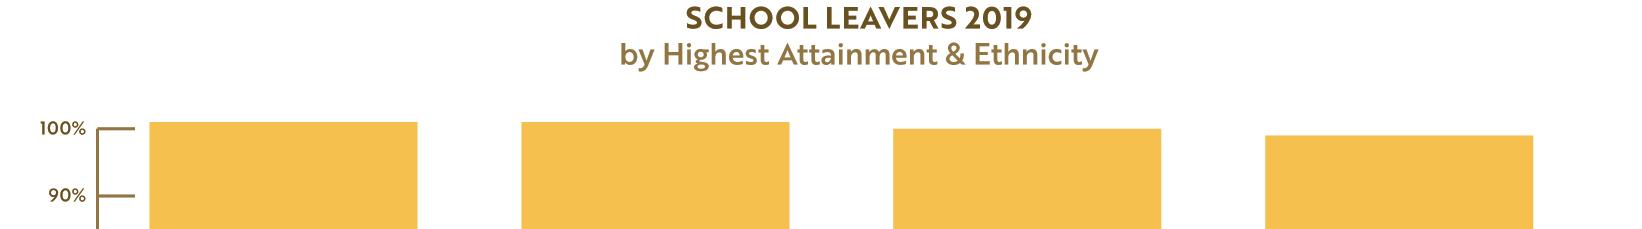
Source: (Ministry of Education, 2020)
The reason this matters – thousands of rangatahi Māori not attaining University Entrance – is that, in the present system, it really does open doors to degree-level study and, therefore, the downstream positive impacts of that. However, even then, not all University Entrance is the same and, with an increased demand for knowledge and skills in science, technology, engineering and mathematics (STEM), it is important for Māori to be achieving in this space Unfortunately, only 3% of Māori leave school with 30 or more credits in STEM subjects compared to 17% of Pākehā (Universities New Zealand, 2018)
It is clear that prior to the COVID-19 pandemic, the New Zealand education system was already failing Māori in the thousands every single year. It is necessary to briefly review that in the context of the pandemic and what it means for Māori. The pre-COVID-19 reality for Māori, in a post-COVID-19 world of employment scarcity and an increased proportional demand for technical skills (Olsen, 2020), was always a sign of likely catastrophe ahead. COVID-19 did not cause this problem but it will act as an accelerant for the consequences – both in terms of speed and severity. At this stage, there is no reason to envisage the situation improving given the repeated school closures coupled with increased emphasis on digital learning and the lack of access many of our rangatahi have to the necessary the resources that would enable them to participate fully and equitably.

In the absence of meaningful action, things are going to get worse.
Beyond COVID-19: the Māori Recovery Te Pūtea Whakatupu Trust
"It is our responsibility. We are the iwi, we've got to look after our people” (Waikato-Tainui Chief Executive Donna Flavell as cited in Parahi, 2020)
Just as our Indigenous peers around the world are doing, Māori have been active, advocating and leading from the very early days of the pandemic’s arrival in Aotearoa. With the devastating losses of the 1918 pandemic front of mind, the principal guiding concern of Māori pandemic leadership has been protection of whakapapa.
McMeeking and Savage (2020) explored the different ways Māori have contributed to the national response and positive health outcomes. Perhaps the most well-known of these contributions were what became known as “iwi checkpoints” established in different parts of the country. Working in partnership with police, iwi volunteers stopped people travelling into tribal areas without proper authorisation. This saw non-residents being turned away. Importantly, this included whanaunga, with volunteers turning back their own relatives not normally resident in the iwi rohe. Despite some controversy and pushback, including a petition signed by nearly 6,500 people, the checkpoints remained in place and had the support of new Police Commissioner Andrew Coster, who saw them as lawful provided they were run in partnership with police.
As discussed earlier in this report, Aboriginal peoples in Australia took similar initiative in order to protect their people who, just like Māori, are believed to be more vulnerable to severe illness and death from COVID-19. As it was in Australia, Māori were first-movers on this and Government came in behind (Smith, 2020; Dinku, 2020; McMeeking & Savage, 2020)
The purpose of lockdowns is to reduce movement of people. Iwi checkpoints contributed to community safety by advancing that aim.
In response to increased needs of whānau throughout the pandemic, iwi organisations, marae and community-based Whānau Ora partners have been working across the country to provide material support to whānau in general and kaumātua in particular. That support has included packs with food (fruit, vegetables, meat, frozen fish, milk, non-perishable items) and hygiene sets (soap, sanitiser, period products) (Parahi, 2020b; Heagney & Jacobs, 2020; de Graaf, 2020)
Some examples of this from the Level 4 lockdown include Ngāpuhi delivering 8000 food packs to vulnerable whānau and 3000 packs to iwi members in Auckland through Te Mahurehure Marae (de Graaf, 2020) while Ngāti Kauwhata in Manawatū were distributing packs throughout their region (Heagney & Jacobs, 2020) As at the time of writing,. the work continues as the level of need remains elevated. Papakura Marae has seen demand for food parcels treble to 90 per day and they continue to discover kaumātua and whānau who have not connected with support services (Johnsen, 2020)
While a lot of the packs have been funded by government, iwi have also stepped up financially and much of the work has been completed by volunteers – whānau supporting whanaunga (Parahi, 2020b; Johnsen, 2020)
The implementation of the COVID-19 Alert Level System also brought about innovation, adaptation and leadership from Māori on tikanga and kawa in a pandemic setting.
“Kawa and tikanga are often a reason to dutifully follow custom and tradition currently practiced on the marae and other places. However tikanga demands that we do what’s tika or what’s right for any occasion.” (Tomoana & Kāretu, 2020)
Beyond COVID-19: the Māori Recovery Te Pūtea Whakatupu Trust
One example of adaptation were the “Rolling tangihanga” (where ten people at a time would go through marae or funeral director premises) which became a practice under Alert Level 2. Although this was brought about through trying to fit within Government restrictions and there was some resentment associated with that (McLachlan, 2020), it was an example of adapting tikanga to fit the moment This was supported by other own-motion protocol shifts made by Māori, for Māori. They included replacing hongi with the “Kahungunu Wave” or touching one’s own nose with two fingers and looking the other person in the eye from an appropriate physical distance.
Citing Supreme Court Justice Sir Joseph Williams, McMeeking and Savage (2020) note: “Practices embodied in tikanga are reflexive, context-dependent expressions of deeper values (Williams, 2001). Where circumstances challenge those deeper values, such as the threat to whakapapa posed by Covid-19, it can be expected that Māori will actively evaluate and, if warranted, adapt tikanga.” (p. 37)
Another example of adapting tradition and tikanga to pandemic circumstances can be seen in the Kīngitanga’s leadership and decisions in relation to Koroneihana celebrations. Out of consideration for “the safety of our people” (Kīngitanga, 2020, p. 1), they drastically reduced the number of people allowed on to Tūrangawaewae, shortened celebrations to a single day and provided a way for people to participate in Koroneihana celebrations online. Early-morning karakia, mihimihi throughout the day and the King’s annual address were streamed live. The Prime Minister provided a video message. Those elements of Koroneihana celebrations requiring in-person attendance (e.g. sports games) did not proceed. Kawe mate ceremonies were also deferred to be held throughout Tainui at a later time but, in still a further example of adaptation, bereaved whānau were asked to send in photos so that a collage of those who had passed throughout the year could be created (Tyson, 2020; 1 News, 2020)
Another way Māori have been active throughout the pandemic is promoting and promulgating information related to COVID-19 and the government response. Iwi, hapū, marae, Whānau Ora agencies and others have made Māori communities aware of the risks to whānau presented by the virus and government support available.
One new organisation which was established in response to the pandemic is Protect Our Whakapapa, which aims to provide COVID-19 information and resources from a Māori world-view. Its goals include:
!
“Inspire whānau to channel and use their tūpuna wisdom.
!
Empower whānau to develop resilience and capability.
! Collaborate with rōpū whose kaupapa aligns with ours.
! Inform whānau about current developments during COVID-19.
! Connect whānau with support networks in their communities.
! Engage whānau through a variety of resources and online events.” (Protect Our Whakapapa, 2020a)
The resources Protect Our Whakapapa have created include advice on caring for whānau, being prepared through good planning and advice on essential items whānau should have at home. These resources are created in both English and te reo Māori (Protect Our Whakapapa, 2020b)
As countries around the world battle with misinformation, disinformation and conspiracy theories related to the pandemic (Jaiswal, LoSchiavo, & Perlman, 2020; Nguyen & Catalan-Matamoros, 2020), there is an opportunity for Māori organisations to continue to take a leadership role in combating misinformation and ensuring that iwi Māori are equipped with the best knowledge possible to make informed decisions for themselves and their whānau.
Beyond COVID-19: the Māori Recovery Te Pūtea Whakatupu Trust
The world is in a state of constant and rapid change and the flows of high-quality information will need to be two-way. While Māori are playing a strong role in disseminating high-quality information to our people, particularly those hard to reach or who may not trust others, we must also be gathering as many insights about our own people as we can. This is to ensure that any government responses and other pandemic recovery actions are informed by insights gathered and communicated by Māori, for Māori.
The nationwide lockdown is said to have resulted in a number of things connected with our relationships, beliefs and feelings of wellbeing. These include:
! improved trust in science, politicians and police;
! higher levels of patriotism;
! increased levels of mental distress (Sibley, et al., 2020)
The last of these, the mental distress, is made worse by feelings of isolation and disconnection. Māori networks are supporting communities through the pandemic to remain connected and they have done so in thoughtful, interesting, innovative and technology-enabled ways. Initiatives have included everything from nightly, open-to-all, online karakia and haka challenges through to organised weekly phone calls to kaumātua and encouraging whānau to share what they are doing to keep strong and build resilience through the pandemic. This knowledge-sharing campaign, known as #Manaaki20 (www.manaaki20.org), was led/catalysed by Te Pūtahitanga o Te Waipounamu alongside work they were doing to gather insights about Māori community needs (Parahi, 2020b; McMeeking & Savage, 2020)
The key insights from this section include:
1. Using modelling on the likely Infection Fatality Ratio in different scenarios, a herd immunity strategy would result in Māori making up 24% - 31% of projected deaths, amounting to an approximate range of between 4,900 and 6,400 people;
2. Māori unemployment and Māori youth unemployment is at its lowest point in at least 13 years;
3. Pākehā underutilisation has had half-year growth more than a third higher than what they experienced following the GFC while Māori and Pacific underutilisation both dropped;
4. Education and skills are going to be crucial in a tight employment market and it is estimated that 70,000 rangatahi Māori will be looking for work while the effects of the pandemic are still with us;
5. The education system continues to fail rangatahi Māori and needs to more than double the number of tauira leaving school with University Entrance to achieve parity with Pākehā; and
6. Without skills development interventions, Māori are likely to be further marginalised from highskill, high-paid roles which, in addition to providing larger incomes, are also at reduced risk from infection.


Beyond COVID-19: the Māori Recovery Te Pūtea Whakatupu Trust
International comparisons along health and economic lines demonstrate that, so far, Aotearoa New Zealand is doing well. Within that, when looking at some of the traditional measures over the last 10 – 15 years, Māori are doing better today than we have in a long time. We can be grateful for the leadership and decisions which have put us in this position.
Noting that it is still early days in the pandemic and things may well change in a matter of weeks, the reasons for our present situation remain unclear The Wage Subsidy and Extensions have undoubtedly played a significant role in keeping people employed, but those policies are also unlikely to have delivered the lowest Māori unemployment and youth unemployment rate we have had in at least 13 years and done so in the middle of a global pandemic. It is a bit of a mystery at this stage. However, while it is important to recognise when things are relatively good, the fact we have had it worse in the past is not a reason to relax A prayer of gratitude that we have not, as yet, suffered the fates of other BIPOC peoples around the world does not remove the need to act. If anything, it increases the urgency to consolidate our position and strengthen it for the future.
The virus itself provides us with a useful analogy for understanding where we are today and framing a strategy for the future. As was stated earlier in this report, around the world, the pandemic is in many ways simply the COVID-19 strain of a social and economic contagion which has been growing in virulence and prevalence for a very long time: inequality.
In Aotearoa, amongst other things, Māori:
! own fewer assets than non-Māori;
! live shorter lives than non-Māori;
! are incarcerated more than non-Māori.
These outcomes are the ultimate consequence of a societal malady The symptoms of the illness include Māori:
! achieving less in the education system than non-Māori (Ministry of Education, 2020);
! being unemployed at a higher-rate than non-Māori (Statistics New Zealand, 2020f);
! being in precarious employment more than non-Māori (Stubbs, Cochrane, Uerata, Hodgetts, & Rua, 2017);
! earning less than non-Māori over the course of our working lives (Shulze & Green, 2017);
! suffering poorer health outcomes in the health system than non-Māori (Steyn, et al., 2020); and
! more likely to commit suicide (Getz, 2018)
These are the pre-existing conditions or social comorbidities which have been so easily exploited and exacerbated by successive social and economic disruptions over the years. For example, in the aftermath of the 1987 stock market crash and the policy decisions which followed, Māori unemployment peaked at 25% while the overall rate was 10% (meaning the Pākehā rate was lower) (Ministry for Culture & Heritage, 2020). In 2010, following the GFC, Māori unemployment rose to 13.6%, while Pākehā unemployment rose to 4.8% (Statistics New Zealand, 2020f). Following the Spanish Flu, similar stories emerged regarding the marginal unemployment impacts on Māori.
Immediately following the GFC, there was a huge push on Māori and Pasifika Trades Training (MPTT). This effort, while successful, had echoes of the two-track education system in place towards the end of the 1800s and early 1900s in which Māori were encouraged into trades and farming while more “intellectual” professions were reserved for Pākehā (Walker R. , 2016) While a 2017 evaluation was unable to say so conclusively because quality data was not available, MPTT is likely to have resulted in improved
Beyond COVID-19: the Māori Recovery Te Pūtea Whakatupu Trust
employment outcomes for some Māori (Martin Jenkins, 2017) However, using the illness analogy, this treated the symptoms but did little to improve our overall resilience to threats like COVID-19. As a people, we are as vulnerable today as we were a century ago.
In looking to the future, we never want to be in this situation again. That will mean a long-term strategy of investments to address the underlying causes of inequality and provide a ‘social immunity’ to economic shocks. What does that look like for Māori?
A world in which Māori are resilient to shocks like COVID-19 is one in which:
! Māori are employed in less-vulnerable (i.e. more high-skill) roles at the same rate as Pākehā;
! Māori are unemployed at the same rate as Pākehā;
! Māori are earning as much as Pākehā; and
! Māori whānau own as many assets as Pākehā
This is a vision of an Aotearoa New Zealand where Māori are sharing equally in the nation’s prosperity and, as a result, are afforded the same protections that others enjoy
At its core, when all factors are distilled, success means getting to a point where Māori are earning as much as Pākehā. Schulze and Green (2017) described what income equity would mean for Māori and for Aotearoa:
!
“An additional $2.6 billion per year into Māori households
! 55,000 Māori will move from no qualification to having a qualification
! 22,500 currently in low skilled jobs will move to high skilled jobs
! Increase the New Zealand tax revenue, by around $700 million per year” (p. 2)
In their paper entitled Statistical Analysis of Ethnic Wage Gapsin New Zealand (2018), Treasury found that the ratio of the Māori average hourly wage to the Pākehā average hourly wage was 80-82% Schulze and Green (2017) quantified the gap as, on average, $10,000 per year for Māori between the ages of 40 and 60.
Treasury (2018) found that education level and occupation were the largest contributors to this gap.
“This implies that reducing ethnic differences in educational attainment and/or occupational status could help to reduce the size of the aggregate wage disparities.
These statistical models account for 68–73% of the entire Māori-Pākehā wage gap for males, 75% of the Māori-Pākehā wage gap for females…
The remaining portions of the wage gaps could be caused by a variety of factors, including differences between ethnic groups of other characteristics that haven’t been included in the model (such as the field of the qualification that is held, English language proficiency, detailed occupational skills, and firm-specific skills and experience); differences between ethnic groups in preferences for different jobs because of their non-wage characteristics, or discrimination.” (p. 14)
Holding institutional and societal racism to one side for a moment, this means that in order to close the gap, we need to improve education outcomes and get more Māori into high-skill employment. It means raising achievement levels to put Māori on to the path to high-skill employment and transferring more than 20,000 Māori from lower-skilled jobs into higher-skilled occupations.
Beyond COVID-19: the Māori Recovery Te Pūtea Whakatupu Trust
The emergence of COVID-19 is a global threat on a scale the world only sees every century. However, for Māori, its expected impacts (from high unemployment to negative education outcomes) are familiar to our whānau at the best of times. The reality is that Māori across New Zealand have been the vanguard in all of our nation’s economic battles – cannon fodder for the various forces arrayed against us, including poor health and education outcomes, underemployment, unemployment, racism and poverty. We have had the Christchurch Earthquakes, the Housing Crisis, the Global Financial Crisis, the stock market crash, the reforms of the 80s – in all cases, Māori have been hit first, hit hardest and have taken the longest to recover.
The fact that, so far, COVID-19 has not yet made life demonstrably worse for Māori at a macro level does not reduce the need or urgency to take this once-in-a-generation opportunity for social transformation. It is an opportunity to ensure that Māori are never again in the position we have been in so many times before: paying the highest price for social and economic contagions which hit our society.
This section provides a frame for thinking about what can be done to achieve that.
The diagram on the next page sets out a theory of change and the commentary on the pages that follow provide a narrative for its contents. Structurally, though, it is comprised of:
1. Kaupapa
The governing principle or driver for the change.
2. Ngā Kaha
Some of the strengths which can be drawn on to effect the change and, in this case, were most visible in the Māori-led responses to COVID-19.
3. Ngā Paetae
These are objectives for potential inclusion in the design of any investment programme.
4. Ngā Whāinga
Key goals, the achievement of which will support realising the vision for change.
5. Matawhānui
The vision for the future – where everything that comes before leads.
The issues this change frame addresses are not new and there is a great deal of high-quality research which can inform the more detailed investment planning and intervention design. The fact that the problems are persistent is an indication of how ‘wicked’ the problems are – but it is also proof that what has been tried to date has not worked. To be as vulnerable socially and economically to COVID-19 as we were to the Spanish Flu should motivate us all to think differently about what can be done, how it can be done and, probably most importantly, by whom
This is a complex challenge and what follows is very high-level. It is not presented as a solution for all the ills associated with inequality but it offers a frame for prioritising efforts that could “shift the needle” for Māori in a meaningful way. It is not a detailed guide on what to do (in itself a significant effort), rather it suggests some of the important impact areas for investment, based on recent evidence. There will be others.
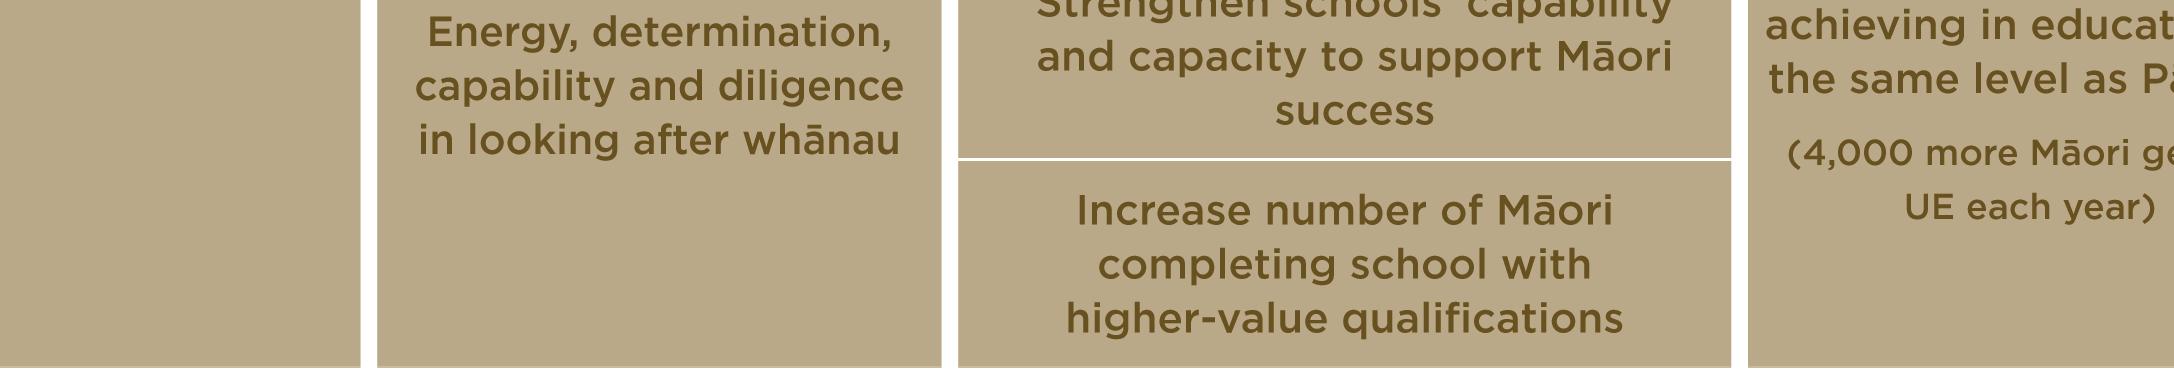
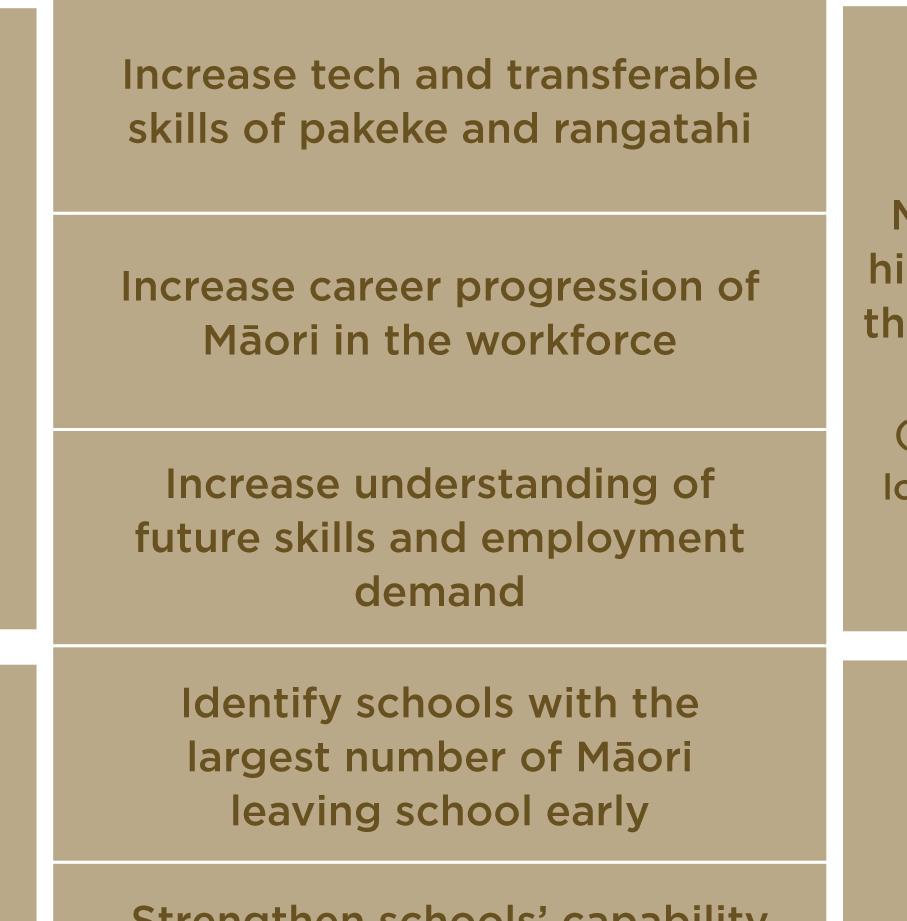
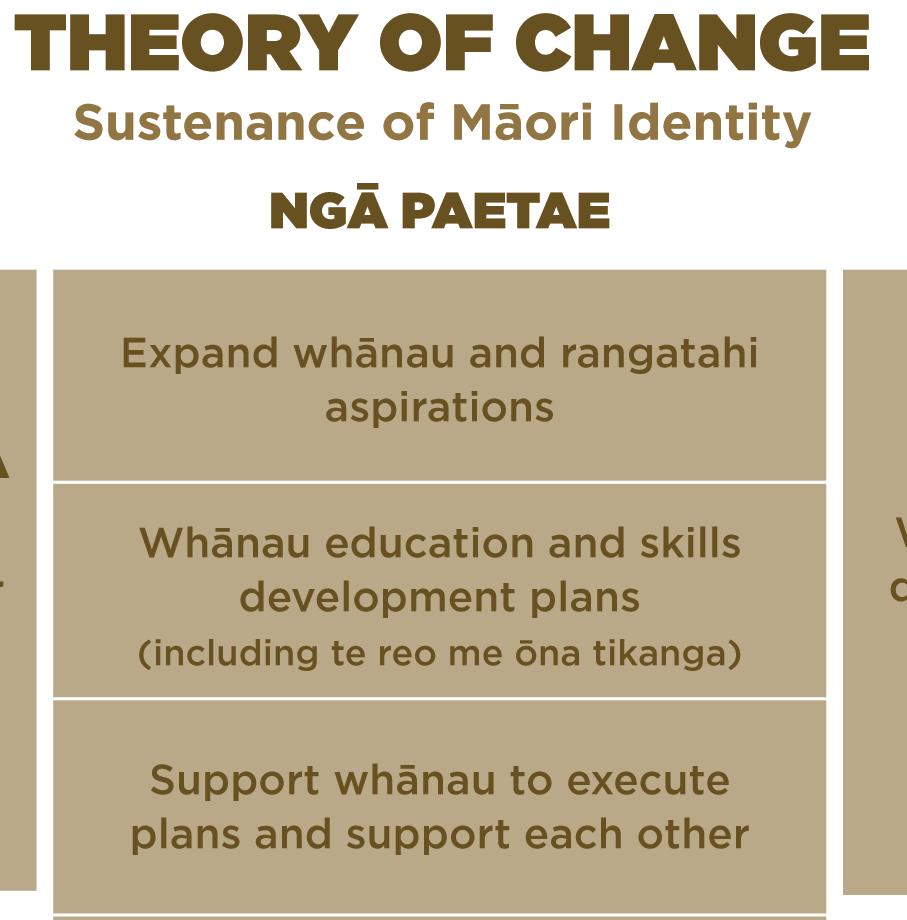


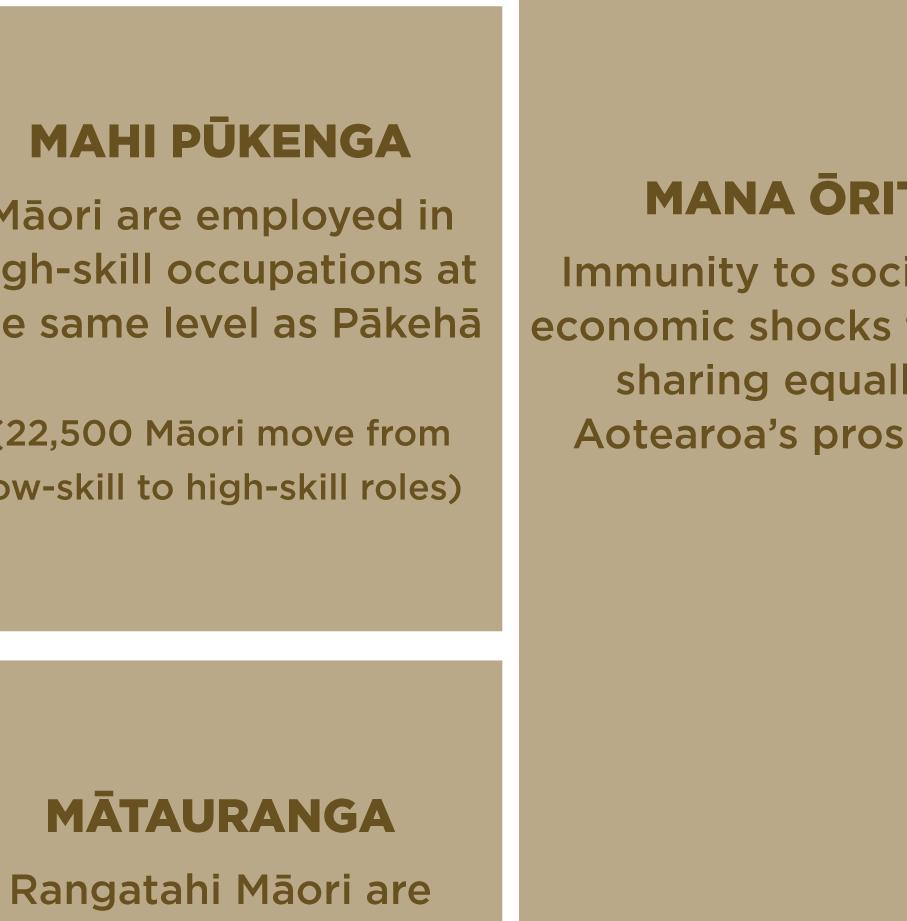
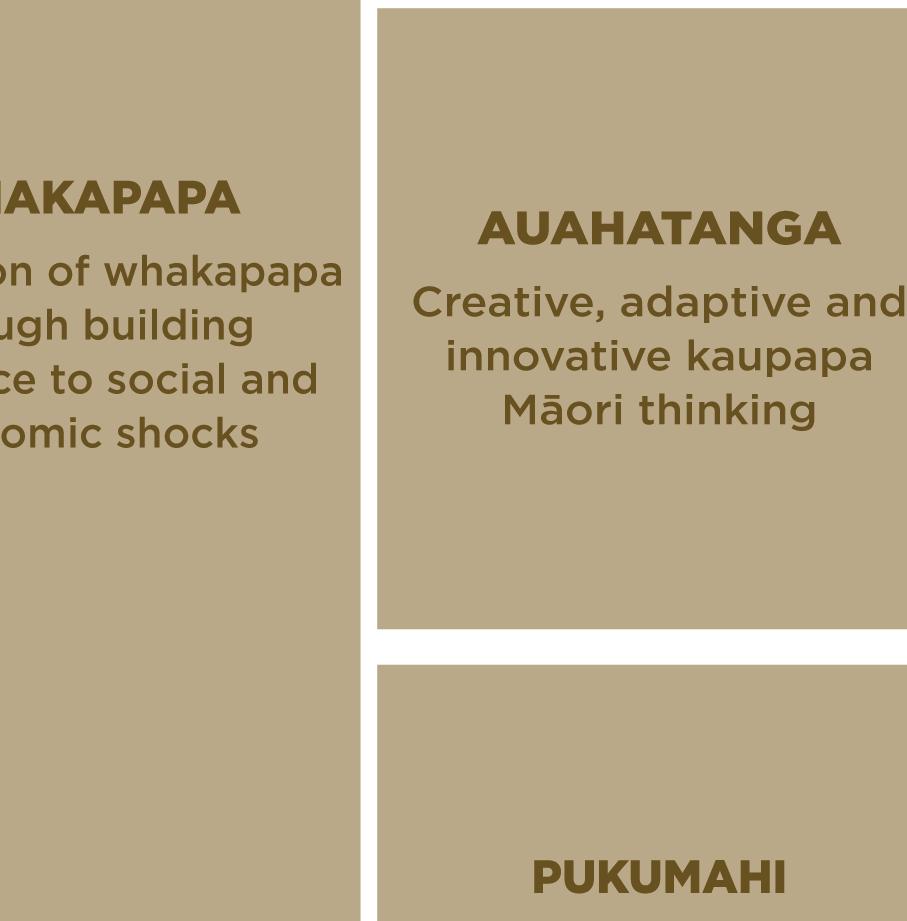
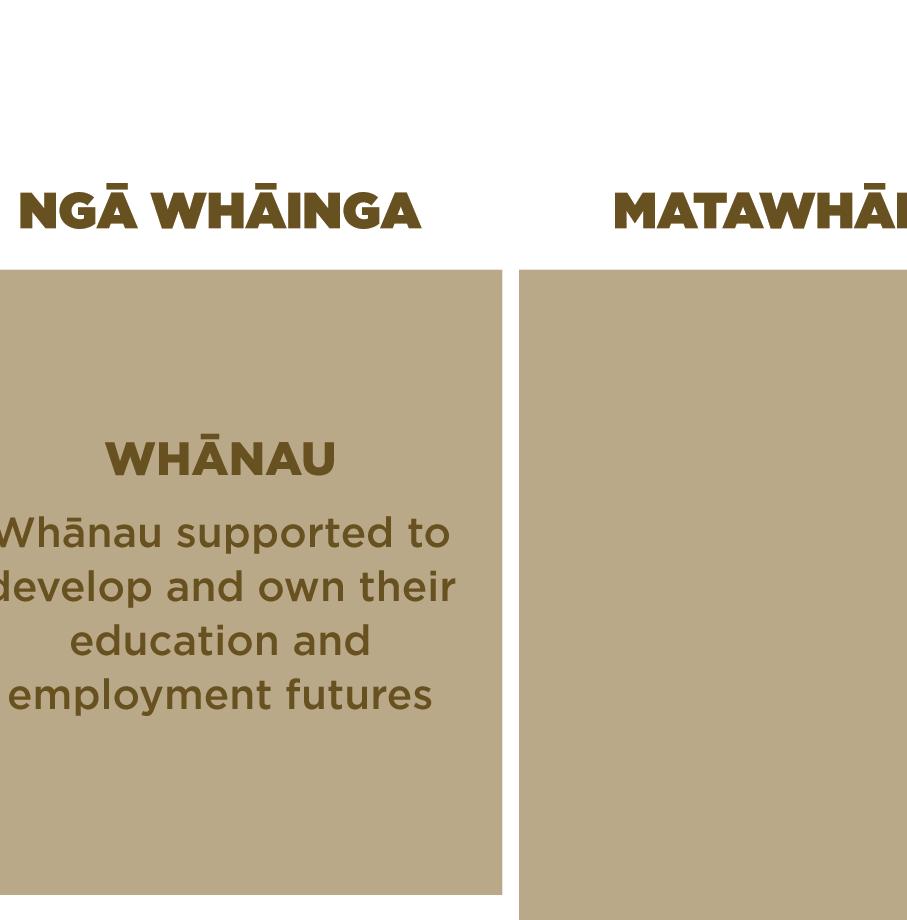


Beyond COVID-19: the Māori Recovery
Te Pūtea Whakatupu Trust
The vision is one of immunity through equality or mana ōrite. This is not about wanting more than anybody else – just an equal share in the national prosperity. To own as much, to earn as much, succeed as much and be as protected as anybody else from threats to our whānau wellbeing, be that a Global Financial Crisis or a pandemic. This will be a transformational shift with mana ōrite supporting and advancing mana motuhake
Holding racism and discrimination to one side, goals we can pursue in areas over which we have more agency and that support of the vision include Māori:
1. being equipped to support each other to realise whānau aspirations;
2. employed in high-skill occupations at the same levels as Pākehā; and
3. achieving in education at the same levels as Pākehā
This framing recognises whānau as the source of energy, capacity and direction of any transformative effort for Māori. Goals (2) and (3) are not possible without whānau driving it (1)
Achieving the goals above will be supported by objectives that:
! support whānau to envisage and direct their own aspirations and futures;
! equip whānau with what they need to plan and act on those aspirations; including
! identifying where the opportunities will be in the years ahead;
! development of high-value skills for high-skill employment; and
! promote career progression for Māori; while
! increasing rangatahi Māori success in compulsory education.
When looking at what strengths we can draw on to make this happen, again the Māori COVID-19 response has some very good examples which were applied at scale.
! Whanaungatanga;
! Creativity and innovation; and
! Focused determination.
These strengths and more stand Māori in very good stead to lead efforts to build our immunity to future threats. Our whanaungatanga is something that very few contemporary cultures retain in the same we do and it is an extraordinary force and fuel for collective action. It also sits at the heart of the very essence of our identity as Māori: our whakapapa.
As Whānau Ora partners, community organisation staff and whānau volunteers staffed checkpoints, distributed kai and hygiene packs and called kaumātua to check in throughout the pandemic, the guiding purpose was about protecting our people; protecting our whakapapa. That purpose applies equally to the challenge in front of us: building our collective immunity to economic shocks. That, too, is about protecting and honouring whakapapa.
Beyond COVID-19: the Māori Recovery Te Pūtea Whakatupu Trust
The work to be done protects whakapapa in that it will ensure whānau have the resources they need, are connected with each other and able to realise their whānau aspirations in a way that provides for generations to come.
The work will honour our whakapapa in that it will manifest our birth right as tangata whenua to share equally in the national prosperity, here, on the whenua of our ancestors.
For more information, please contact the author of this document:
Luc Shorter Director Vario
m: +64 (21) 816 925 e: luc@vario.nz w. www.vario.nz


Beyond COVID-19: the Māori Recovery Te Pūtea Whakatupu Trust
1 News. (2020). Jacinda Ardern delivers message of unity for pandemic-affected Koroneihana celebrations. (TVNZ) Retrieved August 2020, from 1 News: https://www.tvnz.co.nz/one-news/newzealand/jacinda-ardern-delivers-message-unity-koroneihana-celebrations
Abbott, G. (2020, July). Retrieved from Office of the Texas Governor: https://open.texas.gov/uploads/files/organization/opentexas/EO-GA-29-use-of-face-coveringsduring-COVID-19-IMAGE-07-02-2020.pdf
AlphaBeta Strategy & Economics. (2017). The Automation Advantage: How Australia can seize a $2 trillion opportunity from automation and create millions of safer, more meaningful and more valuable jobs. Sydney: AlphaBeta.
Anderson, R. M., Heesterbeek, H., Klinkenberg, D., & Hollingsworth, T. D. (2020, March 21). How will countrybased mitigation measures influence the course of the COVID-19 epidemic? The Lancet, 395(10228), 931-934.
Argus Leader. (2020). NEWS South Dakota sets new record for active coronavirus cases with 251 increase Saturday. (Argus Leader) Retrieved August 2020, from Argus Leader: https://www.argusleader.com/story/news/2020/08/22/south-dakota-sets-new-record-activecoronavirus-cases/3419290001/
Australian Bureau of Statistics. (2020a). Labour Force Status (15 Years & Over). Retrieved August 2020, from ABS.Stat: http://stat.data.abs.gov.au/
Australian Bureau of Statistics. (2020b, May). Labour Force, Australia. Retrieved from Australian Bureau of Statistics: https://www.abs.gov.au/ausstats/abs@.nsf/mf/6202.0
Banning, J. (2020). How Indigenous people are coping with COVID-19. Canadian Medical Association Journal, 192(27), 787-8.
Binny, R. N., Lustig, A., Brower, A., Hendy, S. C., James, A., Parry, M., . . . Steyn, N. (2020). Effective reproduction number for COVID-19 in Aotearoa New Zealand (Pre-print, not peer-reviewed. medRxiv. https://doi.org/10.1101/2020.08.10.20172320.
Blavatnik School of Government. (2020). Insights: Country Data. Retrieved August 2020, from Oxford COVID-19 Government Response Tracker: https://covidtracker.bsg.ox.ac.uk/stringency-scatter
Brown, C. (2020). Isolated from COVID-19, endangered by domestic violence: The heightened risk of violence against women in the Northern Territory. Indigenous Australians and the COVID-19 Crisis: Perspectives on Public Policy, 14-17.
Bureau of Indian Affairs. (2020). Cheyenne River Agency. Retrieved August 2020, from U.S. Department of the Interior: https://www.bia.gov/regional-offices/great-plains/south-dakota/cheyenne-riveragency
Centers for Disease Control & Prevention. (2020). Excess Deaths Associated with COVID-19. Retrieved August 2020, from Centers for Disease Control & Prevention: https://www.cdc.gov/nchs/nvss/vsrr/covid19/excess_deaths.htm
Charania, N. A., & Turner, N. M. (2018). 100 years since the 1918 influenza pandemic progress made, yet questions remain. A synopsis of the 4th New Zealand Influenza Symposium, February 2018. New Zealand Medical Journal, 131(1481), 50-55.
Cheyenne River Sioux Tribe. (2020a). Retrieved 2020 August, from Cheyenne River Sioux Corona Virus Updates: https://www.crstcoronavirusupdates.com/wp-content/uploads/2020/07/Covid19_Response_Plan_July_31.pdf
Beyond COVID-19: the Māori Recovery Te Pūtea Whakatupu Trust
Cheyenne River Sioux Tribe. (2020b). Retrieved August 2020, from Cheyenne River Sioux Coronavirus Updates: http://www.crstcoronavirusupdates.com
Christchurch City Libraries. (n.d.). 1918 Influenza Pandemic. Retrieved qAugust 2020, from Christchurch City Council Libraries: https://my.christchurchcitylibraries.com/1918-influenza-pandemic/
Coibion, O., Gorodnichenko, Y., & Weber, M. (2020). Labor Markets during the Covid-19 Crisis: A Preliminary View, CESifo Working Paper, No. 8238. Munich: Center for Economic Studies and ifo Institute (CESifo).
Cook, C. (2020). 'It's hell': Reality of unemployment despite drop in numbers. Retrieved August 2020, from RNZ: https://www.rnz.co.nz/news/national/422837/it-s-hell-reality-of-unemployment-despitedrop-in-numbers
Correia, S., Luck, S., & Verner, E. (2020). Pandemics Depress the Economy, Public Health Interventions Do Not: Evidence from the 1918 Flu.
Crooks, K., Casey, D., & Ward, J. S. (2020). First Nations people leading the way in COVID-19 pandemic planning, response and management (Preprint). The Medical Journal of Australia
de Graaf, P. (2020). Covid 19 coronavirus: Iwi delivers 8000 food packs to vulnerable whānau. (Northland Age) Retrieved August 2020, from NZ Herald: https://www.nzherald.co.nz/northlandage/news/article.cfm?c_id=1503402&objectid=12326564
Deaton, B. J., & Deaton, B. J. (2020). Food security and Canada's agricultural system challenged by COVID 19. Canadian Journal of Agricultural Economics/Revue canadienne d'agroeconomie
Dillon, M. (2020). Post-crisis reconstruction: The case for an Indigenous-specific policy response. Indigenous Australians and the COVID-19 Crisis: Perspectives on Public Policy, 26-28.
Dinku, Y. (2020). The COVID-19 crisis, recession and Indigenous jobs. Indigenous Australians and the COVID-19 Crisis: Perspectives on public policy, 2-5.
Ducharme, J. (2020). Some Coronavirus Patients Are Reporting Symptoms That Last Months. Nobody Knows Exactly How to Treat Them. Retrieved August 2020, from TIME: https://time.com/5880191/long-haul-covid-19/
Ferguson, N. M., Laydon, D., Nedjati-Gilani, G., Imai, N., Ainslie, K., Baguelin, M., . . . Fu, H. (2020). Report 9: Impact of non-pharmaceutical interventions (NPIs) to reduce COVID-19 mortality and healthcare demand. Imperial College London.
Finlay, S., & Wenitong. (2020, June 24). Aboriginal Community Controlled Health Organisations are taking a leading role in COVID-19 health communication. Australian and New Zealand Journal of Public Health
Fogarty, B. (2020). The CoVID-19 conundrum in remote Indigenous Australia: Schools. Indigenous Australians and the COVID-19 Crisis: Perspectives on Public Policy, 21-23.
Folkhälsomyndigheten Public Health Agency of Sweden. (2020). Public Gatherings. Retrieved August 2020, from Folkhälsomyndigheten Public Health Agency of Sweden: https://www.folkhalsomyndigheten.se/the-public-health-agency-of-sweden/communicabledisease-control/covid-19/public-gatherings/
Getz, P. (2018). Māori suicide rates – the high cost of historical trauma. Nursing New Zealand, 24(8), 11-13.
Heagney, G., & Jacobs, M. (2020). Manawatū iwi distributing health packs to people in need. Retrieved August 2020, from Stuff: https://www.stuff.co.nz/manawatu-standard/news/120960987/manawatiwi-distributing-health-packs-to-people-in-need
Beyond COVID-19: the Māori Recovery Te Pūtea Whakatupu Trust
Inland Revenue Department. (2020). COVID-19 Small Business Cashflow (Loan) Scheme (SBCS). Retrieved August 2020, from Inland Revenue Department: https://www.ird.govt.nz/covid-19/business-andorganisations/small-business-cash-flow-loan
International Labour Organisation. (2020a). Composite rate of labour underutilization (LU4) by sex and age (%) - Quarterly. Retrieved August 2020, from ILOSTAT explorer: https://www.ilo.org/shinyapps/bulkexplorer24/?lang=en&segment=indicator&id=LUU_XLU4_SEX_ AGE_RT_Q
International Labour Organisation. (2020b). Employment-to-population ratio. Retrieved 2020 August, from International Labour Organisation: https://www.ilo.org/ilostatfiles/Documents/description_EPR_EN.pdf
International Labour Organisation. (2020c). Time-related underemployment rate by sex and age ILO modelled estimates, Nov. 2019 (%) - Annual. Retrieved August 2020, from ILOSTAT explorer: https://www.ilo.org/shinyapps/bulkexplorer14/?lang=en&segment=indicator&id=EAP_DWAP_SEX _AGE_RT_Q
Jaiswal, J., LoSchiavo, C., & Perlman, D. C. (2020). Disinformation, Misinformation and Inequality-Driven Mistrust in the Time of COVID-19: Lessons Unlearned from AIDS Denialism. AIDS and Behavior, 1-5.
Jamieson, T. (2020). "Go Hard, Go Early": Preliminary Lessons from New Zealand's Response to COVID-19. American Review of Public Administration, 50(6-7), 598-605.
John Hopkins University. (2020). South Dakota - State Overview. Retrieved August 2020, from John Hopkins University & Medicine Coronavirus Resource Centre: https://coronavirus.jhu.edu/region/us/southdakota
Johnsen, M. (2020). Covid-19: Community groups supporting people without phones. Retrieved August 2020, from Radio New Zealand: https://www.rnz.co.nz/news/te-manu-korihi/424417/covid-19community-groups-supporting-people-without-phones
Kīngitanga. (2020). Koroneihana Cancellation. Retrieved August 2020, from Tūwharetoa: https://www.tuwharetoa.co.nz/app/uploads/2020/08/Koroneihana-Press-Release_20200818.pdf
Kirby, T. (2020, June 01). Evidence mounts on the disproportionate effect of COVID-19 on ethnic minorities. The Lancet, 8(6), 547-548.
Kwok, K. O., Lai, F., Wei, W. I., Wong, S. Y., & Tang, J. W. (2020). Herd immunity – estimating the level required to halt the COVID-19 epidemics in affected countries (Letter to the Editor). Journal of Infection, 80(6), e22-e23.
Lahn, J. (2020). COVID-19 and the Aboriginal and Torres Strait Islander health workforce. Indigenous Australians and the COVID-19 Crisis: Perspectives on Public Policy, 18-20.
Legido-Quigley, H., Asgari, N., Teo, Y. Y., Leung, G. M., Oshitani, H., Fukuda, K., . . . Heymann, D. (2020, March 14). Are high-performing health systems resilient against the COVID-19 epidemic. The Lancet, 395(10227), 848-850.
Lloyd-Cape, M. (2020). Slack in the System: The economic cost of underemployment Melbourne, VIC, Australia: PerCapita.
Markham, F. (2020). COVID-19 and the Indigenous income crisis: Looking back and looking forward. Indigenous Australians and the COVID-19 Crisis: Perspectives on Public Policy, 6-9.
Martin Jenkins. (2017). MPTT Evaluation Findings. Martin Jenkins.
McKee, M., & Stuckler, D. (2020, May). If the world fails to protect the economy, COVID-19 will damage the health not just now but also in the future. Nature Medicine, 26(5), 640-642.
Beyond COVID-19: the Māori Recovery Te Pūtea Whakatupu Trust
McKibbin, W., & Fernando, R. (2020). The Global Macroeconomic Impacts of COVID-19: Seven Scenarios. CAMA Working Paper, Australian National University, Crawford School of Public Policy.
McLachlan, L.-M. (2020). Rolling tangihanga allowed under alert level 2. Retrieved August 2020, from RNZ: https://www.rnz.co.nz/news/te-manu-korihi/416462/rolling-tangihanga-allowed-under-alert-level2
McMeeking, S., & Savage, C. (2020). Māori Responses to Covid-19. Policy Quarterly, 16(3), 36-41.
Meneses-Navarro, S., Freyermuth-Enciso, M. G., Pelcastre-Villafuerte, B. E., Campos-Navarro, R., MeléndezNavarro, D. M., & Gómez-Flores-Ramos, L. (2020). The challenges facing indigenous communities in Latin America as they confront the COVID-19 pandemic. International Journal for Equity in Health, 19(1), 1-3.
Ministry for Culture & Heritage. (2020). The 1980s: Overview. (Ministry for Culture & Heritage) Retrieved from New Zealand History.
Ministry of Education. (2020). Time Series Data: School Leavers with Highest Attainment (2009-2019). Retrieved August 2020, from Education Counts: https://www.educationcounts.govt.nz/__data/assets/excel_doc/0017/182015/Time-Series-HighestAttainment.xlsx
Ministry of Health. (2020, March). Background and overview of approaches to COVID-19 pandemic control in Aotearoa/New Zealand. Retrieved August 2020, from Ministry of Health: https://www.health.govt.nz/system/files/documents/publications/background-overviewapproaches-covid-19-pandemic-contro-aotearoa-new-zealand-30mar20.pdf
Ministry of Health. (2020, September). COVID-19: current cases. Retrieved from Ministry of Health: https://www.health.govt.nz/our-work/diseases-and-conditions/covid-19-novel-coronavirus/covid19-current-situation/covid-19-current-cases
Ministry of Social Development. (2016). The profile of Pacific peoples in New Zealand Wellington: New Zealand Government.
Ministry of Social Development. (2020). Payment rates and processing times for COVID-19 Wage Subsidy Extension. Retrieved August 2020, from Work and Income New Zealand: https://www.workandincome.govt.nz/covid-19/wage-subsidy-extension/payments-and-processingtimes.html
Navajo Nation Department of Health. (2020). COVID-19. Retrieved August 2020, from Navajo Nation Department of Health: https://www.ndoh.navajo-nsn.gov/COVID-19
NBC. (2020). How Hard-Hit Navajo Nation Is Flattening Its Coronavirus Curve. Retrieved August 2020, from YouTube | NBC News: https://www.youtube.com/watch?v=WFyHUdfmyVk
New York Times. (2020a). Excess Deaths During the Coronavirus Pandemic. Retrieved August 2020, from GitHub: https://github.com/nytimes/covid-19data/tree/77d0cbe883eaba182bc29994683085f88f51b02b/excess-deaths
New York Times. (2020b). South Dakota Coronavirus Map and Case Count. Retrieved August 2020, from New York Times: https://www.nytimes.com/interactive/2020/us/south-dakota-coronaviruscases.html
New Zealand Government. (2020, July). Alert Level 1 | Unite against COVID-19. Retrieved from Unite against COVID-19: https://covid19.govt.nz/covid-19/covid-19-alert-system/alert-level-1/
New Zealand Government. (2020). Releases - New wage subsidy, leave scheme protects jobs and businesses. Retrieved August 2020, from Beehive.govt.nz:
Beyond COVID-19: the Māori Recovery Te Pūtea Whakatupu Trust
https://www.beehive.govt.nz/release/new-wage-subsidy-leave-scheme-protects-jobs-andbusinesses
Nguyen, A., & Catalan-Matamoros, D. (2020). Digital Mis/Disinformation and Public Engagment with Health and Science Controversies: Fresh Perspectives from Covid-19. Media and Communication, 8(2), 323-328.
Noble, K., Hurley, P., & Macklin, S. (2020). COVID-19, employment stress and student vulnerability in Australia. Mitchell Institute for Education and Health Policy, Victoria University.
NPR. (2020). Timeline: What Donald Trump has said and done about the coronavirus. Retrieved August 2020, from NPR: https://www.npr.org/2020/04/21/837348551/timeline-what-trump-has-said-anddone-about-the-coronavirus
Office for National Statistics. (2020). A09: Labour market status by ethnic group Retrieved July 2020, from Office for National Statistics: https://www.ons.gov.uk/employmentandlabourmarket/peopleinwork/employmentandemployeet ypes/datasets/labourmarketstatusbyethnicgroupa09
Olsen, B. (2020, June 9). Second wave of unemployment approaches. Retrieved July 2020, from Infometrics: https://www.infometrics.co.nz/second-wave-of-unemployment-approaches/
Organisation for Economic Co-operation and Development. (2020a). Gross domestic product (GDP) : GDP per head, US $, current prices, current PPPs Retrieved August 2020, from OECD.Stat: https://stats.oecd.org/index.aspx?lang=en
Organisation for Economic Co-operation and Development. (2020b) Incidence of involuntary part time workers. Retrieved August 2020, from OECD.Stat: https://stats.oecd.org/Index.aspx?DataSetCode=INVPT_I#
Organisation for Economic Co-operation and Development. (2020c). Key Short-Term Economic Indicators | export in goods, s.a. | Growth on the same period of the previous year. Retrieved August 2020, from OECD.Stat: https://stats.oecd.org/index.aspx?lang=en
Organisation for Economic Co-operation and Development. (2020d). Quarterly National Accounts: GDPexpenditure approach; Growth rate compared to previous quarter, seasonally adjusted Retrieved August 2020, from OECD.Stat: https://stats.oecd.org/index.aspx?lang=en
Organisation for Economic Co-operation and Development. (2020e). Short Term Labour Market Statistics: Unemployment Rates by age and gender. Retrieved August 2020, from OECD.Stat: https://stats.oecd.org/index.aspx?lang=en
Organisation for Economic Co-operation and Development. (2020f). Short-Term Labour Market Statistics: Employment rate, Aged 15-64, All persons. Retrieved August 2020, from OECD.Stat: https://stats.oecd.org/Index.aspx?DataSetCode=STLABOUR
Organisation for Economic Co-operation and Development. (2020g). Short-Term Labour Market Statistics: Monthly Unemployment Rates. Retrieved July 2020, from OECD.Stat: https://stats.oecd.org/index.aspx?queryid=36324
Our World in Data. (2020). Coronavirus (COVID-19) Deaths. Retrieved August 2020, from Our World in Data: https://ourworldindata.org/covid-deaths
Parahi, C. (2020a). 'I was gutted': Jacinda Ardern on her moment of despondency over Covid-19 and the words from a world leader that helped. Retrieved August 2020, from Stuff: https://www.stuff.co.nz/national/health/coronavirus/300088825/i-was-gutted-jacinda-ardern-onher-moment-of-despondency-over-covid19-and-the-words-from-a-world-leader-that-helped
Beyond COVID-19: the Māori Recovery Te Pūtea Whakatupu Trust
Parahi, C. (2020b). Coronavirus: How Māori are helping Māori handle the pain of the Covid-19 pandemic Retrieved August 2020, from Stuff: https://www.stuff.co.nz/national/health/coronavirus/121049269/coronavirus-how-mori-arehelping-mori-handle-the-pain-of-the-covid19-pandemic
Pickering-Martin, E. (2020). Rumours, racism, and privilege. (Mana Trust) Retrieved August 2020, from ETangata: https://e-tangata.co.nz/comment-and-analysis/rumours-racism-and-privilege/ Power, T., Wilson, D., Best, O., Brockie, T., Bourque Bearskin, L., Millender, E., & Lowe, J. (2020). COVID-19 and Indigenous Peoples: An imperative for action. Journal of Clinical Nursing, 29(15-16), 2737-2741.
Productivity Commission. (2020). About Us Retrieved August 2020, from Productivity Commission: https://www.productivity.govt.nz/about-us/
Protect Our Whakapapa. (2020a). About Us. Retrieved August 2020, from #ProtectOurWhakapapa: https://www.protectourwhakapapa.co.nz/about-us
Protect Our Whakapapa. (2020b). Rauemi / Resources. Retrieved August 2020, from #ProtectOurWhakapapa: https://www.protectourwhakapapa.co.nz/rauemi
Queensland Government. (2020, June 30). Queensland border closure. Retrieved July 2020, from Unite & Recover: https://www.covid19.qld.gov.au/government-actions/border-closing
Rabin, R. C. (2020). Coronavirus May Pose a New Risk to Younger Patients: Strokes. Retrieved August 2020, from New York Times: https://www.nytimes.com/2020/05/14/health/coronavirus-strokes.html
Randolph, H. E., & Barreiro, L. B. (2020). Herd Immunity: Understanding COVID-19. Immunity, 52(5), 737-741.
Reid, A., Schulze, H., Green, S., Groom, M., & Dixon, H. (2020). Whano! Towards futures that work: How Māori can lead Aotearoa forward. Wellington: BERL.
Rickert, L. (2020). Cheyenne River Reservation Sees Spike in COVID-19 Cases. Retrieved August 2020, from Native News Online: https://nativenewsonline.net/currents/cheyenne-river-reservation-seesspike-in-covid-19-cases
Riley, B. (2020). Energy security on remote Aboriginal communities during the COVID-19 crisis. Indigenous Australians and the COVID-19 Crisis: Perspectives on Public Policy, 24-25.
RNZ. (2020). Auckland lockdown to continue for 12 more days. Retrieved August 2020, from Radio New Zealand: https://www.rnz.co.nz/news/covid-19/423569/auckland-lockdown-to-continue-for-12more-days
Seow, J., Graham, C., Merrick, B., Acors,S., Steel, K. J., Hemmings, O., . . . Winstone, H. (2020). Longitudinal evaluation and decline of antibody responses in SARS-CoV-2 infection (pre-print). medRxiv Shulze, H., & Green, S. (2017). Change Agenda: Income equity for Māori. Wellington: BERL & Tokona te Raki. Shulze, H., & Hurren, K. (2020). Ka whati te tai: a generation disrupted. Wellington: BERL. Sibley, C. G., Greaves, L. M., Satherley, N., Wilson, M. S., Overall, N. C., Lee, C. H., . . . Barlow, F. K. (2020). Effects of the COVID-19 Pandemic and Nationwide Lockdown on Trust, Attitudes Toward Government, and Well-Being. American Psychologist, 75(5).
Silverman, H., Toropin, K., & Sidner, S. (2020). Navajo Nation surpasses New York state for the highest Covid-19 infection rate in the US. (CNN) Retrieved August 2020, from CNN: https://edition.cnn.com/2020/05/18/us/navajo-nation-infection-rate-trnd/index.html
Smith, D. (2020). Governing the pandemic: Implications for Indigenous self-determination and selfgovernance. Indigenous Australians and the COVID-19 Crisis: Perspectives on Public Policy, 10-13.
Beyond COVID-19: the Māori Recovery Te Pūtea Whakatupu Trust
Statista. (2020). Distribution of the labor force in Australia in 2019, by indigenous status. Retrieved July 2020, from Statista: https://www.statista.com/statistics/1124362/australia-distribution-of-laborforce-status-by-indigenous-status/
Statistics New Zealand. (2018). Characteristics of the underemployed in New Zealand. Retrieved August 2020, from Stats NZ: https://www.stats.govt.nz/reports/characteristics-of-the-underemployed-innew-zealand
Statistics New Zealand. (2019). New Zealand’s population reflects growing diversity. Retrieved August 2020, from Stats NZ: https://www.stats.govt.nz/news/new-zealands-population-reflects-growing-diversity
Statistics New Zealand. (2020a). COVID-19 slows labour market activity. Retrieved August 2020, from Stats NZ: https://www.stats.govt.nz/news/covid-19-slows-labour-market-activity
Statistics New Zealand. (2020b). Labour Force Status by Ethnic Group by Regional Council (QrtlyMar/Jun/Sep/Dec). Retrieved July 2020, from StatsNZ InfoShare: http://archive.stats.govt.nz/infoshare/ViewTable.aspx?pxID=26c96583-a0e7-4661-aa539ee2b05912a0
Statistics New Zealand. (2020c). Labour Force Status by Sex by Age Group (Qrtly-Mar/Jun/Sep/Dec) Retrieved August 2020, from Stats NZ | Infoshare: http://archive.stats.govt.nz/infoshare/ViewTable.aspx?pxID=f028ba70-7a02-4c83-925f6f8c78334d2e
Statistics New Zealand. (2020d). Labour Force Status by Sex by Regional Council (Qrtly-Mar/Jun/Sep/Dec) Retrieved August 2020, from Stats NZ: http://archive.stats.govt.nz/infoshare/ViewTable.aspx?pxID=f8d45a74-59ce-4175-8ec2-8637d12b723e
Statistics New Zealand. (2020e). Labour Force Status by Sex by Total Resp Ethnic Group (QrtlyMar/Jun/Sep/Dec). Retrieved August 2020, from Stats NZ Infoshare: http://archive.stats.govt.nz/infoshare/ViewTable.aspx?pxID=c55b524c-3c15-40ca-96ae-7f1e892bc369
Statistics New Zealand. (2020f). Labour Force Status by Total Resp Ethnic Group and Age Group (QrtlyMar/Jun/Sep/Dec). Retrieved August 2020, from Stats NZ Infoshare: http://archive.stats.govt.nz/infoshare/ViewTable.aspx?pxID=bc8b5c12-1f74-48f6-8642-625fd251d6af
Statistics New Zealand. (2020g). Labour Force Status. Retrieved July 2020, from Stats NZ: http://archive.stats.govt.nz/methods/classifications-and-standards/classification-related-statsstandards/labour-force-status/glossary-and-references.aspx#gsc.tab=0
Statistics New Zealand. (2020h). National ethnic population projections, characteristics, 2013(base)-2038 update. Retrieved July 2020, from Stats NZ NZ.Stat: http://nzdotstat.stats.govt.nz/wbos/Index.aspx?_ga=2.106748355.1154558918.15940817481293786261.1467850673#
Statistics New Zealand. (2020i). National population estimates: At 30 June 2020. Retrieved August 2020, from Stats NZ: https://www.stats.govt.nz/information-releases/national-population-estimates-at30-june-2020
Statistics New Zealand. (2020j). Persons Underemployed by Sex (Qrtly-Mar/Jun/Sep/Dec). Retrieved August 2020, from Stats NZ Infoshare: http://archive.stats.govt.nz/infoshare/ViewTable.aspx?pxID=81dc91cb-cfab-47a5-9cd3-def34ac71e4e
Statistics New Zealand. (2020k). Underutilisation by Ethnicity by Sex (Qrtly-Mar/Jun/Sep/Dec). Retrieved August 2020, from Stats NZ | Infoshare: http://archive.stats.govt.nz/infoshare/SelectVariables.aspx?pxID=4d77aa8d-c832-437f-98022f7d01b54d27
Beyond COVID-19: the Māori Recovery Te Pūtea Whakatupu Trust
Statistics New Zealand. (2020l, July). Unemployment rate at 4.2 percent in March quarter. Retrieved from StatsNZ: https://www.stats.govt.nz/news/unemployment-rate-at-4-point-2-percent-in-marchquarter
Statistics Sweden. (2020). GDP indicator: Sharp contraction in second quarter 2020. Retrieved August 2020, from Statistics Sweden: https://www.scb.se/en/finding-statistics/statistics-by-subjectarea/national-accounts/national-accounts/national-accounts-quarterly-and-annualestimates/pong/statistical-news/national-accounts-second-quarter-2020/
Steyn, N., Binny, R. N., Hannah, K., Hendy, S., James, A., Kukutai, T., . . . Sporle, A. (2020). Estimated inequities in COVID-19 infection fatality rates by ethnicity for Aotearoa New Zealand.
Stubbs, T., Cochrane, W., Uerata, L., Hodgetts, D., & Rua, M. (2017). The Māori Precariat: A silhouette. In S. Groot, C. Van Ommen, B. Masters-Awatere, & N. Tassell-Matamua, Precarity: Uncertain, Insecure and Unequal Lives in Aotearoa New Zealand (pp. 113-122). Auckland, Aotearoa New Zealand (pp. 113 - 122): Massey University Press.
Tai, D. B., Shah, A., Doubeni, C. A., Sia, I. G., & Wieland, M. L. (2020). The Disproportionate Impact of COVID-19 on Racial and Ethnic Minorities in the United States. Clinical Infectious Diseases
The Treasury. (2018). Statistical Analysis of Ethnic Wage Gaps in New Zealand. Analytics and Insights Team. Wellington: New Zealand Government.
The Treasury. (2020). Budget Economic and Fiscal Update 2020. Wellington: New Zealand Government.
Tokona te Raki: Māori Futures Collective. (2020). Kia puta ki Rangiātea: Reaching new futures. Ōtautahi: Te Rūnanga o Ngāi Tahu.
Tomoana, N., & Kāretu, T. (2020). Ngāti Kahungunu Iwi Inc, post 11 March, The ‘Kahungunu Wave’ kicks in to combat the spread of Coronavirus (COVID-19) - March Edition – 2020. Retrieved August 2020, from Facebook: https://www.facebook.com/kahungunu/posts/the-kahungunu-wave-kicks-in-tocombat-the-spread-of-coronavirus-covid-19-march-e/2900570753314904/
Tyson, J. (2020). All you need to know about Koroneihana online celebrations. (Māori Television Service) Retrieved August 2020, from Te Ao Māori News: https://www.teaomaori.news/all-you-need-knowabout-koroneihana-online-celebrations
U.S. Bureau of Labor Statistics. (2020a). A-3. Employment status of the civilian noninstitutional population by sex and age, seasonally adjusted. Retrieved July 2020, from U.S. Bureau of Labor Statistics: https://www.bls.gov/web/empsit/cpseea03.htm
U.S. Bureau of Labor Statistics. (2020b). A-4. Employment status of the civilian noninstitutional population by race, Hispanic or Latino ethnicity, sex, and age, seasonally adjusted. Retrieved July 2020, from U.S. Bureau of Labor Statistics: https://www.bls.gov/web/empsit/cpseea04.htm
U.S. Bureau of Labor Statistics. (2020c). Alternative measures of labor underutilization. Retrieved August 2020, from U.S. Bureau of Labor Statistics: https://www.bls.gov/news.release/empsit.t15.htm
U.S. Census Bureau. (2020). Quick Facts: South Dakota, North Dakota. Retrieved August 2020, from U.S. Census Bureau: https://www.census.gov/quickfacts/fact/table/SD,ND/PST045219
U.S. Department of Transportation. (2020) Tribal Transportation. Retrieved August 2020, from U.S. Department of Transportation - Federal Highway Administration: https://www.fhwa.dot.gov/tribal/tribalprgm/govts/cheyenneriver.htm
Universities New Zealand. (2018). Achieving Parity for Maori and Pasifika – the University Sector View. Retrieved from Universities New Zealand: https://www.universitiesnz.ac.nz/sites/default/files/UNZ%20Parity%20Discussion%20Paper%20On e%20%28Aug%202018%29.pdf
Beyond COVID-19: the Māori Recovery Te Pūtea Whakatupu Trust
van Dorn, A., Cooney, R. E., & Sabin, M. L. (2020, April 18). COVID-19 exacerbating inequalities in the US. The Lancet, 395(10232), 1243-1244.
Walker, M., & Cochrane, E. (2020). Tribe in South Dakota Seeks Court Ruling Over Standoff on Blocking Virus. (New York Times) Retrieved August 2020, from New York Times: https://www.nytimes.com/2020/06/24/us/politics/coronavirus-south-dakota-tribe-standoff.html
Walker, R. (2016). Chapter 1: Reclaiming Māori Education. In R. Walker, Decolonisation in Aotearoa: Education, research and practice (pp. 19-38).
Wenham, C., Smith, J., & Morgan, R. (2020, March 14). COVID-19: the gendered impacts of the outbreak. The Lancet, 395(10227), 846-847.
Wilson, N., Telfar-Barnard, L., Summers, J. A., Shanks, G. D., & Baker, M. G. (2012). Differential Mortality Rates by Ethnicity in 3 Influenza Pandemics Over a Century, New Zealand. Emerging Infectious Diseases, 18(1), 71-77.
Wingfield-Hayes, R. (2020). Coronavirus: Japan's mysteriously low virus death rate. (BBC) Retrieved August 2020, from BBC: https://www.bbc.com/news/world-asia-53188847
World Health Organisation. (2010). Pandemic (H1N1) 2009 - update 112. Retrieved August 2020, from World Health Organisation: https://www.who.int/csr/don/2010_08_06/en/
Worldometer. (2020a, August). COVID-19 Coronavirus Pandemic. Retrieved from Worldometer: https://www.worldometers.info/coronavirus/
Worldometer. (2020b). Coronavirus Cases United States. Retrieved August 2020, from Worldometer: https://www.worldometers.info/coronavirus/country/us/


Beyond COVID-19: the Māori Recovery Te Pūtea Whakatupu Trust
This section contains a list of all figures and tables included in this document (with citations to the sources of the data used in their production) and a general explanatory note regarding the process employed by the author for creating them.
All of the figures used in this document are original in that they have been created by the author using publicly available data from trusted sources. Those sources are cited for each figure where they appear in the body of the report and in the table below. The detail on where the data was downloaded can be found in the corresponding entry in the References section. The data was downloaded and then analysed using standard software. For the most part, this involved simply summarising the data by selected dimensions available in the source and should be easily replicable based on the citations.
However, there are a number of instances where the author has made new independent calculations based on the information or data provided by the sources cited. They include:
a. Figure 1, Figure 2 and Figure 3
These figures all relate to the stringency of OECD government responses to the pandemic
b. Figure 16
This figure relates to estimated deaths which would result from pursuit of a herd immunity strategy through naturally acquired infection
While not complicated work, it is important to highlight the difference between summarising the cited data and adding new data points derived from the cited data To support independent checking of these figures, the author’s calculation methods are set out in Appendix A
Figure 1: Maximum government stringency by days at maximum, OECD countries, 1 March – 31 July 2020 Source: Blavatnik School of Government, Oxford University (2020) 12
Figure 2: Days of more/less stringency than New Zealand, OECD countries, 1 March – 31 July 2020 Source: Blavatnik School of Government, Oxford University (2020) 13
Figure 3: Average government stringency, OECD countries, 1 March – 31 July 2020 Source: Blavatnik School of Government, Oxford University (2020) 14
Figure 4: COVID-19 deaths per million of population, OECD countries, 20 August 2020 Source: Our World in Data (2020) 18
Figure 5: Gross Domestic Product (GDP), USD per capita, OECD countries, 2019 Source: Organisation for Economic Cooperation and Development (2020a) 19
Figure 6: GDP growth on previous quarter, expenditure approach, OECD countries, Q1 & Q2 2020 Source: Organisation for Economic Co-operation and Development (2020d) 20
Figure 7: Exports, OECD countries, percentage change in 2020 from same quarter 2019 Source: Organisation for Economic Co-operation and Development (2020c) 21
Figure 8: Labour force statistical definitions 22
Figure 9: Unemployment rate, OECD countries, Q1 & Q2 2020 Source: Organisation for Economic Co-operation and Development (2020e) 25
Beyond COVID-19: the Māori Recovery Te Pūtea Whakatupu Trust
Figure 10: Youth unemployment rate, OECD countries, Q1 & Q2 2020 Source: Organisation for Economic Co-operation and Development (2020e) 28
Figure 11: Underemployment rate, OECD countries, ILO modelling estimate 2020 Source: International Labour Organisation (2020c) 29
Figure 12: Time-related underemployment rate, select countries, ILO modelling estimate 2005 - 2020 Source: International Labour Organisation (2020c) 30
Figure 13: Youth time-related underemployment rate, select countries, ILO modelling estimate 2005 - 2020 Source: International Labour Organisation (2020c) 31
Figure 14: Underutilisation rate, OECD countries, Q4 2019 - Q2 2020 Source: International Labour Organisation (2020a) 33
Figure 15: Employment rate, OECD countries, Q4 2019 - Q2 2020 Source: Organisation for Economic Co-operation and Development (2020f) 34
Figure 16: Estimated COVID-19 deaths to achieve herd immunity by scenario, age-group and ethnicity Sources: Steyn, et al. (2020); Binny, et al. (2020); Randolph & Barreiro (2020); Statistics New Zealand (2020i); Statistics New Zealand (2020h) 40
Figure 17: Quarterly employment in NZ, Q4 2007 - Q2 2020 Source: Statistics New Zealand (2020c) 42
Figure 18: Quarterly unemployment in NZ by Ethnicity, Q4 2007 - Q2 2020 Source: Statistics New Zealand (2020f) 43
Figure 19: Quarterly youth unemployment in NZ by Māori/European, Q4 2007 - Q2 2020 Source: Statistics New Zealand (2020f) 44
Figure 20: Quarterly underutilisation in NZ, Q4 2007 - Q2 2020 Source: Statistics New Zealand (Statistics New Zealand, 2020k) 45
Figure 21: Quarterly underutilisation in NZ by Ethnicity, Q4 2007 - Q2 2020 Source: Statistics New Zealand (2020k) 46
Figure 22: School leavers in 2019, by highest attainment and ethnicity Source: (Ministry of Education, 2020) 48
Figure 23: Theory of change 56
Table 1: Quarterly unemployment for Selected Countries, December 2019 - June 2020 27


Beyond COVID-19: the Māori Recovery Te Pūtea Whakatupu Trust
This section includes details calculations which the author has made independently (using quality data and information with sources cited), rather than summarised using dimensions available in the data sets. This information is provided to guide any interested reader who may wish to replicate the work done with data sets as and when they may be updated in the future and to enable the reader to check or test the working of the author, should they wish to do so. The author has made every effort to check and doublecheck these independent calculations but, even so, mistakes do happen and it is in everyone’s interests that the methods employed are available to the reader.
Figure 1: Maximum government stringency by days at maximum, OECD countries, 1 March – 31 July 2020
Source: Blavatnik School of Government, Oxford University
Using the Blavatnik School of Government (2020) data set, a table was created which identified the maximum level of stringency applied by all 184 countries monitored by the Blavatnik School of Government at Oxford University between 1 March and 31 July 2020. Then, the number of days each country spent at that level was counted.
These two numbers – the maximum stringency in the period and the number of days spent at that level –were then plotted to a scatter graph with the maximum stringency plotted to the y axis and the number of days spent at that level to the x axis.
Figure 2: Days of more/less stringency than New Zealand, OECD countries, 1 March – 31 July 2020
Source: Blavatnik School of Government, Oxford University
Using the Blavatnik School of Government (2020) data set, a table was created assessing each day between 1 March 2020 and 31 July 2020 (153 days) for all 184 other countries monitored by the Blavatnik School of Government at Oxford University to determine whether, on each individual day, each country had a higher or lower level of stringency in their response when compared to New Zealand. The results were then summarised into number-of-days-at-higher-stringency and number-of-days-at-lower-stringency. The results for the 36 other OECD countries were then used as the basis for the stacked bar chart in Figure 2.
Figure 3: Average government stringency, OECD countries, 1 March – 31 July 2020
Source: Blavatnik School of Government, Oxford University
Using the Blavatnik School of Government (2020) data set, the average stringency for each country monitored was calculated and those for countries in the OECD were put into a bar chart in descending order of stringency.
The average stringency for New Zealand Alert Levels is also plotted on to all of the three figures above which deal with the stringency of government responses. This was calculated using the dates on which New Zealand moved to different lockdown levels between 25 March and 31 July. The reason the averages were used from 25 March, rather than 1 March, was because the Alert Levels did not exist for all of March and the steps and stages between levels were quicker and less well defined. The average stringency was taken for the periods of the lockdowns subsequent to the country going into Level 4 lockdown.
Beyond COVID-19: the Māori Recovery Te Pūtea Whakatupu Trust
Figure 16: Estimated COVID-19 deaths to achieve herd immunity by scenario, age-group and ethnicity Sources: Steyn, et al. ; Binny, et al. ; Randolph & Barreiro ; Statistics New Zealand ; Statistics New Zealand
This section explains the method used by the author to calculate the approximate number of deaths which would occur, should New Zealand pursue a herd immunity strategy through naturally acquired infection.
1. The NZ Population is estimated at 5,025,000 as at the end of June 2020 (Statistics New Zealand, 2020i)
2. Based on the 2018 Census (Statistics New Zealand, 2019), the national population was then broken down by the three Ethnicities covered in Steyn, et al. (2020): ! Māori 16.5% 829,125 people ! Pacific 8.1% 407,025 people ! European 70.2% 3,527,550 people
3. Note that, in the Census, people are counted in each ethnicity they identify, consequently, the resulting figures will be slightly overstated but it is not possible with the data sets in use to determine which ones for sure and to what extent. Overall, all ethnicities (including the three above, plus others) expressed as a proportion in the source (Statistics New Zealand, 2019) sum to 112.6%. The figures should, therefore, be treated as approximate.
4. Using population projections (Statistics New Zealand, 2020h), each Ethnicity is then broken down by the Age Groups employed by Steyn, et al. (2020):
! Māori
0 – 19 years 41.62% 345,086 people 20-39 years 27.74% 230,023 people 40-59 years 20.02% 165,971 people 60-79 years 9.56% 79,282 people 80+ years 1.04% 8,658 people
! Pacific
0 – 19 years 42.40% 172,575 people 20-39 years 30.35% 123,552 people 40-59 years 18.53% 75,427 people 60-79 years 7.81% 31,785 people 80+ years 0.91% 3,687 people
! European
0 – 19 years 25.00% 882,012 people 20-39 years 24.54% 865,583 people 40-59 years 25.25% 890,575 people 60-79 years 20.41% 719,908 people 80+ years 4.81% 169,572 people
5. New Zealand’s pre-Level4-lockdown estimated effective reproduction number of 1.8 (Binny, et al., 2020) is used to provide a herd immunity threshold of 46% (Kwok, Lai, Wei, Wong, & Tang, 2020) Each population group above is then multiplied by 46% to determine the number of people from each group who would need to be infected and recover in order to achieve immunity.
6. Then, for each group, the number of infections required to reach the recovered number in (4) above is calculated, taking into account the relevant Infection Fatality Ratios (Steyn, et al., 2020)
Beyond COVID-19: the Māori Recovery Te Pūtea Whakatupu Trust
7. The number of fatalities is shown for each group and each method employed by Steyn, et al (2020)
8. Note that the totals between do not match precisely between methods, due to rounding.
9. The Infection Fatality Ratios for the subtotals for ethnicities by age group and the totals for both methods do not match Steyn, et al. (2020) as different Statistics New Zealand sources were used for the population figures (Statistics New Zealand, 2019; Statistics New Zealand, 2020h; Statistics New Zealand, 2020i) and they may have also adjusted those figures to manage the doublecounting of ethnicities Their IFRs are shown in brackets for the subtotals and totals. The number of deaths in brackets is the author’s application of their subtotal/total IFRs to the population.
Method 1
Ethnicity Age Group PopulationInfected RecoveredDeaths Infection Fatality Ratio
NZ European 0-19 years 882,012 405,726 405,726 0 0.00%
NZ European 20-39 years 865,583 398,327 398,168 159 0.04%
NZ European 40-59 years890,575 410,815 409,665 1,150 0.28%
NZ European 60-79 years 719,908 338,676 331,158 7,519 2.22%
NZ European 80+ years 169,572 83,658 78,003 5,655 6.76%
Subtotals 3,527,650 1,637,202 1,622,719 14,484 (12,279) 0.88% (0.75%)
Māori 0-19 years 345,086 158,756 158,740 16 0.01%
Māori 20-39 years 230,023 105,938 105,810 17 0.12%
Māori 40-59 years 165,971 77,376 76,347 1,029 1.33%
Māori 60-79 years 79,282 39,589 36,470 3,120 7.88%
Māori 80+ years 8,658 4,624 3,983 641 13.87%
Subtotals 829,021 386,283 381,350 4,933 (4,442) 1.28% (1.15%)
Pacific 0-19 years 172,575 79,392 79,384 8 0.01%
Pacific 20-39 years 123,552 56,885 56,834 51 0.09%
Pacific 40-59 years 75,427 35,047 34,696 350 1.00%
Pacific 60-79 years 31,785 15,475 14,621 854 5.52%
Pacific 80+ years 3,687 1,922 1,696 226 11.75%
Subtotals 407,025 188,721 187,232 1,490 (1,359) 0.79% (0.72%)
TOTAL 4,763,696 2,212,206 2,191,301 20,907 (17,919) 0.95% (0.81%)
Method 2
Ethnicity
Population Infected Recovered
Deaths Infection Fatality Ratio
NZ European 3,527,550 1,632,796 1,622,673 10,123 0.62%
Māori 829,125 387,836 381,398 6,438 1.66%
Pacific 407,025 189,448 187,232 2,217 1.17%
TOTAL 4,763,700 2,210,080 2,191,303 18,778 (17,902) 0.85% (0.81%)