PORTFOLIO
Tanushree Chowdhary
[ ]
Resume Data Center+
Game McMillan
POE Metrics
Mobile Analytic
Flow
Works
CONTENT 00 01 02 03 04 05 06 07 08 09
Simulation
Mercurial
Material
Operable Envelope Other
[ ]
TANUSHREE CHOWDHARY
Sustainable Designer
PROFILE
A passionate architect, with a dream to work towards sustainability. Persuing MS in Environmental Building Design at the University of Pennsylvania. Seeking a job opportunity which helps me achieve the dream. Philadelphia, PA +1 267-901-8341
CONTACT

tanu1996@design.upenn.edu
https://www.linkedin.com/in/ tanushree-chowdhary

SOFTWARE SKILLS
Autodesk AutoCAD Autodesk Revit Rhinoceros | Grasshopper Sketchup

Adobe Suite MS Office
INTERESTS
Travelling Dancing Walking Socializing
MS-Environmenmtal Building Design
Stuart Weitzman School of Design, University of Pennsylvania, USA | expected Dec 2022
Taking courses like Daylighting, LCA, Building Performance Simulation to understand and analyze the performance of buildings.
Applied this understanding to design a data center in the Bioclimatic Studio and currently working on and adaptive resuse project in the EBD Research Studio. Courses like Housing Insecurity and Environmental Humanities are helpful in understanding the social aspect of sustainability.
Bachelor of Architecture
School of Architecture, IPS Academy, India | June 2019
Took courses like History of Architecture, Building Design and Urban Design which created a base for the field. Courses like Building Services and Structures helped in understanding how the building functions. Attempted a variety of projects like residence, hotel, hospital and training center.
Building Performance Intern
Quinn Evans, Washington DC, USA | June 2022- Aug 2022
Developed a “post occupancy metrics” to calculate the operational carbon for all the projects. Assited the ongoing projects to achieve certifications like LEED by conducting daylight analysis, quality view analysis, Life Cycle Analysis, etc.
Graduate Assistant
A Book A Day, Philadelphia, USA | Feb 2022- Present
Working on the graphic design requirements such as infographics, brochures, and posters for the non-profit organisation to make it more visible in the city.
Architect
Sanrachana, Indore, India | July 2019- June 2021
Completed three projects which include one room, a small villa, and interior design for an office space. Developed concepts for some projects.
Trainee Architect
Atelier [D] Sync, Surat, India | Jan 2019- June 2019
Developed design concepts and set of working drawings for a residential projects. Created working draings and digital models for various projects.
Trainee Architect
VBT Consortium, Bengaluru, India | July 2018- Dec 2018
Developed detailed working drawings for some residential projects. Worked on renovations of a commercial project. Created digital model and presentations for various projects.
EDUCATION PROFESSIONAL EXPERIENCE CO-CURRICULAR
2019 | Teaching Volunteer

2017 | Industrial Design Trophy-winner
2019 | for Atelier [D] Sync
Robin Hood Army, NGO Annual NASA, Convention 2016 | Organising Comittee | Anchoring | Dance MAD Week, College Fest 2A Continental Architecture Awards 2018 | Organising Comittee PACE, National Seminar 2016 | Organising Comittee AETAS, Zonal NASA
[ ]
Data Center +01 Bioclimatic Studio


Location: Studio: School: Brief: Tools:
Philadelphia, PA Bioclimatic Studio | MSD-EBD Semester II | 2022 Weitzman School of Design University of Pennsylvania, PA Done in collaboration, Data Center+ focuses on bioclimatic design strategies. The design attempts to use passive strategies to cool down the spaces and utilize the heat from the servers to heat up the spaces, depending on the climate requirement. The approach was to create a public space which can house the data centers as well as welcome people from the neighbourhood to engage in various activities along the viaduct. Rhino | QGIS | Ladybug | Honeybee Grasshopper | CFD | Photoshop Illustrator
Aerial View
[ ]
Winter Garden Summer Winter
Spaces


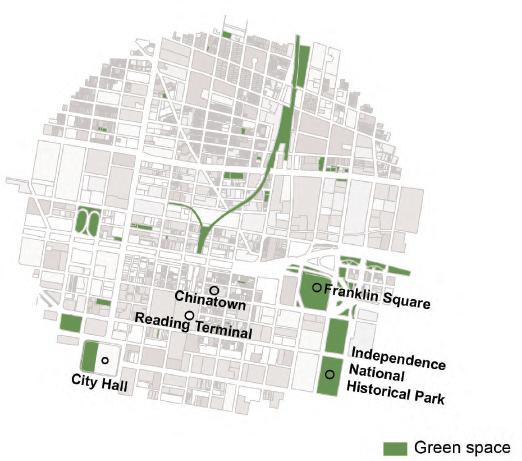

01 | Data Center + Sur face Tempe atu e Sur face Temperature Sur face Temperature Sur face Tempe ature Above Viaduct Above Viaduc Above Viaduc Above Viaduct Viaduct Level Viaduct Level Viaduct Level Viaduc Level Below Viaduct Below Viaduct Below Viaduct Below Viaduct Site Location Site Introduction Wind Analysis Summer Solistice Winter Solistice Summer Solistice Winter Solistice Solar Radiation AnalysisExisting Site Condition Summer Winter Transportation Green
Land Use
Server Units
Office Units
Wind Shadow Analysis


Community | Education | Forest
Positioning the units Zoning


Development and Analysis
01 | Data Center +
Site
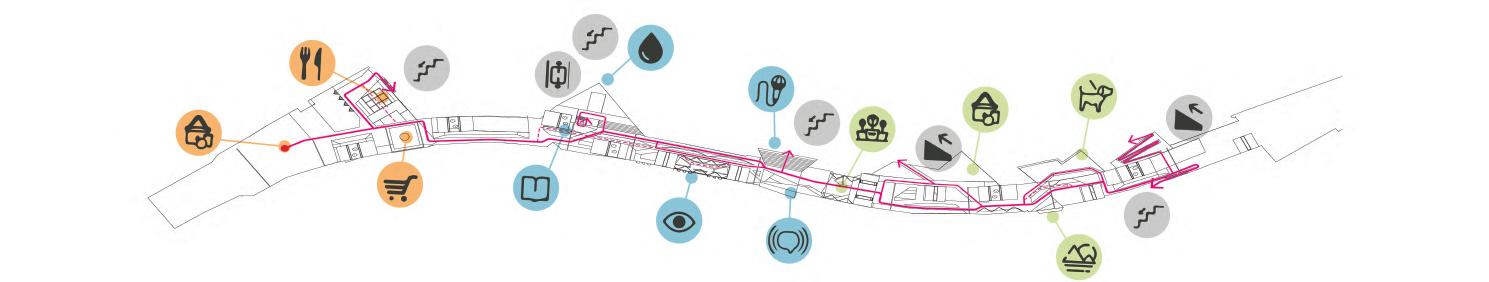
N Data Center Program Solar Panel Activities & Circulation Solar Panel on Structur Solar Panel on Roof Se ver G eenhouse W n er Ga den Tourist Cen er & Ca e Rainwater Rec ycle System Summer Heat Map W nter Heat Map Folk A ts Cultu al Trea sures Cha er School The Viaduct The Rail Park Leisu ctivi ef eshme ts Shopping tairs Elev or Stairs ning iew deck W erscape mphithe e G the ing spa e athe ing spa Ramp eisu tivi iew deck ail tairs amp School The Viaduct The Rail Park 25 26.5 28 29.5 12 31 15 32.5 18 34 21 35.5 24 37 27 38.5 30 C 40 C
Concept- Winter


Concept- Summer

Winter Condition


01 | Data Center +
CFD
Section 1.Tourist Center | 2.Play Area | 3.Sunken Pedestrian | 4.Water-body | 5.Step Seating | 6.Winter Garden | 7.Forest Area 8.Forest Trail 9.Folk Art-cultural Treasures Charter School | 10.Rail Park
Greenroof Greenroof
Stack and Greenhouse Closed
Wind Tunnel
Water Cur tain (Pre cooling) South 2m/s wind Nor th South Viaduct Water Cu tain G eenhouseSky WindowGreen Roof Solar Pannel Ser ver Site Plan Typical Winter Garden Summer Condition | Rainwater Recycle and rain Garden System Unit Development and Analysis
Data Center Facade Detail
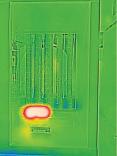


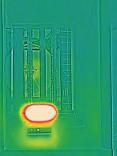


Facade CFD Temperature Wind Speed Section Louvers Controlled by Sensors Water
Cur
tain Brick
Jali
Wind Tunnel
Water
Cur tain
Brick
Jali
Water Cur tain Inside Inside 2.7 2.4 2.1 1.8 1.5 1.2 0.9 0.6 0.3 m/s 27 C 26.6 26.2 25.8 25.4 25 24.6 24.2 23.8 23 23.4 01 | Data Center + Water Curtain Experiment Monthly Balance Charts Rope Metal Wire Baseline 10 min 20 min 30 min Cold Days Hot Days EUI Breakdown (kWh / m2): Cold Days(Oc t-Apr) Hot Days(May Sep) Heating 20.189 0.875 Cooling 3.556 4.833 Interior Lighting 17.033 13.431 Elec trical Equipment 230.244 206.931 Total 271.022 226.069
Data Center Unit Detail


Gathering Spaces Forest Park

01 | Data Center +
Simulation Game02 Building Performance


Location: Course: School: Brief: Tools:
Philadelphia, PA Building Performance Simulation MSD-EBD | Semester I | 2021 Weitzman School of Design University of Pennsylvania, PA Done individually, the simulation game was an exercise to study a given shoebox model’s energy use, thermal comfort and useful daylight availability.
The goal was to study these factors and improve the model in such a way that all these factors are then optimised.
Ladybug | Honeybee | Grasshopper.
The Site
Incident Radiations
E N W S
Incident Radiations
[ ]
Baseline Input Metrics Baseline Output Metrics
R-values:
Wall: 2.28 m2K/W
Roof: 2.82 m2K/W Floor: 5.38 m2K/W
U-values: Windows: 2 W/m2K
Windows SHGC: 0.3
Windows VLT: 0.35
WWR: 0.3 for all sides
No. of floors: 2 ; Height of floors: 2.5 m
EUI: 177.53 KWh/m2
Heating: 84.11 KWh/m2
Cooling: 50.57 KWh/m2
Interior Lighting: 10.41 KWh/m2
Interior Equipment: 32.43 KWh/m2
Pumps: 0.01 KWh/m2
Monthly End Use EUI
Monthly Thermal Load Balance Chart
Annual UDI Ground Floor Average UDI: 83.90
PMV September Average : -0.71 for both


The
Optimised Input Metrics
R-values:
Optimised Output Metrics
Wall: 3.52 m2K/W
Roof: 5.28 m2K/W


Floor: 5.38 m2K/W
U-values: Windows: 1.13 W/m2K
Windows SHGC: 0.25
Windows VLT: 0.30
WWR: North: 0.1 ; East: 0.2 South: 0.3 ; West: 0.1


EUI: 140.34 KWh/m2
Heating: 67.03 KWh/m2
Cooling: 30.46 KWh/m2
Interior Lighting: 10.41 KWh/m2

Interior Equipment: 32.43 KWh/m2
Pumps: 0.01 KWh/m2
Optimised ModelBaseline Model


Monthly End Use EUI
Annual UDI Ground Floor Average UDI: 84.61
Percentage of Comfort Ground Floor: 47.76% First Floor: 44.24%
of
use intensity
Monthly Thermal Load Balance Chart


PMV September
PPD September
Percentage of Comfort
Annual UDI Ground Floor Average UDI:
Annual UDI Ground Floor Average UDI:
02 | Simulation Game
focus
the project was to enhance the comfort for the month of September, while optimising the energy
80.40
83.44
Average: 0.22 ground 0.58 first Average: 17.15 ground 27.44 first Average: 62.36 % ground 54.17% first
floors
Testing Different WWR for all facades to get minimize EUI and maximize Comfort and Average UDI
Testing Different WWR for all facades to get minimize EUI and maximize Comfort and Average UDI

Optimum Values for EUI, Comfort and Average UDI


02 | Simulation Game
McMillan03
Quinn Evans | Internship
Location: Project: Firm: Brief:
Washington, DC
McMillan Community Center
Quinn Evans Architects, DC
An ongoing Quinn Evans project based in Washington, DC. The project aims on the revival of the earliest water filteration site of the city.

Scope of my work was to create reports for various credits for LEED certification including daylight and quality view analysis. In addition, a sustainability diagram was created to coney the essense of the project.


Sustainability Diagram
Tools:
Climate Studio | Rhino Sketchup | Revit | Photoshop
Quality View Report
Daylight Report
[ ]
POE Metrics04
Quinn Evans | Internship
Cell Type:
Key: Links:
Pre-Project
Electricity
Post Occupancy Evaluation
Quinn Evans Architects, DC
Done independently under the guidance of the Sustainability Director of the firm. The aim was to create a post occupancy evaluation metrics to assist the firms goal towards the AIA 2030 Commitment to reach net-zero emissions by 2030. The metrics will be used for all the QE projects to analyze their performance.
MS-Excel | DDx
1.
Monthly
Comments
Date (MM-YYYY) kWh kBtu kWh kBtu
Months (per Year):
Year:
Annual Energy
Note: Months (per Year):
client
Post-Project
Grid Solar
Date (MM-YYYY) kWh kBtu kWh kBtu Jan-13 495763.47 Jan-17 484398.25 16065.85 Feb-13 468160.56 Feb-17 421395.52 26698.56 Mar-13 513516.24 Mar-17 460012.72 38861.44 Apr-13 337614 Apr-17 360119.4 43015.44 May-13 305844.85 May-17 363159.73 43532.87 Jun-13 347853.3 Jun-17 361160.1 53627.04 Jul-13 407631.71 Jul-17 415486.18 47958.18 Aug-13 391875.03 Aug-17 421351.38 47992.96 Sep-13 364565.4 Sep-17 11450.67 40110.03 Oct-13 322184.86 Oct-17 359003.87 31541.85 Nov-13 416782.5 Nov-17 374078.1 23459 Dec-13 508101.47 Dec-17 494590.74 18401.56
OR input the Yearly data below:
kWh 0 1,429,796
Year:
Annual Energy
OR input the Yearly data below:
kWh 0 1,326,167 0 126,359 mWh 0 1,430
mWh 0 1,326 0 126 kBtu
4,526,207
Comments
Carbon
Electricity Calculations
Date (MM-YYYY)
Carbon
20,020
Date (MM-YYYY)
Jan-13 1430499.96 Jan-17 162711.99 Feb-13 1812599.88 Feb-17 123611.99 Mar-13 1507199.85 Mar-17 129162 Apr-13 296000.01 Apr-17 46380 May-13 46700.01 May-17 58391.01 Jun-13 37700.01 Jun-17 28418 Jul-13 31200.01 Jul-17 25288 Aug-13 32500 Aug-17 36001.01 Sep-13 37100.01 Sep-17 33560.01 Oct-13 228699.99 Oct-17 62136 Nov-13 1119699.9 Nov-17 172881.99 Dec-13 1589799.97 Dec-17 368094
Gas Calculations
Input Calculations Autofill Final Result
0 0
0
0 4,879,893 0 0 kBtu 0
0 431,265 Total kBtu Total kBtu zip 20,020 20,020 zip
20,020 x 653 653 x 653 653 Lbs 0 932,942 Lbs 0 865,324 Total Lbs Total Lbs
N/A 932,942 x= Pounds CO2 per mWh (Lbs mWh) ; for value of x: refer the link N/A 865,324 x= Pounds CO2 per mWh (Lbs / mWh) for value of x: refer the link
Note: Do not change the formulas ! Co2 = x Lbs/mWh https://www.epa.gov/egrid/power-profiler#/ 1 mWh= 1000 kWh 1 kWh= 3.413 kBtu 4,879,893 0 Grid Solar
Data to be gathered from the
4,526,207 431,265
Check the source of energy and units before entering the data. 2. Fill in the Solar data, if applicable. Please
Electricity
Cell Type: Input Calculations Autofill Final Result Key: Links: Notes / Comments Notes / Comments
Therms kBtu Therms kBtu
Therms kBtu Therms kBtu
Year: Year: Therms 0 81,717 0 0 Therms 0 12,469 0 0 kBtu 0 8,169,700 0 0 kBtu 0 1,246,636 0 0 million Btu 0 8169.6996 0 0 million Btu 0 1246.636 0 0 Total kBtu Total kBtu x 117 117 139 139 x 117 117 139 139 Lbs 0 952995.45834 0 0 Lbs 0 145420.0894 0 0 Total Carbon Total Carbon Carbon x= Pounds CO2 per million Btu for value of x: refer the link 145,420 Monthly data to be gathered from the client Gas Natural Gas Propane OR input the Yearly data below: Annual Energy Natural Gas Propane 8,169,700 952,995 OR input the Yearly data below: Gas Carbon Annual Energy x= Pounds CO2 per million Btu for value of x: refer the link Note: Do not change the formulas ! Co2 = x Lbs/ million Btu https://www.eia.gov/environment/emissions/co2_vol_mass.php 1 kWh= 99.976 Th 1 millionBtu= 1000 kBtu Pre-Project Post-Project Please Note: 1. Check the gas type and units before filling the data. 2. Check the value for x if there is different type of gas. Months (per Year): Months (per Year): 1,246,636
[ ]
Project: Firm: Brief: Tools:
Energy
Pre-Project
Values autofilled from the energy and gas calculations
Energy from
Post-Project
Do
Carbon Carbon
from
Carbon
& Carbon Calculations
from
Carbon
Cell Type: Input Calculations Autofill Final Result Key: kBtu 4,879,893 0 kBtu 4,526,207 kBtu 8,169,700 0 kBtu 1,246,636 kBtu 13,049,593 kBtu 5,772,843 Area 156,000 Area 156,000 kBtu / SF / Yr 84 kBtu / SF / Yr 37 Lbs 932,942 0 Lbs 865,324 Lbs 952,995 0 Lbs 145,420 Lbs 1,885,937 Lbs 1,010,744 kBtu 0 0 kBtu 431,265
Electricity
from Gas Total Energy EUI Energy from Electricity
Total
Energy from Gas Total Energy EUI Carbon from Electricity Energy saved due to Solar Energy saved due to Solar
not change anything on this page.
Note: Do not change the formulas ! EUI= Total Annual Energy / Area Total
Carbon
Gas EUI EUI
Carbon
Electricity Carbon from Gas EUI
04 | POE Metrics
Location: Studio: School: Brief: Tools:
Mercurial Mobile
Studio
Philadelphia, PA Material & Structural Intelligence
MSD-EBD | Semester I | 2021 Weitzman School of Design University of Pennsylvania, PA Done in collaboration, the studio focuses on material and structural system exploration. The design attempts to create a well-shaded space for food-truck customers which complements the dynamic behaviour of the food trucks while providing an architectural intervention which embeds into their body while being flexible in form as well as purpose.

Rhino | Grasshopper | Photoshop
Perspective View
Metal Ring Plastic Encasing Fabric Pockets


Isometric View


05 MSI
[ ]
Front Elevation
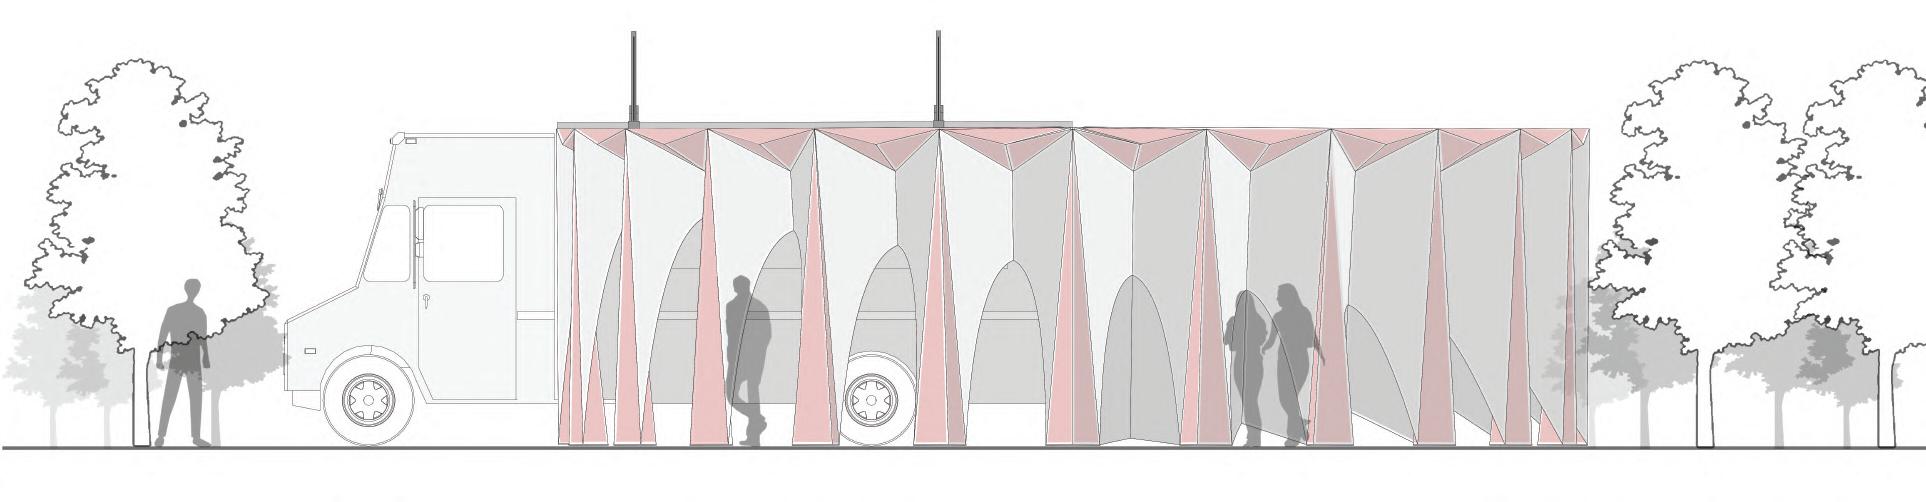

Side Elevation


Control System Open Position Control System Closed Position Control System Detail View from inside 2.4 m 05 | Mercurial Mobile
Course: School: Brief: Tools:
Analytic
Architecture Envelopes
Architectural Envelopes
MSD-EBD | Semester II | 2022 Weitzman School of Design University of Pennsylvania, PA Done in collaboration, the objective of the project was to compare the envelopes of two existing projects on the basis of the climate, materials and tectonics. The comparison was presented in the form of an essay along with analytical drawings of these projects, which highlights the three points of comparison using three different scales.

Handsketching | Illustrator
Min Tu Won School, Thai-Burma Border
06
[ ]
Jetavan Spiritual Center, Sakharwadi, India

06 | Analytic
Material Flow07
EBD Research Studio
Location: Studio: School: Brief: Tools:
Sankey Diagram showing the building material flowPhiladelphia, PA EBD Research Studio | MSD-EBD Semester III | 2022 Weitzman School of Design University of Pennsylvania, PA Done in collaboration, the current studio project aims towards adaptive reuse of one of the unversity dorms, Sansom West, Philadelphia. The goal is to design a Living Lab with the focus on adaptation to climate change.

The second phase of the research studio was to dissect the building and my team’s scope was to study the material flows.
Revit | Excel | SankeyMatic | Miro
Emergy Diagram for all the material inflows and outflows

[ ]
Operable Envelopes08
EBD Research Studio

Location: Studio: School: Brief: Tools:
Philadelphia, PA EBD Research Studio | MSD-EBD Semester III | 2022 Weitzman School of Design University of Pennsylvania, PA Done in collaboration, the current studio project aims towards adaptive reuse of one of the unversity dorms, Sansom West, Philadelphia. The goal is to design a Living Lab with the focus on adaptation to climate change.
The third phase of the research studio is ongoing and the proposal challenges the conventional envelope systems by making them more adaptible and thus increasing the adaptive capacity of the buildings. Rhino | Revit | | Miro | Illustrator
[ ]
As humans change their clothes to adapt to different conditions, building envelopes should also be dynamic and should be controlled by occupants to fit the fluctuating environmental conditions.

By designing operable envelopes with reusable and compostable materials, we can promote sustainability, human satisfaction and adaptation to climate change
Naked Concrete Building

EWTest Bed for Different Orientations

Dry Bulb temperature Hot Summers and Cold Winters

SN
Concept 08 | Operable Envelopes


The Living Lab 08 | Operable Envelopes
Other Works09 VBT Consortium | Internship
Project:
Dr. Sharan Patil’s Weekend Home Bengaluru, India VBT Consortium, 2018
A luxurious weekend home for a family based in Bengaluru, with an aim to blur the boundaries between the exterior and the interior spaces.
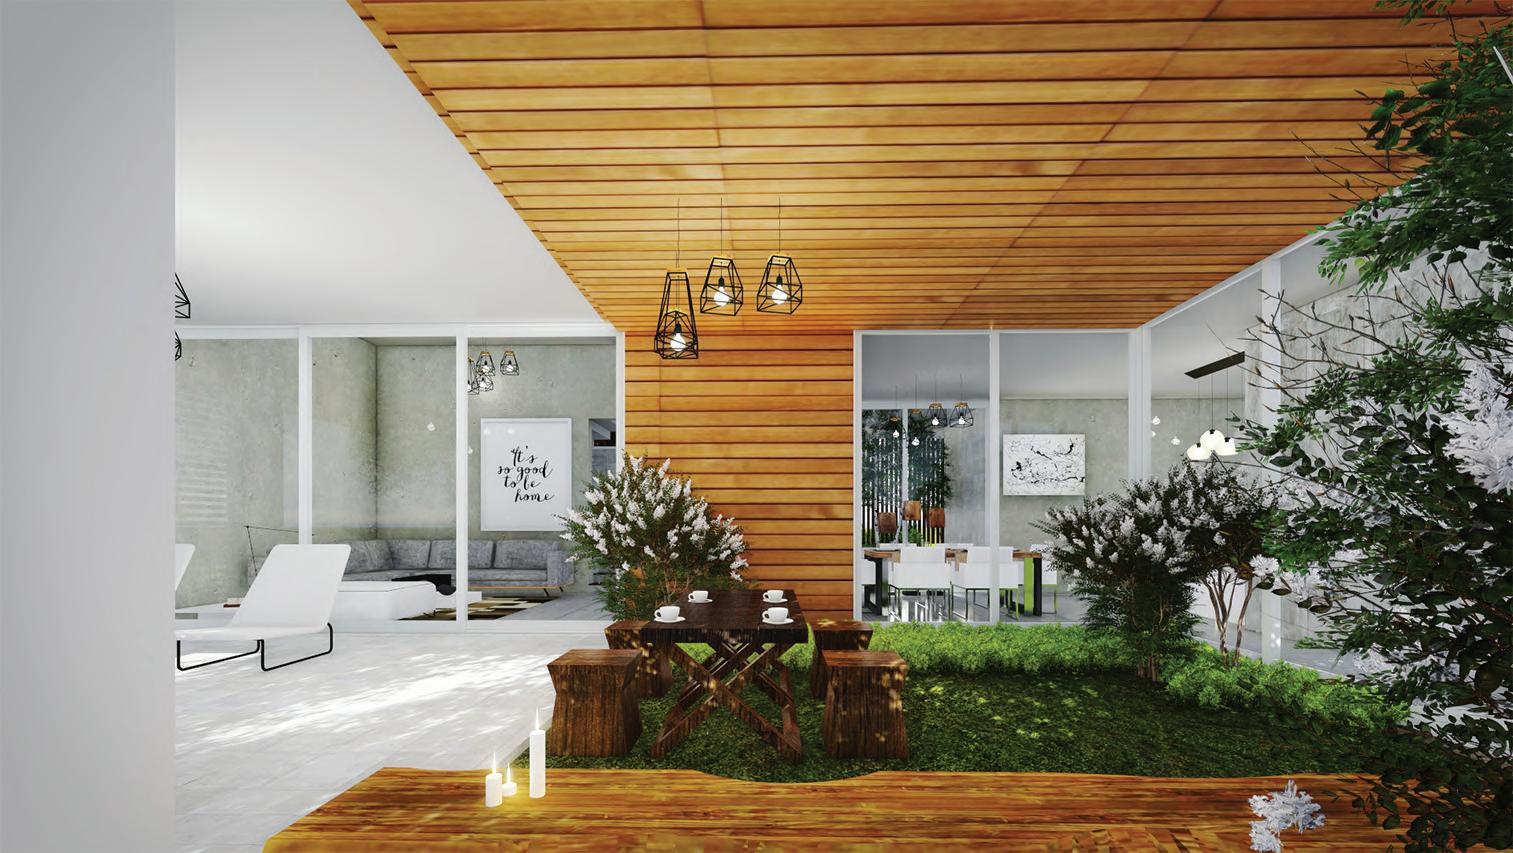


Autocad | Sketchup | Lumion Photoshop

 Front View
Night View
Landscapes
Living area overlooking the landscape
Outdoor seating surrounded by Water body
Front View
Night View
Landscapes
Living area overlooking the landscape
Outdoor seating surrounded by Water body
[ ]
Location: Firm: Brief: Tools:
Other Works09 Design Studio
Project: Location: Studio: School: Brief: Tools:
Business Hotel Indore, India Design Studio | Architecture Semester VII | 2017 School of Architecture IPS Academy, India Done independently, the goal of the project was to design a luxurious hodpitality space where business meets pleasure, a 200 keyed hotel which promises a vibrant, enriching and intimate experience to the global travel. Sketchup | Autocad | Revit Lumion | Photoshop


Side Elevation
Section Section
Front View
Front Elevation
[ ]
Other Works09 Design Studio
Project: Location: Studio: School: Brief: Tools:
Nursing Home Ujjain, India Design Studio | Architecture Semester IV | 2016 School of Architecture IPS Academy, India Done independently, the goal of the project was to design a 50 bedded health care solution which includes accomodation for the host doctor and specialists. Hand-drawn | Hand-rendered

Front View
Site Plan | Ground Floor Plan

[ ]
THANK YOU
Tanushree Chowdhary | +1 267 901 8341 tanu1996@design.upenn.edu
