UsingData todriveschoolchange


Tanishia Lavette Williams, PhD

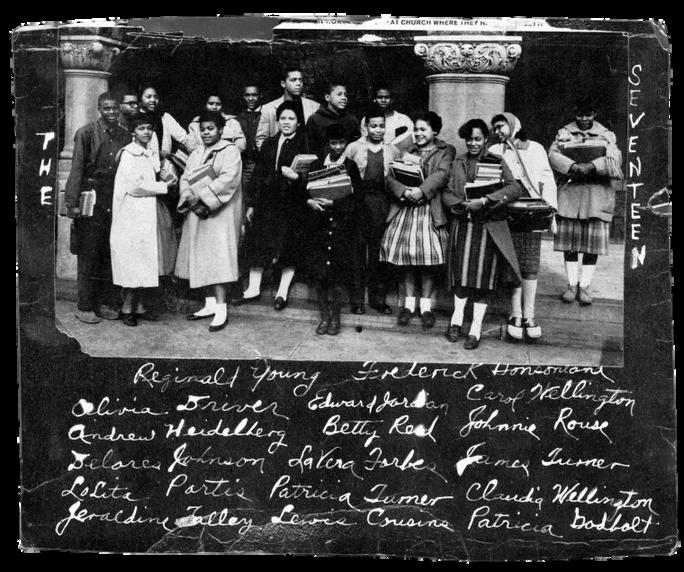

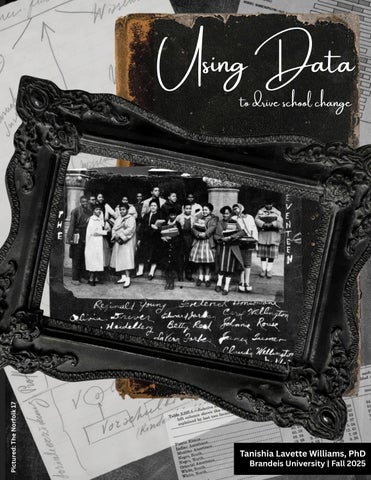
In February 1959, seventeen Black students integrated six all-white middle and high schools in Norfolk, Virginia, after a protracted battle against Massive Resistance policies that had closed schools to avoid desegregation. These students, later known as the Norfolk 17, faced daily harassment, hostility, and isolation, yet their courage marked a pivotal moment in the struggle to uphold Brown v. Board of Education and advance educational equity. Their presence in classrooms symbolized both the power of youth in driving change and the role of data—attendance, test scores, and enrollment numbers—in shaping debates over who had access to education.
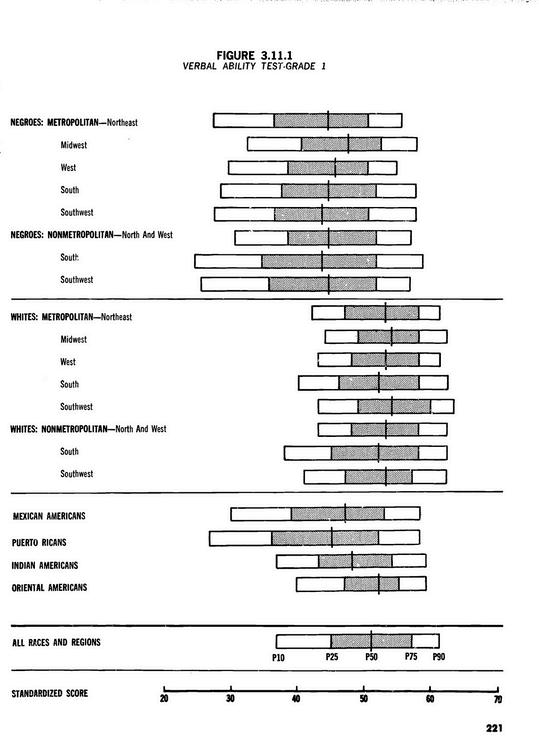
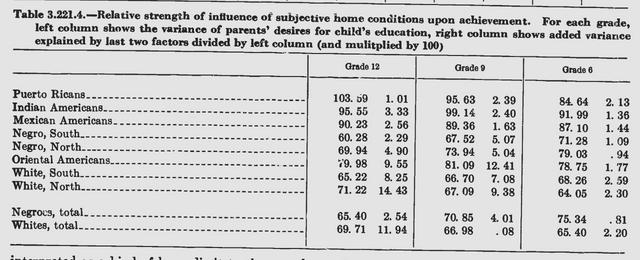
Published in 1966, the Coleman Report (Equality of Educational Opportunity) marked a turning point in how data was used to define, and attempt to solve, educational inequity. Commissioned by the Civil Rights Act of 1964, the report compiled responses from over 600,000 students and teachers in nearly 4,000 schools across the United States. Its sweeping statistical analyses concluded that a student’s family background and peer group had more influence on academic outcomes than school resources themselves a finding that sparked both controversy and decades of policy experimentation. While often cited for de-emphasizing the role of schools, the report also introduced quantitative measures of racial disparities in achievement, funding, and facilities, laying the groundwork for future accountability systems. As a data artifact, the Coleman Report is not just a study; it is a reflection of the questions a nation chose to ask, the limits of what was measured, and the policies those numbers were used to justify.

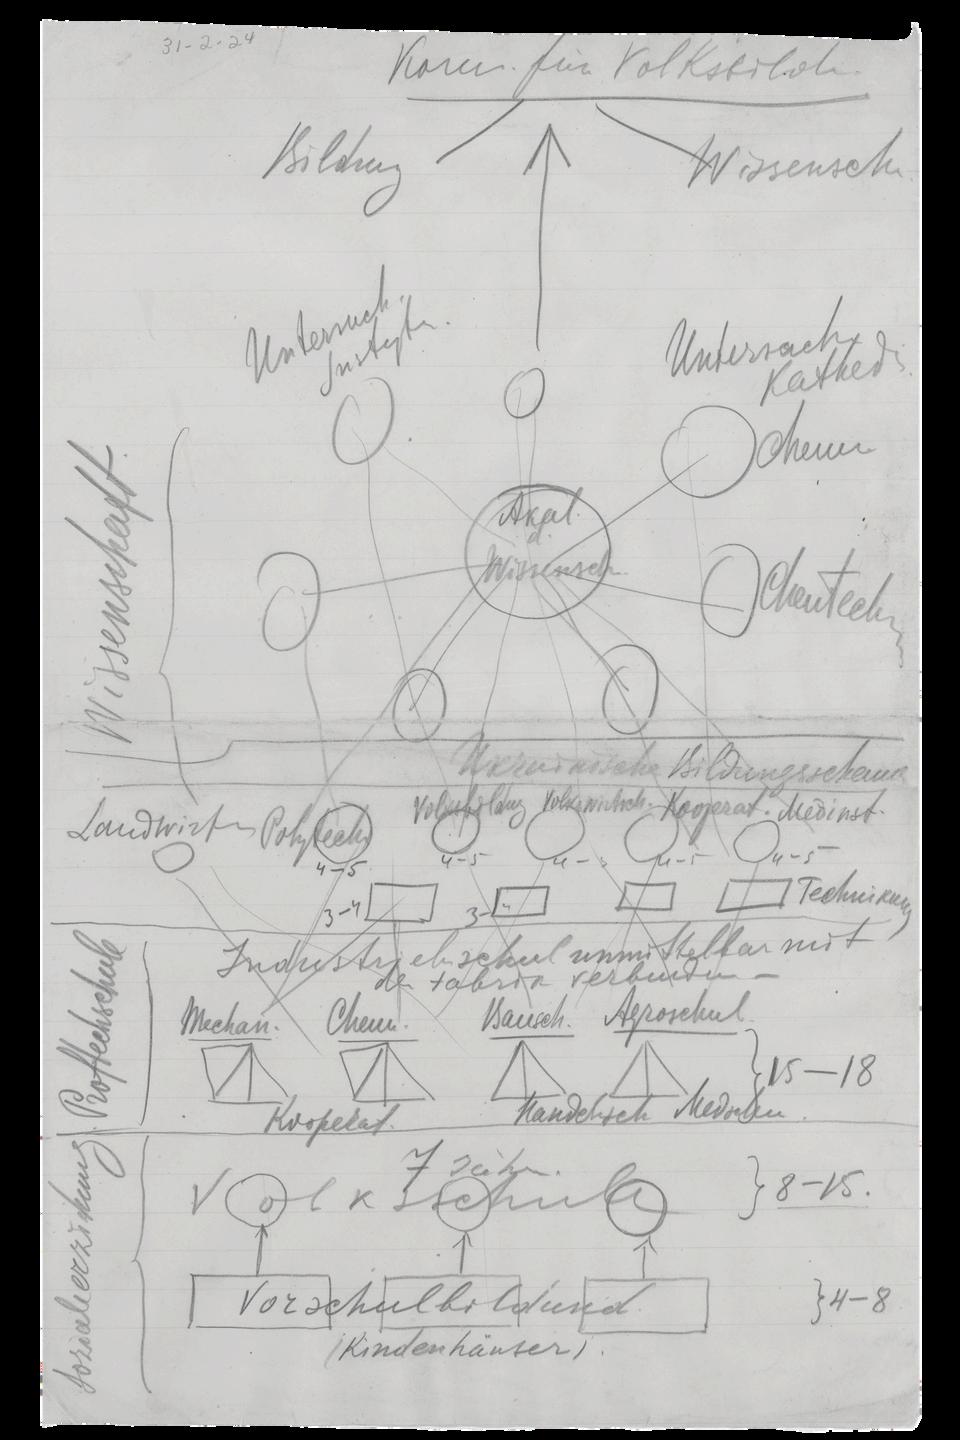
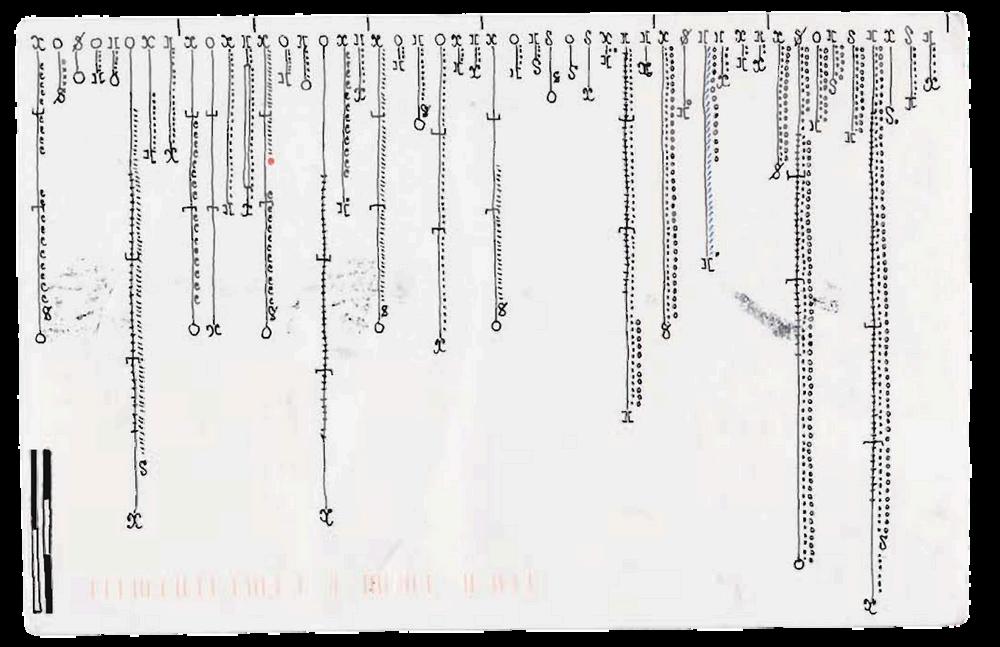
While studying in Germany in the early 1890s, W.E.B. Du Bois developed a series of intricate, hand-drawn diagrams exploring the structures and stratifications of knowledge. These hierarchies of learning sketched in pencil and ink—offered an early glimpse into Du Bois’s lifelong interrogation of education as both a vehicle for liberation and a site of exclusion.
CourseDescription
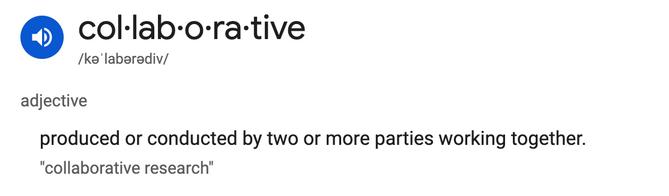
Using Data to Drive School Change invites students to interrogate the ways data can both illuminate and obscure the realities of teaching, learning, and schooling. Positioned at the intersection of educational practice, policy, and equity, this course equips emerging teacherleaders with the analytical tools, reflective dispositions, and collaborative protocols necessary to make data a catalyst for meaningful change.
Rather than treating data as neutral, students will critically examine the social, political, and cultural contexts in which data is collected, analyzed, and acted upon. Through case studies, protocols for looking at student work, and engagement with multiple forms of evidence, including standardized test scores to qualitative narratives, students will practice translating data into insights that advance student learning and strengthen instructional practice.
At the same time, the course challenges participants to consider how data has historically been used to reinforce inequities and how teacher-leaders might reframe its use to build inclusive, culturally responsive, and justiceoriented school communities.
By the end of the course, students will have cultivated a deeper understanding of how to lead with data, not as a tool of compliance, but as a vehicle for reflection, collaboration, and transformation in their schools.
Learning Goals
Develop Data Literacy for Leadership
Build foundational skills in collecting, analyzing, and interpreting multiple forms of data (including student work, assessments, and qualitative evidence) in order to make informed decisions that strengthen teaching and learning.
Interrogate Power and Positionality in Data
Examine how race, class, gender, and other dimensions of identity influence both the production and use of data in schools. Question how data has historically been weaponized against marginalized communities and explore more just alternatives.
Strengthen Collaborative Practices
Engage in Professional Learning Community (PLC) protocols and other collaborative routines to use data as a tool for inquiry, reflection, and collective improvement rather than compliance.
Apply Data Across Levels of School Change
Analyze how data functions at multiple levels (classroom, school, district, and policy) and how teacher-leaders can strategically leverage evidence to impact student learning and organizational culture.
Cultivate Culturally Responsive Data Practices
Learn to frame, collect, and interpret data in ways that are sensitive to cultural context and reflective of the lived experiences of students and families.
Develop Reflective and Critical Thinking Skills
Practice turning raw information into meaningful insights through cycles of inquiry, case study analysis, and critical reflection.
Design for Equity and Transformation
Translate data insights into action plans that address inequities, promote culturally responsive pedagogy, and foster more inclusive and just school environments.
Enhance Communication and Facilitation Skills
Strengthen the ability to lead data conversations, present findings clearly, and facilitate difficult dialogues with colleagues around evidence, equity, and change.
Prepare for Real-World Application
Equip yourself with practical strategies to use data as a lever for continuous improvement and to advocate for school policies and practices that support all learners.
A
Academic Honesty
You are expected to be familiar with, and to follow, the University’s policies on academic integrity. You are expected to be honest in all of your academic work. Please consult Brandeis University Rights and Responsibilities for all policies and procedures related to academic integrity. Allegations of academic dishonesty will be forwarded to Student Rights and Community Standards. Sanctions for academic dishonesty can include failing grades and/or suspension from the university. Citation and research assistance can be found on the university library website.
Accommodations
Brandeis seeks to create a learning environment that is welcoming and inclusive of all students, and I want to support you in your learning. If you think you may require disability accommodations, you will need to work with Student Accessibility Support (SAS). You can contact them at 781-736-3470, email them at access@brandeis.edu, or visit the Student Accessibility Support home page. You can find helpful student FAQs and other resources on the SAS website, including guidance on how to know whether you might be eligible for support from SAS.
If you already have an accommodation letter from SAS, please provide me with a copy as soon as you can so that I can ensure effective implementation of accommodations for this class. In order to coordinate exam accommodations, ideally, you should provide the accommodation letter at least 48 hours before an exam.
Learning Expectations
I recognize that students in this program are working professionals balancing multiple responsibilities. This course has been designed with intentional spacing, a week between most sessions, to provide time for reading, synthesis, and reflection away from class meetings. To support balance with professional responsibilities, students are expected to use the time between sessions for readings, written assignments, preparation for discussions, and other course activities.


Student Hours and Communication
Held virtually, student hours occur by appointment. Students are encouraged to email the professor with any questions or if they cannot find a suitable time to meet using the provided link.
Attendance and Lateness Policy
Class activities are designed to be completed in real time. Absence from class results in an inability to contribute to class discussion and a reduction in participation points. Unavoidable, emergency, unforeseen, and scheduled class absences should be discussed with the professor to determine suitable arrangements for recouping participation points.
Student Support
Brandeis University is committed to supporting all our students so they can thrive. If a student, faculty, or staff member wants to learn more about support resources, the Support at Brandeis webpage offers a comprehensive list that includes these staff colleagues you can consult.
Course Materials
The course readings include a diverse range of multimedia sources such as journal articles, research working papers, policy briefs, book chapters, and news articles. To ensure that all students can access the required materials without financial burden and to promote a fair and inclusive learning environment, links are provided to all mandated course resources.
Library Services
The Brandeis Library collections and staff offer resources and services to support Brandeis students, faculty, and staff. Librarians and Specialists from Research & Instructional Services, Public Services, Archives & Special Collections, Sound & Image Media Studios, MakerLab, AutomationLab, and Digital Scholarship Lab are available to help you through consultations and workshops.
Religious Observance Policy
The professor strives to support students’ observance of their traditions by allowing absence from classes for such purposes by endeavoring to ensure that examinations, written reports, oral reports, or other mandatory class assignments are not scheduled for or due on holy days and by providing ample opportunities for students to make up work missed on such occasions, without penalty. Should a student need to miss class for religious reasons, the absence will be excused. Classes missed for travel plans are not considered excused absences. Only the dates of the holidays themselves are considered excused absences. Students should communicate any religious observances at the start of the class.
Statement on Respectful Environment
Brandeis University is committed to providing its students, faculty and staff with an environment conducive to learning and working, where all people are treated with respect and dignity. Please refrain from any behavior toward members of our Brandeis community, including students, faculty, staff, and guests, that intimidates, threatens, harasses, or bullies. Please consult Brandeis University Rights and Responsibilities for all policies and practices related to a respectful environment.
CoursePolicies
Attendance and Participation
Seminar courses require consistent attendance. Students are expected to come to each class prepared to contribute to the collective synthesis of ideas and discourse. At a minimum, students should complete the weekly readings and be ready to discuss a relevant example or student artifact that connects to the themes of the session.
Reading Acknowledgments
This course provides students with a wide range of resources to deepen their understanding of the purposes and politics of data in education, drawing on multiple disciplines and racial equity perspectives. Each week’s readings include both anchor texts (required for all students) and additional materials from which students may choose based on their interests and contexts.
At the start of each class, students will complete a brief reading acknowledgment indicating which readings they engaged with and providing feedback on their usefulness. In addition, students will be asked to submit a short summary of a student artifact from their own practice or context that connects to the readings, highlighting how theory and practice intersect.
Session Discussion Canvassing and Engagement
Each week, we will synthesize the assigned readings by putting them into conversation with one another and with contemporary media. Together, we will use current events, cultural texts, and school-based examples to connect theory and data from the readings to lived realities.
Students are expected to engage actively in conversation with their peers and extend these insights to the broader digital community each week. This practice will serve not only as a collaborative note-taking mechanism but also as a way to synthesize our collective understanding and connect our learning to the communities in which we are situated.

EvaluativeElements
Session Applied Assignments
Each week, students will complete a short applied assignment aligned to the session theme. These tasks are designed to bridge theory and practice, requiring students to engage in pre-work before class (e.g., gathering materials, conducting brief observations or interviews, reviewing artifacts from their schools). Students should come prepared to share their assignments in class as part of our collaborative inquiry.
The weekly assignments also serve as building blocks for the final Data Action Plan, providing artifacts, analyses, and reflections that can be incorporated into the culminating project.
Data Action Profile
For the culminating assignment, each student will develop a Data Action Profile that demonstrates their ability to engage critically with data across multiple levels of education. The profile will be organized into six Lenses of Inquiry, each highlighting a different perspective on data:
Identity Lens – personal reflection and self-generated data
Instruction Lens – classroom-level teaching and learning data
Student Lens – individual student voice, work, and outcomes
Community Lens – school-level culture, climate, and organizational data
Policy Lens – state-level policy, assessment, or demographic data
Systems Lens – federal or national-level policy and comparative data
In each lens, students will examine both a quantitative and a qualitative form of data, considering what the data reveal, what they obscure, and how they might be used to drive action. Many components will be drafted and workshopped during class sessions to ensure scaffolding and feedback.
The completed profile should illustrate not only a command of data analysis but also thoughtful reflection on how data shapes decision-making, influences equity, and impacts the lived experiences of students and educators.
Grading Structure
Students will work toward a combined total of 2000 achievable points for all activities and assignments in this course. After each class session, students will be able to track their point accumulation.
Class Session Participation & Applied Assignments
Across the 7 class sessions, students can earn up to 1400 total points. Each session includes a combination of pre-class preparation and in-class engagement, but the exact point distribution may vary based on the demands of the week’s content and assignments.
Data Action Profile
| Due December 12 at 9PM (ET)
Students will synthesize course learning into a comprehensive Data Action Profile that applies equitycentered data practices to a problem of practice in their own school or district. The plan should integrate insights from weekly applied assignments, DIG discussions, and personal reflections.
CohortNorms
Assume best and positive intentions, with a focus on empowering peers and inviting all to collaborate (commuters and residential).

Come prepared with pre-work completed, necessary materials, and remove distractions to respect others’ time and use it effectively.
Create space for the experiences, opinions, and skill sets of others
Open communication
Listening to understand not to respond
Disagree while maintaining an inquiry stance (enter from a place of curiosity rather than judgment)
Supportively challenge each other to move “one notch further” in our learning
Acknowledge that people engage, participate, and learn differently.
“Share the air.”

Have fun, keep it interesting, and take it easy!
Be mindful of these norms in all spaces.
SessionOne FramingData forSchool Change
Histories, Possibilities, and Pitfalls
Objective: By the end of this session, students will be able to articulate multiple definitions of “data” in education, critically examine historical uses and misuses of data through an equity and justice lens, and reflect on their own experiences with data in schooling in order to surface assumptions, questions, and commitments that will guide their learning throughout the course.
Readings
Gordon, N., & Conaway, C. (2020). Common-sense evidence: The Education Leader's guide to using data and research. Harvard Education Press. Introduction. Brookfield, S. (2017). Becoming a Critically Reflective Teacher. Chapter 1.
Reading Acknowledgment
Ladson-Billings, G. (2006). From the Achievement Gap to the Education Debt: Understanding Achievement in U.S. Schools. Educational Researcher, 35(7), 3–12. Brookfield, S. (2017). Becoming a Critically Reflective Teacher. Chapter 4.
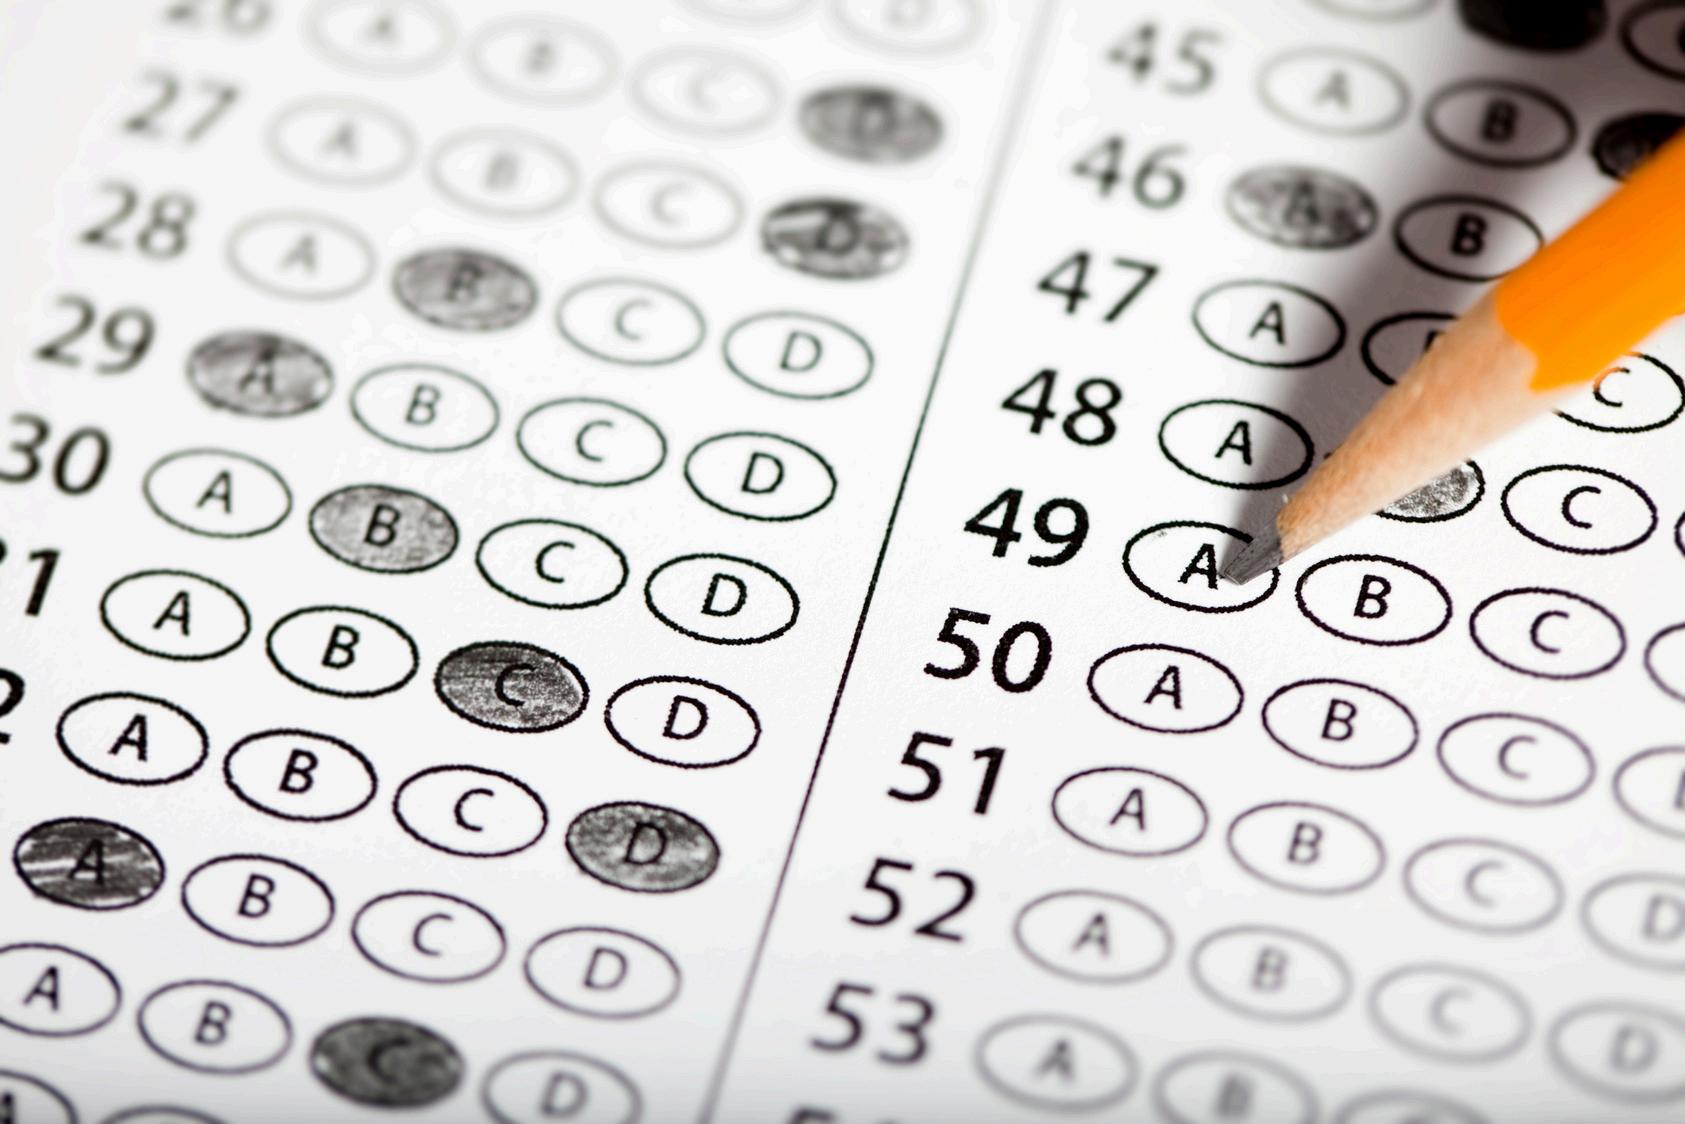

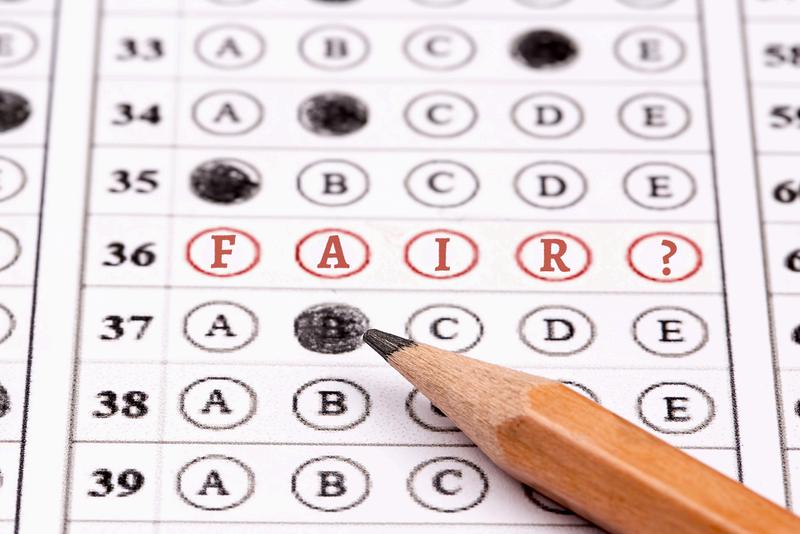
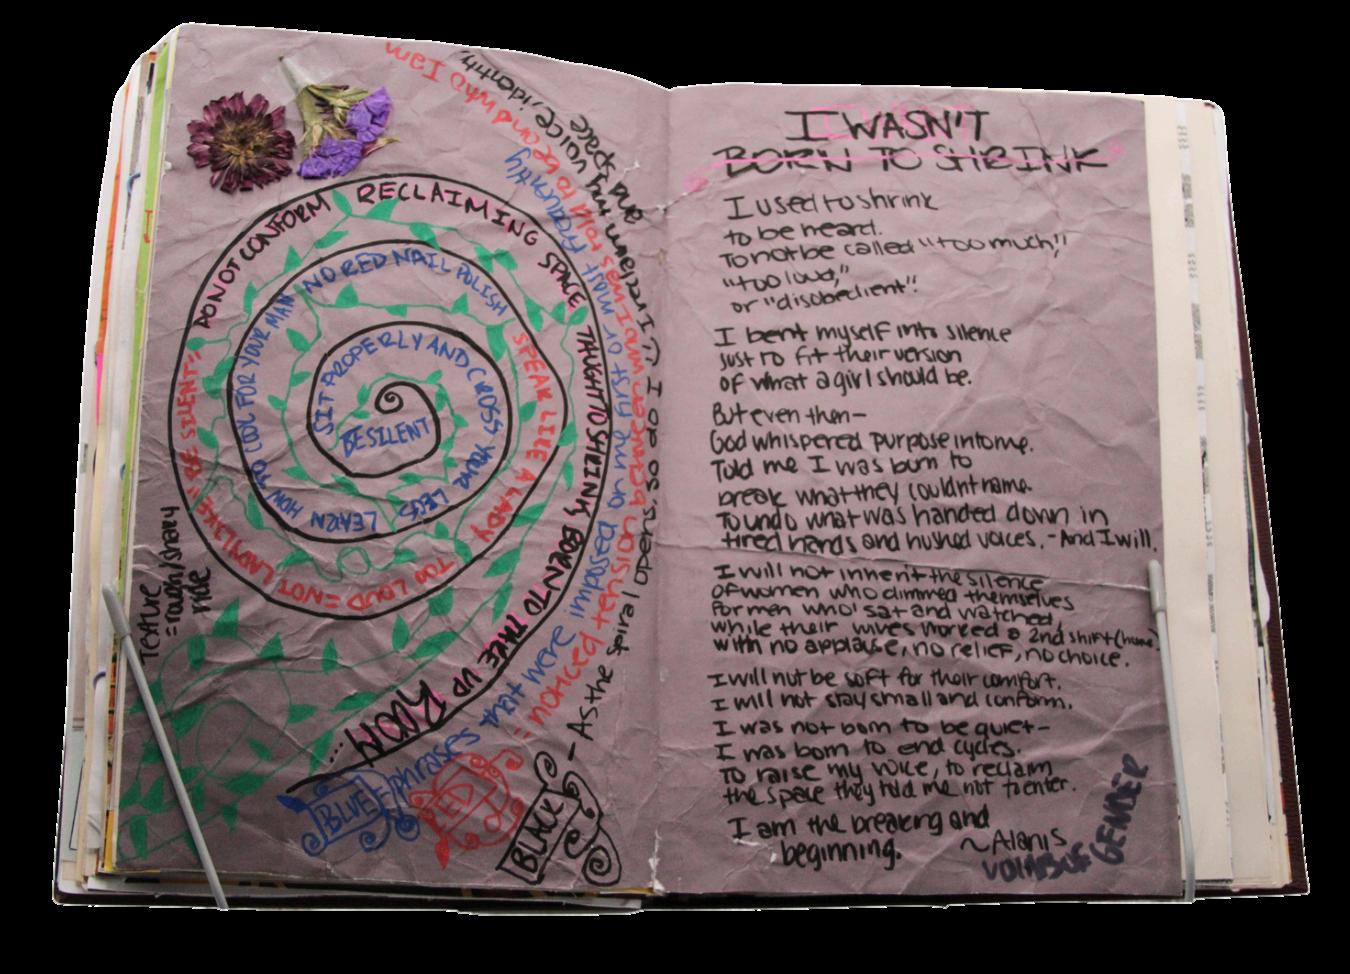
STANDARDIZED SELFIE STORY
For this session, you will create a Standardized Selfie Story. This is a short reflective snapshot of your most vivid memory of taking a standardized assessment. Think back to the circumstances surrounding that experience: How did you prepare for the test? What was the environment like on the day of the assessment— classroom setup, teacher presence, peer energy, even your own emotions? Finally, recall to the best of your ability how you performed, and how you interpreted that performance at the time. The goal is not to produce a polished essay, but to capture the personal, human side of standardized testing—what it felt like to be you in that moment, and how that experience shaped your relationship with assessments.

whom you will pr ed pr for analyzing and interpreting data. Each group will meet at least four times during the semester, using these sessions to rehearse and refine inquiry routines, test ideas, and support one another’s thinking. DIGs provide space for students to wrestle with evidence, surface assumptions, and apply identity and equity lenses to real problems of practice. By returning to the same group across multiple sessions, you will develop trust, sharpen your inquiry skills, and learn how to engage productively in cycles of collaborative data analysis.

evidence-based” pr

Assumptions & E assumptions (Br select Cona Pow dynamics. Ho as evidence in education? Practice v alignmen based decision-making?


Choose ONE of the following quick scenarios and discuss:
A district mandates a new reading program based on a “gold-standard” RCT study. How might Brookfield’s reflection help leaders interpret or adapt this evidence responsibly?
A teacher notices that students resist discussionbased learning, despite “evidence” showing its effectiveness. How would Gordon & Conaway’s broader view of evidence help in responding?


Data is information we collect to make sense of the world.


Data can be numbers, words, images, or observations. It’s always shaped by e and ext.


Evidence is not just “one study.” It is a body of information shaped by values, perceptions, and constraints.
Leaders already use data, but often unintentionally, shaped by their own cognitive biases. We notice what affirms our beliefs and dismiss what doesn’t.
Our teaching and leadership are always shaped by assumptions: paradigmatic, prescriptive, and causal.
Critical reflection requires intentionally checking those assumptions against lenses: students’ eyes, colleagues, personal experience, theory/research.
Data does not speak for itself. How we interpret data depends on our identities, experiences, and assumptions. Gordon & Conaway remind us that evidence is shaped by context and values, while Brookfield asks us to critically reflect on our assumptions and power.


DataActionProfile
What information do you trust most, and why?
What assumptions shape the way I interpret data about myself and others?

Brookfield’s Four Lenses
Students’ Eyes: Collect feedback or recall how students responded. What surprised you, or didn’t match your intentions?
Colleagues’ Perceptions: Ask trusted peers to observe or critique your decisions. They’ll often notice assumptions you take for granted.

Personal Experience:
Reflect on your own history as a student — how does it shape what feels “normal” in teaching or data?
Theory & Research: Read scholarship that frames familiar practices differently (e.g., Freire on dialogue, Ladson-Billings on culturally relevant pedagogy).

What are ways to collect this information?
Students’Eyes:Collect feedbackorrecallhow studentsresponded Whatsurprisedyou,or didn’tmatchyour intentions?
Colleagues’Perceptions: Asktrustedpeersto observeorcritiqueyour decisions They’lloften noticeassumptionsyou takeforgranted.
PersonalExperience: Reflectonyourown historyasastudent howdoesitshapewhat feels“normal”inteaching ordata?
Theory&Research:Read scholarshipthatframes familiarpractices differently(e.g.,Freireon dialogue,Ladson-Billings onculturallyrelevant pedagogy)

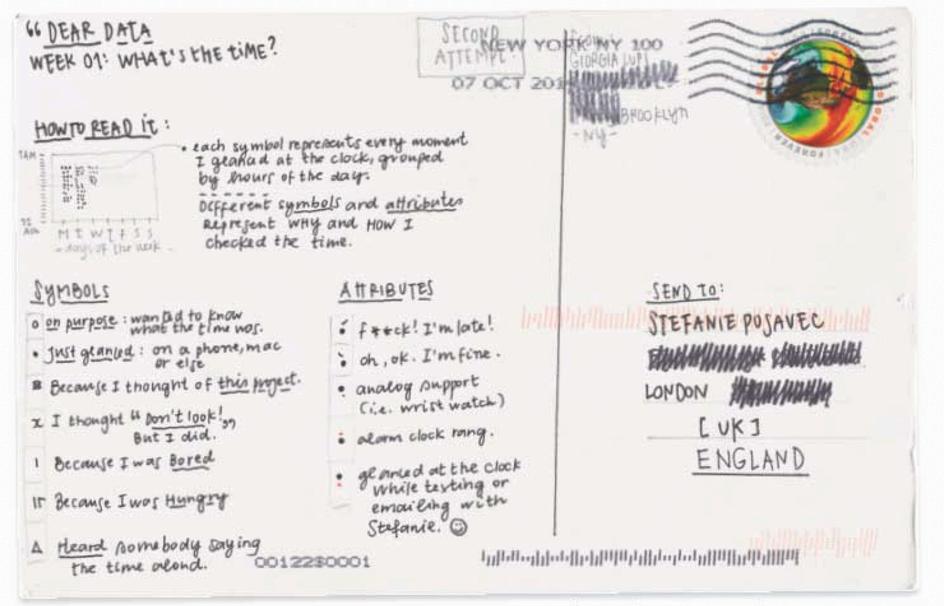
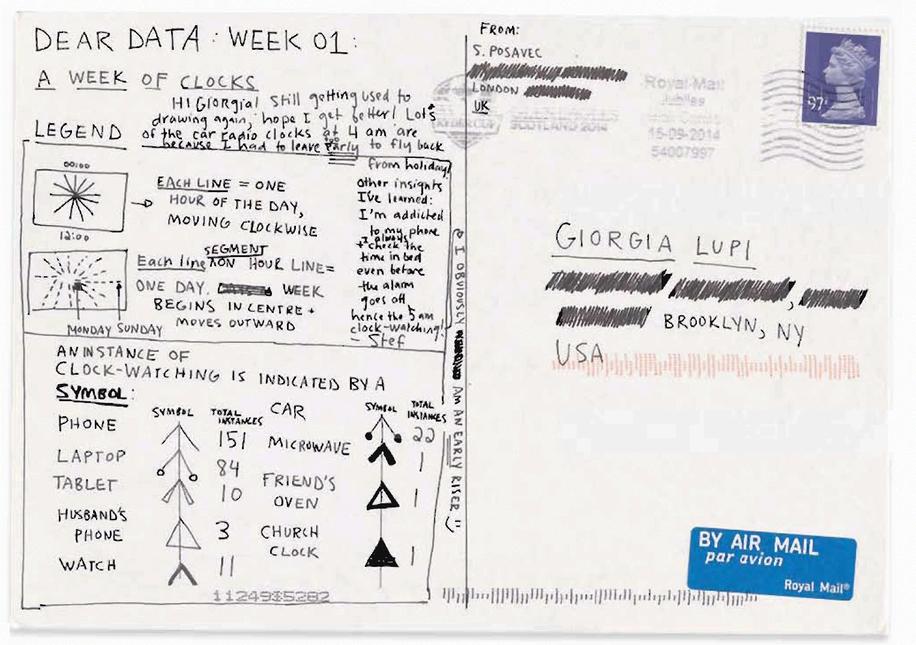
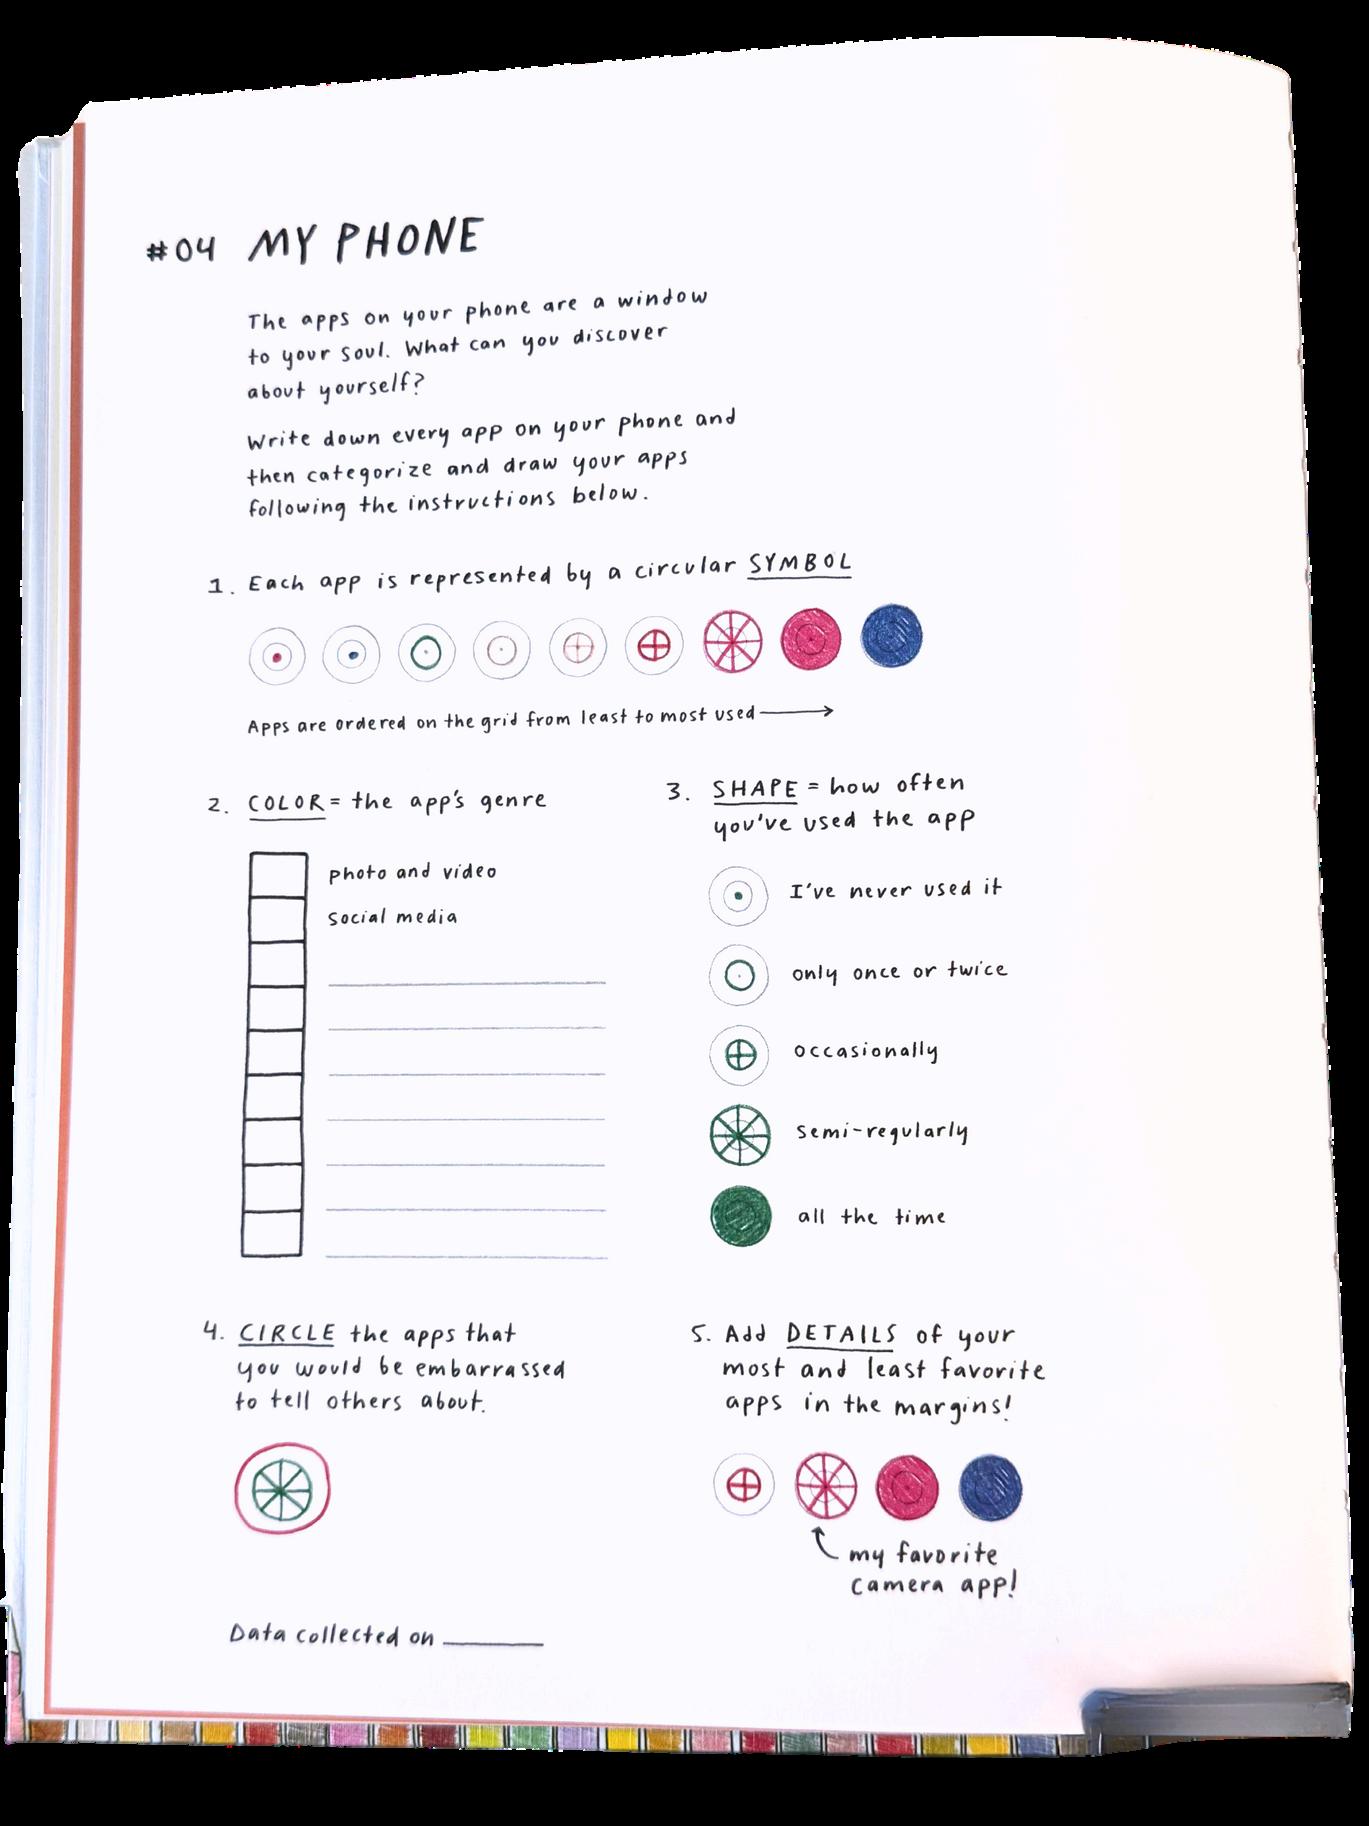
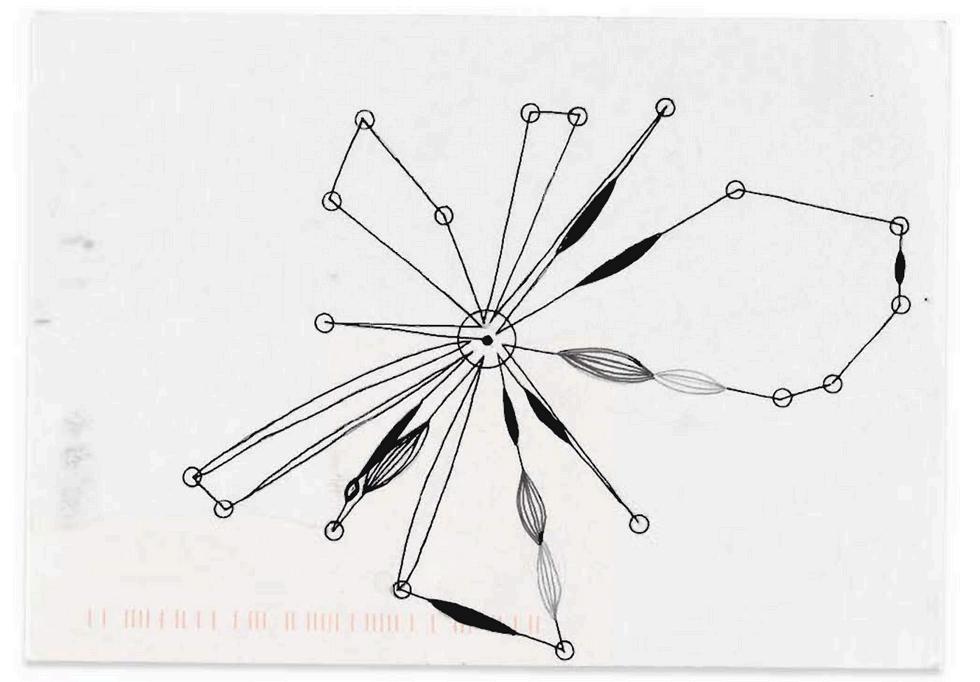
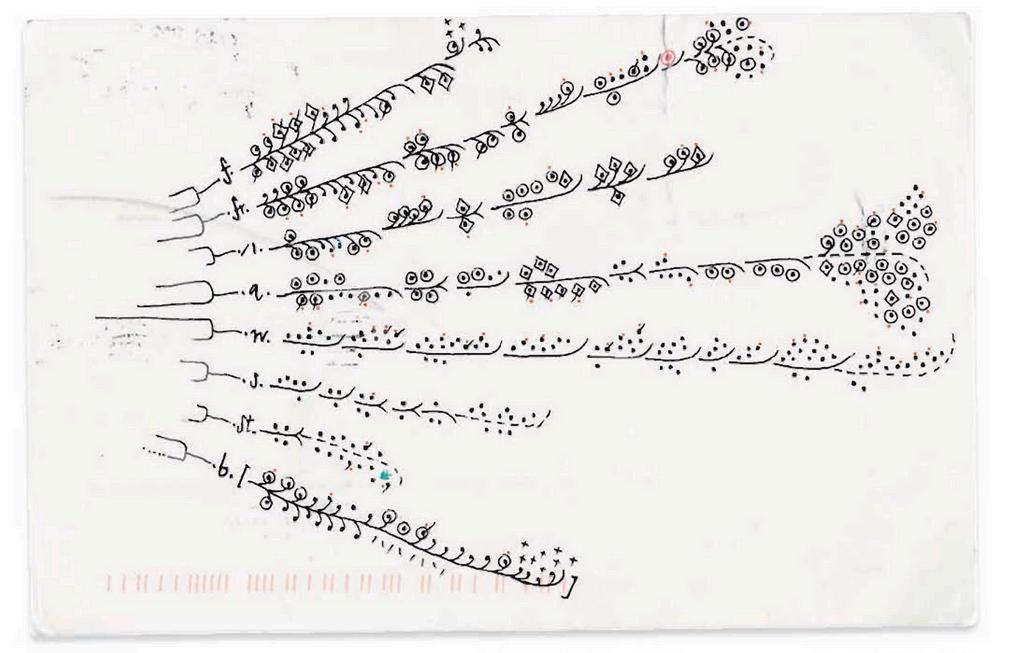
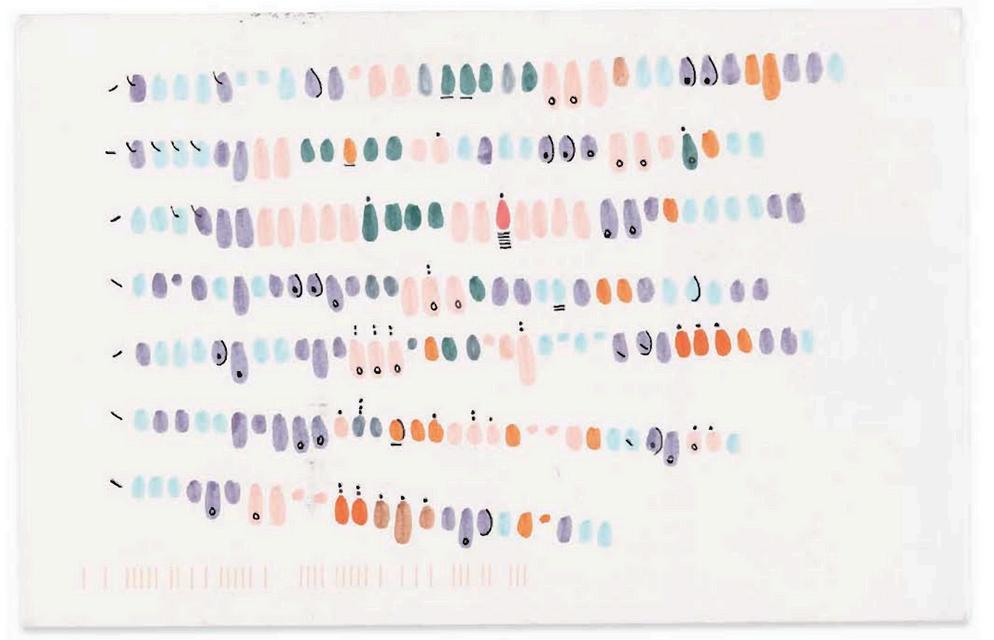
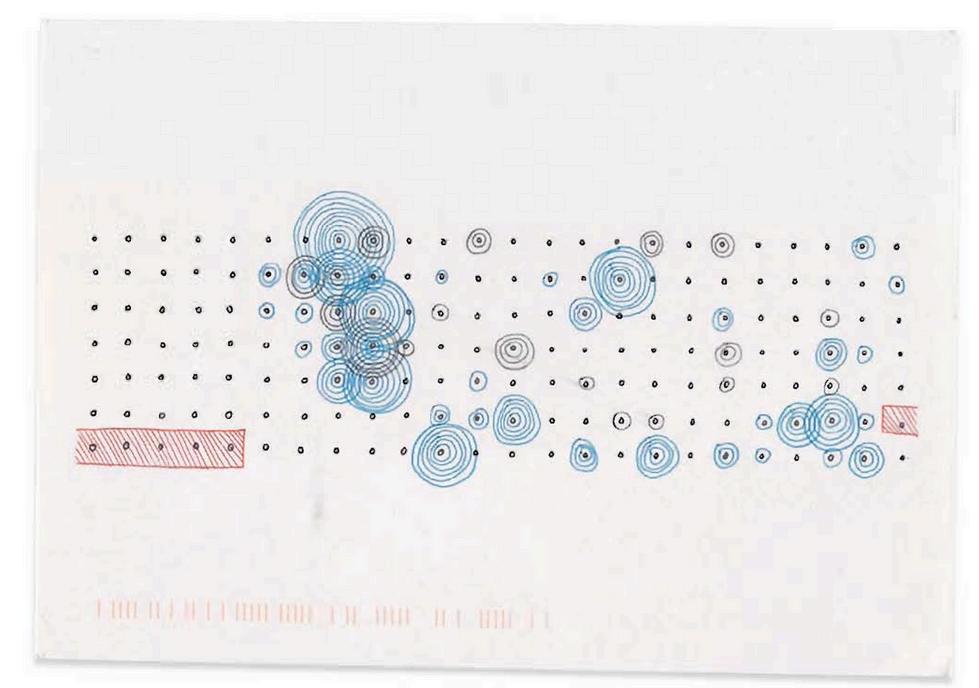
Giorgia Lupi
Data in the Work

Data in the Everyday
Data in the Person
Data in the Story
Data in the System qualitative accounts (student reflections, interviews, family voices, teacher observations).
aggregated, standardized information (test scores, graduation rates, accountability dashboards). how identity markers (race, gender, language, disability, socioeconomic status) shape and are shaped by records artifacts of learning (student writing, classroom displays, teacher notes, portfolios). the small details of school life


Refers to the raw stuff: individual pieces of information, observations, or records. Examples include one student’s attendance slip, a quiz score, a single survey response, a teacher’s note after class.

Little

The BigD
Refers to the system, narrative, or dataset built from assembling and interpreting little d data.
Examples include district-level attendance reports, state test score databases, federal datasets like NAEP. Big D is often what’s presented as “official” or “capital-D Data” in policy conversations.

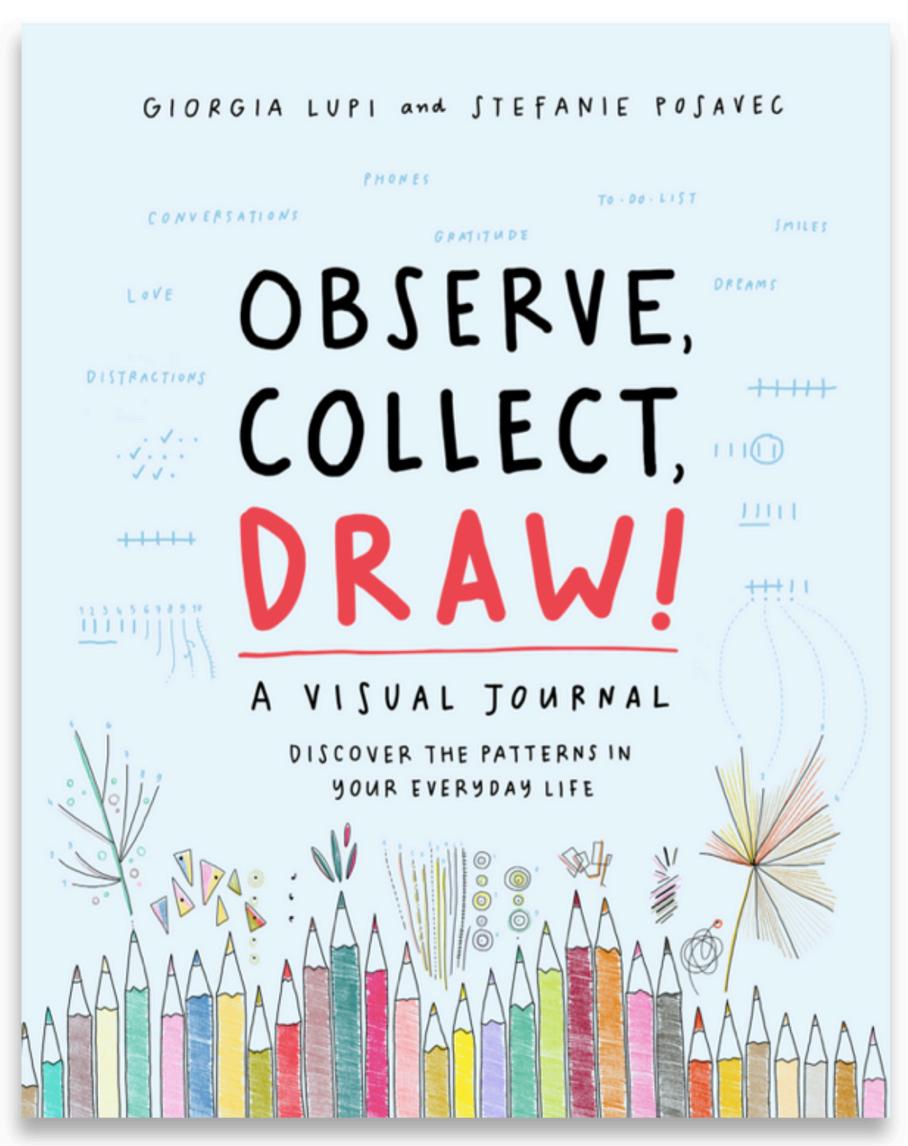
Lupi, G., & Posavec, S. (2018). Observe, collect, draw!: A visual journal: Discover the patterns in your everyday life. Princeton Architectural Press.
Why the “d” Distinction Matters

Little d reminds us that data is human, contextual, and situated in lived experience.
Big D shows how institutions aggregate and standardize those pieces into powerful categories (achievement gaps, accountability ratings, etc.).
When moving from little d → Big D, whose voices and experiences are lost, and whose are amplified?
Data is never just numbers on a page.
Data are memories, stories, and perspectives that shape how we understand learning and ourselves.
As we begin this course, remember that every piece of data carries a lens: it tells us not only about students and schools, but also about the values and assumptions of the people who collect and interpret it. Our work this semester is to practice looking through those lenses with greater clarity, care, and courage. Final Thoughts that came up in class
Data Literacy Foundations:
From Raw Information to Meaningful Evidence
Session
2
OBJECTIVE
Bernhardt, V. (2013). Using data to improve student learning in elementary school. Routledge. (Chapter 2)
Mandinach, E. B., & Gummer, E. S. (2016). Data literacy for educators: Making it count in teacher preparation and practice. Teachers College Press. Chapters 3 and 7.
Mandinach, E. B., & Gummer, E. S. (2016). Data literacy for educators: Making it count in teacher preparation and practice. Teachers College Press. Chapter 1.
Reading Acknowledgement

By the end of this session, students will be able to identify and differentiate types of educational data (quantitative, qualitative, observational, student work, and instructional materials), evaluate the principles of validity and reliability, and analyze lesson plans or textbooks as data sources to interpret how knowledge is represented and how these materials can serve as meaningful evidence of student learning.
Data Action Profile
Purpose of the Data Action Plan:
The DAP is the throughline of the course. It’s how you’ll connect our weekly concepts to your own context.
Each week, you’ll add a new “layer” of data analysis (personal, classroom, school, state, federal) to build a full profile by the end.
Think of it as a portfolio of evidence that shows not just what data exists, but how you can use it for reflection, action, and change.
By the end, you’ll have something actionable: a story of data that highlights opportunities, challenges, and possible interventions.
The Identity Lens:
Before we dive into datasets, we start with ourselves.
Each of us comes to this work with personal histories, identities, and experiences that shape how we see data.
The identity lens means asking: What aspects of my identity shape the way I view student performance, lesson plans, or test results?
Where might my experiences help me see nuance that others miss? Where might my experiences create blind spots?
Using the identity lens is not about getting the “right” interpretation, but about being aware of how our perspectives influence what we notice, value, or question in the data.
Refers to the raw stuff: individual pieces of information, observations, or records. Examples include one student’s attendance slip, a quiz score, a single survey response, a teacher’s note after class.
Little
The BigD
Refers to the system, narrative, or dataset built from assembling and interpreting little d data.
Examples include district-level attendance reports, state test score databases, federal datasets like NAEP. Big D is often what’s presented as “official” or “capital-D Data” in policy conversations.
Quantitative Data
Shows trends, comparability. Risks: flattens nuance, depends on measurement validity.
Examples: Test scores, graduation rates, and surveys with scaled responses.

/ data = truth
Qualitative Data
Captures experience and meaning. Risks: subjective interpretation, harder to generalize.
Examples: Student reflections, teacher interviews, focus groups.

Common sources/methods for collecting data

Observational data – classroom walkthrough notes, video of instruction.
Useful for describing context and dynamics.
Risks: shaped by observer’s perspective and bias.
Student work – essays, math solutions, art projects, digital products.
Evidence of thinking, process, and skill.
Risks: requires context (the prompt, scaffolds, instructions).
Instructional materials – lesson plans, textbooks, rubrics.
Reveal what knowledge is valued and how it’s represented.
Risks: show intended learning, which may differ from actual learning.


Public Transportation
is there a there there?


The Utility of Lesson and Unit Plans

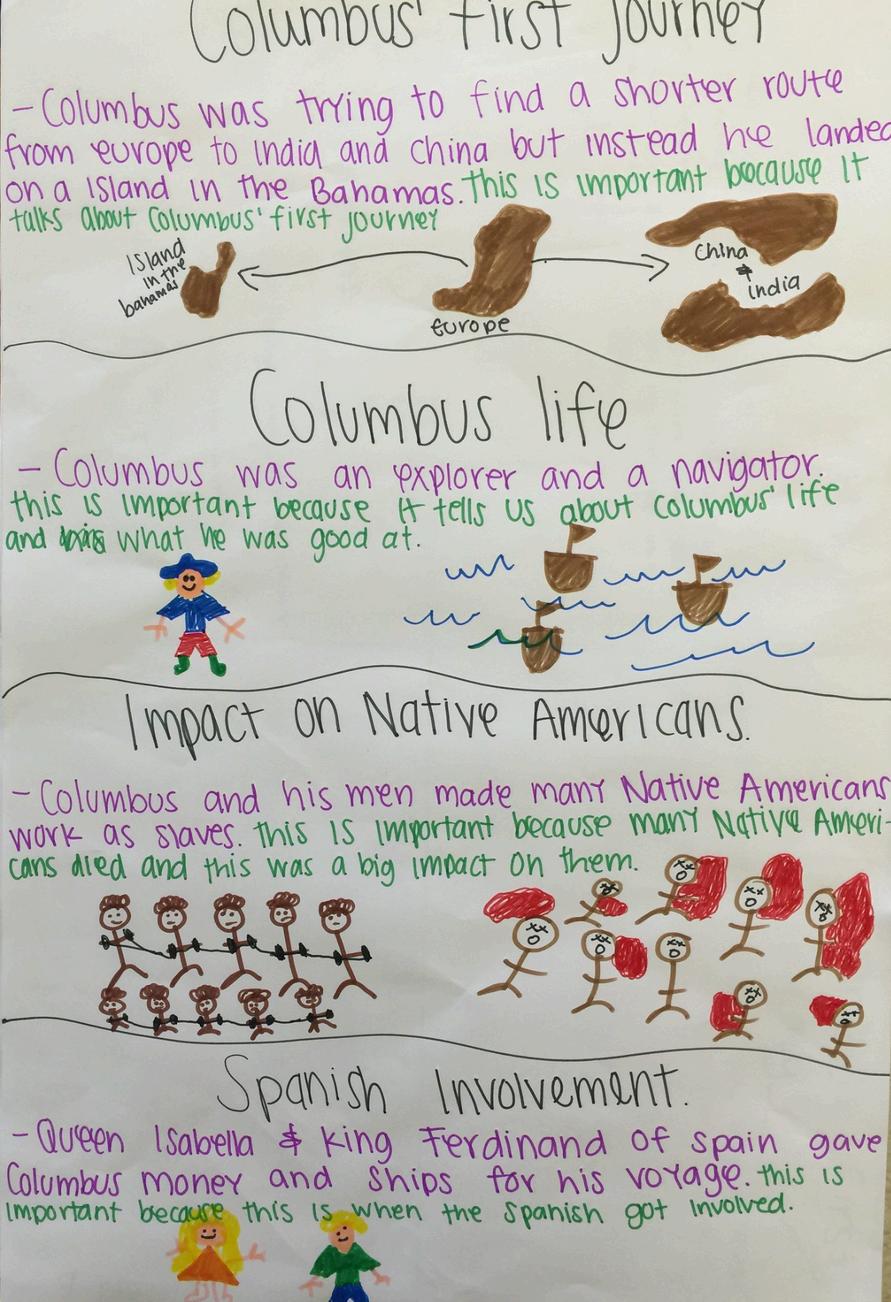
This textbook was widely used in Virginia History classrooms in the 1960s.


Data in Action: Collaborative Inquiry and Professional Learning Communities


Evidence is never neutral.
As Gordon & Conaway remind us...


Our race, gender, class, language, and lived experience shape what we notice and how we assign meaning.
Weinterpretdata throughourown assumptions.
Brookfield argues...

Your Experiences Impact
The assumptions that shape your interpretation

Lesson and unit plans show what knowledge is prioritized, how learning is structured, and which students are imagined as the audience.
Examining them reveals both the intended curriculum and the assumptions within it.


What is a Collaborative Assessment Conference?


What is the Community Assessment Conference?
A structured way to look closely at student work together
See what the work reveals about the student and implications for teaching
Suspend judgment; notice before you evaluate
Why this protocol? (3 Key Ideas)
Other perspectives helpussee whatwe might otherwise miss When we suspend judgment and evaluation, we can see more layers to learning. Student learning is layered. We often can learn more than the articulated standard.
Every piece of student work, no matter how routine, reveals something the student is trying to figure out, express, or master.
COLLABORATIVE ASSESSMENT CONFERENCE
Start with a group of colleagues
Collaborators observe and take notes on the sample
Choose a Time Keeper
Presenter shares the work (no context)
Collaborators describe what they see, avoiding judgements
Presenter takes notes
Presenter shares surprises
Collaborators make speculations and provide suggestions
Presenter responds to questions and speculations
Collaborators ask questions about the work
COLLABORATIVE ASSESSMENT CONFERENCE
Start with a group of colleagues
Choose a Facilitator
Choose a Time Keeper
Presenter shares the work (no context)
Collaborators observe and take notes on the sample
Collaborators describe what they see, avoiding judgements
Collaborators ask questions about the work
Presenter takes notes
Collaborators make speculations and provide suggestions
Presenter responds to questions and speculations
Presenter shares surprises
Group Reflection
Gratitude

Session 4
Data in Action: Collaborative Inquiry and Professional Learning Communities (Part 2)

Session Objective:
By the end of this session, students will identify what makes a Collaborative Assessment Conference distinct and reflect on how the process can enhance teacher practice and student achievement.
Collaborative Assessment Conference (CAC): Seeing Students Through Their Work

Why this protocol Exists
To systematically look at student work without judgment
To surface what the work reveals about a student’s thinking, strengths, and struggles
To expand perspective through collective interpretation
To use insights to refine instruction and deepen equity of understanding
Key Idea What it Means Why it Matters
Students use assignments to tackle problems they care about (not always the ones we assigned).
We must suspend judgment long enough to see what’s really there. We need others’ perspectives to see what we’d otherwise miss.

Student work reveals curiosity, not just compliance. Observation before evaluation.
The group creates multiple lenses.
Helps us locate student motivation. Keeps us from projecting our expectations.
Builds collective insight and equity.
Three Key Ideas
Choosing the Right Artifact: Seeing the Learner, Not the Lesson

Type of Work
Finished product (e.g., final essay, test, project)
Draft / work-inprogress
What it Shows What it Often Hides
Mastery, outcomes, adherence to task
Thought process, feedback loops, risk-taking
Student reasoning, revisions, internal struggle
Final polish
Creative / openended task
Highly structured worksheet / closed task
Multi-modal (audio, visual, performance)
Student choice, identity, values
Procedural fluency
Expression, emotion, nontextual intelligence
Clear “right answers”
Conceptual depth
Traditional literacy measures
CAC Potential
Use if annotated or if reflections are visible
Best for understanding how students think
Excellent for probing motivation and interpretation
Use selectively pair with discussion notes or reflections
Expands equity in whose learning we see
Misaligned Student Work Samples
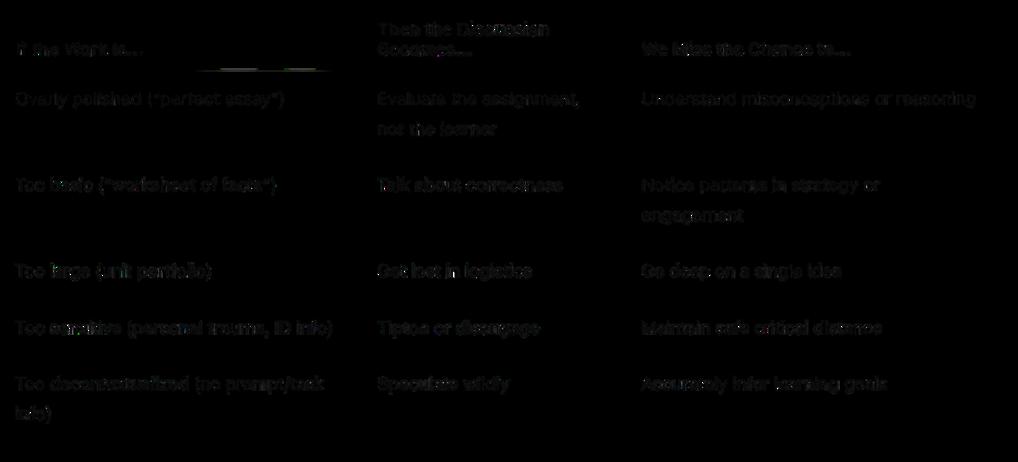

Ask yourself:
A Good Rule of Thumb
Choose work that raises questions, not just scores answers.
Does this artifact make me curious about how the student was thinking?
Could someone who doesn’t know my class still have something to say about it?
Can we see decision-making in the student’s process? Is the artifact safe and ethical to share publicly?
Sweet Spot for CAC

Strong CAC artifacts are:
Open-ended: allow multiple valid approaches or interpretations
Authentic: connect to real ideas or identities, not only school compliance
Complex enough to wonder about: provoke curiosity, not certainty
Visible thinking: include drafts, annotations, revisions, or reflections
Safe to analyze: can be anonymized without harming dignity
Situated: come from real classroom tasks, not artificial samples
The CLEE Tuning Protocol
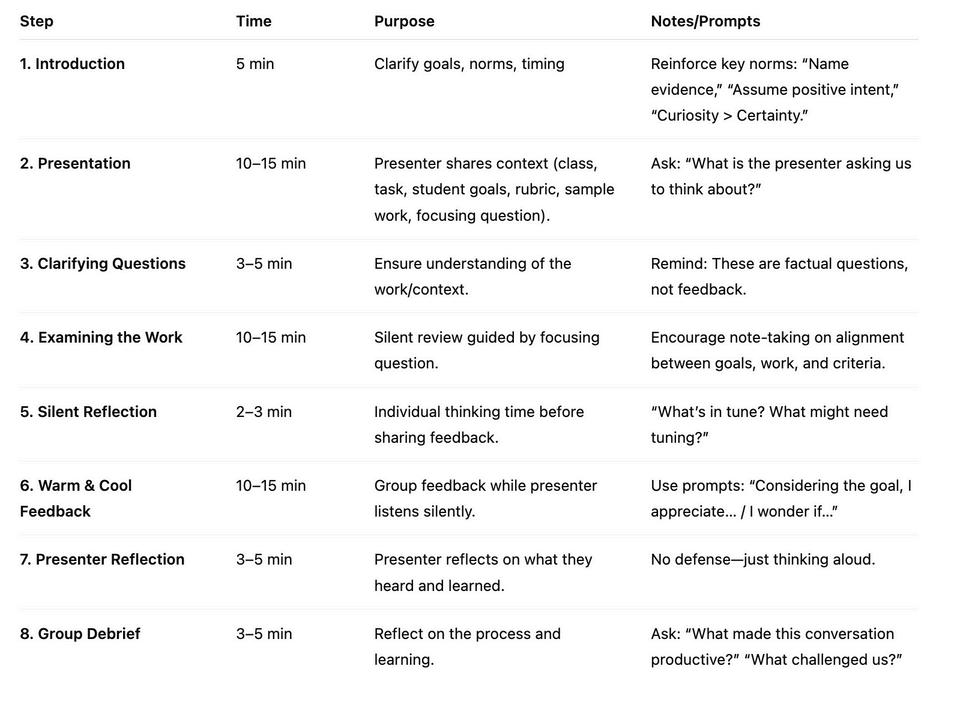
Distinguishing Tuning Artifacts
What Makes a “Good” Artifact for a Tuning Protocol?
A strong artifact invites inquiry, not judgment. It should reveal enough about student learning, task design, or instructional alignment to spark rich conversation — not just “right or wrong” answers.
The Best Artifacts:
Connect clearly to a learning goal or outcome.
The artifact should represent evidence of student thinking in relation to an assignment, skill, or standard.
Example: “Argumentative essay using primary sources to construct a claim about Reconstruction.”
Include the task and criteria alongside the work.
The Tuning Protocol depends on alignment. Providing the assignment prompt, rubric, or success criteria gives context for feedback. Without these, the group can’t meaningfully “tune” the connection between what’s taught, what’s expected, and what’s produced.
Show a range or tension.
Artifacts that feel ambiguous, unfinished, or mixed in quality generate the most productive discussion.
Example: A lab report that meets some but not all expectations; a project where conceptual thinking is strong but evidence is weak.
Are anonymized but authentic.
Remove names, but keep the authenticity of handwriting, annotations, or original layout. These details often spark insights about process
Allow for a clear focusing question.
The artifact should help the presenter pose a question like:
“How well does this student’s work reflect our goals for argumentation?”
“Where does my rubric succeed or fail in capturing what students know?”
“What does this piece suggest about how students interpret this task?”
Tuning Protocol Artifact Types
Artifact Type
Student essays or written responses
Math problem sets or constructed responses
Science lab reports or investigations
Projects or performance assessments
Student reflections, journals, or discussion transcripts
Rubrics, prompts, or teacher-created assessments
Why It Works for Tuning
Reveal reasoning, interpretation, or structure; easy to compare with rubrics.
Expose conceptual vs. procedural understanding.
Show how students connect data to claims.
Integrate multiple skills; highlight task design issues.
Possible Focusing Question
“How does this student’s argument reflect our criteria for evidence and clarity?”
“What does this show about how students make sense of proportional reasoning?”
“Does this rubric capture our expectations for scientific reasoning?”
“Does this task elicit the intended critical thinking outcomes?”
Provide insight into learning processes and voice.
“How might we better assess growth through reflective writing?”
Useful when tuning a design before implementation.
“How aligned is this assessment with our learning goals?”
Visual work (art, posters, slides)
Combine multimodal expression and content understanding.
“What criteria best capture both creativity and conceptual accuracy?”
Distinguishing CAC Artifacts
What Makes a “Good” Artifact for a Collaborative Assessment Conference (CAC)?
A strong artifact helps us see the learner — their thinking, choices, misunderstandings, and growth. It should reveal how the student is making sense of the world, not just how well they met expectations. Whereas tuning focuses on alignment between instruction and outcomes, the CAC centers interpretation — what the work tells us about the student and their learning process.
The Best Artifacts
Show evidence of student thinking.
The most productive artifacts make the student’s reasoning visible through writing, drawing, solving, annotating, or reflection.
Example: A math solution showing crossed-out work and revisions.
Example: A paragraph with margin notes or edits revealing thought processes.
Include moments of ambiguity or complexity.
Artifacts that show mixed understandings where something is partially correct, or conceptually rich but incomplete spark the richest conversation.
Example: A science explanation that blends accurate and inaccurate reasoning.
Example: A student poem or essay that reveals emotional insight but unclear structure.
Represent authentic student voice.
Look for artifacts where the student’s personality, culture, or worldview comes through Authenticity helps the group interpret not just what the student knows, but who the learner is becoming Example: Journal entries, personal narratives, self-reflections, or creative work
Are presented without initial context.
Unlike tuning, CAC begins with the artifact alone. Participants describe what they notice before hearing from the presenter about the task, student, or conditions. This preserves inquiry and minimizes bias.
Invite descriptive language rather than evaluation.
Good CAC artifacts allow participants to name patterns, ideas, or questions rather than rate performance.
“I notice the student uses repetition here what might that suggest?”
“It seems the student is trying to organize their ideas but hasn’t yet found a structure.”
Allow for empathy and interpretation.
Artifacts that make participants wonder about the learner’s intentions, struggles, or breakthroughs are ideal
Example: A reflection full of emotion but minimal detail
Example: A drawing that captures understanding in symbolic ways
CAC Protocol Artifact Types
Artifact Type
Why It Works for CAC
Possible Questions to Ask
Student writing, art, or journal entries
Reveal inner thinking, emotion, and sense-making
Drafts or revisions
Show learning in progress
“What does this show about how the student sees the world?”
Problem-solving work with notes
Displays reasoning, not just answers
“How is this student’s thinking changing over time?”
Reflections, exit tickets, self-assessments
Capture metacognition and self-awareness
“Where might this student be taking conceptual leaps?”
“What does this tell us about how the student sees their own learning?”
Feature
Differentiating the Tuning Protocol from the CAC
Collaborative Assessment Conference (CAC)
Primary Purpose
Core Orientation
Focus of Attention
To deeply understand student work or student experience without assumptions; to surface patterns, questions, and insights grounded solely in the artifact
Inquiry, description, and interpretation. Participants stay grounded in what is present in the work not what they wish were present.
The student and their thinking, experience, or approach as revealed through the artifact
Tuning Protocol
Presenter’s Role
Group’s Role
Tone of the Protocol
Present artifact and step back; does not explain or contextualize The group learns from the work itself
Describe, analyze, and raise questions that help interpret the student’s thinking; avoid judgment or advice.
Grounded, slow, descriptive, curiosity-driven.
Best Used When…
- You want to understand how a student learns, thinks, or makes meaning
To give targeted, constructive feedback on a teacher’s dilemma, unit, lesson, or student work with the presenter’s goals at the center.
Improvement and refinement. Participants help the presenter move from a dilemma to actionable next steps.
The teacher and the instructional decision, dilemma, or challenge they have brought forward
Present the dilemma, context, and goals. The presenter is active: clarifies, listens, and reflects on feedback.
Offer warm/cool feedback aligned to the presenter’s goals; generate options, possibilities, and actionable suggestions.
Problem-solving, structured, supportive, improvement-oriented.
Tuning or CAC?
A social studies teacher shares a student’s work on a persuasive essay that is deeply emotional but off-topic. The teacher wants to discuss what the work reveals about how the student understood (or misunderstood) the prompt
An instructional coach wants to examine how effectively a newly implemented project rubric distinguishes between levels of proficiency in creativity and research quality.
A special education teacher brings an annotated writing sample from a student who recently transitioned out of an IEP. The goal is to better understand the student’s strengths and needs to inform next steps.
A team leader brings samples from a new formative assessment to ask whether the task elicits the kinds of thinking it was designed to measure.
A high school art teacher brings a student’s portfolio and wants colleagues to interpret what the student’s work communicates about identity, skill growth, and voice.
A curriculum designer brings a newly developed project brief and wants feedback on the clarity, accessibility, and rigor of the design before it’s implemented.
An ELA teacher brings in several annotated close readings from students and wants to understand what the notes reveal about how students interpret figurative language.
A 7th-grade science team reviews data from a lab investigation and asks: “Are the criteria in our rubric helping us distinguish between partial and full understanding?”
A teacher leader brings in a student’s digital presentation that includes both strong visuals and weak textual explanations, and wants to explore what that suggests about multimodal learning
A history teacher wants to reflect on how well their document-based question (DBQ) task and scoring guide elicit analysis rather than summary.
Empathy Interviews
Empathy interviews are a qualitative data method that centers student voice, student perception, and student meaningmaking rather than performance indicators.
They seek to understand how students experience learning not how they perform.
They privilege stories, emotions, and personal truths that academic data typically erases.
They are about curiosity, not confirmation students are not “proving” anything.
Empathy interviews:
Reveal hidden inequities, micro-patterns of exclusion, and emotional realities that numbers mask.
Surface how identity, race, language, disability, gender, and cultural background shape academic experience.
Help teachers understand access, belonging, safety, and power core DEI indicators.
Encourage educators to unlearn assumptions and examine their own biases.
Create a data source that highlights student-defined needs, not institutionally imposed metrics.
In DEI work, we cannot assume neutrality. Listening becomes a corrective act.
Choosing a student often reveals whose voices we overlook. It also surfaces patterns of attention, bias, or disproportionate assumptions.
Identify a Student
You begin with intentional selection: Who is surfacing a wondering for you? What curiosity do you have about this student’s experience? What is missing from your current data picture? What do you not know that could transform your understanding?
Interrogating our assumptions is an equity practice. Purpose-setting helps distinguish between:
Support vs. surveillance
Inquiry vs. intervention
Listening vs. fixing
Ask Yourself:
What do you hope to learn or unlearn?
What aspect of learning do you want to understand (belonging, identity, feedback, challenge, engagement)?
What assumption are you bringing that you might be wrong about? How might this one experience reveal a broader pattern?

The process itself must avoid reproducing harm. Choice, privacy, and tone matter.
Empathy interviews use open, story-based, non-judgmental questions.
Based on the sheet, questions fall into categories:
Experience-based (“Tell me about a moment when…”)
Perspective-based (“If you could redesign…”)
Emotion-based (“What feels hardest/easiest right now?”)
Agency-based (“When do you feel most powerful…?”)
Empathy interviews differ from:
Surveys → They lack nuance and emotion.
Observations → You only see behavior, not meaning.
Academic performance metrics → They tell you what students can do, not why or how they experience it.
Disciplinary data → Often racialized and incomplete.
Empathy interviews fill in the “why” behind the data. They become the interpretive lens.