Updates and Trends in Landowner Demographics and Their Relationship with Wildlife Management
UPDATES AND TRENDS IN LANDOWNER DEMOGRAPHICS AND THEIR RELATIONSHIP WITH WILDLIFE MANAGEMENT
A TEXAS LANDOWNER SURVEY REPORT
ANGELICA LOPEZ AND DANIELA BARRIENTOS
CITATION
Lopez, A., and D. Barrientos. 2024. Updates and trends in landowner demographics and their relationship with wildlife management: a Texas Landowner Survey report. Scientific Report, Texas A&M Natural Resources Institute, College Station, TX, USA.
FIGURES
Figure
TPWD
of Texas County Map Noting Study Regions used in Describing Farms, Landowners, and their Perspectives through
Study
Figure
Figure
Figure
Figure
Figure
Figure
Figure
Figure
Figure
Figure
Figure
Figure
Figure
Figure
Figure
Figure
Figure
Figure
Figure
Figure
Figure
EXECUTIVE SUMMARY
The Texas A&M Natural Resources Institute (NRI) has been assisting Texans, landowners, agencies, and professionals for over 20 years. A signature Institute program, the Texas Landowner Survey, was developed to assess and determine landowner attitudes, behaviors, concerns, challenges and land management decisions across time. Over the last 10 years, the Survey has been used to describe landowners and their natural resources, wildlife, and land management preferences. In this report, using a variety of datasets, we describe the relationship between landowners and wildlife. We specifically describe the demographic characteristics of landowners, who comprise 1% of the Texas population yet help drive our state’s economy and steward land resources that afford Texans many nature benefits. We follow with a description and comparison of land and wildlife practices at a statewide and regional level and discuss incentives that are of interest to landowners. Below are a few highlights and action items based on report sections.
TEXANS
• To understand who benefits from Texas lands, a brief description of the Texas population is provided.
• The state population is growing and educational attainment also is improving. Texans serve in the military, have access to the internet, and help drive our economy forward.
TEXAS LAND AND OPERATIONS
• To understand what landowners do for our state, a high-level overview of Texas lands is provided.
• This report only focuses on 2017 and new 2022 USDA data descriptions of Texas lands.
• According to USDA, the number of farms decreased slightly between 2017 and 2022.
• Smaller farms continue to make up most operations in the state yet comprise only 14% of Texas’ rural working lands. The Pineywoods, Post Oak Savannah, and Oak Prairie regions proportionally house more acres and operations in the ≤99 acre farm size category, when compared to other regions across the state.
• Most farmland (86%) is found in larger operations, and although these decreased slightly in number (~-5,000), they grew in acreage by ~350,000 acres over the same time period. Compared to other regions, the Trans Pecos and High Plains regions have both the most number of operations in the larger farm size categories (>1,000 acres) and the most acres operated by farm size.
• Because measuring and describing Texas land involves a variety of data sets, NRI’s Texas Land Trends program has been studying and reporting on land changes and trends for over 15 years.
• Action : For a more accurate and detailed description of rural working lands utilizing a variety of data sets, see NRI’s Texas Land Trends program.
TEXAS LANDOWNERS
• An overview of Texas landowner demographic characteristics is provided, including descriptions by farm size and farm economic class categories at the state and regional level utilizing 2017 and new 2022 USDA data.
• Collectively, Texas landowners are primarily comprised of adults over the age of 45 (85%; 45 to 64 years, 42%; 65 years and older, 43%).
• Replacement generations make up 15% of landowners and may be too small to replace retiring landowners. We are still in the midst of intergenerational land transfers. Two replacement generation waves are described.
• Action: Consider intergenerational land transfer programs catered to each age group, along with methods for experience, knowledge, and information transfer.
• Action: All landowner groups would benefit from assistance facilitating intergenerational land transfers.
• Only 38% of landowners spent greater than 50% of their work time involved in agricultural activities and 62% of Texas landowners work off-farm.
• Landowners who live on their farm comprise 67% of landowners. Landowners who live offfarm (33%) are found across Texas regions, in all farm size and farm income categories. The Trans-Pecos, High Plains, and South Texas Plains regions experienced slight growth in offfarm residence.
LANDOWNER PERSPECTIVES IN WILDLIFE MANAGEMENT
• Texas landowner land and wildlife management decisions are described utilizing a data subset from the 2017 and 2022 Texas Landowner Survey.
• Type of wildlife managed, land practices, and program participation is described at the statewide and regional level.
• Landowners manage wildlife across the state, in all regions, and in all farm size and farm income levels. Most notably, landowners manage their lands specifically for wildlife despite deriving no income from their land.
• Landowners have expressed difficulty in maintaining their lands in the family and are generally interested in tax incentives and in agricultural and wildlife valuation specifically.
• Prevalence and use of wildlife management plans are described, and challenges arise in maintaining wildlife management plans active.
• With intergenerational land transfers actively influencing future land management decisions, a conversation on agricultural and wildlife valuation may be of interest.
• Action : Consider agriculture, wildlife, and nature benefits derived from land as topics of conversation on the expansion of current incentives or the development of newer methods to assist all landowners in stewarding natural resources for the benefit of wildlife and all Texas communities.
ABOUT THE REPORT AND DATA
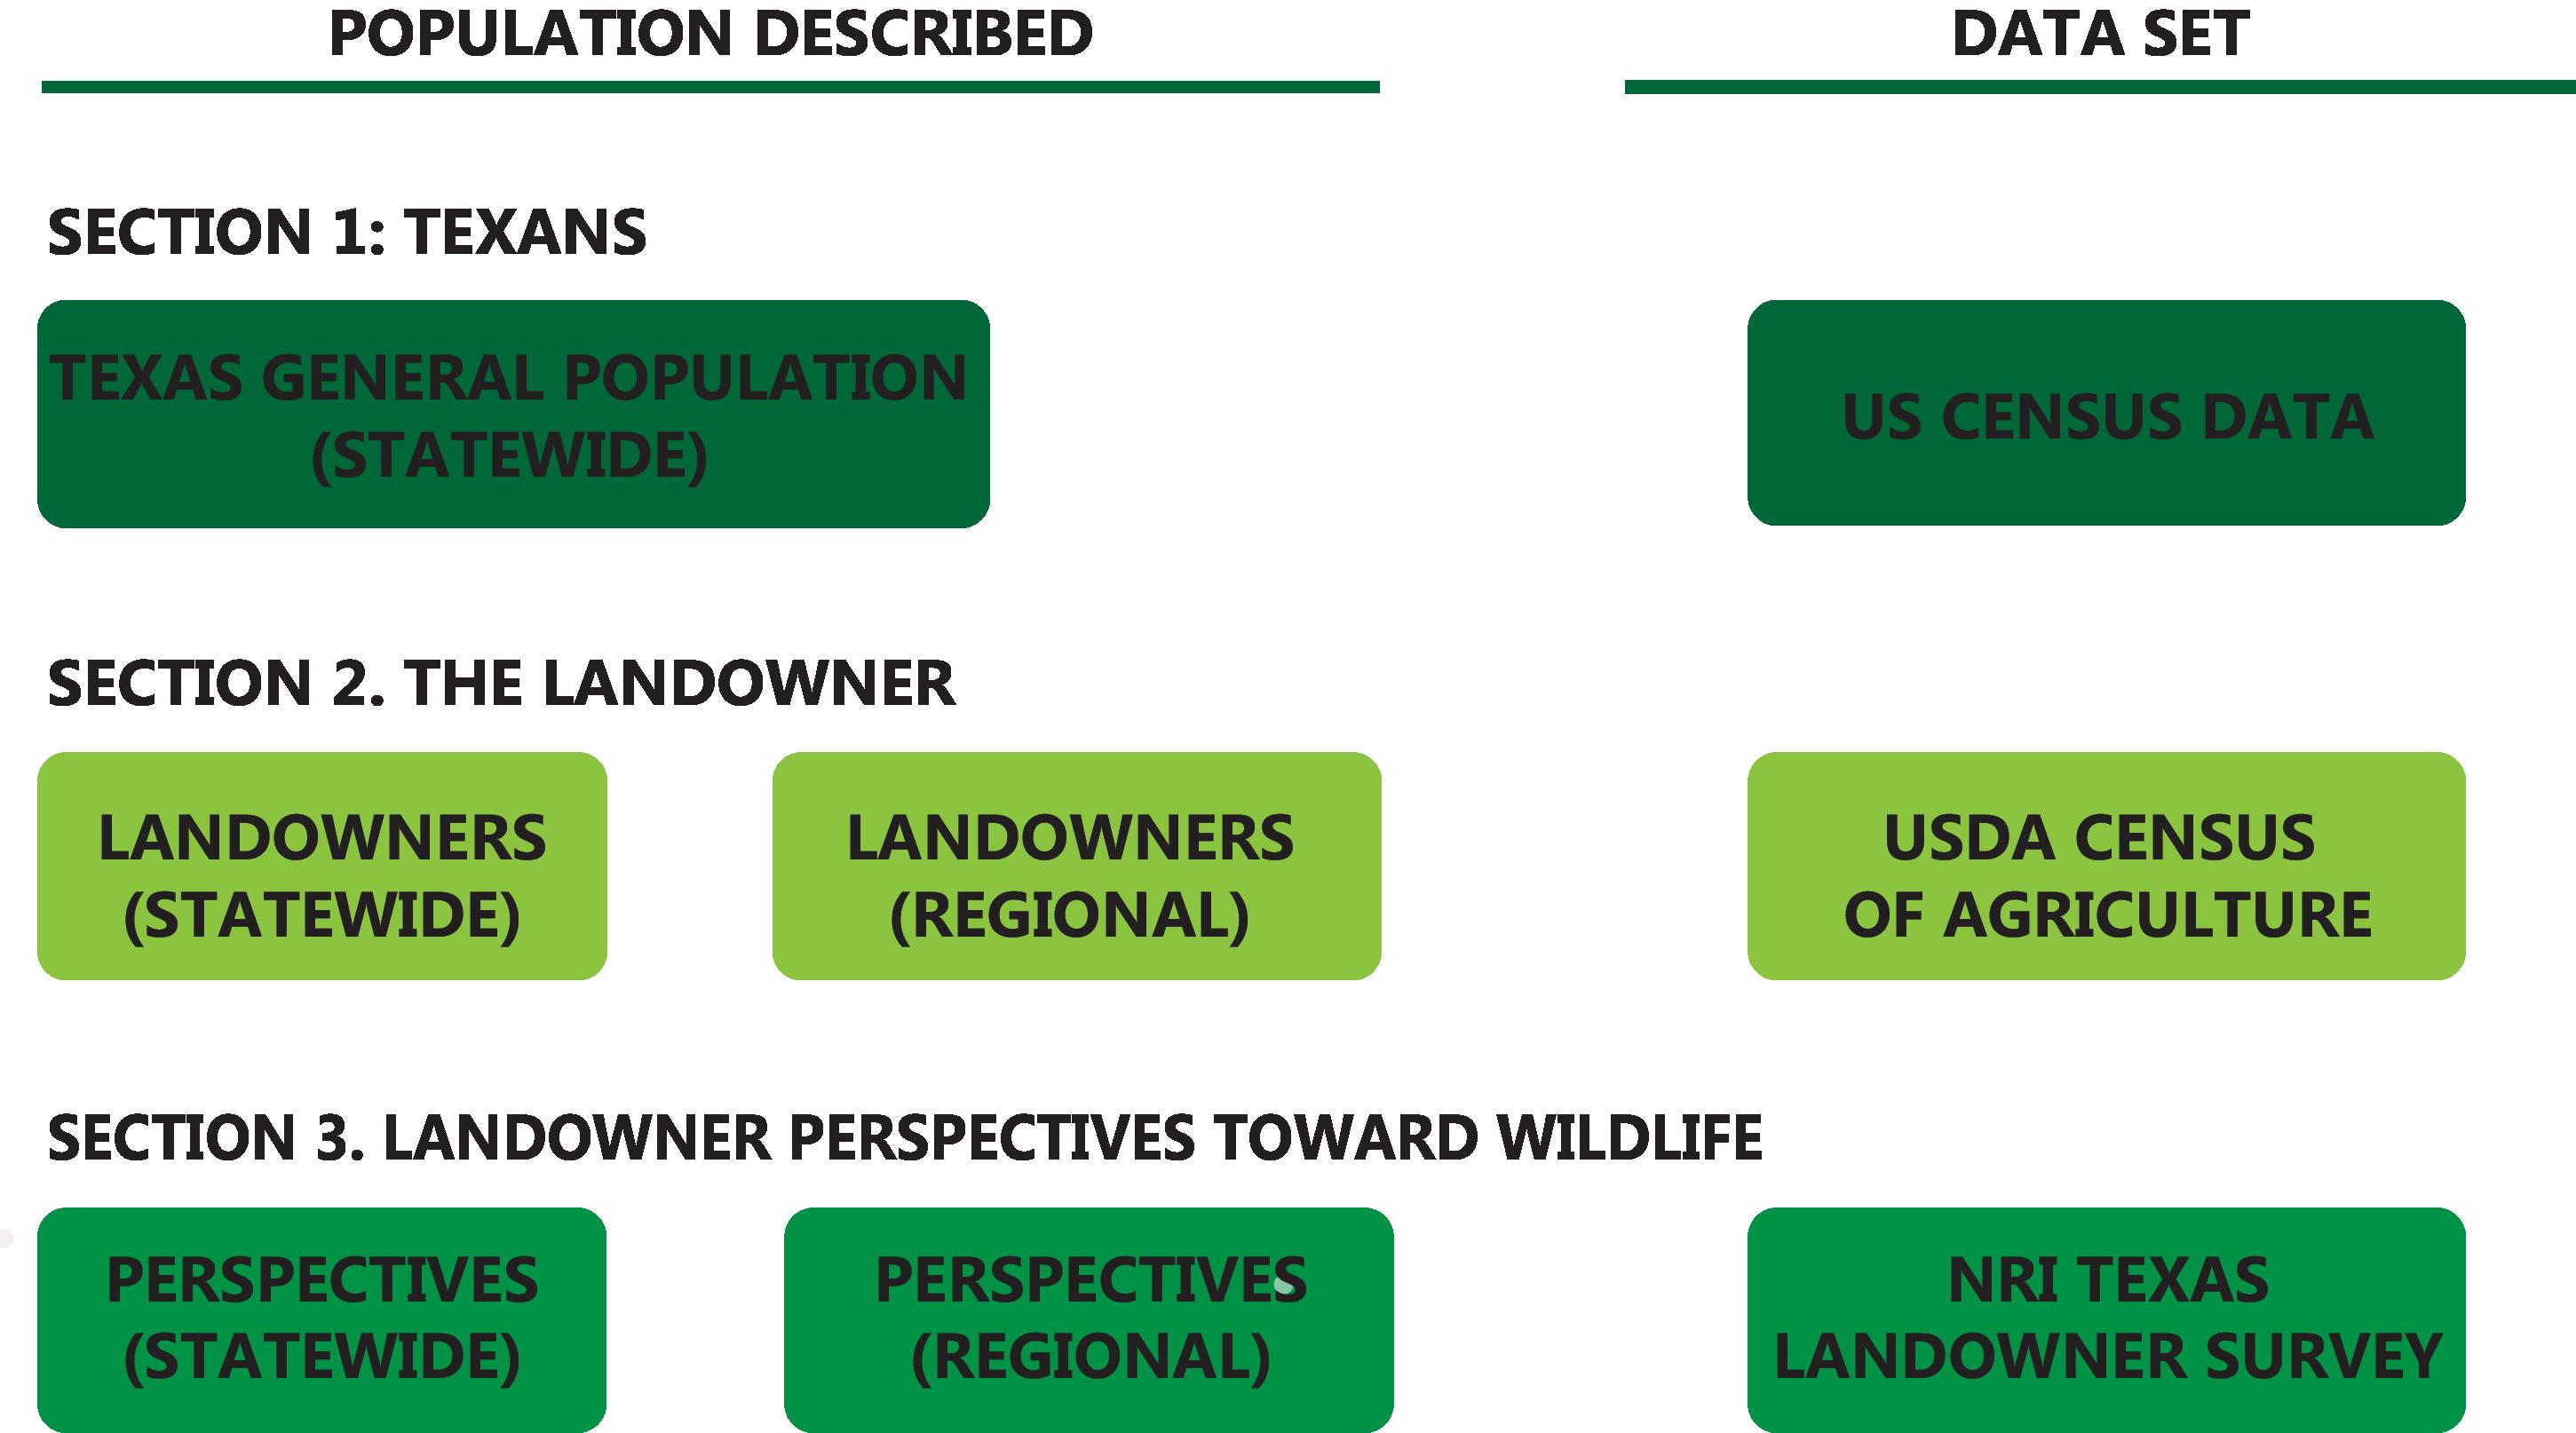
This report is organized to describe the people of Texas, landowners, and landowner perspectives on wildlife management, to include land and wildlife management techniques, interest in tax incentives, and incentive adoption. Three different datasets are utilized in the description: United States Census data; United States Department of Agriculture Census of Agriculture data, and Texas A&M Natural Resources Institute Texas Landowner Survey data. Each dataset is described here, along with the report’s organization.
The United States Census (US Census) is a comprehensive survey conducted every 10 years and intermittently to describe the general Texas population. It seems fitting to describe Texans in this report, as they receive nature benefits resulting from the stewardship of rural working lands.
To better characterize landowners, their operations, and land management decisions, we utilize data from two sources: United States Department of Agriculture Census of Agriculture (USDA COA, 2017 and 2022) and Texas A&M Natural Resources Institute Texas Landowner Survey (NRI TLS, 2017 and 2022, n=5000+).
USDA COA is conducted every 5 years and is a “complete count of U.S. farms and ranches and the people who operate them.” In this report, the term landowner refers specifically to owners of private, rural, working lands (e.g., ag valued lands, 1-d, and 1-d-1), and the term operation describes rural, private working lands, including farms and ranches. According to USDA, a farm is “any place from which $1,000 or more of agricultural products were produced and sold, or normally would have been sold during the census year.” This report utilizes new 2022 USDA data to describe landowners, the people who steward Texas rural working lands, and to provide an overview of changes and trends in landowner demographics since the last USDA census (2017).
NRI TLS is a state-wide NRI project and collaborative effort among agricultural and natural resource agencies. NRI TLS data supplements USDA information to better characterize and understand rural landowners, their land and wildlife management objectives and decisions, to ultimately support programming and services. NRI TLS covers topic areas not included in the USDA COA and considers landowner attitudes, behaviors, participation, challenges, and constraints, among others. NRI TLS also is conducted every 5 years, and we are grateful to all who helped and participated. Here, we provide new 2017 and 2022 NRI TLS information for the benefit of landowners and the agencies who serve them.
This report is organized by data set (Figure 1), first describing Texans (general Texas population) utilizing US Census data. We follow with a description of landowners at both the state and regional level utilizing USDA data. We conclude with a description of landowner land and wildlife management at that state and regional level, utilizing NRI TLS.
REPORT ORGANIZATION
1. Report Organization by Topic and Data Set.
Figure
OVERVIEW
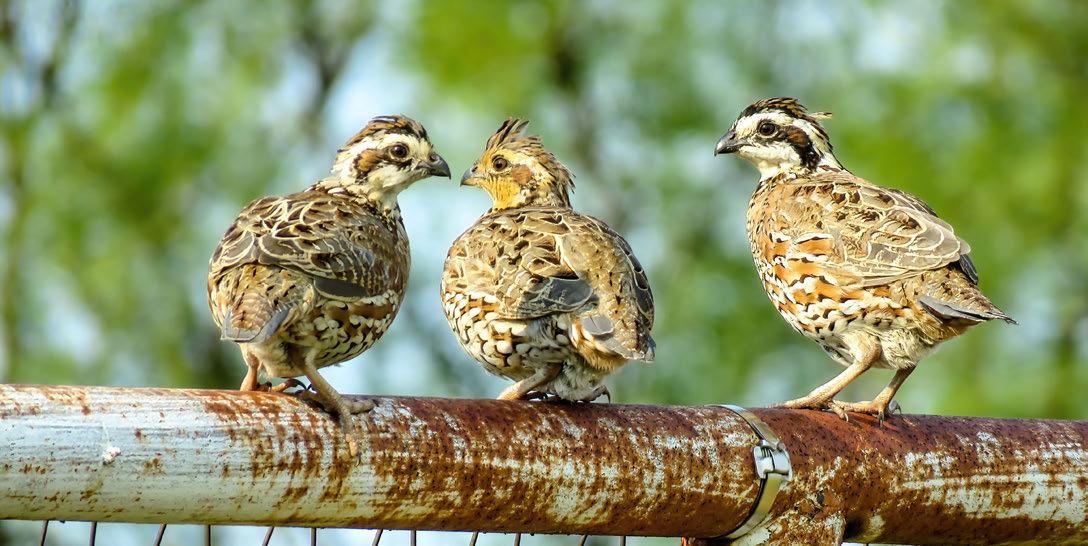
Texas landowners value wildlife and the outdoors 1, and their land stewardship practices help sustain wildlife species for all Texans. Although many financial incentives and programs are available for managing lands, such as wildlife valuation (1-d-1), many landowners manage their lands at personal expense, not earning income from their lands 1 . In this report, we summarize current landowner demographics by comparing U.S. Department of Agriculture Census of Agriculture 2 (USDA COA) 2017 and 2022 data. We describe the relationship between landowners and wildlife based on findings from the 2022 Texas Landowner Survey. Understanding who we serve, their needs and interests, is helpful to developing natural resources programs and to providing other producer resources. For purposes of this report, in describing USDA data, the term landowner is used synonymously with USDA’s term producer .
1 GENERAL POPULATION
Texas’ private working lands benefit all Texans. Texas landowners, who make up only 1% of the state’s population, manage these lands, and their efforts help our economy and provide natural resource benefits to communities. Since Texans benefit from land management decisions, we begin with a brief overview of the state’s general population utilizing US Census data 3 (2022) to describe population growth, gender, age, education, employment, internet access, race/ethnicity, and military service. This review serves to provide some background and context to understanding Texas landowners. We then will follow with a brief description of Texas lands, landowner demographics and their relationship to wildlife.
1.1 GROWTH, GENDER, AND AGE
The general Texas population is growing, and our natural resources have sustained the growth. According to the US Census, the population per square mile increased from approximately 96 individuals in 2010 to 112 individuals in 2020 and to 115 individuals in 2022. Growth occurred in cities across the state. Currently, the state’s population is estimated at 30.5M residents, with a 1:1 ratio between men and women (50% male and 50% female). Texans also are slightly younger in comparison to other states: Texas’ median age is 35.6 years, compared to 39 years across the US. In general, 25% of the Texas population is under 18 years, 62% is between 18 and 64 years, and 13% is over 65 years.
1.2 EDUCATION
Educational attainment in Texas is near the national average. Texans 25 years or older, who have earned at least a high school diploma comprise 86% of the state’s population (90%, U.S.) and those with at least a bachelor’s degree comprise ~34% (36%, U.S.).
1.3 EMPLOYMENT AND INTERNET
Texas’ employment rate is slightly higher than the national average (Texas, 61%; US, 60%), with a median household income of $72,284 (US, $74,755) and approximately 14% of the population living in poverty (US, ~13%). Most Texans have access to the internet (92%) for daily use, and most access is via broadband, including cellular phone service.
1.4 RACE AND ETHNICITY
Texas is diverse. Forty percent of the Texas population is non-Hispanic White, 40% is Hispanic, 13% is Black or African American, 6% is Asian, and 1% is Indigenous or Native American.
1.5 MILITARY SERVICE
Texans serve. Approximately 6% of all Texans are military veterans (1.4M), of these 57% are non-Hispanic White, 22% Hispanic, 15% African American or Black, 2% Asian, and 1% Indigenous or Native American.
2 TEXAS LAND AND OPERATIONS
According to USDA data (2022), the total land area in Texas is ~167M acres and ~75% of this land is described as farmland managed by private landowners (~125M acres). Between 2017 and 2022, approximately 1.5M acres were converted to uses other than agriculture. The number of farms also decreased during this time period. Landowners currently operate approximately 231,000 farms, down from approximately 248,000 farms in 2017, a -7.1% change. Still, smaller farms, those comprised of 500 acres or less, make up 86% of all operations, yet collectively, these farms represent ~14% of all private working lands in Texas. Most farmland is found in larger operations, and although these decreased slightly in number (~-5,000), they grew in acreage by ~350,000 acres over the same time period, possibly associated with consolidation. See Figure 2 for a statewide overview based on USDA data. See Figure 3 for a regional county map that describes farms, landowners, and perspectives throughout this report, and see Figures 4 and 5 for a regional overview of Texas farms by farm size and number of operations. These are the rural working lands and operations Texas landowners steward to help drive our state’s economy. The Pineywoods, Post Oak Savannah, and Oak Prairie regions proportionally house more acres in the ≤99 acre farm size categories compared to other regions across the state. For detailed information on Texas working lands and how they are measured, see NRI’s Texas Land Trends publications. Although USDA COA data offers land estimates, additional data sets provide a more complete description of Texas lands. NRI’s Texas Lands Trends program has been providing detailed and accurate land data for over 15 years. We encourage you to visit their website for specific land information, as this section only utilizes USDA COA data to lightly describe land for the purpose of providing a general overview of Texas landowner stewardship that drives our state’s economy and nature benefits across Texas thus anchoring our conversation on landowners and wildlife.
Number of Acres Operated by Farm Size
≤ 99 100-499 500-999 ≥ 1,000 Acres:
Number of Operations by Farm Size
Acres:
≤ 99 100-499 500-999 ≥ 1,000
Figure 2. Statewide Number of Acres Operated by Farm Size and Number of Operations by Farm Size, USDA 2017 and 2022.
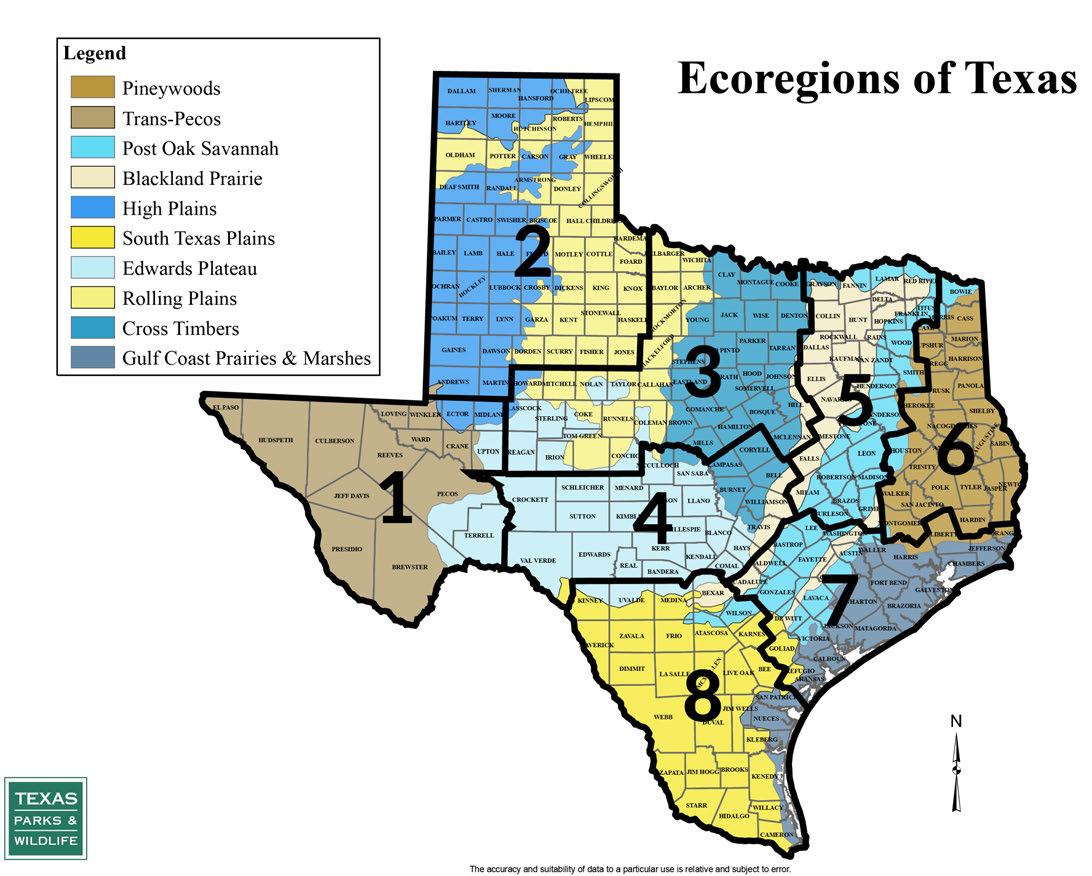
Ecoregions of Texas
See Appendix for county list.
Study Regions:
Figure 3. TPWD Ecoregions of Texas County Map Noting Study Regions used in Describing Farms, Landowners, and their Perspectives throughout this Report. Study Regions are Based on TPWD Wildlife Districts and Study Region Names are Based on TPWD Habitat Management Region Labels (TPWD).
1. Trans-Pecos
2. High Plains
3. Cross Timbers
4. Hill Country
5. Post Oak Savanah
6. Pineywoods 7. Oak Prairie 8. South Texas Plains
High Plains Hill Country
4. Number of
Operated by Farm Size and Region, USDA 2017 and 2022.
Oak Prairie Pineywoods
Post Oak Savannah South Texas Plains
Cross Timbers Trans-Pecos
Figure
Figure 5. Number of Operations by Farm Size and Region, USDA 2017 and 2022.
High Plains Hill Country
Oak Prairie Pineywoods
Post Oak Savannah
South Texas Plains
Cross Timbers Trans-Pecos
3 TEXAS LANDOWNERS
Despite their small number, Texas landowners help steward our state’s land and wildlife resources. Here, at a statewide and regional level, we describe landowners based on the following characteristics: age, sex, race/ethnicity, military service, internet access, primary occupation, residence, and experience. We compare these with farm size and economic class categories. Collectively, these characteristics influence land management decisions and programs.
3.1 LANDOWNERS, STATEWIDE
Texas landowners are aging, and this will influence land management decisions impacting natural resources in the years to come as we move towards intergenerational land transfers and determine whether rural working lands will remain in agricultural production or shift to other uses. Key to this are the number of household individuals involved in the operation and their willingness to continue stewarding the land. Apart from age, several factors to consider are sex, experience, residence, and primary occupation (on or off the farm). Developing accessible, common sense programs that assist landowners as they navigate stewarding their lands is beneficial, and understanding who we serve, their demographic characteristics, is a good first step.
AGE
Texas landowners are comparatively older than the general state’s population, with an average age of 60 years, whereas only 13% of the general Texas population is over the age of 65 years. Collectively, those between the ages of 45 and 64 years (42%) and those 65 years and older (43%) make up the landowning population in the state (Figure 6). Only 15% of landowners are
$500,000-999,999 ≥ $1,000,000
Economic Class
500-999 acres ≥ 1,000 acres ≤ $99,999
99 acres
100-499 acres
Figure 6. Statewide Age by Farm Size and Economic Class, USDA 2022. < 25
$100,000-499,999
Farm Size
younger than 44 years (1% less than 25 years, 4% between 25 to 34 years, and 10% between 35 to 44 years). Those younger than 44 years may be considered the replacement generations for retiring landowners, and USDA classifies those less than 35 years as younger landowners.
In terms of land tenure, landowners between the ages of 45 and 64 years comprise 42% of all full ownerships, 42% of all part ownerships, and 41% of all tenants. The next age group, those 65 years and older, comprises 43% of full ownerships, 39% of part ownerships, and 29% of tenants. Collectively, landowners over the age of 45 manage 85% of full ownerships, 81% of part ownerships, and 70% of tenancies in Texas. We continue to see the progression of the largest intergenerational land transfer, and the replacement generations, those under the age of thirty-five, represent ~6% of current landowners, ~19,000 farms, and ~11M acres, and those between 35 to 44 years represent 10% of current landowners.
Texas farms are family-owned (96%), along with most farmland (84%). They are managed by either one (40%) or two (49%) landowners, and fewer are managed by 3 or more landowners (~11%). This is relevant to intergenerational land transfers, particularly if we consider intergenerational land transfers in two waves, a younger cohort or second replacement wave , and an older cohort, first replacement wave .
Let’s begin with the second replacement wave. Between 2017 and 2022, younger landowners (25 to 35 years) did not experience much growth to replace retiring landowners. By themselves, younger landowners may not have enough financial capital to own or manage land and may still be gaining experience managing land on their own.
The first replacement wave consists of landowners between the ages 45 to 54 years and 55 to 64 years, the experienced age groups, who have greater financial capital to both grow or maintain lands, yet between 2017 and 2022, these groups decreased by 2% each.
Landowners closer to retirement consist of the two older landowner groups (ages 65 to 74 years and those greater than 75 years). These groups increased by 2% each, indicating we are still shifting towards an older landowning population (normal aging process) and confirming we are still in the midst of the intergenerational land transfer phase.
Depending on the age of additional landowners working on the farm, having more than one landowner currently managing the land may offer some relief to buffer loss of experience associated with intergenerational land transfers. Texas lands provide many nature benefits to communities near and far and support the Texas economy. Developing land management programs that help landowners not only manage but also keep their land, particularly in cases of intergenerational land transfers, benefits many Texas communities.
SEX
Males comprise 61% of all landowners and manage 67% of Texas land in farms, while females comprise 39% of landowners and manage 33% of Texas land in farms (Figure 7). The number of female landowners increased slightly since 2017 (1%). Male and female landowners work off-the-farm (59% and 67%, respectively), yet they tend to live on the land (64% and 71%, respectively). Programs that support women in agriculture may be beneficial, along with those that consider landowners whose primary occupation is outside the farm or ranch.
500-999 acres ≥ 1,000 acres
Farm Size
99 acres
100-499 acres
$1,000,000
Male
Female
$500,000-999,999
Economic Class
$100,000-499,999
Figure 7. Statewide Sex by Farm Size and Economic Class, USDA 2022.
RACE AND ETHNICITY
White landowners comprise the largest land manager group in Texas (~383,000 landowners; 87% of all Texas landowners; 39% female and 61% male; Figure 8). They manage ~124M acres of Texas’ total farmland (~125.4M acres) and operate ~221,000 farms in Texas. Hispanic landowners comprise the second largest land manager group (~40,000 landowners; 9% of all Texas landowners; 36% female and 64% male). Hispanic landowners manage ~10M acres in 28,000 farms. Black or African American landowners make up the third largest land manager group (~10,600 landowners; 2.4% of all Texas landowners; 31% female and 69% male). Black or African American landowners manage ~856,000 acres in ~7,200 farms. Indigenous or Native American landowners (~3,000 landowners; 0.7% of all Texas landowners; 41% female and 59% male) manage ~825,000 acres in ~2,700 farms. Asian landowners (~2,400 landowners; 0.56% of all Texas landowners; 51% female and 49% male), manage ~182,000 acres in ~1,700 farms. Overall, the number of landowners decreased in 2022: White, -6,470 landowners, a 1.67% decrease; Hispanic, -1,236 landowners, a 3% decrease; Black or African American, -650 landowners, a 6% decrease; Asian, +772 landowners, a 46% increase; Indigenous or Native American, +206, a 7% increase. USDA uses the term socially disadvantaged to collectively refer to Hispanic or Latino, Black or African American, Indigenous or Native American and Asian landowners 2, thus the term is utilized in this report. Supporting the farming and ranching legacy of Texas landowners benefits the state and its natural resources.
MILITARY SERVICE
Texas landowners serve in the military (Figure 9). Approximately 6.2% of all Texans serve or have served in the military, this includes ~10% of landowners (~42,000; 13% in 2017). Collectively, landowners with military service manage 17M acres in ~40,000 farms. Military service by race and ethnicity is as follows: 11% of White landowners, 11% of Hispanic landowners, 24% of Black or African American landowners, 13% of Indigenous or Native American landowners, and 6% of Asian landowners.
INTERNET ACCESS
Access to the internet is useful to land managers, particularly for accessing technical information resources, for communicating, and for commerce. Approximately 76% of farms in Texas have internet access, almost half with a cellular data plan (Figure 10). Over a third of farms have access to broadband services, and 6% of all land managers use precision agricultural practices that may at times require an internet connection, even if for data gathering, reading, or transfer. Access to information via the internet is important for receiving targeted outreach programming and for technical assistance.
Farm Size
$500,000-999,999 ≥ $1,000,000
1,000 acres
99 acres 100-499 acres 500-999 acres
Economic Class
≤ $99,999
$100,000-499,999
White
Socially Disadvantaged
Figure 8. Statewide Race And Ethnicity by Farm Size and Economic Class, USDA 2022.
1,000 acres
99 acres
acres 500-999 acres
$500,000-999,999
Figure 9. Statewide Military Service by Farm Size and Economic Class, USDA 2022. Served Never Served
$100,000-499,999
$500,000-999,999 ≥ $1,000,000
≥ 1,000 acres
500-999 acres
Economic Class
≤ $99,999
Farm Size
$100,000-499,999
≤ 99 acres
100-499 acres
Dialup
Broadband
Figure 10. Statewide Internet by Farm Size and Economic Class, USDA 2022.
PRIMARY OCCUPATION AND RESIDENCE
Texas landowners whose primary occupation is farming (38%) increased by approximately 2% in 2022, compared to 36% in 2017 (Figure 11). These landowners spent at least 50% of their work time involved in agricultural activities. In contrast, 62% of landowners spent less than 50% of their work time farming or ranching (2022). This is despite landowners living on their farms, 67% in 2022. On-farm residence decreased by 2% from 69% between 2017 and 2022 (Figure 12). Although this analysis did not consider farming income or education, both associated with employment, previous work indicates annual household income derived from farming or ranching may be supplemented with work outside the farm 1
EXPERIENCE
Texas landowners have experience managing their farms (Figure 13). Landowners with greater than 10 years of experience make up 68% of all landowners (2022). On average, landowners have 19 years of experience on their current operation and 21 years on any farm. Between 2017 and 2022, new and beginning landowners, those with less than 10 years of experience, increased by 3% from 29% to 32%. This group manages ~81,000 farms and ~30M acres. Targeted technical assistance programs and incentives may continue to benefit those who are newer to the land.
1,000 acres
500-999 acres
Farm Size
99 acres 100-499 acres
$1,000,000
$500,000-999,999
Economic Class
$99,999
$100,000-499,999
Figure 11. Statewide Primary Occupation by Farm Size and Economic Class, USDA 2022.
$500,000-999,999 ≥ $1,000,000
1,000 acres
99 acres 100-499 acres 500-999 acres
Economic Class
On Operation
Not on Operation ≤ $99,999
$100,000-499,999
Figure 12. Statewide Residence by Farm Size and Economic Class, USDA 2022.
Figure 13. Statewide Experience by Farm Size and Economic Class, USDA 2022.
3.2 LANDOWNERS REGIONAL
Regional level comparisons of landowner demographic characteristics (i.e., age, sex, race and ethnicity, military service, internet, primary occupation, experience, and residence), farm size and economic class categories are compared to provide an overview of Texas landowners and the lands they steward.
AGE
Landowner age composition is similar across regions, with older landowners the primary land stewards across the state (Figure 14). Items like intergenerational land transfers will influence all Texas regions.
SEX
Males comprise the largest landowning group across all Texas regions (Figure 15). Despite the small increase in female landowners, programming centered on women and families may be beneficial to intergenerational land transfers.
RACE AND ETHNICITY
White landowners comprise the largest land stewarding group across Texas regions (Figure 16). Programs that assist in maintaining landownerships are beneficial to all landowners, especially when considering land fragmentation, the nature benefits derived from rural working lands, and intergenerational land transfers.
MILITARY
Landowners across all Texas regions serve our country (Figure 17). Several land stewardship programs offer assistance to military veterans.
< 25 25 to 44 45 to 64 ≥ 65
Figure 14. Age by Region, USDA 2017 and 2022.
High Plains Hill Country
Oak Prairie Pineywoods
Post Oak Savannah South Texas Plains
Cross Timbers Trans-Pecos
High Plains Hill Country
Male Female
Figure 15. Sex by Region, USDA 2017 and 2022.
Oak Prairie Pineywoods
Post Oak Savannah
South Texas Plains
Trans-Pecos
Cross Timbers
White Socially Disadvantaged
Figure 16. Race and Ethnicity by Region, USDA 2017 and 2022.
High Plains Hill Country
Oak Prairie
Pineywoods
Post Oak Savannah South Texas Plains
Trans-Pecos
Cross Timbers
High Plains Hill Country
Served Never Served
Figure 17. Military Service by Region, USDA 2017 and 2022.
Oak Prairie Pineywoods
Post Oak Savannah South Texas Plains
Trans-Pecos
Cross Timbers
INTERNET
Although areas of unknown internet source exist across all regions, Texas landowners appear to have access to the internet, and further research is needed to determine current internet quality in rural regions, as these may vary and influence precision agriculture, information transfer, education, and commerce (Figure 18).
PRIMARY OCCUPATION
Across Texas regions, work outside the farm is more common than working exclusively on the farm (Figure 19). This may influence program delivery strategies.
RESIDENCE
On operation residence varies across Texas regions, with off-farm residence increasing in the TransPecos, High Plains, and South Texas Plains regions between the 2017 and 2022 time period (Figure 20). Several factors influence off-farm residence, and all Texas regions and farm size categories are experiencing an increase.
EXPERIENCE
Experienced landowners are present across all Texas regions (Figure 21). Transferring land management experience to future landowners is important. If we associate age with experience, then continuing efforts that facilitate information transfer between generations and among landowners may be a consideration across the state.
High Plains Hill Country
Dial Up Broadband Mobile Other Unknown
Figure 18. Internet by Region, USDA 2017 and 2022.
Oak Prairie
Pineywoods
Post Oak Savannah
South Texas Plains
Trans-Pecos
Cross Timbers
High Plains Hill Country
Farming Not Farming
Figure 19. Primary Occupation by Region, USDA 2017 and 2022.
Oak Prairie
Pineywoods
Post Oak Savannah
South Texas Plains
Trans-Pecos
Cross Timbers
High Plains Hill Country
On Operation Not on Operation
Figure 20. Residence by Region, USDA 2017 and 2022.
Oak Prairie Pineywoods
Post Oak Savannah South Texas Plains
Trans-Pecos
Cross Timbers
High Plains Hill Country
< 10 Years ≥ 11 Years
Figure 21. Experience by Region, USDA 2017 and 2022.
Oak Prairie
Pineywoods
Post Oak Savannah South Texas Plains
Trans-Pecos
Cross Timbers
3.3 KEY TAKEAWAYS
Texas is growing and the nature benefits derived from Texas rural working lands benefit all communities. Here are a few notes derived from this data set:
• Despit e the Texas population’s growth and its description as a younger, educated population, the landowner community is older in comparison. This is relevant as we consider the next two generations of landowners are not growing as quickly to meet the demands of upcoming intergenerational land transfers. Since landowners hope to pass their land to future generations, accessible mechanisms to address both land and information transfer are helpful and needed to ameliorate these challenges.
• Today’s economy allows for the education of our state’s residents, which in turn continues to push our economy forward. For landowners, education has successfully allowed them to both manage their land and maintain work outside the farm, including off-farm residence across all regions, all farm sizes and all economic class categories.
4 LANDOWNER PERSPECTIVES IN
WILDLIFE
MANAGEMENT
Along with an understanding of who we serve via their demographic characteristics, as natural resource professionals, understanding landowner perspectives on land, natural resources, and wildlife management makes sense, as these will help in developing relevant and targeted programs and services. After family, wildlife is central to the landowning experience. Landowners are invested in their land and hope to pass it on to future generations 1 . Their current land stewardship practices will resonate across future generations. The Texas Landowner Survey assessed several land and wildlife management practices and participation in several programs. Here we consider land practices, wild life management, and tax incentives.
4.1 TEXAS LANDOWNER SURVEY
TLS was developed to assist landowners and natural resource agencies and professionals. The survey is conducted every 5 years, in line with USDA COA as a supplement providing a snapshot of landowners, land management preferences, and challenges. For a statewide overview of TLS findings, see Texas Landowner Survey by NRI as a primer. Since 2017, TLS information has been used to inform program development. Three key TLS findings speak the importance of land management program incentives. First, landowners value family (72%), wildlife (68%), hunting (66%), recreation (58%), ranching (55%), and conservation (46%), their top reasons for owning land¹. Second, landowners value and manage their land specifically for wildlife (67%, 2017 and 2022)¹, despite not earning income from their land (38%) or earning less than 25% of their household income from their land (41%)¹.
Third, many landowners are not interested in selling their lands, whole or in part (70%, 2017 and 69%, 2022)¹. Maintaining landholdings is difficult for some families. Yet, there are community-wide benefits derived from rural working lands⁴ and to this point, the conversation of program incentives is relevant, as landowners are interested in general incentives (65%, 2022)¹. When asked their likelihood of participating in agricultural and wildlife valuation (1-d and 1-d-1, respectively) in the next 10 years, collectively, 40% of landowners indicated they were very likely to participate in agricultural valuation (38% were unlikely to participate) and slightly more than half (54%) indicated they were likely to participate in wildlife valuation (24% were unlikely to participate). Also, many landowners are aware of 1-d-1 (75%, 2017 and 76%, 2022), and more than half of landowner respondents indicated they were likely to participate in 1-d-1, if they had assistance with management plans (61%, 2017 and 62%, 2022). To learn more about wildlife valuation and developing wildlife management plans, see NRI’s Private Land Stewardship Course on Wildlife Valuation . For information on agricultural valuation, see Agricultural, Timberland, and Wildlife Management Use Special Appraisal . With intergenerational land transfers looming and landowners seeking out information for maintaining their lands, tax valuation, to include agricultural and wildlife valuation and management might be of interest to the conversation.
Here we provide an overview of general landowner wildlife management decisions at the statewide and regional level by describing farm size, income from land, and:
• Wildlife species managed
• Agricultural valuation participation
• Wildlife valuation participation
• Wildlife management plans
Rural working lands, habitat for Texas wildlife species, provide many nature benefits to communities near and far. TLS helps us better understand landowners to develop relevant programs and provide landowner resources.
4.2 LANDOWNERS AND WILDLIFE
Land management needs vary and not every farm is the same. For this reason, the information provided here serves as a high-level description of regional wildlife management based on TLS 2017 and 2022 data. Landowner descriptions that follow refer specifically to landowners who responded to the TLS (n=5,000+). There is an understanding that managing for wildlife may not directly fit with some farm operational objectives, and this report focuses on wildlife as a means of providing information for land stewards and natural resource professionals where managing for wildlife makes operational and economic sense, as the nature benefits derived from sound land stewardship practices, whether for general agriculture or wildlife, resonate and touch Texas communities. For a general description of Texas region habitats, see Habitats by TPWD and the Appendix for a list of counties by region used in this report.
4.3 STATEWIDE
Landowner decisions influence their land, natural resources, and wildlife. Texas landowners value wildlife and manage their land using a systems approach, where they consider the needs of livestock, range, and wildlife (82%). TLS asked landowners about their land and wildlife management preferences. Here are a few statewide highlights (Figures 22-25):
• In managing their land, landowners follow a management plan (75%), whether formally with an organization or consultant (NRCS 12%, TPWD 30%, Consultant 6%, other organization 6%) or informally for self (21%).
o Across all farm size categories, most landowners have a management plan:
• <500 acres (65%)
• 500 to 1000 acres (80%)
• 1000 to 2000 acres (92%)
• over 2000 acres (90%)
o Across all income categories (i.e., percent household income derived from land), landowners have a management plan (75%):
• No income from land (77%)
• <30% Income from land (71%)
• 31-50% Income from land (80%)
• >50% Income from land (85%)
• In managing their land, several land practices are employed:
o Brush management (82%)
o Feral animal control (hogs exotics; 75%)
o Hunting (game inventory and harvest management (69%)
o Grazing management (59%)
o Predator control (57%)
o Livestock production (52%)
o Erosion management (50%)
o Habitat restoration (48%)
o Drought management (34%)
o Water development and management (27%)
o Prescribed fire (burning, placing fire lines; 24%)
• Texas landowners manage a variety of wildlife:
o Big game (79%)
o Upland game birds (52%)
o Migratory game birds (52%)
o Non-game birds (38%)
o Pollinators (32%)
o Non-game animals (19%)
o Exotic big game animals (17%)
• Few landowners do not manage for wildlife (11%).
• Landowners have received free assistance in developing management plans (52%) and others have paid for assistance (21%).
• Landowners are willing to participate in tax valuations (agricultural and wildlife; 93%).
• Approximately one-third of landowners currently participate in wildlife valuation (1-d-1; 37%).
o Across all farm size categories, some landowners participate in wildlife valuation:
• <500 acres (34%)
• 500 to 1000 acres (39%)
• 1000 to 2000 acres (45%)
• > 2000 acres (45%)
o Across all income categories (i.e., percent household income derived from land), some landowners currently participate in wildlife valuation:
• No income from land (52%)
• <30% Income from land (28%)
• 31-50% Income from land (30%)
• >50% Income from land (24%)
• Many landowners indicated their willingness to participate in wildlife valuation (1d-1) if they had assistance developing a management plan (62%).
Texas landowners steward their land, value wildlife, and show interest in tax incentives generally and valuations specifically (agricultural and wildlife).
Income
Farm Size
Big game animals
Upland game birds
Migratory game birds
Non-game birds
Non-game animals
Exotic big game animals
Pollinators
Do not manage for wildlife
Figure 22. Statewide Wildlife Species Managed by Farm Size and Income, TLS 2022.
acres
Farm Size
acres
Very likely
Somewhat
Neither likely nor unlikely
Somewhat unlikely
Not at all likely
Income
Figure 23. Statewide Likelihood of Participating in Agricultural Valuation by Farm Size and Income, TLS 2022.
acres
Very likely
Somewhat
Neither likely nor unlikely
Somewhat unlikely
Not at all likely
Figure 24. Statewide Likelihood of Participating in Wildlife Valuation by Farm Size and Income, TLS 2022.
Farm Size
Natural Resources
Conservation Services
Private consultant
Self
Texas Parks & Wildlife
Department
Do not have a management plan
Other
Figure 25. Statewide Management Plans by Organization, Farm Size, and Income, TLS 2022.
4.4 REGIONAL
Each Texas region is unique and slight variations in wildlife management exist. Here we describe wildlife managed, land practices, and participation in tax incentives.
TRANS-PECOS
REASONS FOR OWNING LAND AND WILDLIFE MANAGED
Trans-Pecos landowner respondents indicated wildlife as their primary reason for owning land (81%), followed by ranching (67%), hunting (61%), and recreation (58%). Wildlife was managed across several farm income and farm size categories, to include pollinators (32%). Landowners developed management plans, whether formally with an organization (i.e., NRCS, TPWD, consultant, 70% collectively) or informally as a personal plan (40%), to manage a variety of species. Big game animals (74%), upland game birds (74%), and migratory game birds (42%) were the most common (Figures 26-29). A systems approach, which considers the needs of livestock, range, and wildlife (84%) was followed, and the common management activities included brush (90%), grazing (74%), and erosion management (68%), hunting (game inventory and harvest management, 68%), predator control (65%), and habitat restoration (61%).
TAX INCENTIVES
Landowners expressed a willingness to participate in tax valuations (agricultural or wildlife, at least 61%), with 43% likely to participate in agricultural valuation in the next 10 years, and 67% in wildlife valuation. Landowners were aware of the wildlife valuation option (73%), had received free assistance in developing a management plan in the past (60%), and indicated they would be more likely to participate in wildlife valuation if they had assistance in developing a wildlife management plan (53%). Currently, 20% of landowner respondents do not have a management plan, and some operations currently do not participate in wildlife management (6%).
Farm Size
1000-2000 acres > 2000 acres
Big game animals
Upland game birds
Migratory game birds
Non-game birds
Non-game animals
Exotic big game animals
Pollinators
Do not manage for wildlife
Overview
acres
Figure 26. Trans-Pecos Wildlife Species Managed by Farm Size and Income, TLS 2022.
TRANS-PECOS TEXAS
acres 500-999 acres 1000-2000 acres
Very likely
Somewhat
Neither likely nor unlikely
Somewhat unlikely
Not at all likely
Figure 27. Trans-Pecos Likelihood of Participating in Agricultural Valuation by Farm Size and Income, TLS 2022.
Farm Size
acres
Farm Size
Very likely
Somewhat
Neither likely nor unlikely
Somewhat unlikely
Not at all likely
TRANS-PECOS TEXAS LANDOWNER
Figure 28. Trans-Pecos Likelihood of Participating in Wildlife Valuation by Farm Size and Income, TLS 2022.
Natural Resources
Conservation Services
Private consultant
Self
Texas Parks & Wildlife Department
Do not have a management plan
Other
Figure 29. Trans-Pecos Management Plans by Organization, Farm Size, and Income, TLS 2022.
HIGH PLAINS
REASONS FOR OWNING LAND AND WILDLIFE MANAGED
Ranching (71%), hunting (69%), family (62%), and wildlife (58%) were the top reasons for owning land in the High Plains region. Landowners managed a variety of wildlife across many farm income categories and farm size categories. Big game (78%), upland game birds (76%), and migratory game birds (62%), among other species were managed in the region (Figures 30-33). Pollinators also were managed (16%).
Landowners managed land specifically for wildlife (62%), following a systems approach (91%), considering the needs of livestock, range, and wildlife, with grazing (78%), brush (73%), hunting (game inventory and harvest management, 69%), livestock production (69%), and feral animal control (60%) the most common land management activities in the region.
TAX INCENTIVES
When considering a variety of programs, landowners were willing to participate in tax valuations (agricultural or wildlife, at least 60%). They were aware of wildlife valuation (47%) and were likely to participate in agricultural (49%) and wildlife (43%) valuation in the next 10 years. Landowner respondents had developed a management plan for an organization (i.e., NRCS, TPWD, consultant, 79% collectively) or as a personal endeavor (19%). Some landowners do not currently have a management plan (33%), half had received free assistance in developing a management plan in the past, and some indicated they would participate in wildlife valuation if they had assistance developing a wildlife management plan (53%). Currently, 16% of respondents participate in wildlife valuation, and few respondents did not manage wildlife (11%).
2000 acres
500 acres
1000-2000 acres
500-999 acres
Big game animals
Upland game birds
Migratory game birds
Non-game birds
Non-game animals
Exotic big game animals
Pollinators
Do not manage for wildlife
30. High Plains Wildlife Species Managed by Farm Size and Income, TLS 2022.
Figure
Farm Size
Very likely
Somewhat
Neither likely nor unlikely
Somewhat unlikely
Not at all likely
Figure 31. High Plains Likelihood of Participating in Agricultural Valuation by Farm Size and Income, TLS 2022.
acres
acres
Very likely
Somewhat
Neither likely nor unlikely
Somewhat unlikely
Not at all likely
Figure 32. High Plains Likelihood of Participating in Wildlife Valuation by Farm Size and Income, TLS 2022.
acres
acres
Natural Resources
Conservation Services
Private consultant
Self
Texas Parks & Wildlife
Department
Do not have a management plan
Other
Figure 33. High Plains Management Plans by Organization, Farm Size, and Income, TLS 2022.
CROSS TIMBERS
REASONS FOR OWNING LAND AND WILDLIFE MANAGED
Across farm income and size categories, landowners managed a variety of wildlife species in the Cross Timbers region, where big game (76%), upland game birds (63%), and migratory game birds (53%) are the most popular, among others (Figures 34-37). Pollinators also were managed in the region (34%). Landowners expressed family (67%), ranching (64%), wildlife (58%), and hunting (57%) were the primary reasons for owning land. Common land management practices included brush management (81%), feral animal control (74%), grazing management (71%), livestock production (66%), and predator control (61%).
TAX INCENTIVES
Landowners were willing to participate in tax valuations (agricultural or wildlife valuation, at least 64%) and were likely to participate in agricultural (38%) and wildlife (42%) valuation looking towards their future. Few landowners did not manage wildlife (15%), while many managed their land specifically to benefit wildlife (55%) following a systems approach (considering the needs of livestock, range, and wildlife, 87%). Landowner respondents had received free assistance developing management plans in the past (49%), and many were aware of wildlife valuation (70%) and participated in wildlife valuation (30%). Some respondents (39%) did not currently have a management plan, while others had a plan for self (28%) or formally with an organization (i.e., NRCS, TPWD, consultant, 56%). Many landowners indicated they would participate in wildlife valuation if they had assistance in developing a wildlife management plan (62%).
2000 acres
1000-2000 acres
Farm Size
acres
Overview
Big game animals
Upland game birds
Migratory game birds
Non-game birds
Non-game animals
Exotic big game animals
Pollinators
Do not manage for wildlife
Figure 34. Cross Timbers Wildlife Species Managed by Farm Size and Income, TLS 2022.
Neither
Somewhat
Not
Figure 35. Cross Timbers Likelihood of Participating in Agricultural Valuation by Farm Size and Income, TLS 2022.
Farm Size
2000 acres
1000-2000 acres
Very likely
Somewhat
Neither likely nor unlikely
Somewhat unlikely
Not at all likely
Figure 36. Cross Timbers Likelihood of Participating in Wildlife Valuation by Farm Size and Income, TLS 2022.
acres
Figure 37. Cross Timbers Management Plans by Organization, Farm Size, and Income, TLS 2022. < 500 acres
1000-2000 acres
500-999 acres
Natural Resources
Conservation Services
Private consultant
Self
Texas Parks & Wildlife Department
Do not have a management plan
Other
HILL COUNTRY
REASONS FOR OWNING LAND AND WILDLIFE MANAGED
Hill Country landowners, across many farm income and farm size categories, managed for wildlife in the region (Figures 3841). Their primary reasons for owning land included family (78%), wildlife (75%), hunting (69%), and recreation (68%). Hill Country landowners managed their land for big game animals (84%), upland game birds (66%), and non-game birds (48%; Figures 3841), among others. Some also managed for pollinators (40%). They manage land specifically for wildlife (77%) following a systems approach (considering the needs of livestock, range, and wildlife, 84%), with few not managing for wildlife (5%). Land practices included brush management (92%), feral animal control (76%), hunting (game inventory and harvest management, 71%), habitat restoration (62%), and predator control (60%).
TAX INCENTIVES
Landowners were willing to participate in tax valuations (agricultural or wildlife, at least 73%) and were likely to participate in agricultural (43%) and wildlife valuation (65%) within the next 10 years. Some landowners did not have a management plan (30%), while many have a plan for self (30%) or with organizations (i.e., NRCS, TPWD, consultant, 66% collectively). Landowners had received free assistance with management plans in the past (59%) and were aware of wildlife valuation (90%). Half of landowner respondents participated in wildlife valuation, and 66% said they would participate in wildlife valuation if they had assistance developing a wildlife management plan.
1000-2000 acres > 2000 acres
500 acres
500-999 acres
Big game animals
Upland game birds
Migratory game birds
Non-game birds
Non-game animals
Exotic big game animals
Pollinators
Do not manage for wildlife
38. Hill Country Wildlife Species Managed by Farm Size and Income, TLS 2022.
Figure
Farm Size
Very likely
Somewhat
Neither likely nor unlikely
Somewhat unlikely
Not at all likely
Figure 39. Hill Country Likelihood of Participating in Agricultural Valuation by Farm Size and Income, TLS 2022.
1000-2000 acres
500 acres
500-999 acres
Very likely
Somewhat
Neither likely nor unlikely
Somewhat unlikely
Not at all likely
Figure 40. Hill Country Likelihood of Participating in Wildlife Valuation by Farm Size and Income, TLS 2022.
Farm Size
1000-2000 acres > 2000 acres
Natural Resources
Conservation Services
Private consultant
Self
Texas Parks & Wildlife Department
Do not have a management plan
Other
Figure 41. Hill Country Management Plans by Organization, Farm Size, and Income, TLS 2022. < 500 acres 500-999 acres
POST OAK SAVANNAH
REASONS FOR OWNING LAND AND WILDLIFE MANAGED
Across farm income and farm size categories, landowners in the Post Oak Savannah region managed wildlife (Figures 42-45). Reasons for owning land included family (66%), wildlife (64%), hunting (52%), ranching (51%), and recreation (49%). Wildlife managed included big game (63%), migratory game birds (53%), and non-game birds (40%). Pollinators also were managed (36%). Common land practices involved brush management (78%), feral animal control (72%), and hunting (game inventory and harvest management, 54%). Landowners in the region managed land specifically for the benefit of wildlife (65%), following a systems approach (considering the needs of livestock, range, and wildlife, 72%), with few not managing wildlife (21%).
TAX INCENTIVES
Most landowners were willing to participate in tax valuations (agricultural or wildlife, at least 71%) and were likely to participate in agricultural (46%) and wildlife valuation (53%) in the near future. Many were aware of wildlife valuation (73%) and participated in the wildlife valuation program (35%). Some landowners did not have a management plan (38%), although many had a plan for self (24%) or with an organization (i.e., NRCS, TPWD, consultant, 52% collectively). Half had received free assistance with management plans in the past, and 66% indicated they would participate in wildlife valuation if they had assistance in developing a wildlife management plan.
Farm Size
1000-2000 acres > 2000 acres
Big game animals
Upland game birds
Migratory game birds
Non-game birds
Non-game animals
Exotic big game animals
Pollinators
Do not manage for wildlife
500-999 acres
Overview
Figure 42. Post Oak Savannah Wildlife Species Managed by Farm Size and Income, TLS 2022.
Figure 43. Post Oak Savannah Likelihood of Participating in Agricultural Valuation by Farm Size and Income, TLS 2022. < 500 acres
500-999 acres 1000-2000 acres
Very likely
Somewhat
Neither likely nor unlikely
Somewhat unlikely
Not at all likely
Farm Size
Very likely
Somewhat
Neither likely nor unlikely
Somewhat unlikely
Not at all likely
Figure 44. Post Oak Savannah Likelihood of Participating in Wildlife Valuation by Farm Size and Income, TLS 2022.
1000-2000 acres
acres
500-999 acres
Natural Resources
Conservation Services
Private consultant
Self
Texas Parks & Wildlife Department
Do not have a management plan
Other
Figure 45. Post Oak Savannah Management Plans by Organization, Farm Size, and Income, TLS 2022.
PINEYWOODS
REASONS FOR OWNING LAND AND WILDLIFE MANAGED
Family (68%), wildlife (68%), and hunting (66%) were the primary reasons for owning land in the Pineywoods region. Landowners managed their land for wildlife (Figures 46-49) across many farm income and farm size categories. They managed specifically to benefit wildlife (59%) utilizing a systems approach (considering the needs of livestock, range, and wildlife, 69%). Management activities included feral animal control (78%), brush management (70%), timber management (68%), and hunting (game inventory and harvest management, 64%). Big game (79%), migratory game birds (45%), and non-game birds (33%) were the most commonly managed wildlife species, among other wildlife. Landowners also managed their lands for the benefit of pollinators (30%).
TAX INCENTIVES
Landowner respondents were willing to participate in tax valuations (agricultural or wildlife, at least 58%) and were likely to participate in agricultural (35%) and wildlife valuation (49%) in the next several years. Many landowners were aware of wildlife valuation (56%), and few did not manage for wildlife (12%). Some landowners did not have a management plan (34%), and many had management plans with organizations (i.e., NRCS, TPWD, consultant, 68% collectively) or for self (31%). Landowners indicated they would participate in wildlife valuation if they had assistance developing a management plan (68%). Some had received assistance with management plans in the past (52%), and currently 21% participate in wildlife valuation.
Farm Size
Big game animals
Upland game birds
Migratory game birds
Non-game birds
Non-game animals
Exotic big game animals
Pollinators
Do not manage for wildlife
46. Pineywoods Wildlife Species Managed by Farm Size and Income, TLS 2022.
Figure
Farm Size
Very likely
Somewhat
Neither likely nor unlikely
Somewhat unlikely
Not at all likely Overview
Figure 47. Pineywoods Likelihood of Participating in Agricultural Valuation by Farm Size and Income, TLS 2022.
acres
Very likely
Somewhat
Neither likely nor unlikely
Somewhat unlikely
Not at all likely
Figure 48. Pineywoods Likelihood of Participating in Wildlife Valuation by Farm Size and Income, TLS 2022.
1000-2000 acres > 2000 acres
Natural Resources
Conservation Services
Private consultant
Self
Texas Parks & Wildlife Department
Do not have a management plan
Other
Figure 49. Pineywoods Management Plans by Organization, Farm Size, and Income, TLS 2022. < 500 acres 500-999 acres
OAK PRAIRIE
REASONS FOR OWNING LAND AND WILDLIFE MANAGED
Landowners managed wildlife in the Oak Prairie region (Figures 50-53), with big game (83%), migratory game birds (52%), upland game birds (41%) the most commonly managed wildlife, among others, and brush management (88%), feral animal control (82%), and hunting (game inventory and harvest management, 78%) the most common land practices across many farm income and farm size categories. Landowners indicated family (66%), wildlife (64%), and hunting (52%) were their primary reasons for owning land. Landowners managed land specifically for wildlife (59%), following a systems approach (considering the needs of livestock, range, and wildlife, 84%), with few not managing their land for wildlife (9%). Landowners also managed their land to benefit pollinators (30%).
TAX INCENTIVES
Landowners were willing to participate in tax valuations (agricultural or wildlife, at least 62%) and were likely to participate in agricultural (41%) and wildlife valuation (53%) in the next several years. They were aware of wildlife valuation (79%) and had received free assistance with management plans in the past (44%). Some did not currently have a management plan (40%), although many had a management plan formally with an organization (i.e., NRCS, TPWD, contractor, 52% collectively) or for self (25%). Landowners indicated they were willing to participate in wildlife valuation if they had assistance developing a management plan (55%). Currently, 32% of landowner respondents participate in wildlife valuation.
acres 1000-2000 acres
Big game animals
Upland game birds
Migratory game birds
Non-game birds
Non-game animals
Exotic big game animals
Pollinators
Do not manage for wildlife
50.
Prairie Wildlife Species Managed by Farm Size and Income, TLS 2022.
PRAIRIE TEXAS LANDOWNER
Figure
Oak
Somewhat
Figure 51. Oak Prairie Likelihood of Participating in Agricultural Valuation by Farm Size and Income, TLS 2022.
Farm Size
acres 1000-2000 acres
Very likely
Somewhat
Neither likely nor unlikely
Somewhat unlikely
Not at all likely
Figure 52. Oak Prairie Likelihood of Participating in Wildlife Valuation by Farm Size and Income, TLS 2022.
1000-2000 acres
acres
500-999 acres
Natural Resources
Conservation Services
Private consultant
Self
Texas Parks & Wildlife Department
Do not have a management plan
Other
Figure 53. Oak Prairie Management Plans by Organization, Farm Size, and Income, TLS 2022.
SOUTH TEXAS PLAINS
REASONS FOR OWNING LAND AND WILDLIFE MANAGED
Landowners managed their land specifically to benefit wildlife (82%) across many farm income and farm size categories in the South Texas Plains region (Figures 54-57), following a systems approach (considering the needs of livestock, range, and wildlife, 90%), with a focus on big game (92%), upland game birds (77%), and migratory game birds (72%), among other wildlife. Pollinators also were managed (23%). Hunting (87%), family (83%), and wildlife (83%) were the main reasons for owning land in the region. Common land practices included brush management (94%), hunting (game inventory and harvest management, 90%), feral animal control (79%), and predator control (71%).
TAX INCENTIVES
Landowners in the region were aware of wildlife valuation (85%) and 55% participated in the program. Some had received free assistance with management plans (62%) and few did not have a management plan (18%), although many had plans formally with organizations (i.e., NRCS, TPWD, consultant, 91% collectively) or for self (31%). Landowners indicated their willingness to participate in tax valuations (agricultural or wildlife, at least 71%), were likely to participate in agricultural (49%) and wildlife valuation (68%) in the future, and in wildlife valuation specifically, if they had assistance developing a widlife management plan (70%). Few landowners did not manage their land for wildlife (5%).
Big game animals
Upland game birds
Migratory game birds
Non-game birds
Non-game animals
Exotic big game animals
Pollinators
Do not manage for wildlife
Figure 54. South Texas Plains Wildlife Species Managed by Farm Size and Income, TLS 2022.
Very likely
Somewhat
Neither likely nor unlikely
Somewhat unlikely
Not at all likely
Figure 55. South Texas Plains Likelihood of Participating in Agricultural Valuation by Farm Size and Income, TLS 2022.
SOUTH TEXAS PLAINS TEXAS LANDOWNER
Very likely
Somewhat
Neither likely nor unlikely
Somewhat unlikely
Not at all likely
Figure 56. South Texas Plains Likelihood of Participating in Wildlife Valuation by Farm Size and Income, TLS 2022.
Farm Size
2000 acres
1000-2000 acres
Natural Resources
Conservation Services
Private consultant
Self
Texas Parks & Wildlife Department
Do not have a management plan
Other
acres
Figure 57. South Texas Plains Management Plans by Organization, Farm Size, and Income, TLS 2022.
SOUTH TEXAS PLAINS TEXAS LANDOWNER SURVEY,
From the TLS data, we derive an overview of wildlife management across the state and at a regional level. We also see a clear snapshot of the people who steward Texas’ rural working lands. Here are a few observations:
• Texas’ land stewards, regardless of farm income, value wildlife across farm size categories. Previous TLS efforts¹ described wildlife as a priority for landowners and updated TLS data highlights continued landowner interest in wildlife management.
• Previously, the TLS report¹ highlighted landowners’ drive to maintain their lands, to pass them on to future generations. Tax incentives and other financial incentives continue to be of interest to landowners.
• This regional assessment provides both information to continue the conversation on tax incentives, to include agricultural and wildlife valuation, and perhaps a discussion on the expansion of current incentives or the development of newer methods to assist all landowners in stewarding natural resources for the benefit of wildlife and many Texas communities.
• From the TLS dataset, it is clear landowners have an interest in wildlife management plans and need assistance in developing and maintaining wildlife management plans current and active, to include management activities. Current landowner programming efforts can use these data and the report to inform discussions on valuation in general, wildlife management plans, and whether it makes sense to assist landowners in these areas, as wildlife and land stewardship efforts benefit Texans.
The TLS is a great tool in helping not only determine landowner attitudes, behaviors, perceptions, challenges, constraints, and land management decisions, but also in pinpointing specific areas where there may be space to assist landowners with information and programs they actually want and need. We are very grateful to all the landowners who have participated in the TLS survey because their responses are helping natural resource professionals better serve them, their lands, and Texas communities.
5. FUTURE
OUTLOOK
Landowner demographics are shifting toward older landowners and the replacement generations are lagging in growth. Many operations consist of two land managers, which may offer continuity in both maintaining operations and transferring stewardship knowledge and practices to newer generations. Landowner incentives, agricultural and wildlife, to include valuations, are but a few tools to consider in maintaining the stewardship legacy of Texas landowners, and from a nature benefits perspective, this may be a win for Texas communities.
6. LITERATURE CITED
1 Lopez, A., D. Barrientos, R. Lopez, K. L. Skow, M. Crawford, J. Dreibelbis, K. B. Hays, and B. N. Wegner. 2023. Texas Landowner Survey. Texas A&M Natural Resources Institute, College Station, TX, USA.
2 USDA COA. 2024. United States Department of Agriculture National Agricultural Statistics Service. 2022 Census of Agriculture.
3 US Census. State profile: Texas. https://data.census.gov/profile/Texas?g=040XX00US48. Accessed 06/20/2024.
4Smith, L.A., A.A. Lund, R.R. Lopez. 2023. Conserving Texas: Quantifying Ecological Return on Investment. Texas A&M Natural Resources Institute, Research Report Number 2023-1. College Station, Texas, USA.