Covington Housing Study

April 15, 2025


April 15, 2025
The Virginia Department of Housing and Community Development (DHCD) has provided funding for the City of Covington to conduct a City-wide Housing and Infrastructure Assessment. The study has mapped and conducted a windshield survey that will provide information on local housing conditions, identifies properties potentially in need of assistance and denotes the absence of necessary infrastructure to enhance neighborhood quality of life. The study will be used to inform the City’s staff, officials, and DHCD of the conditions in the community, as well as provide recommendations on relevant policies, programs, and funding sources to improve areas of need. Areas of need may include issues such as accessibility to affordable units, diversifying the types of housing available, rehabilitating the current stock of aging units, or incentivizing the production of new units.
Quantitative demographic data was collected and analyzed for this report from various sources, such as ESRI Business Analyst, U.S. Census data, and the most recent 2023 American Community Survey (5 Year Estimates), to provide as clear a picture as possible of existing conditions in the City.
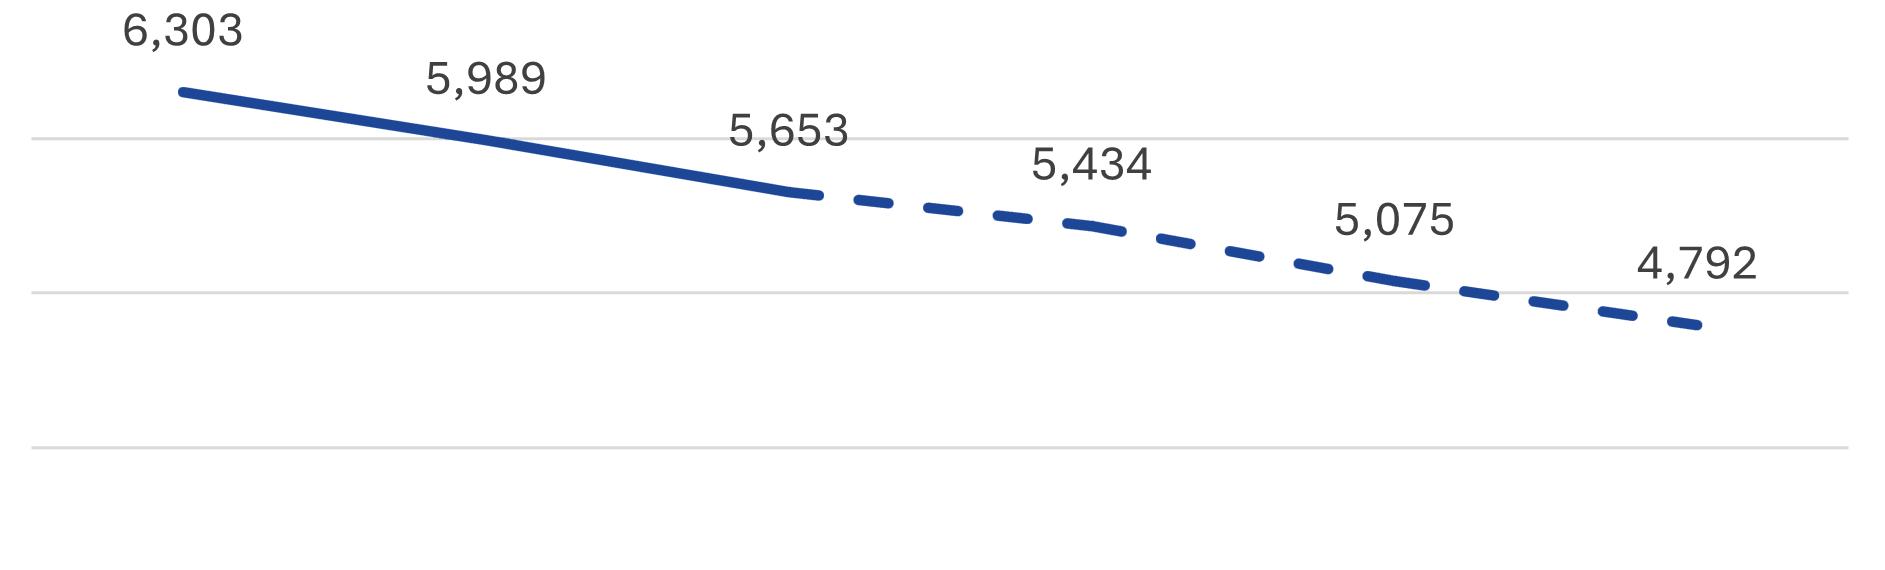
Demographic data was collected and analyzed from the U.S. Census Bureau to understand existing conditions in the City. The total population of Covington is estimated at 5,671 per the latest available 2023 American Community Survey 5-Year Estimates Data. This number represents an ongoing decrease in the population, which is down 632 people from the year 2000. The University of Virginia’s Weldon Cooper Center for Demographics, which projects population forecasts for Virginia’s localities to plan for their future, forecasts that the City of Lexington will continue to see a decrease in population, falling to 4,792 people by the year 2050.
Covington’s lack of growth is likely due to various factors and challenges that are shared with other rural or singular industry-dependent localities across Virginia. Production shifting elsewhere or limited opportunities for younger people who want different employment can make it more difficult to retain successive generations in the same community. However, given national trends in affordability or extreme weather, places like Covington stand out for their ability to provide a strong center for employment, recreation, and more for their region and welcome newcomers while supporting the existing community.
Population by Age & Sex
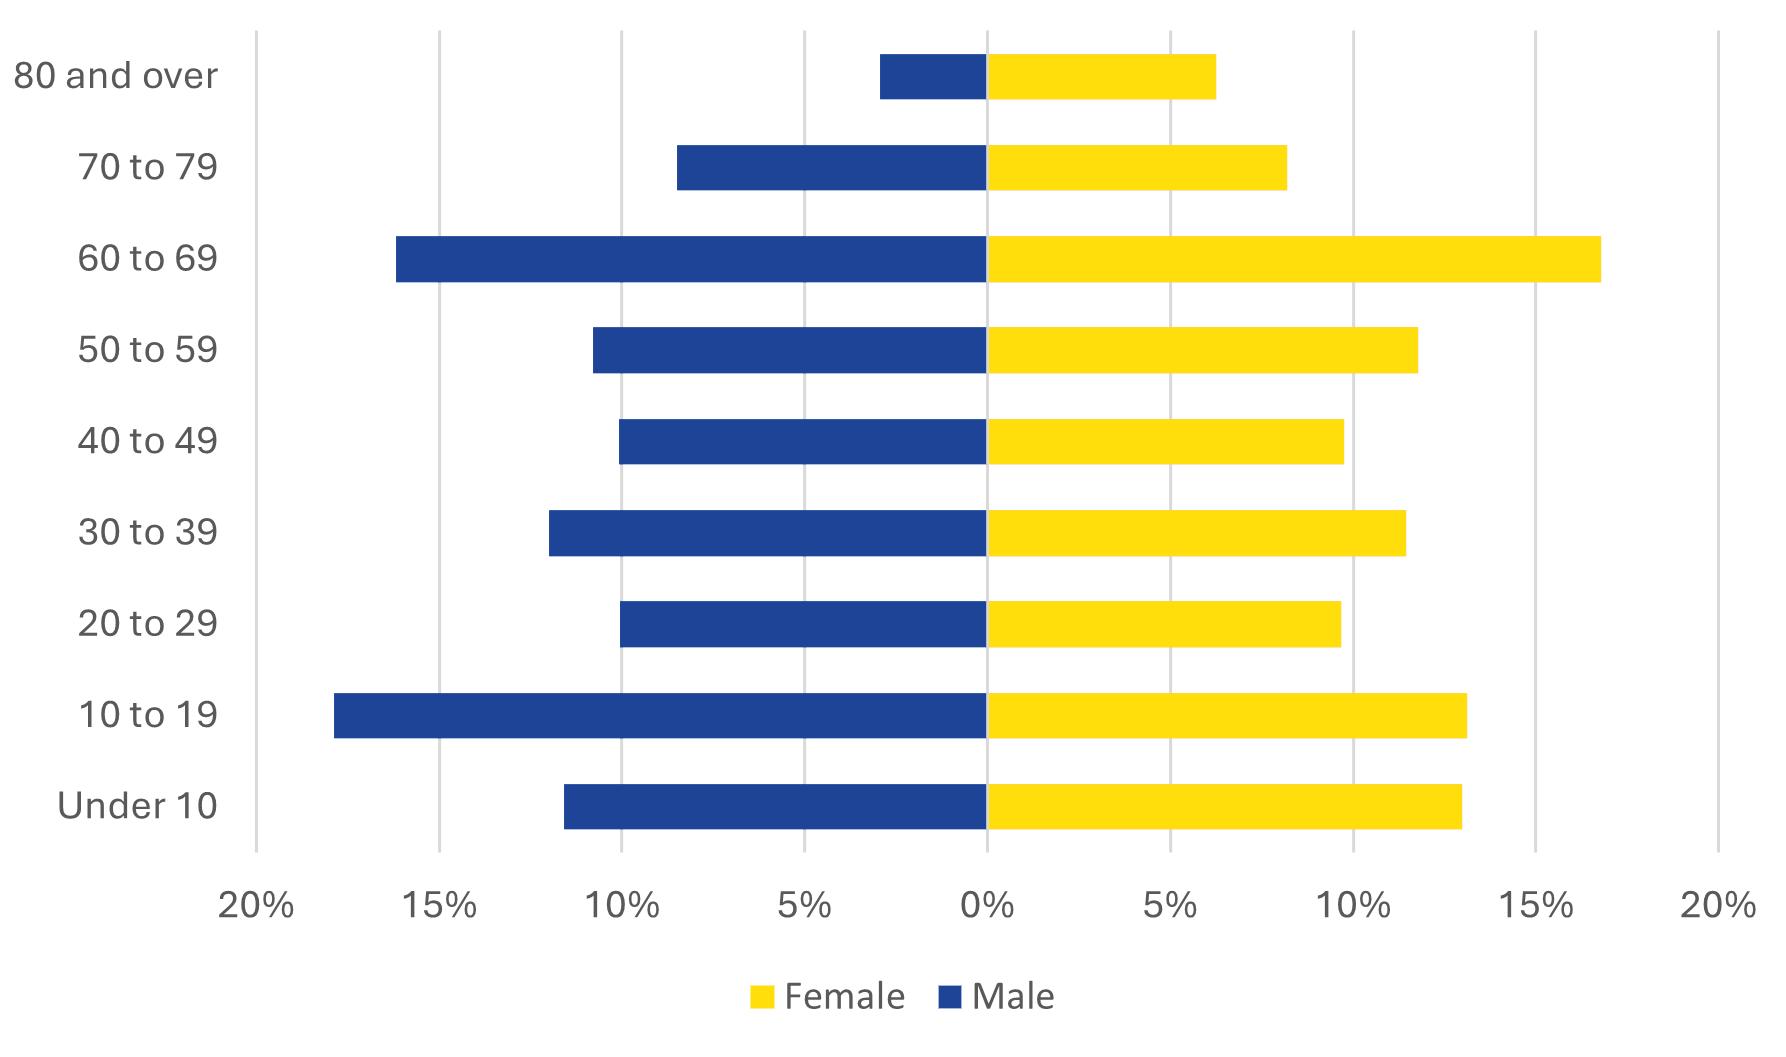
The chart above shows that Covington’s largest share of the population is predominantly older, with the largest share of the population being ages 60-69, however, there is an even distribution of young to middle age adults, with a large population of 10-19 year olds. The average family size in Covington is 2.88, this is slightly smaller than the typical family size of 3.07 in Virginia overall. Larger populations of younger people that tapers off as they age is evidence of people leaving Covington to seek higher education or employment opportunities elsewhere. When they do not “reappear” in older brackets, it shows that they are remaining elsewhere rather than returning. The median age of Covington is 41.5 (2023 ACS 5-Yr. Est.). This is somewhat higher than the United States median age of 38.7 and Virginia’s of 38.8.
Having an aging population that lives in Covington can have implications for the housing stock. Elderly populations may have trouble maintaining homes and successive inheritance of homes may have challenges being placed back on the market. This study will look at overall affordability of housing relative to local income. With declining populations, the supply of housing may be affordable, but it can also be constrained by aging homes not receiving continual maintenance or the market not being able to incentivize the steady production of new housing. As this problem continues, it further creates the conditions in which people look for opportunities elsewhere.
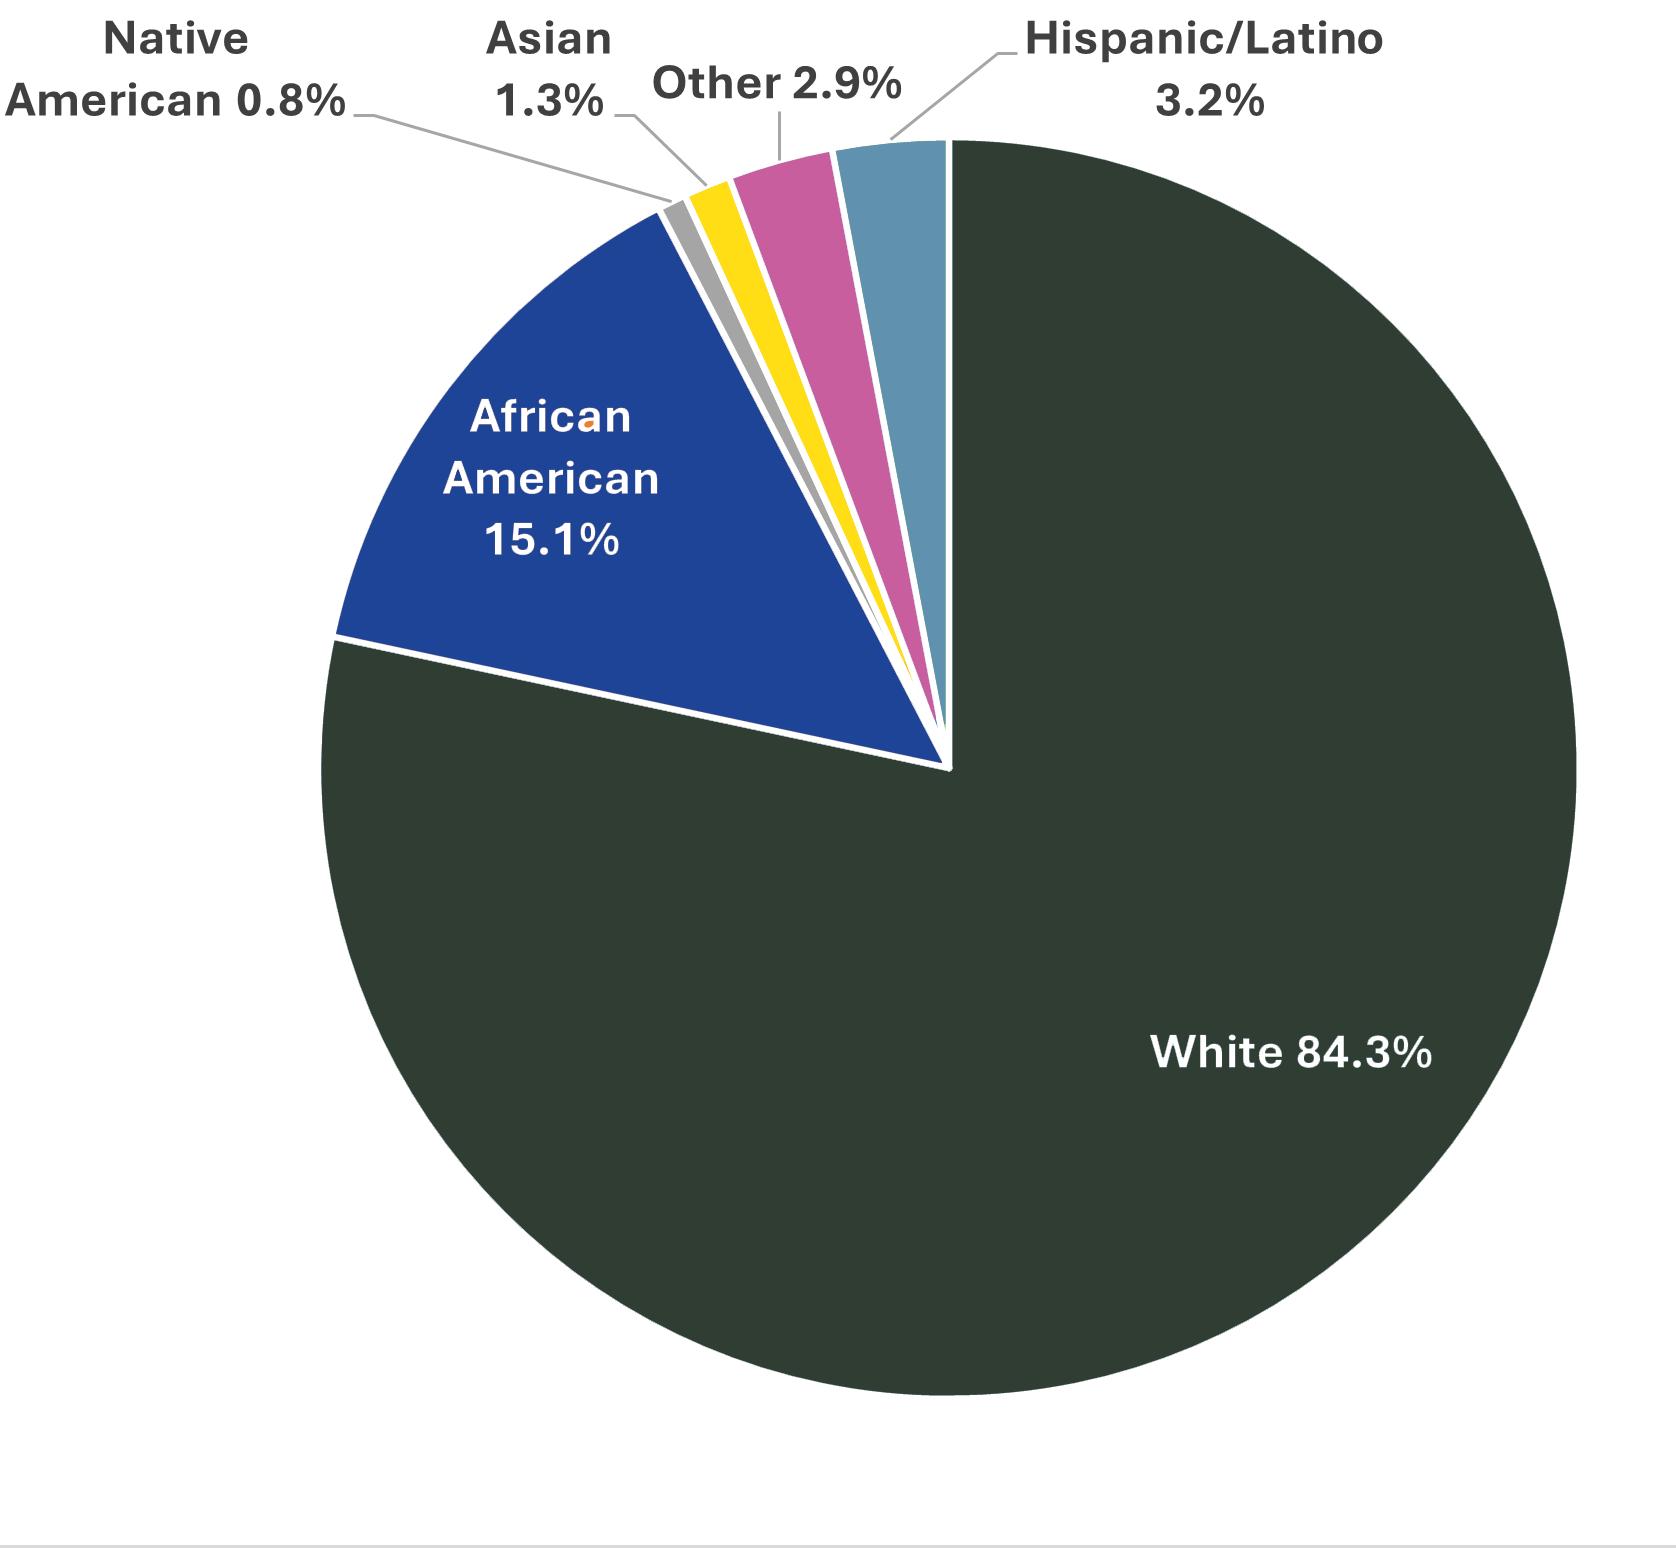
The City’s racial demographics show that the population is predominantly white, represented by 84.3% of the population. The second largest demographic are people who identify as African American at 15.1%. Hispanic/Latino people who identify as any race make up 3.2% of the population.
3,038 Total Housing Units
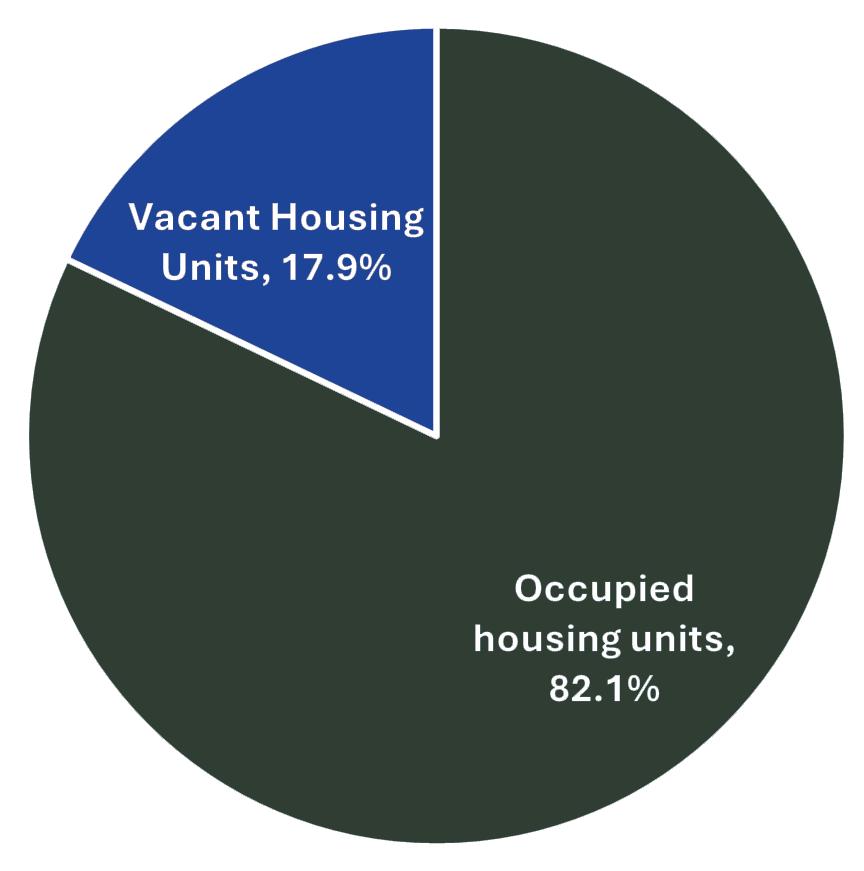
The American Community Survey data estimates that there are approximately 3,038 total housing units in the City. Of these, 82.1% are occupied, while 17.9% are vacant. This is a relatively high vacancy rate, which may be due to the physical condition of units or people who own the homes choosing to live elsewhere.
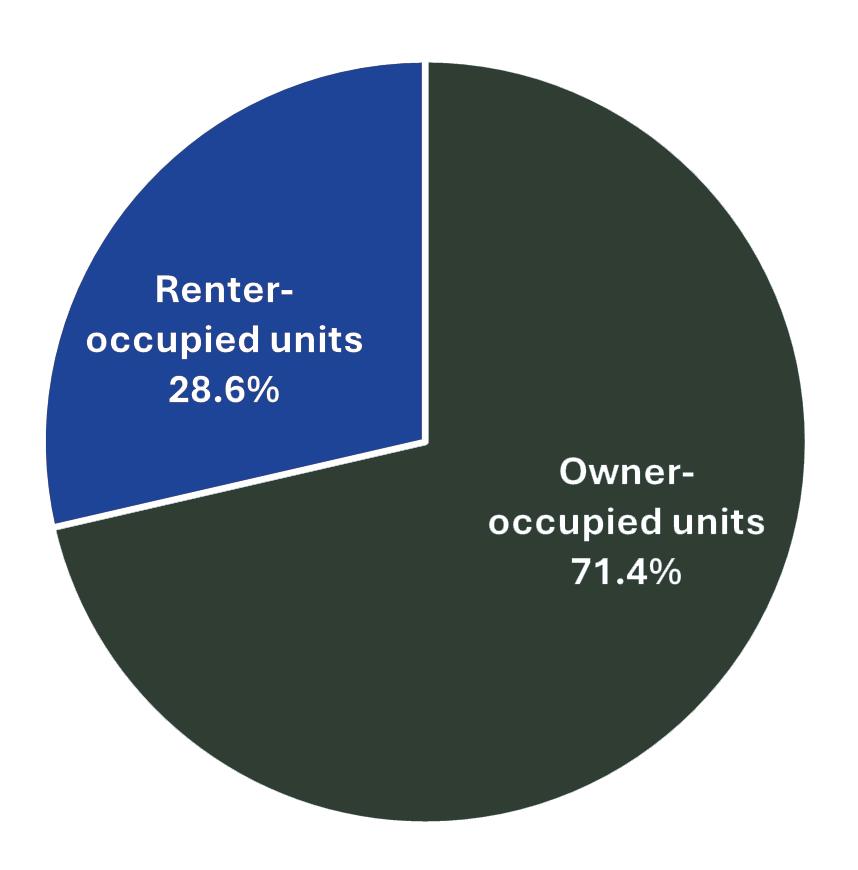
Of the occupied units, 71.4% are owneroccupied and 28.6% are renter occupied. Closer examination of trends in affordability will show how these different groups may be impacted in the local housing market.
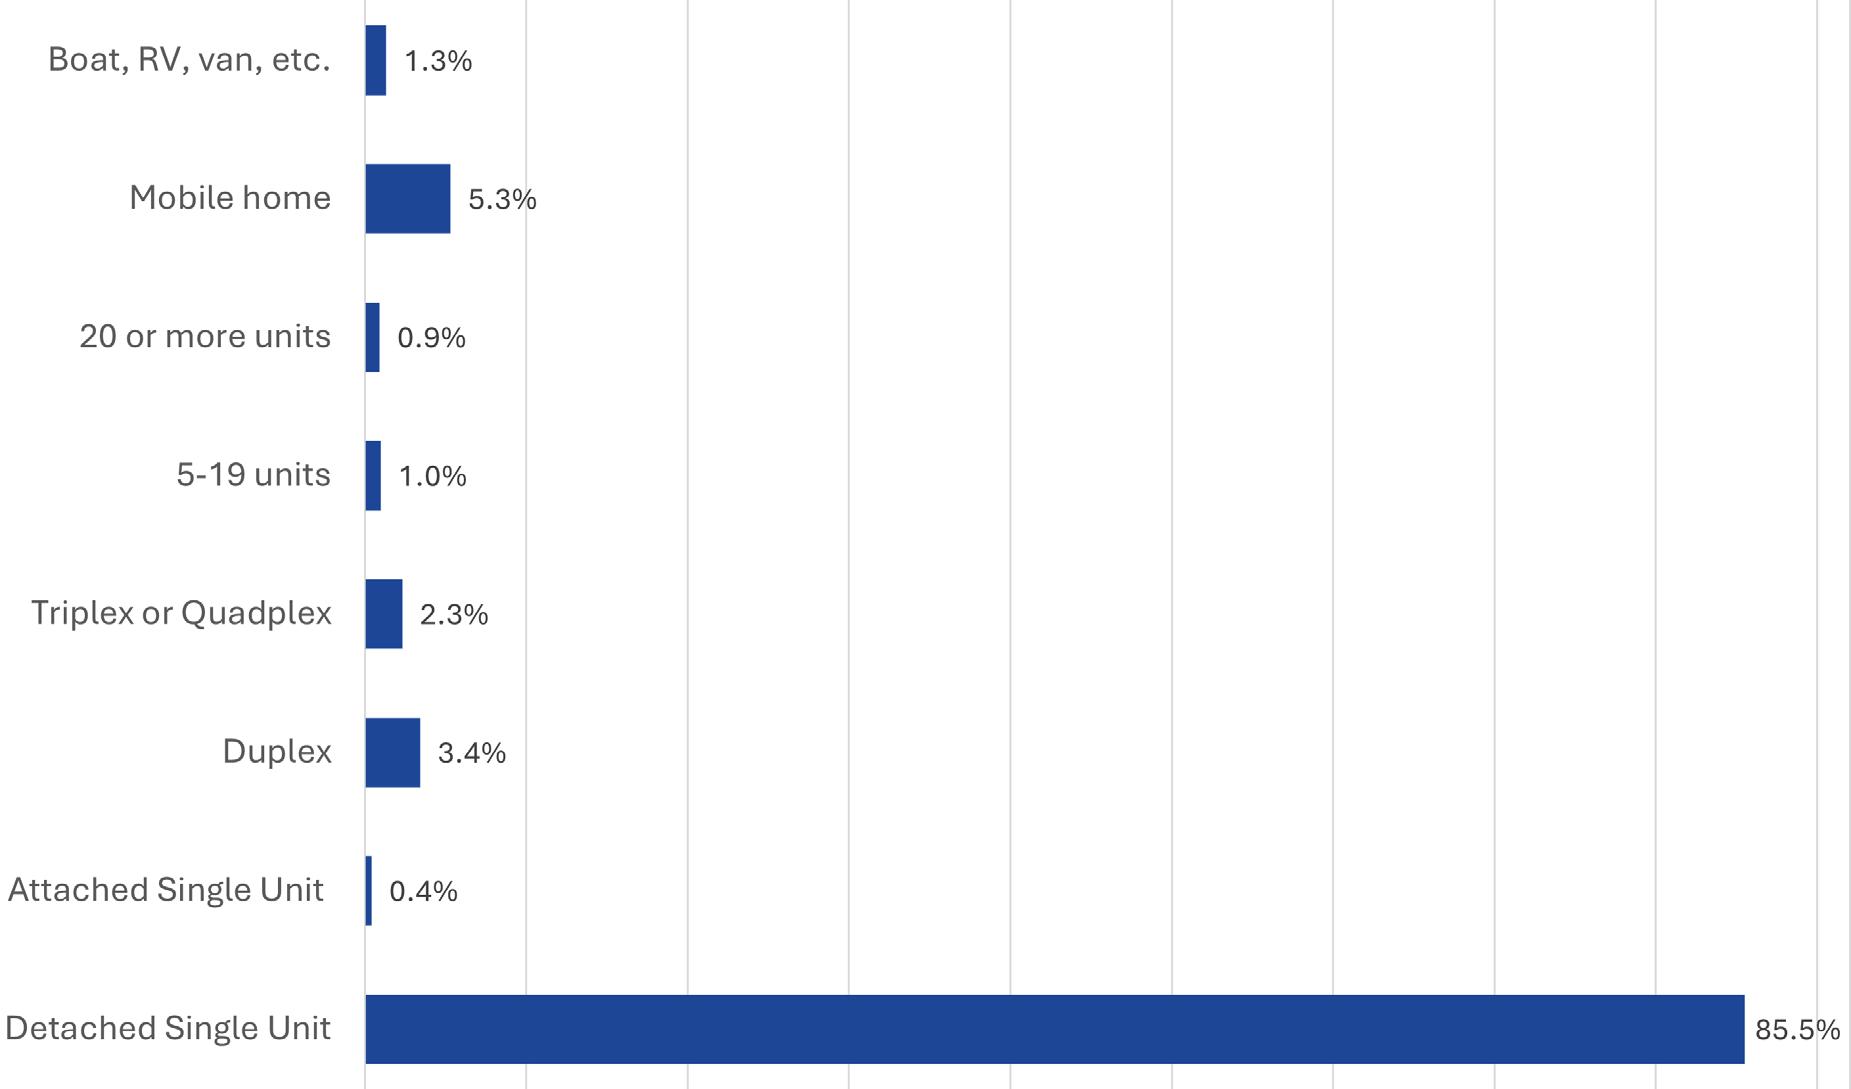
Of the occupied housing units, residents of Covington overwhelmingly live in single family detached houses (85.5%). Only 4.2% of the structures are multi-family apartments. Diversifying housing types to maximize affordability and unit availability can help accommodate varying life needs, like downsizing or only looking for a small place to rent.
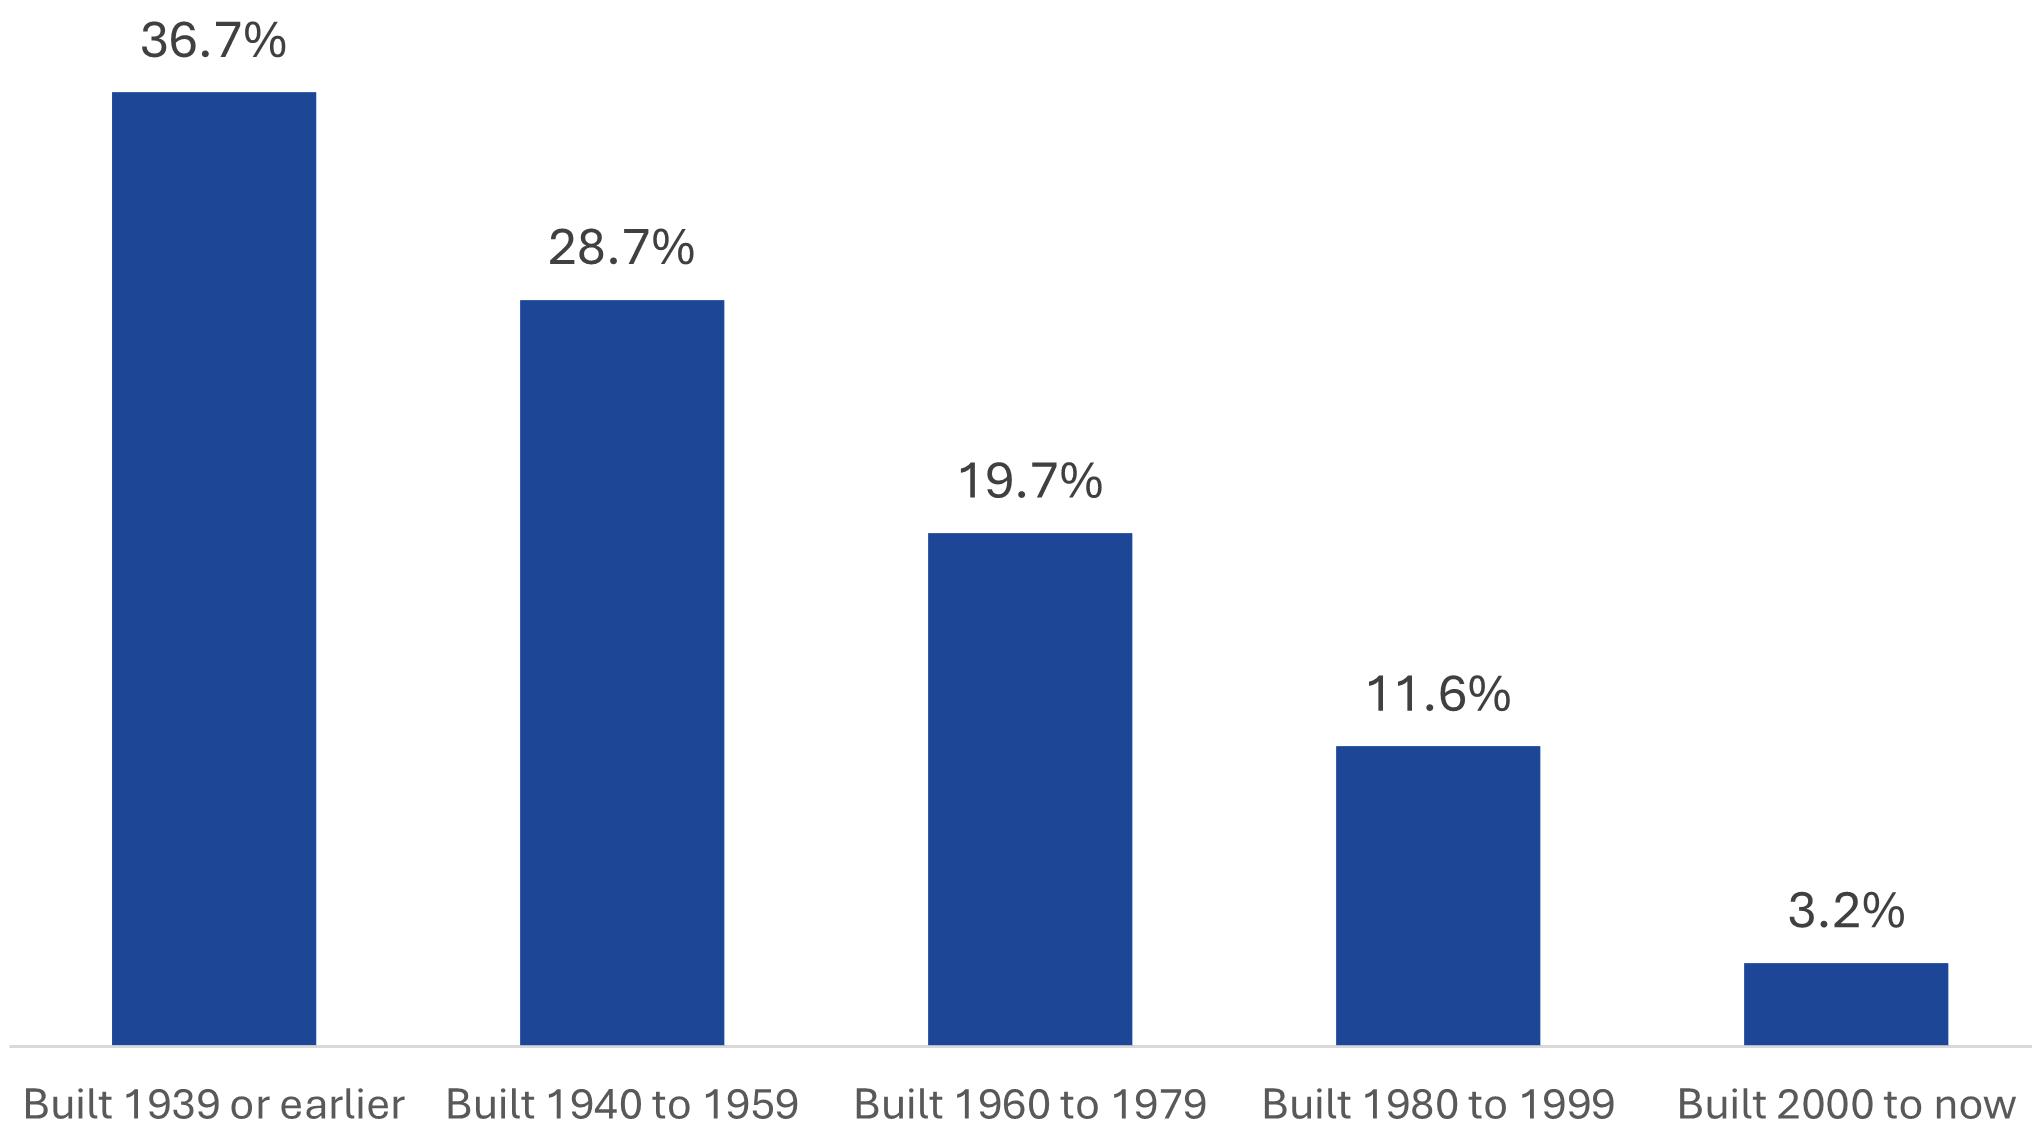
The chart below shows the percentage of units built by year. Covington’s housing stock was predominantly built earlier than 1939, 86 years ago. Many structures will reach the end of their life cycle unless they have constant preservation and maintenance. In more recent years, new housing construction has slowed to a halt.
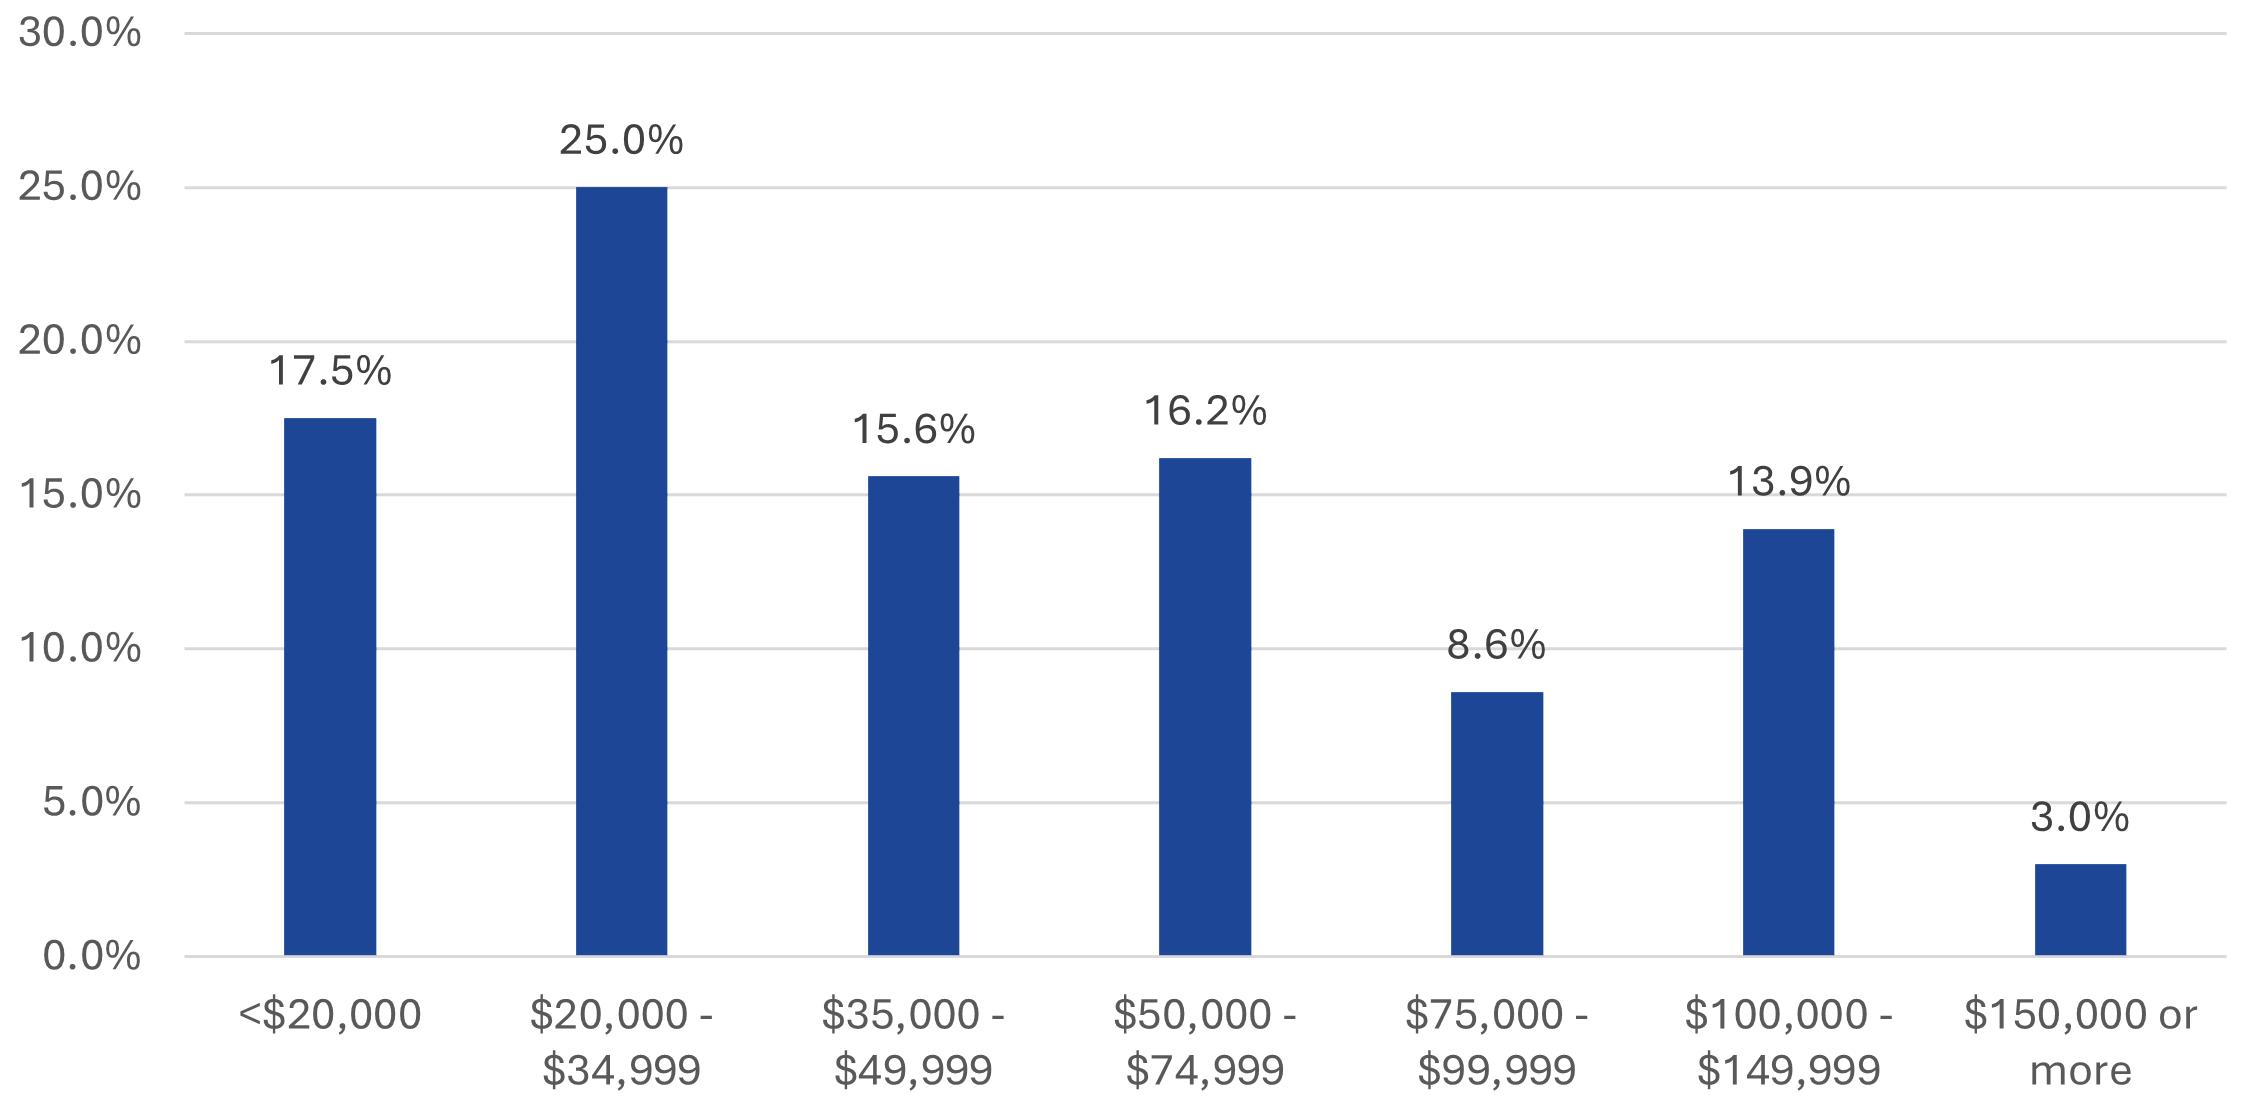
The City’s median household income is estimated at $42,724. The chart above shows that the largest amount of households around $20,000 to $34,999. 25.5% of households have incomes lower than $75,000. This is lower than Alleghany County’s median of $55,160. Virginia’s overall median is estimated at $89,931. Ensuring that income levels match the local housing market is important for ongoing sustainability of housing affordability.
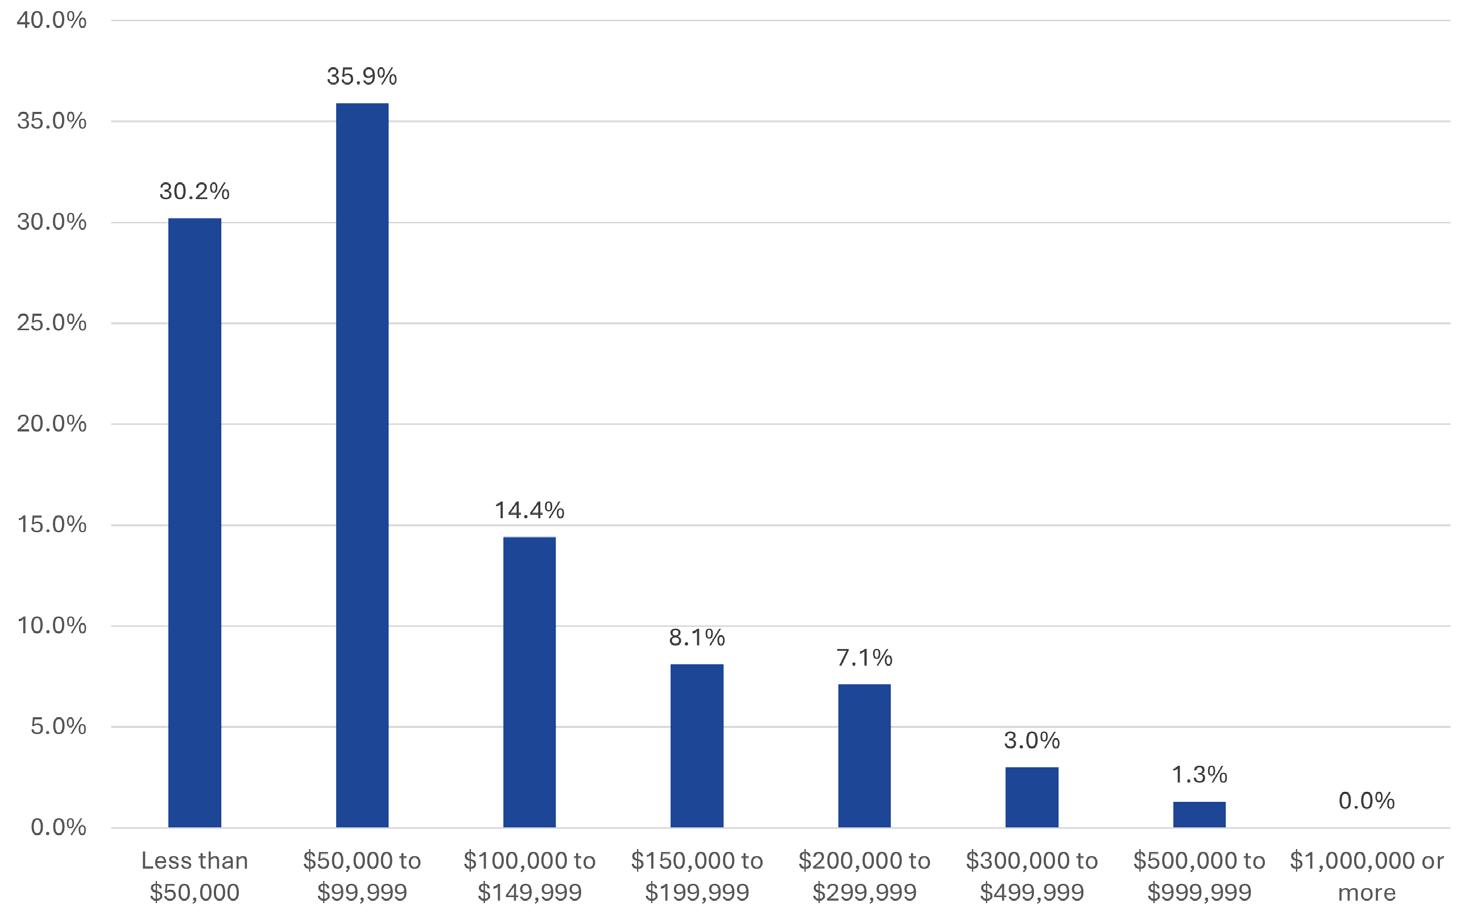
Potential homebuyers are often advised to look for a home that is approximately 3 to 5 times their household income. One way to reveal affordability problems in a community is to look at how Median Household Income compares to Median Home Value. Therefore, with a household income of $42,724, homes should range between $128,172 and $213,620. The Median Home Value in Covington is $80,200 and the value of most of Covington’s units are below this range. However, the affordability of units may mask other issues, such as aging structures.
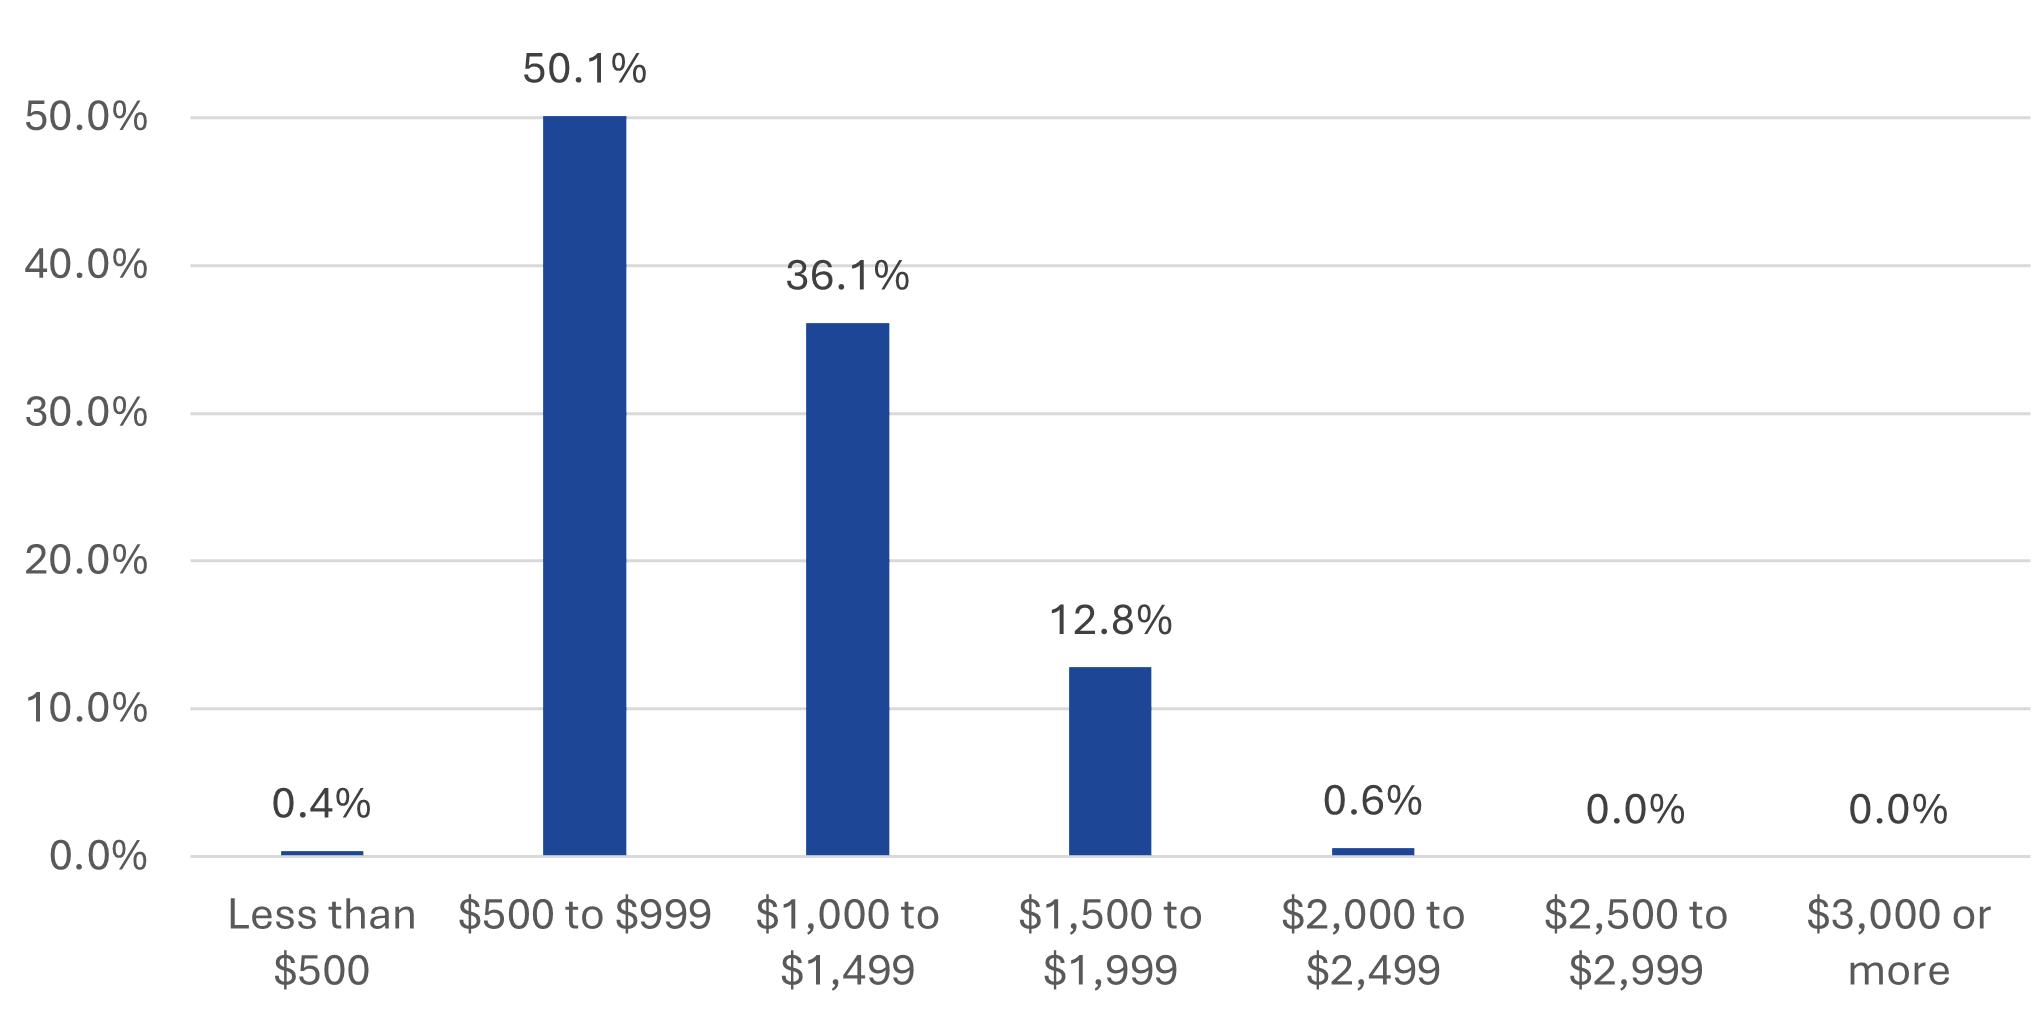
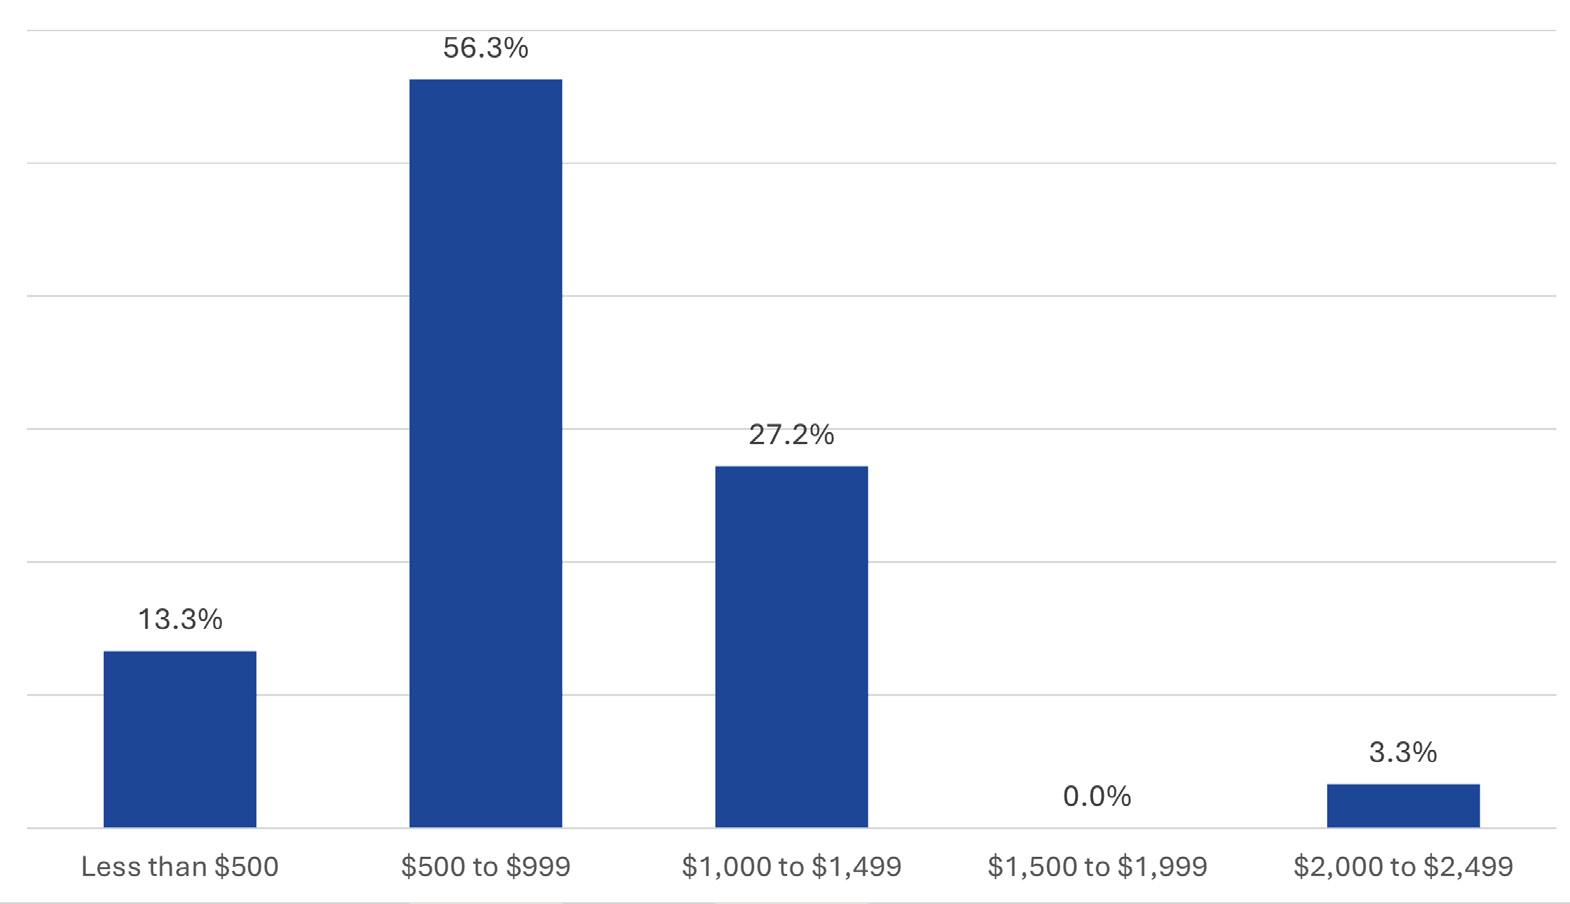
The overall cost of housing is a significant factor for individuals and families in deciding where to live. Conventional wisdom typically states that home ownership is a route to affordability of housing. The above chart shows the typical monthly housing costs of households with a mortgage. Half of households (with a mortgage) are paying only $500 to $999 per month.
In the chart below, without a mortgage, housing costs are generally cheap because the home is paid off. With the hidden costs of homeownership, such as maintenance and upkeep or renovating older homes, housing costs can be a large challenge even to homeowners in the City of Covington. Allowing a larger more diverse housing supply could help ease the cost for homeowners as well.
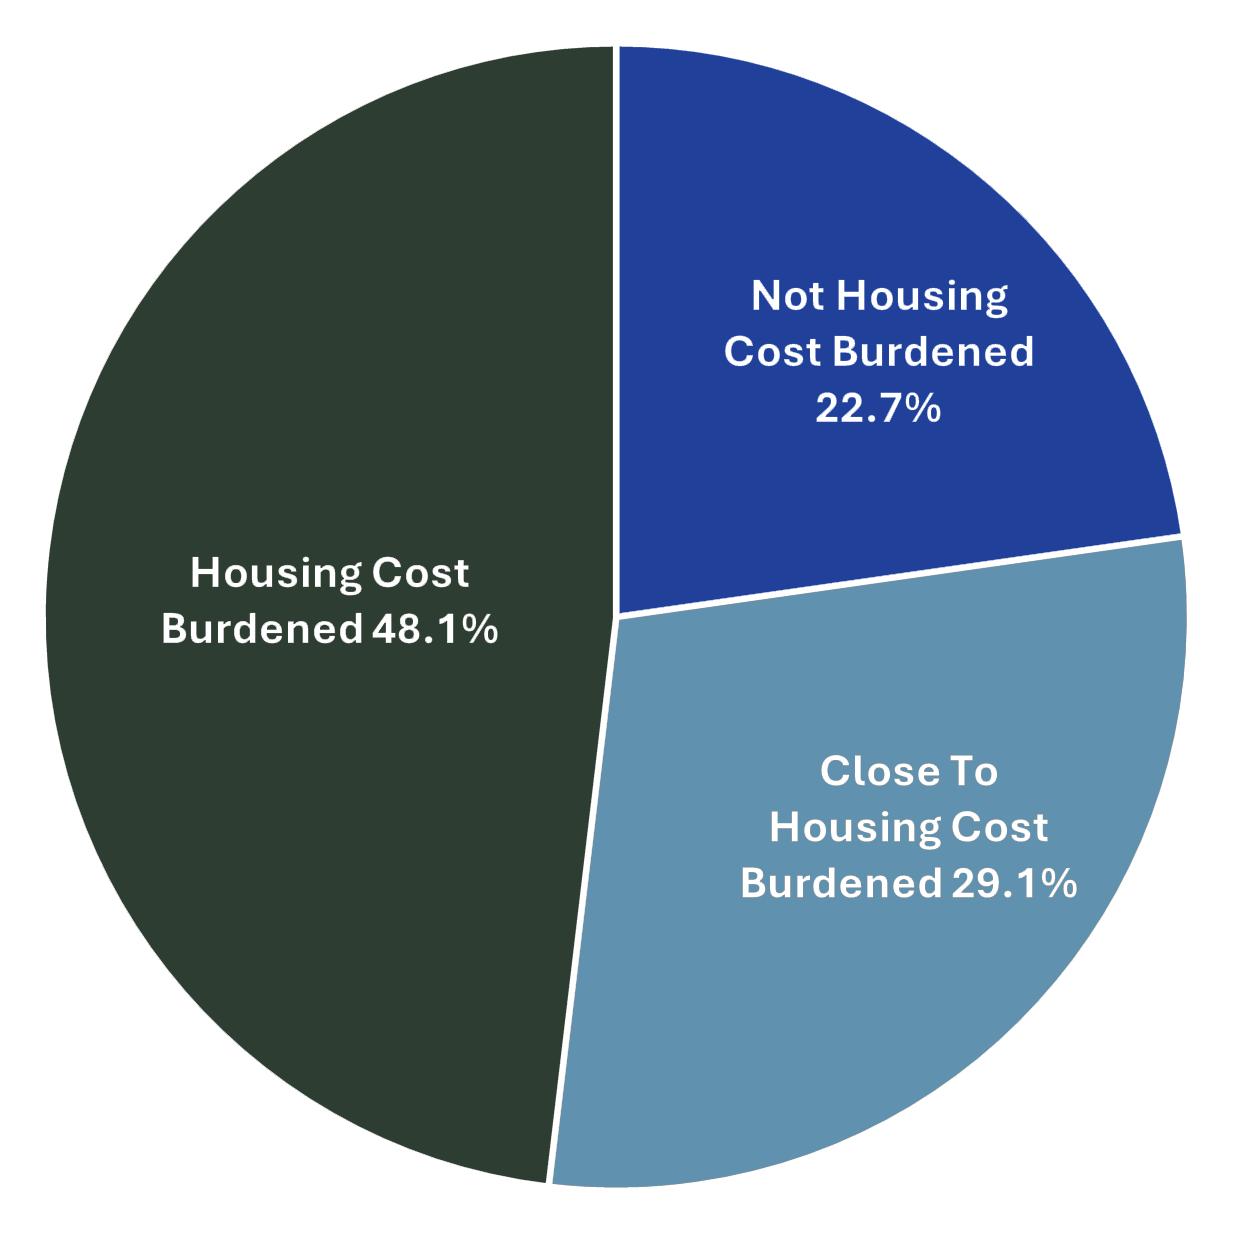
The U.S. Department of Housing and Urban Development (HUD) defines housing-cost burdened families as those who spend more than 30% of their income on housing. The chart on the right breaks the income to housing cost ratio down into three categories for Covington’s population.
Not Cost burdened - Paying less than 20% of income on housing.
Close to housing cost burdened - paying 20% to 29% of income on housing.
Housing cost burdened - paying 30% of income or more on housing.
Over 75% of the City’s population is cost burdened or close to housing cost burdened relative to their income.
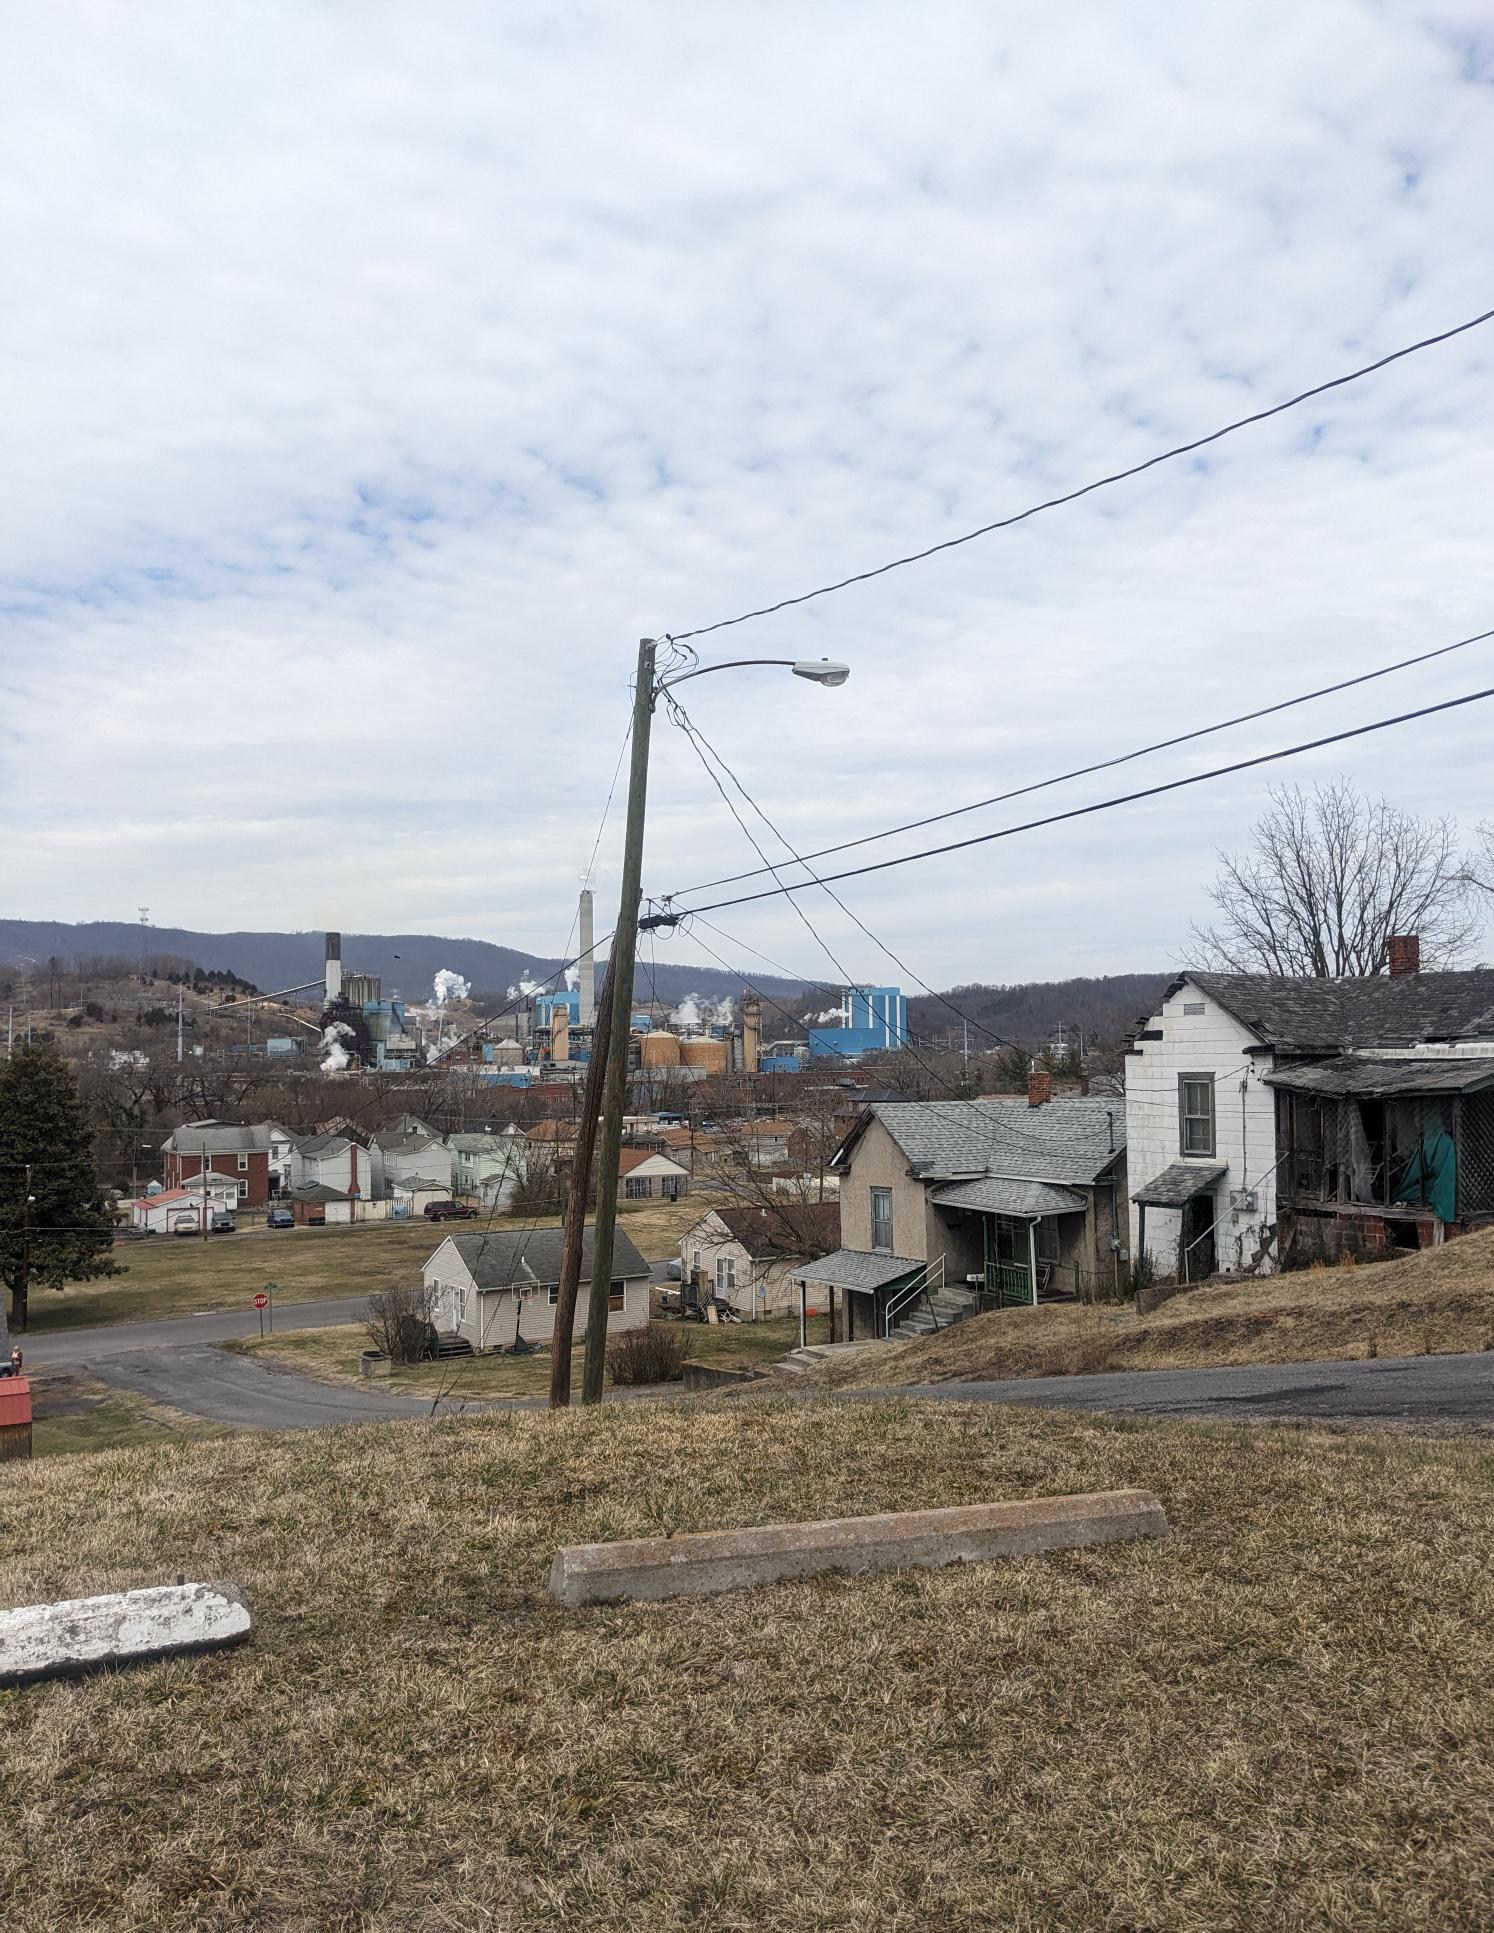
The City is located off of Interstate 64 West and connected to Route 60 and Route 220 which bisect Covington. There is the active presence of industrial manufacturing, and the City’s housing and main street areas follow both the railroad and the banks of the Jackson river.
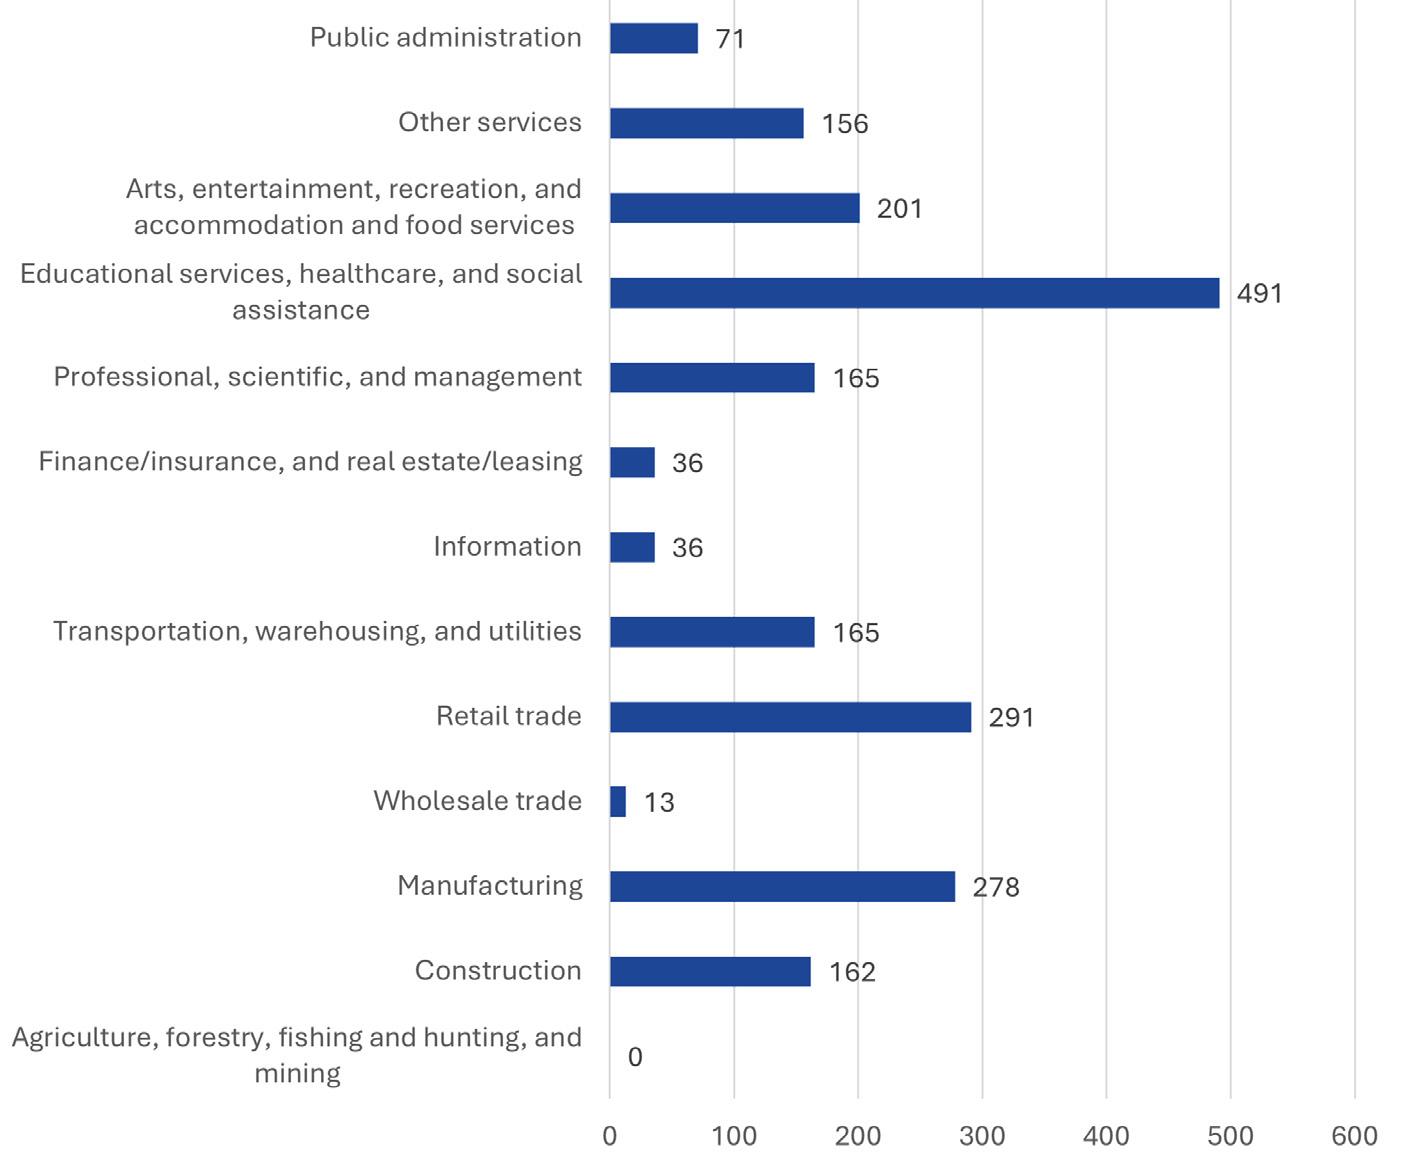
There is a population of 4,468 aged 16 and over with 47.3% participating in the labor force. The unemployment rate is approximately 2.4%. Covington features generally diverse sources of employment, with limited reliance on any one industry.
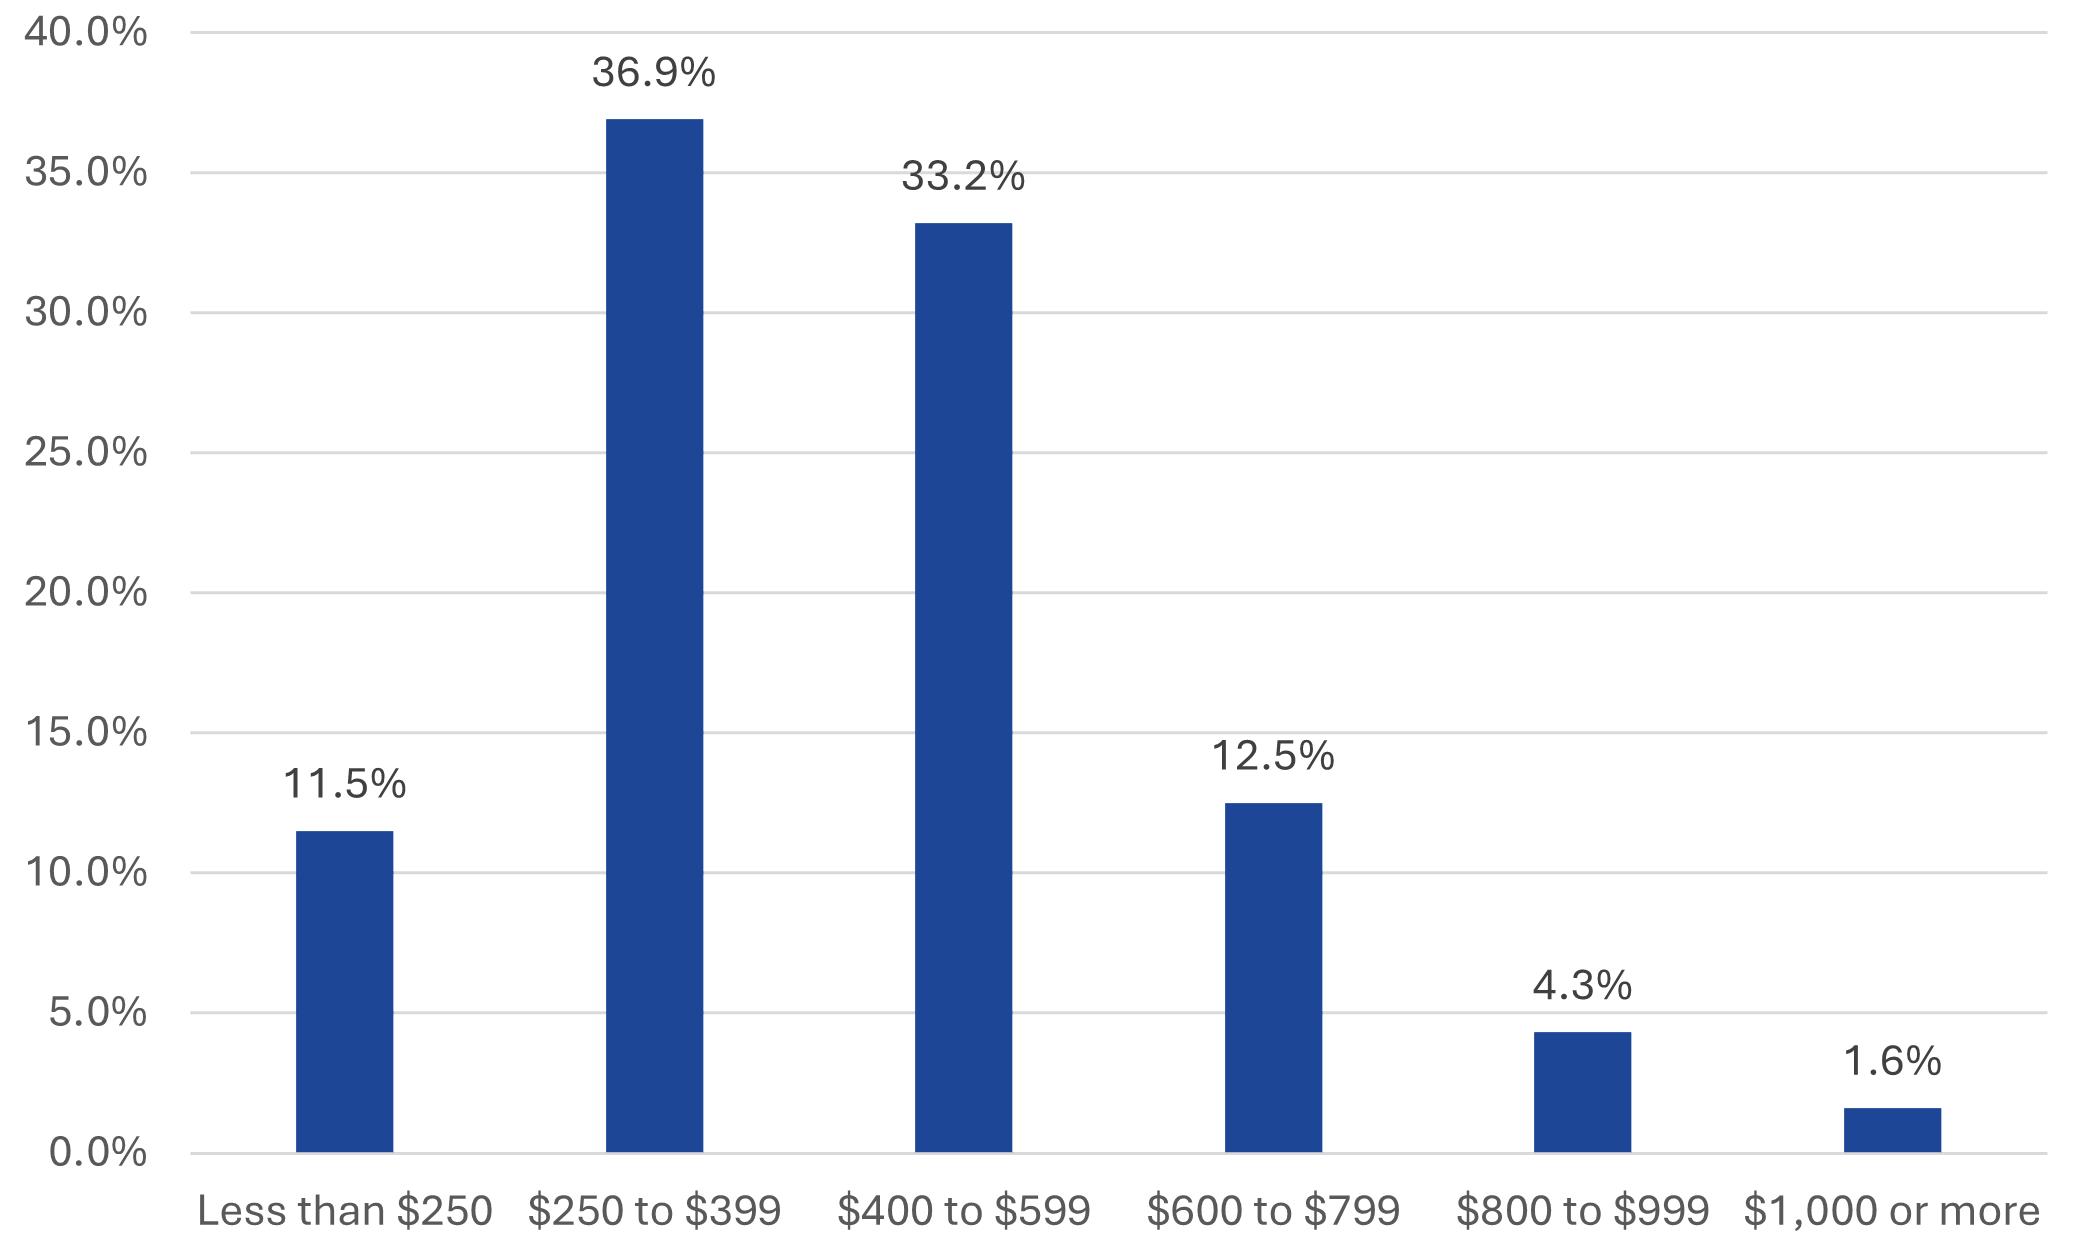
There are 611 total occupied units paying rent.
Rent is predominantly between $500 and $1,500 though more units are below $1,000 per month.
Annual rent for most units is around $6,000 to $12,000. Relative to income, this still may not be affordable for most households.
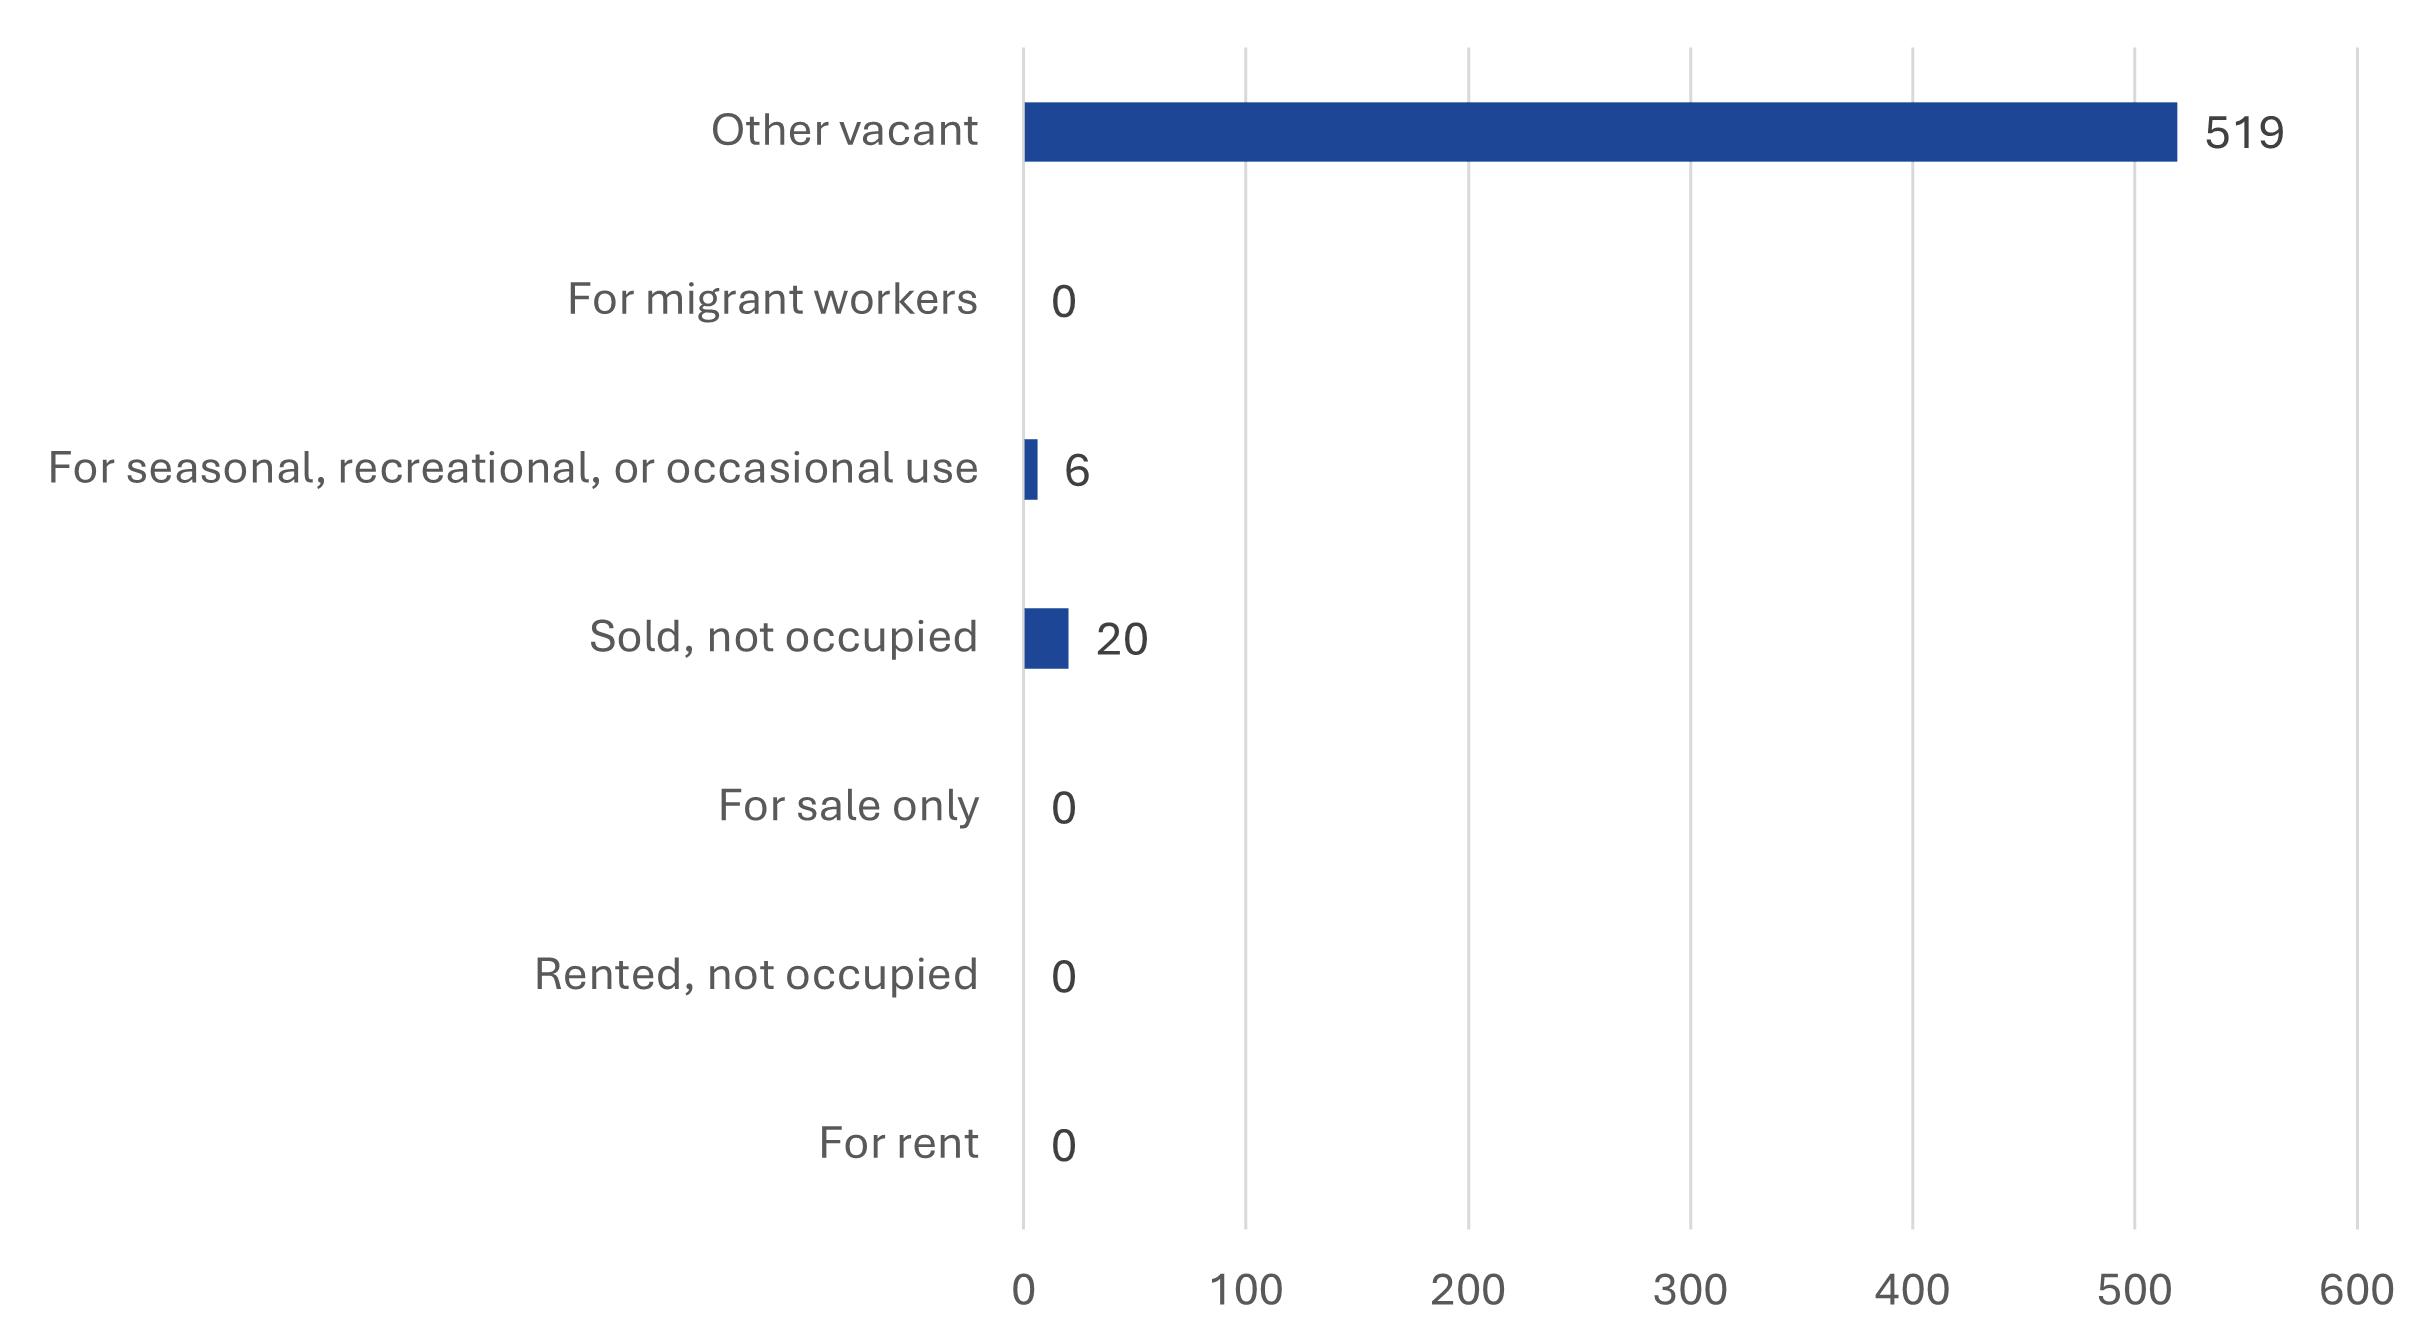
The chart below shows that there are 519 vacant units and no units for rent at the time of the estimate. Finding ways to bring these vacant units back to the market for rent or ownership is important for sustaining housing conditions.
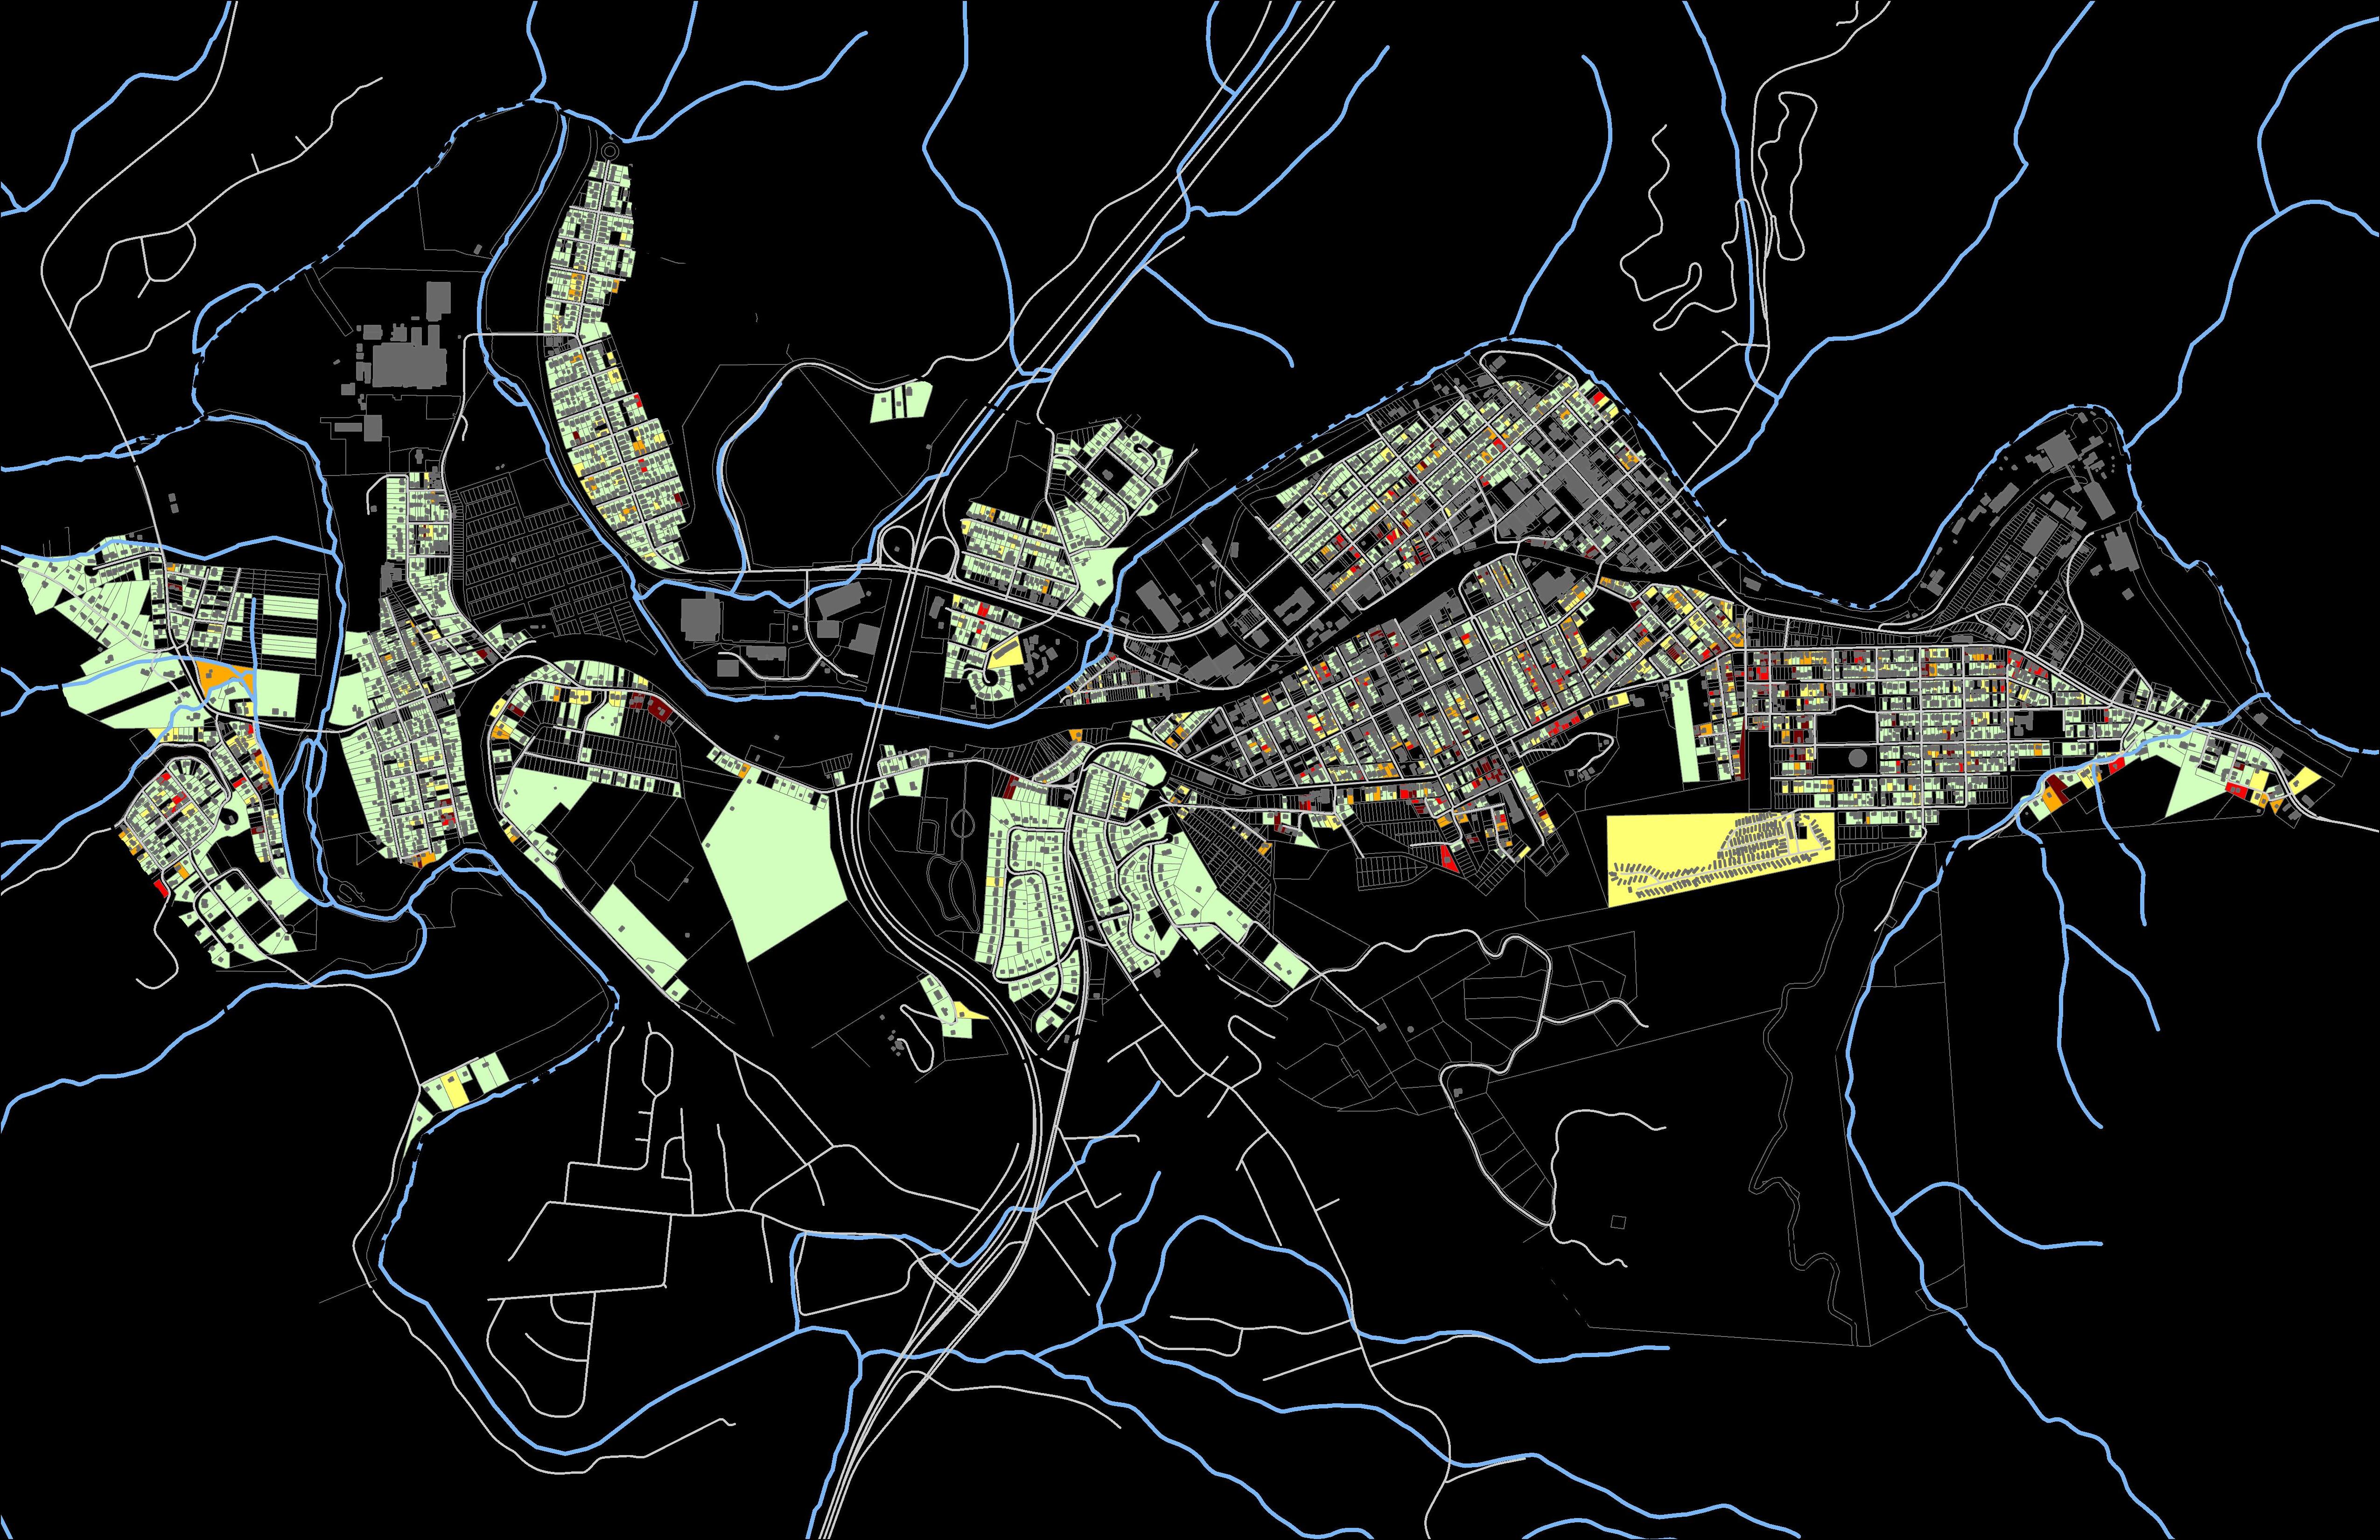
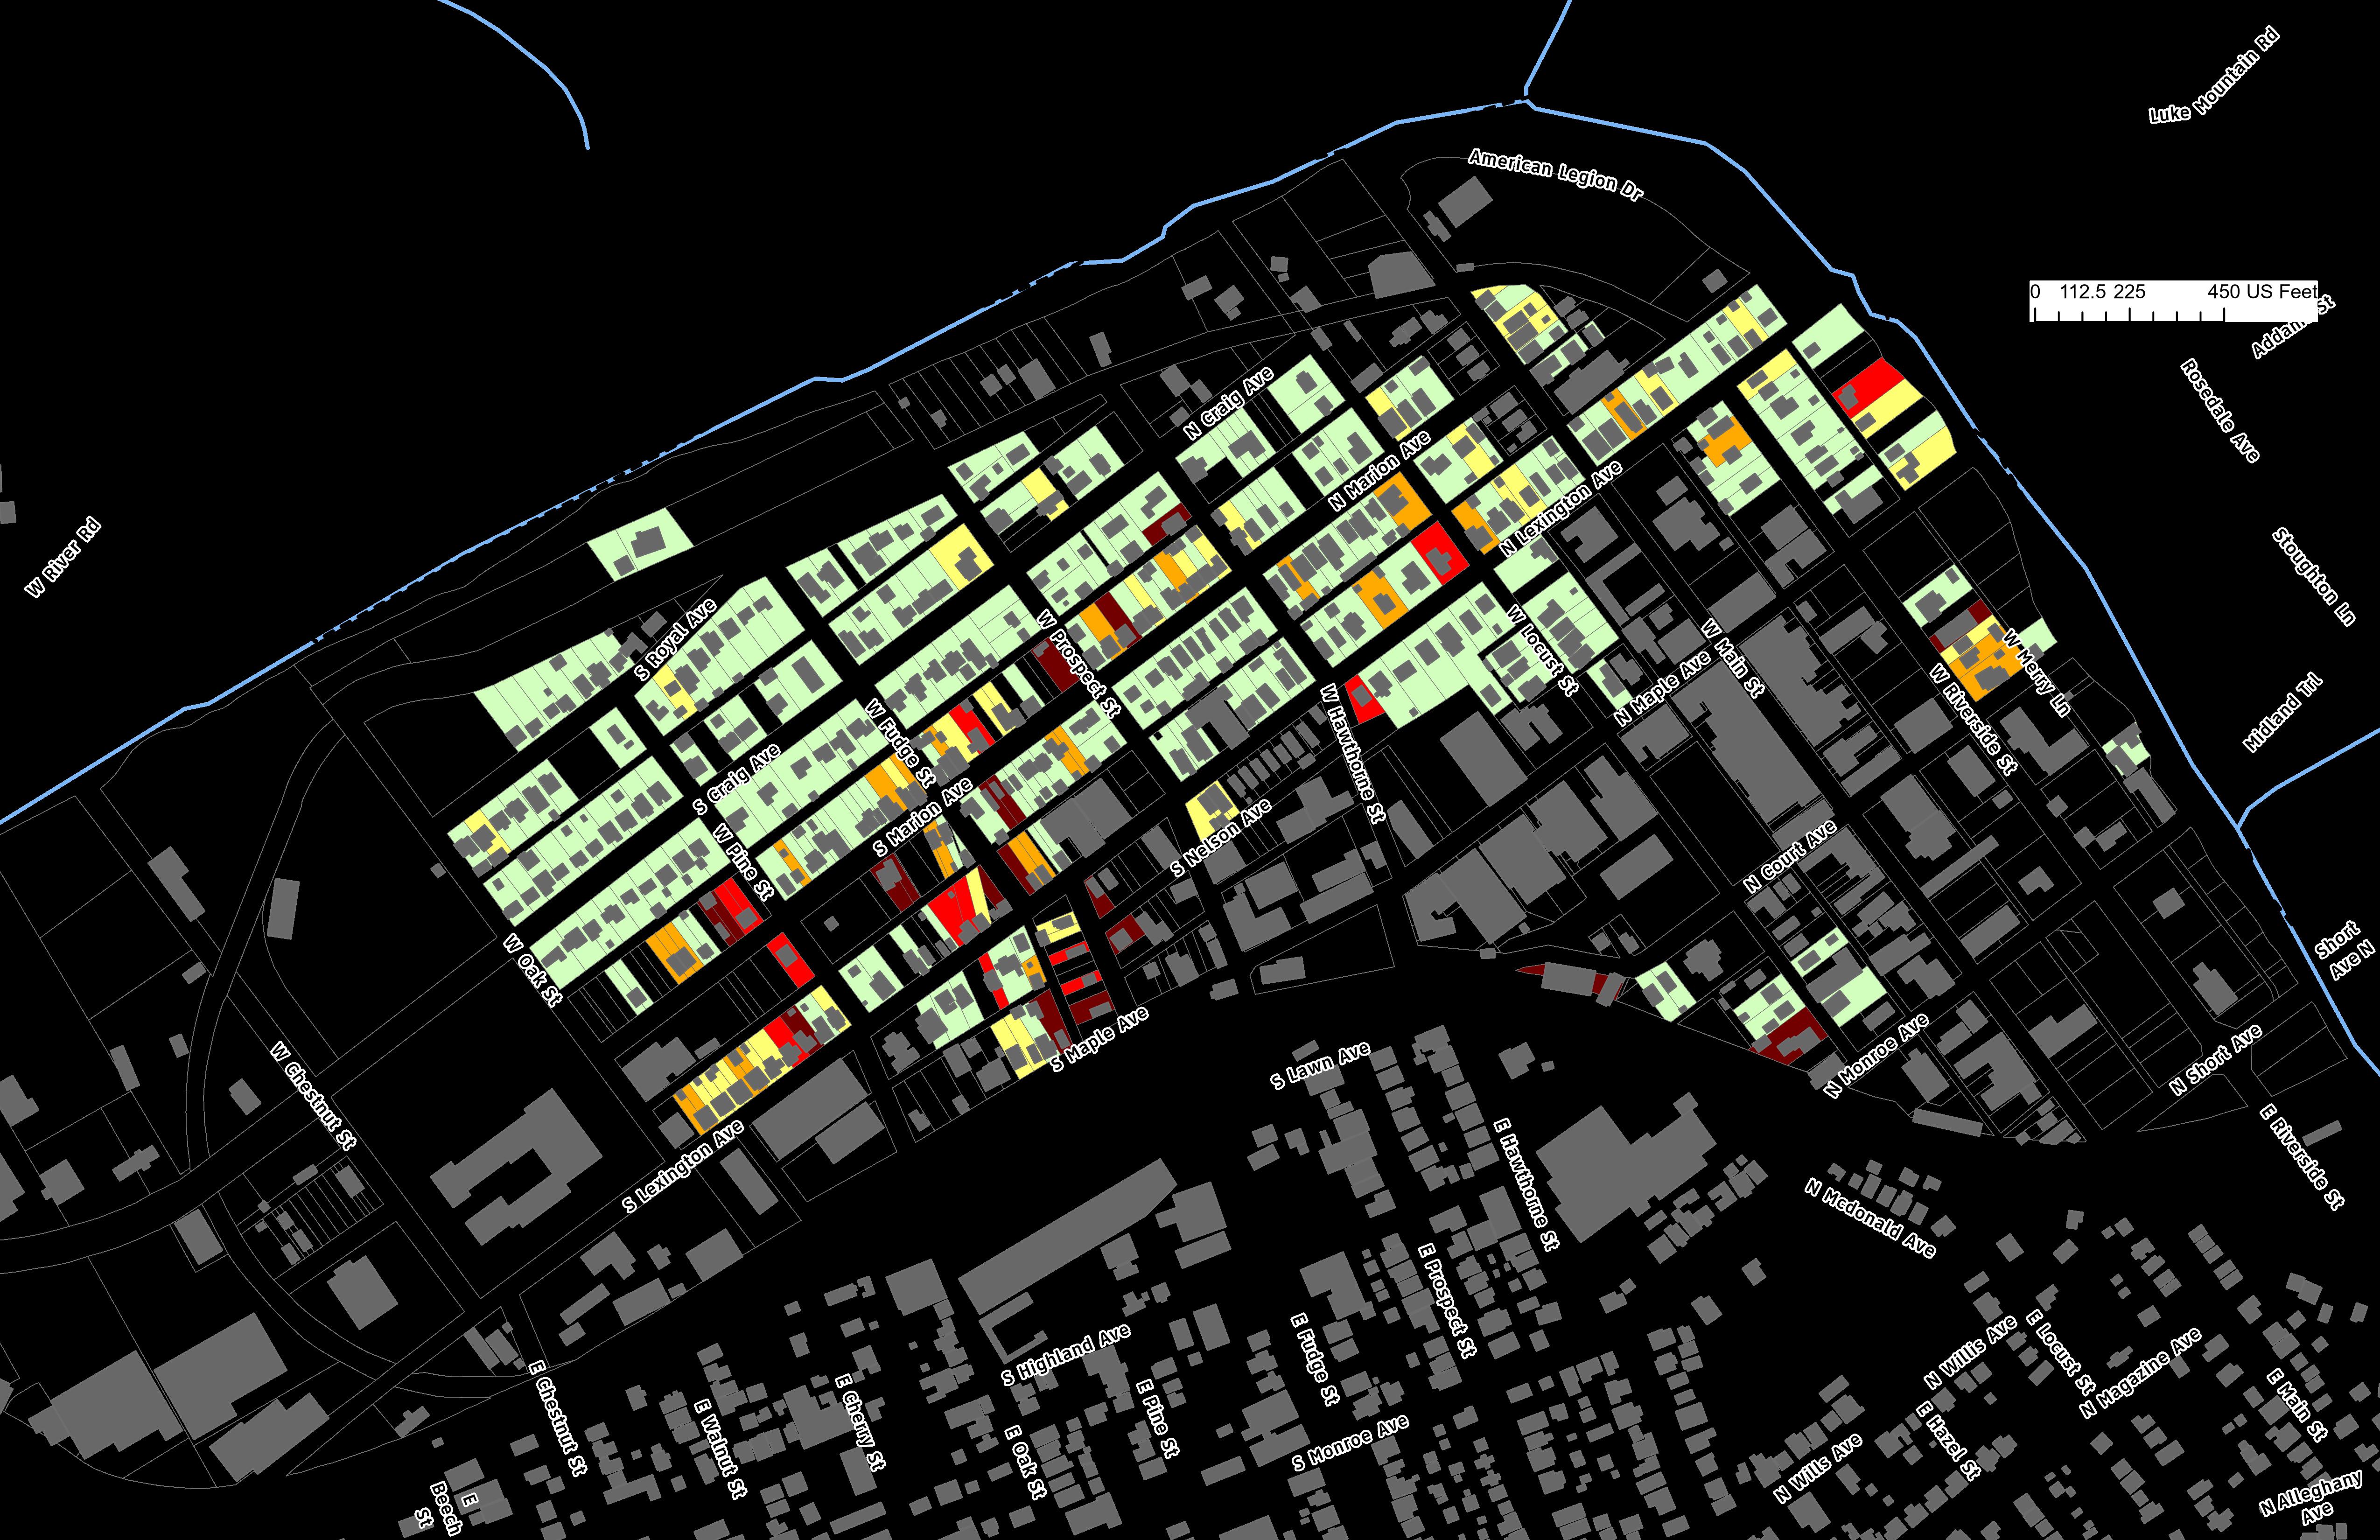
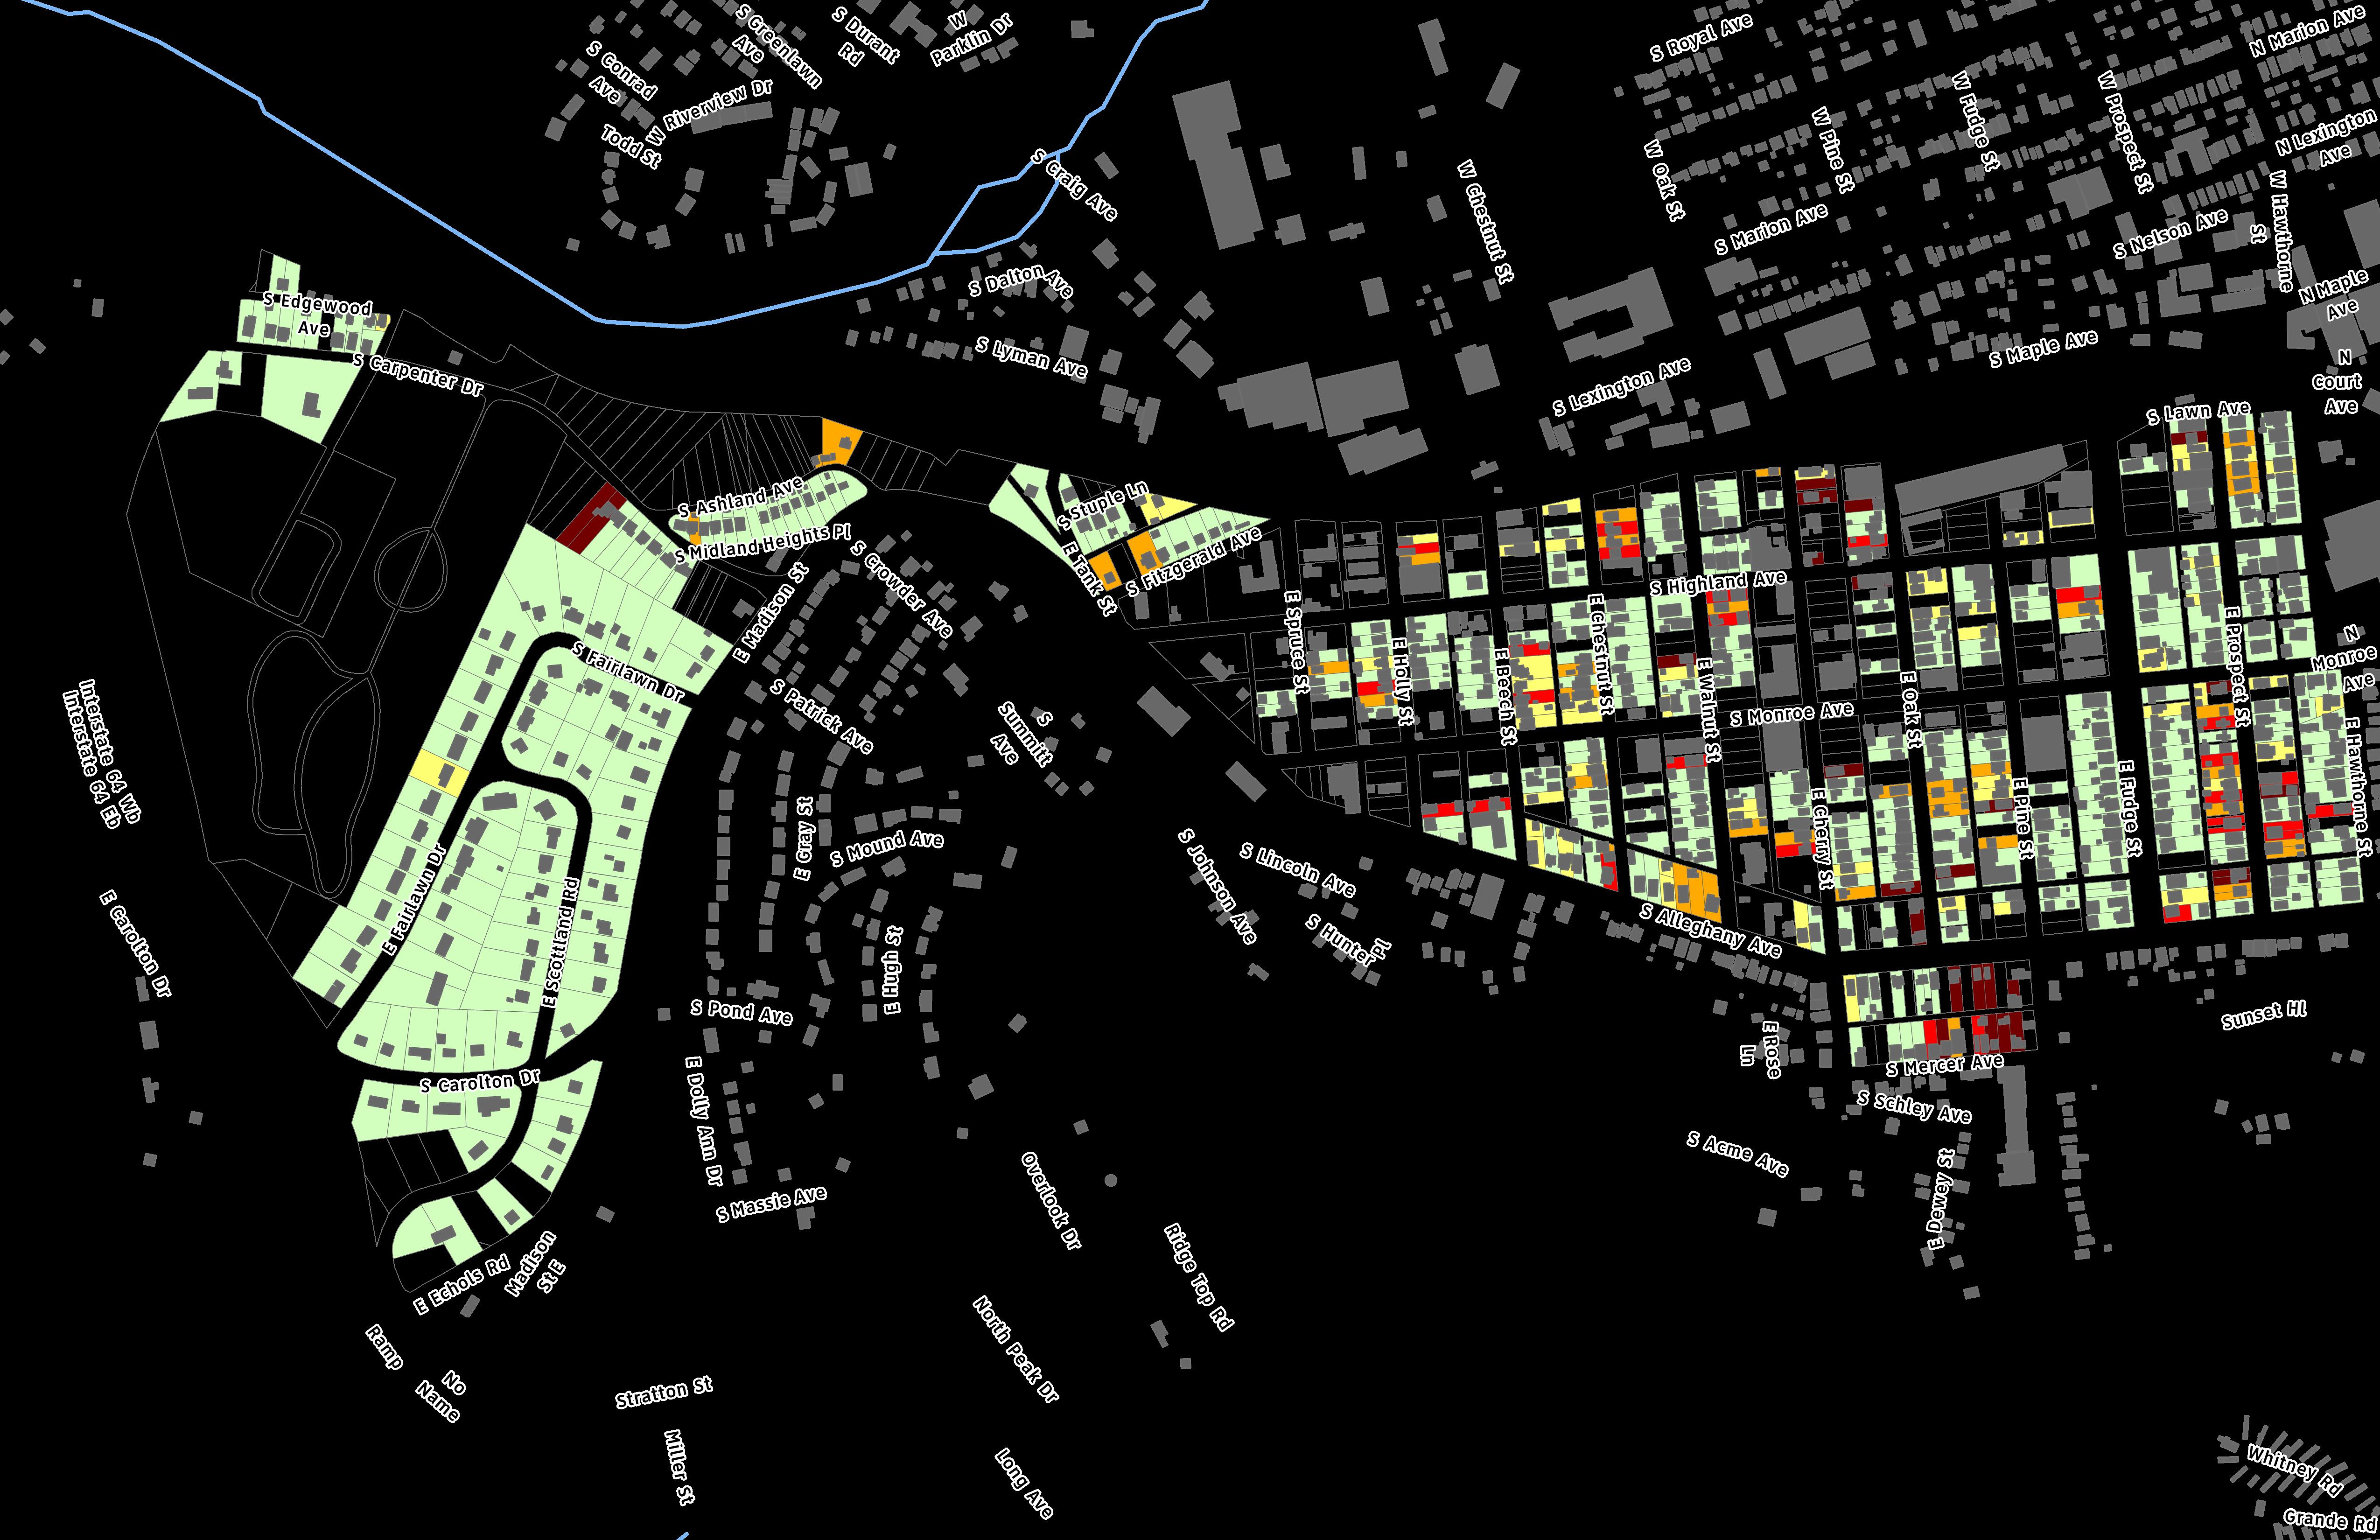
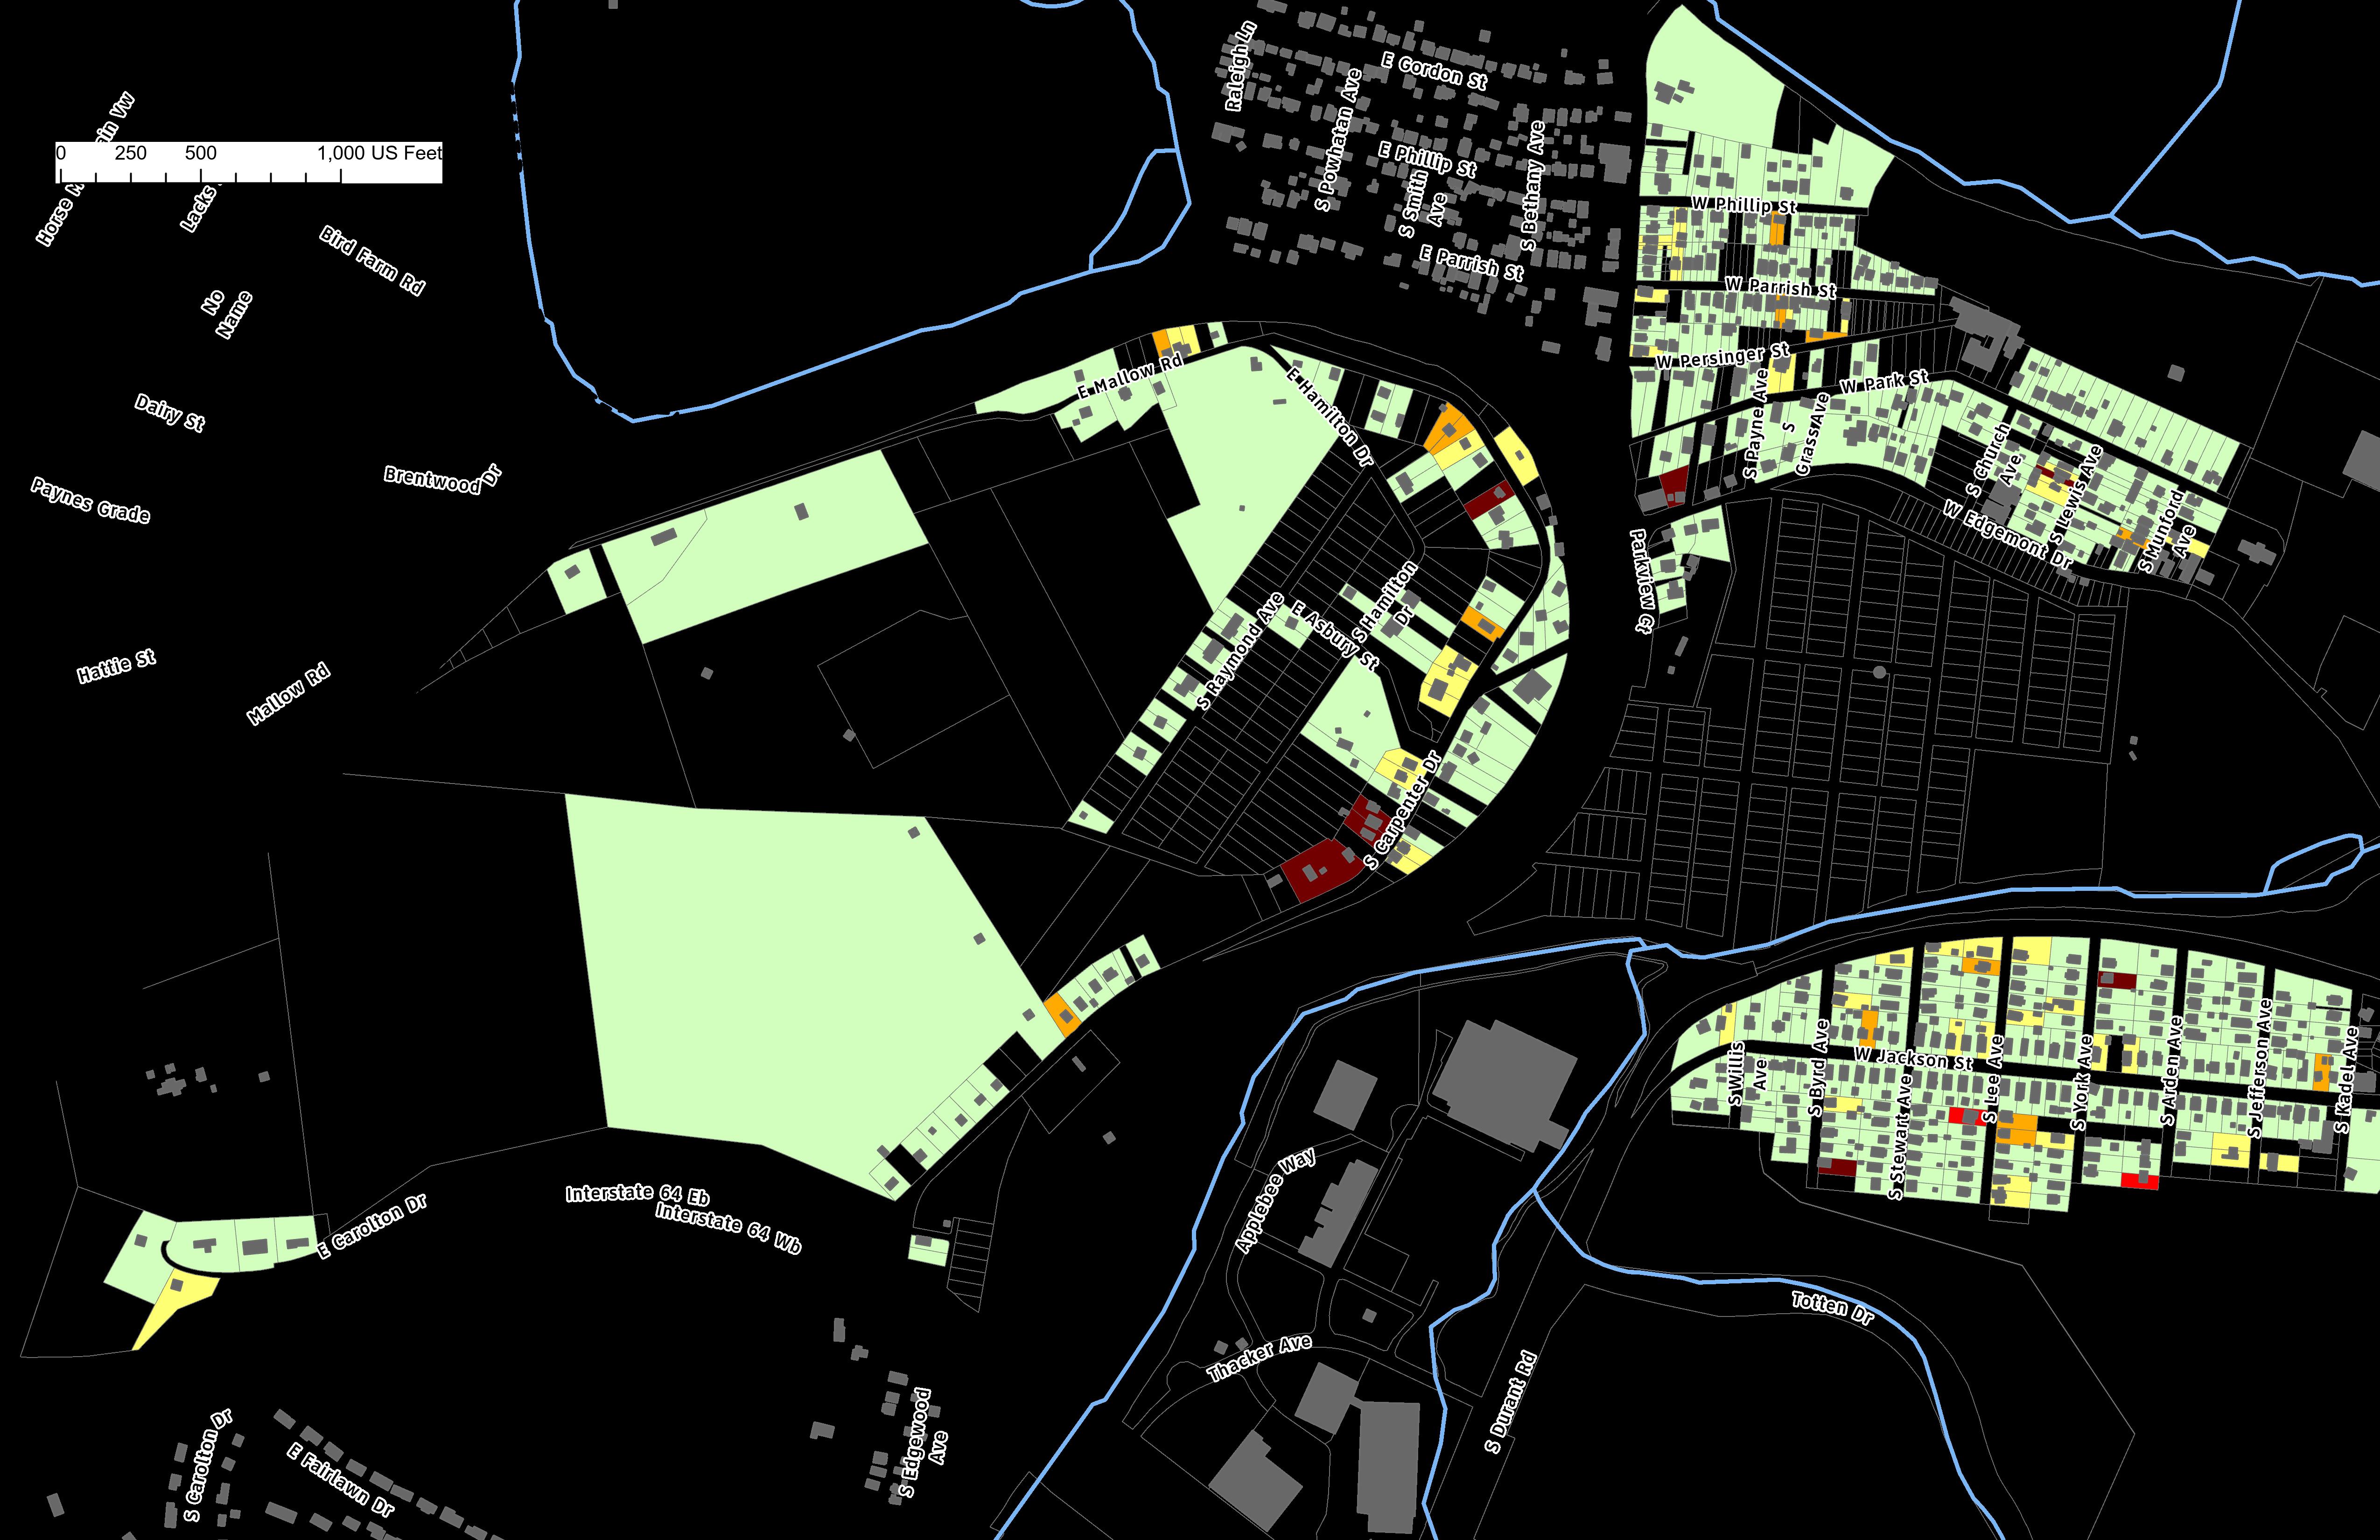
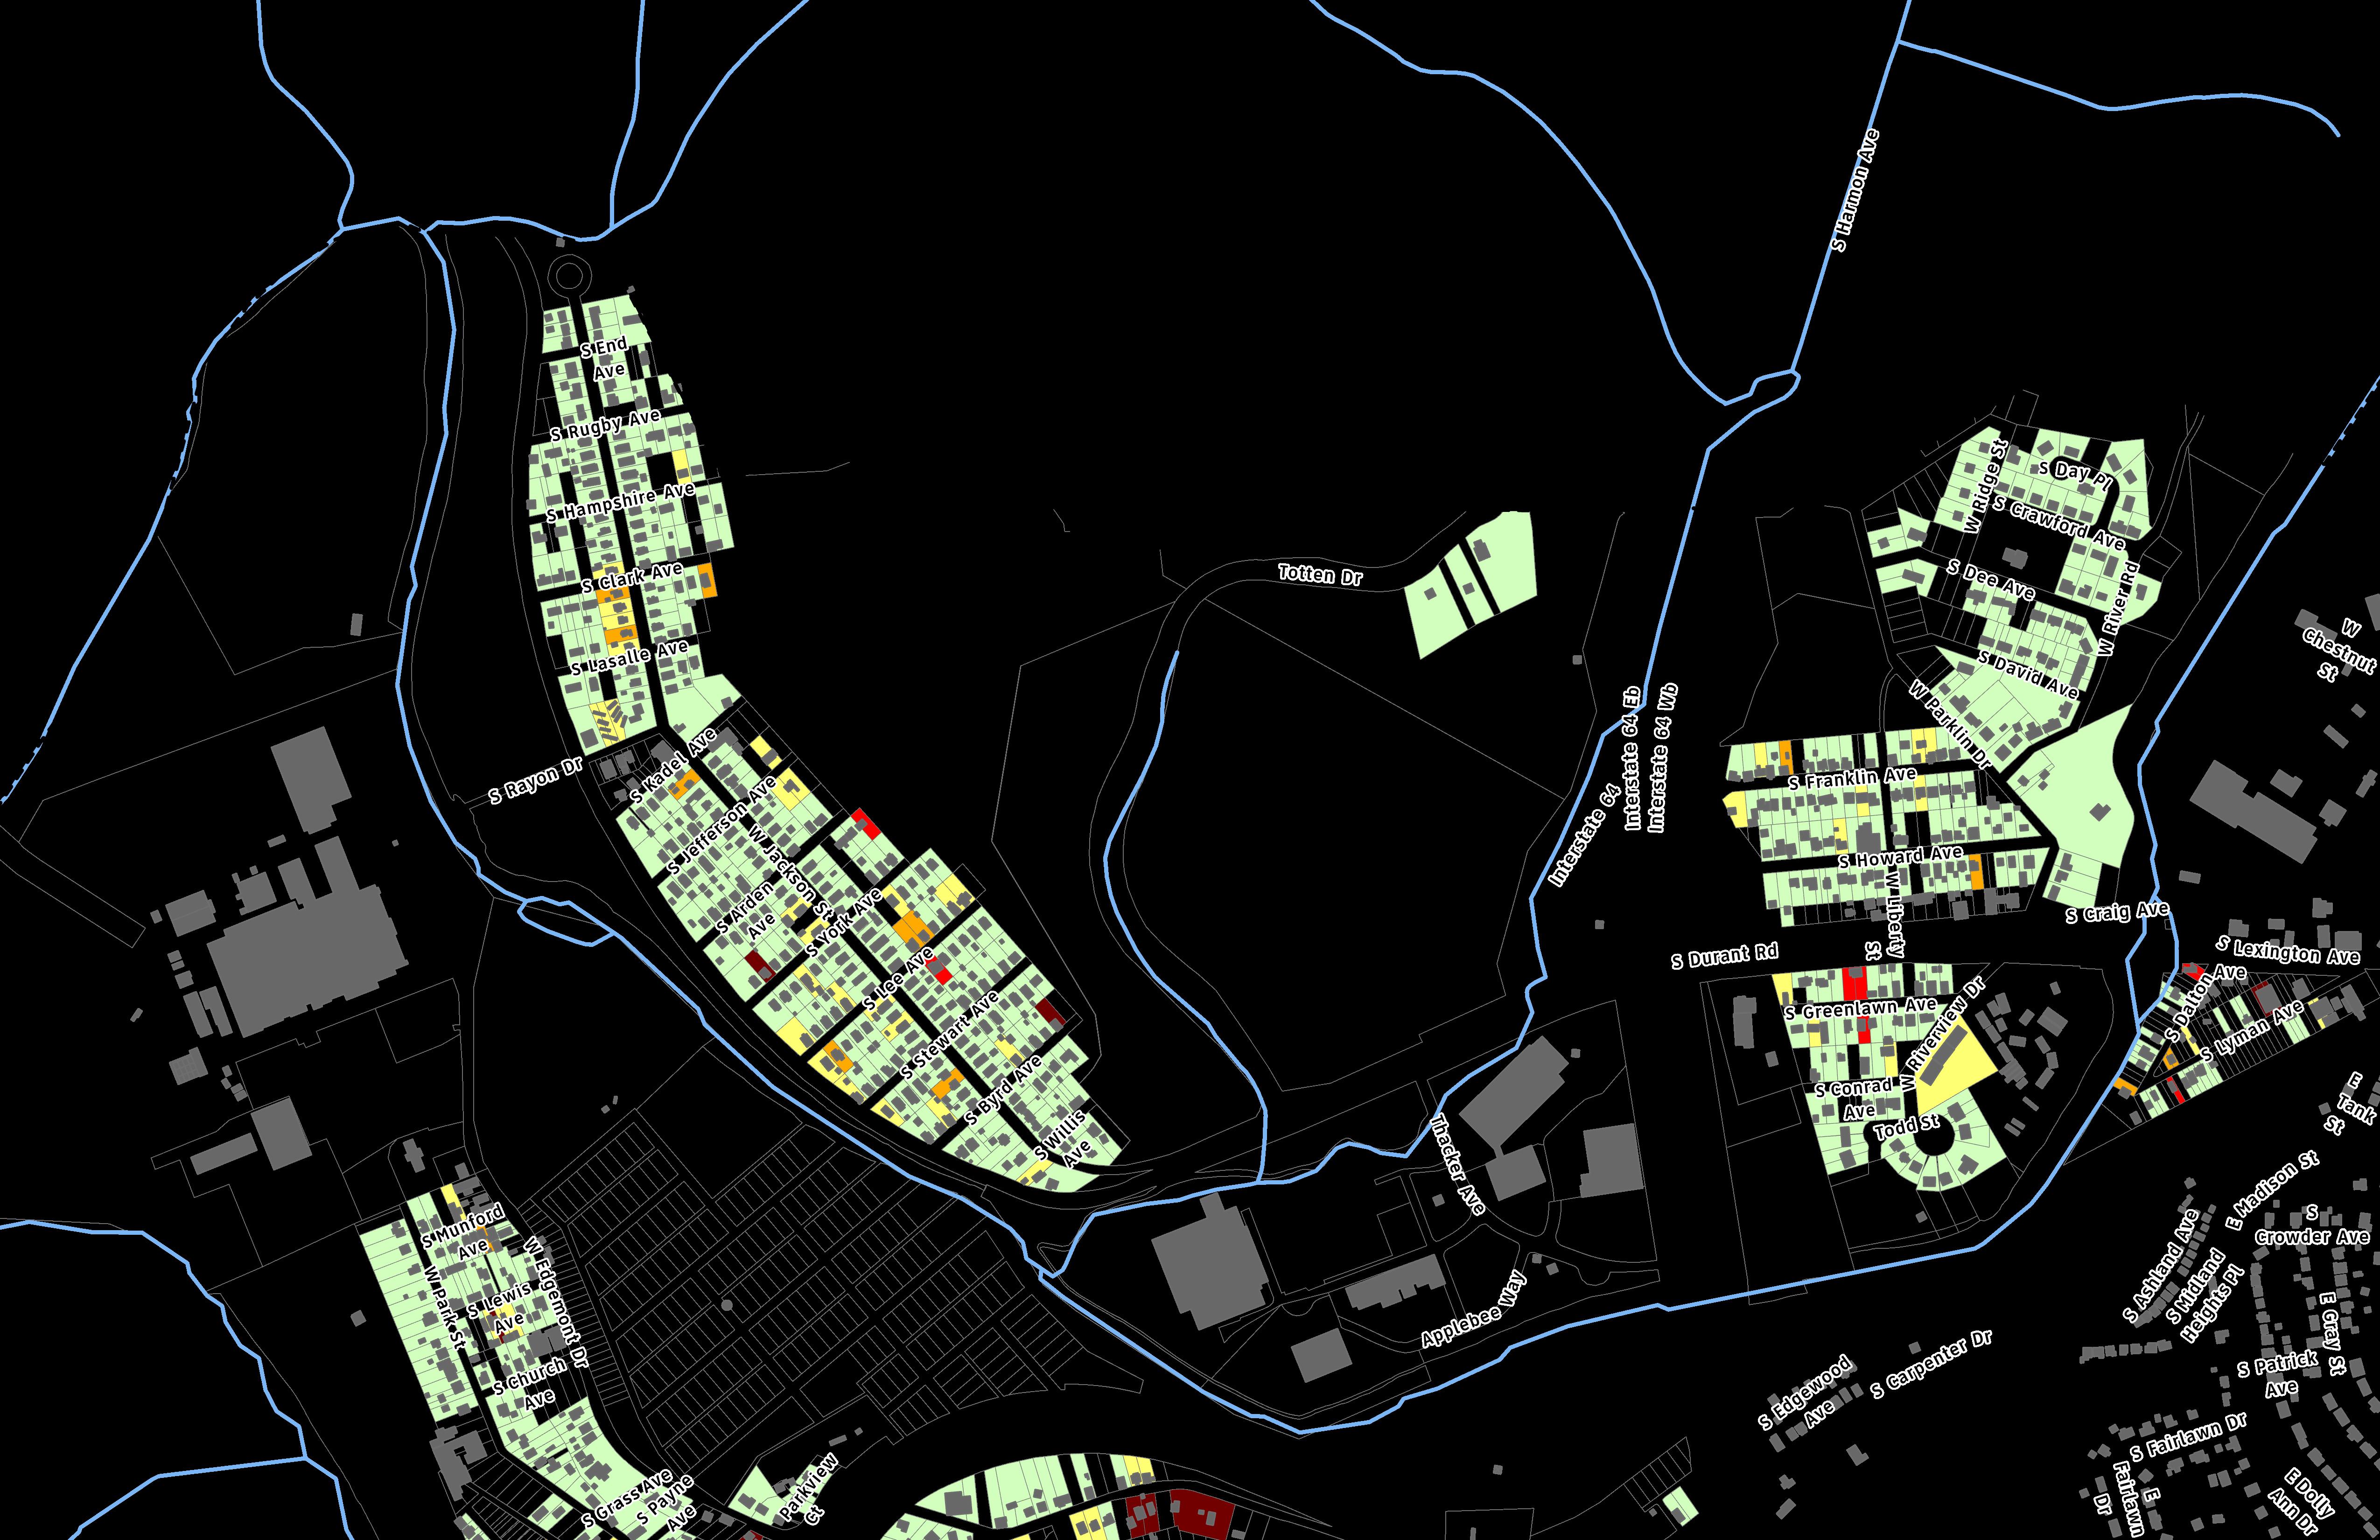
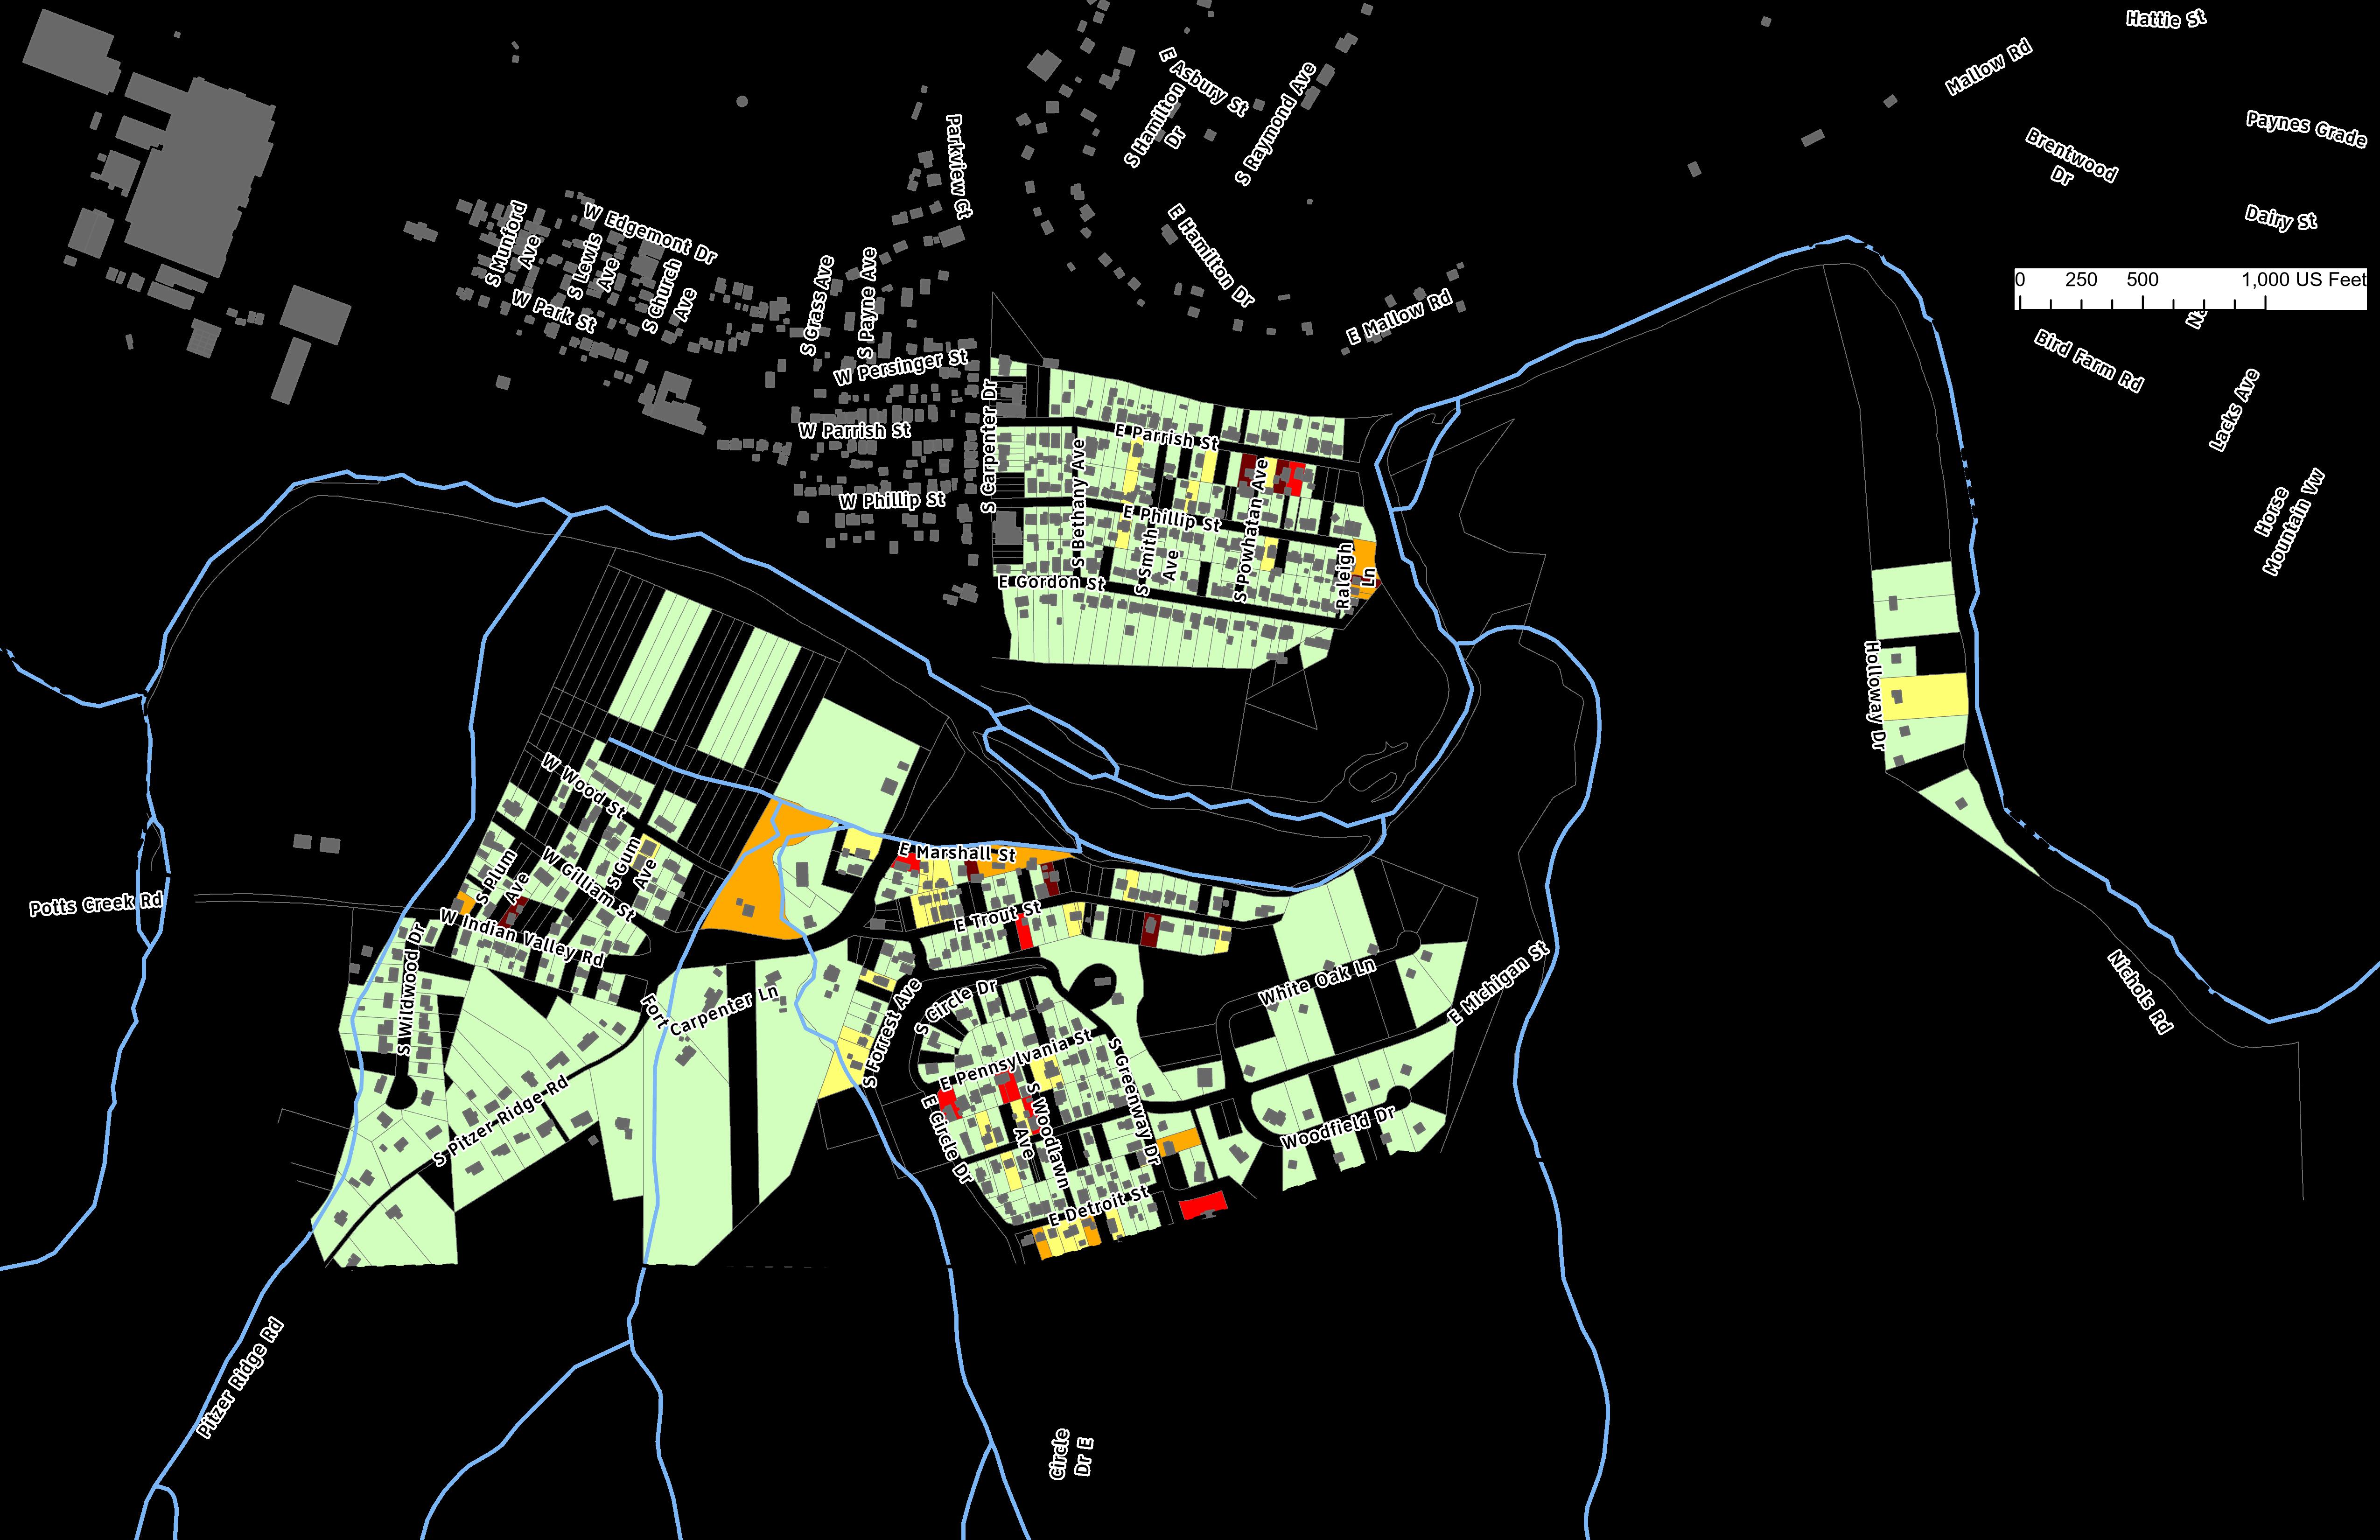
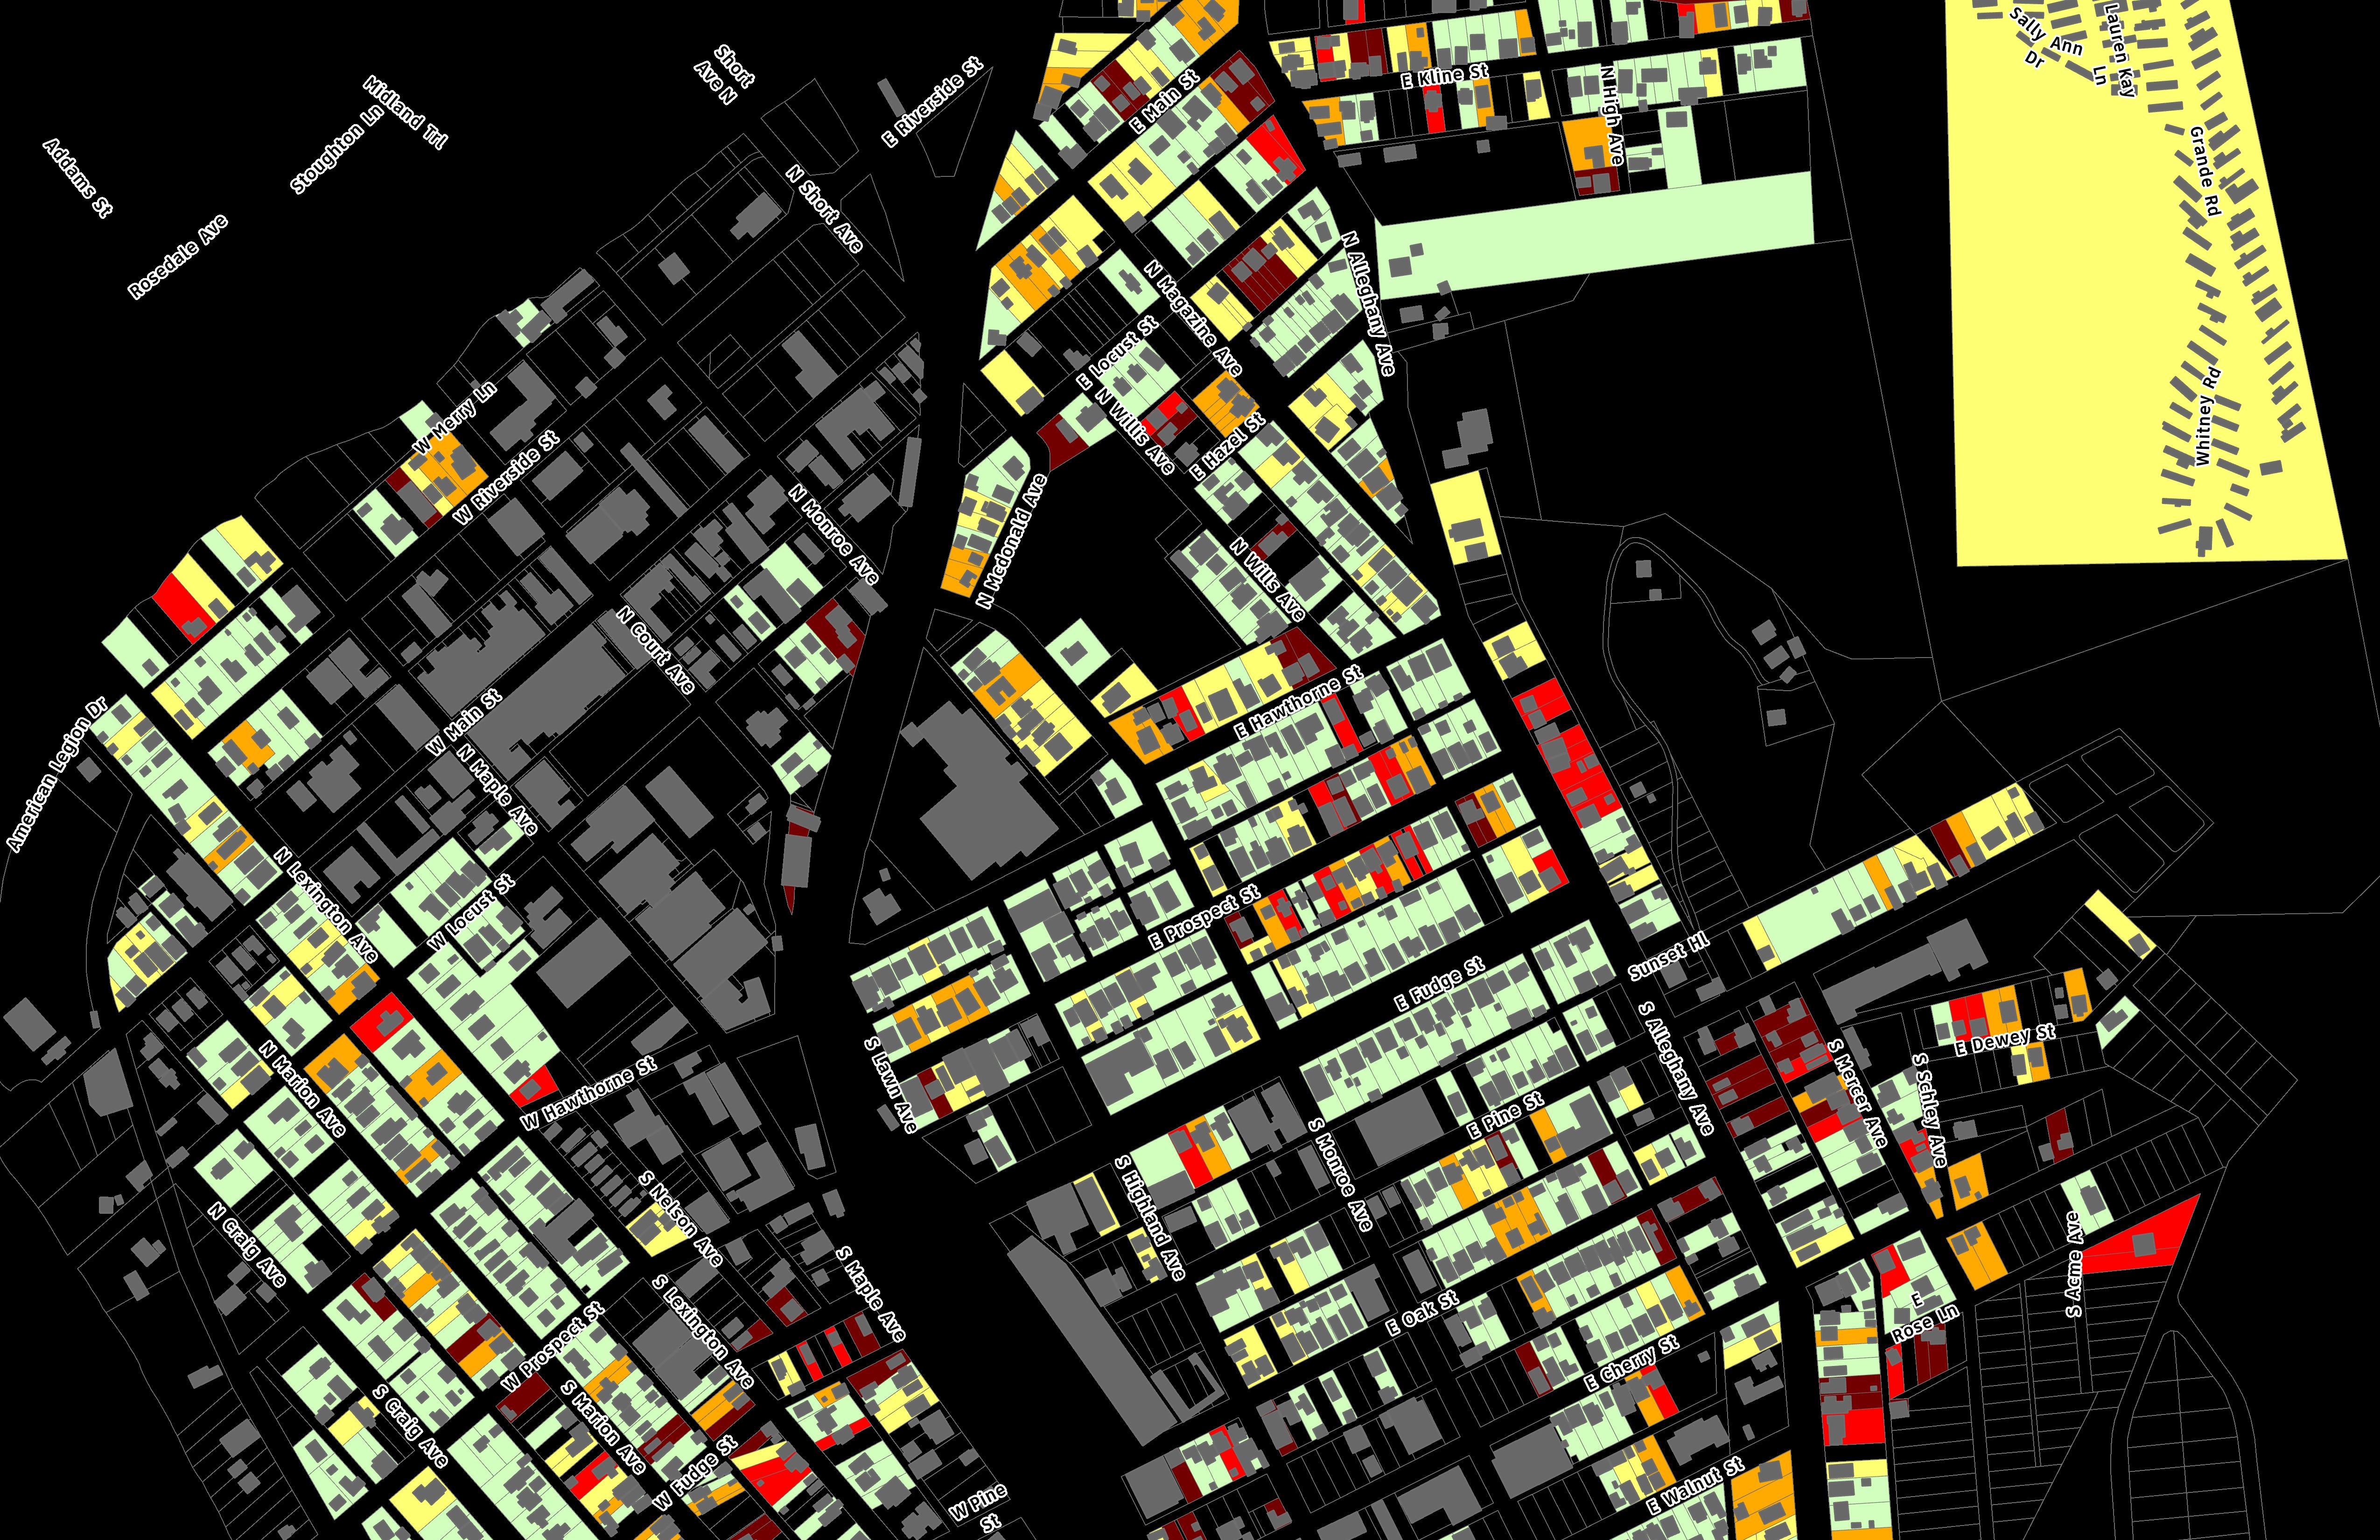
On March 4th, 2025, physical housing conditions across the City of Covington were assessed by Summit Design & Engineering staff, who performed a windshield survey of the entire city. The project team used data from the City’s Geographic Information Systems (GIS) to create maps with parcel lines, building footprints, and street labels in order to map the collected data. One team member drove and helped assess building condition, while the other assessed the condition and wrote down the scores on the map.
The rating system utilized assesses each housing unit based on three categories of the building’s overall condition: the foundation, roof, and exterior walls. Within these categories, there are three levels of structure condition rating given to them. Defining these categories starting at level one, referring to no cosmetic signs of damage, to level three, which refers to the highest amount of damage to any of the three main categories. In aggregate, this produces a final grade of all three categories on a one (1) to five (5) scale, with a score of (1) representing sound conditions and a score of five (5) representing dilapidated conditions. These score categories are visually explained to the right. For example, a building may appear to have a sound condition for its walls and foundation, but visible damage to the rooftop will make its score closer to a four (4) or five (5).
Commercial, institutional, or otherwise nonresidential or inaccessible structures were not assessed. These parcels have been left white on the maps. Limited “double-checking” of some properties that were located on hard to access side or internal streets was conducted utilizing Google Street View which has been updated as of December 2024.
Much of Covington’s neighborhoods were developed before automobile infrastructure required most of the right-of-way that allowed for other infrastructure improvements to be developed alongside wider streets. The City has many potential projects throughout the community that will require creativity and problem-solving to address.
Neighborhoods appear to enjoy equal access throughout the City to park facilities. There does not appear to be any neighborhood-level park facilities for homes east of the railyard to S. Alleghany Ave., a substantial portion of the City. However, many parks, particularly along the river offer a substantial amount of play and open space.
Sound/Standard, in good condition or in need of minor repairs.
Minor Deficiencies, minor defects beyond regular maintenance.
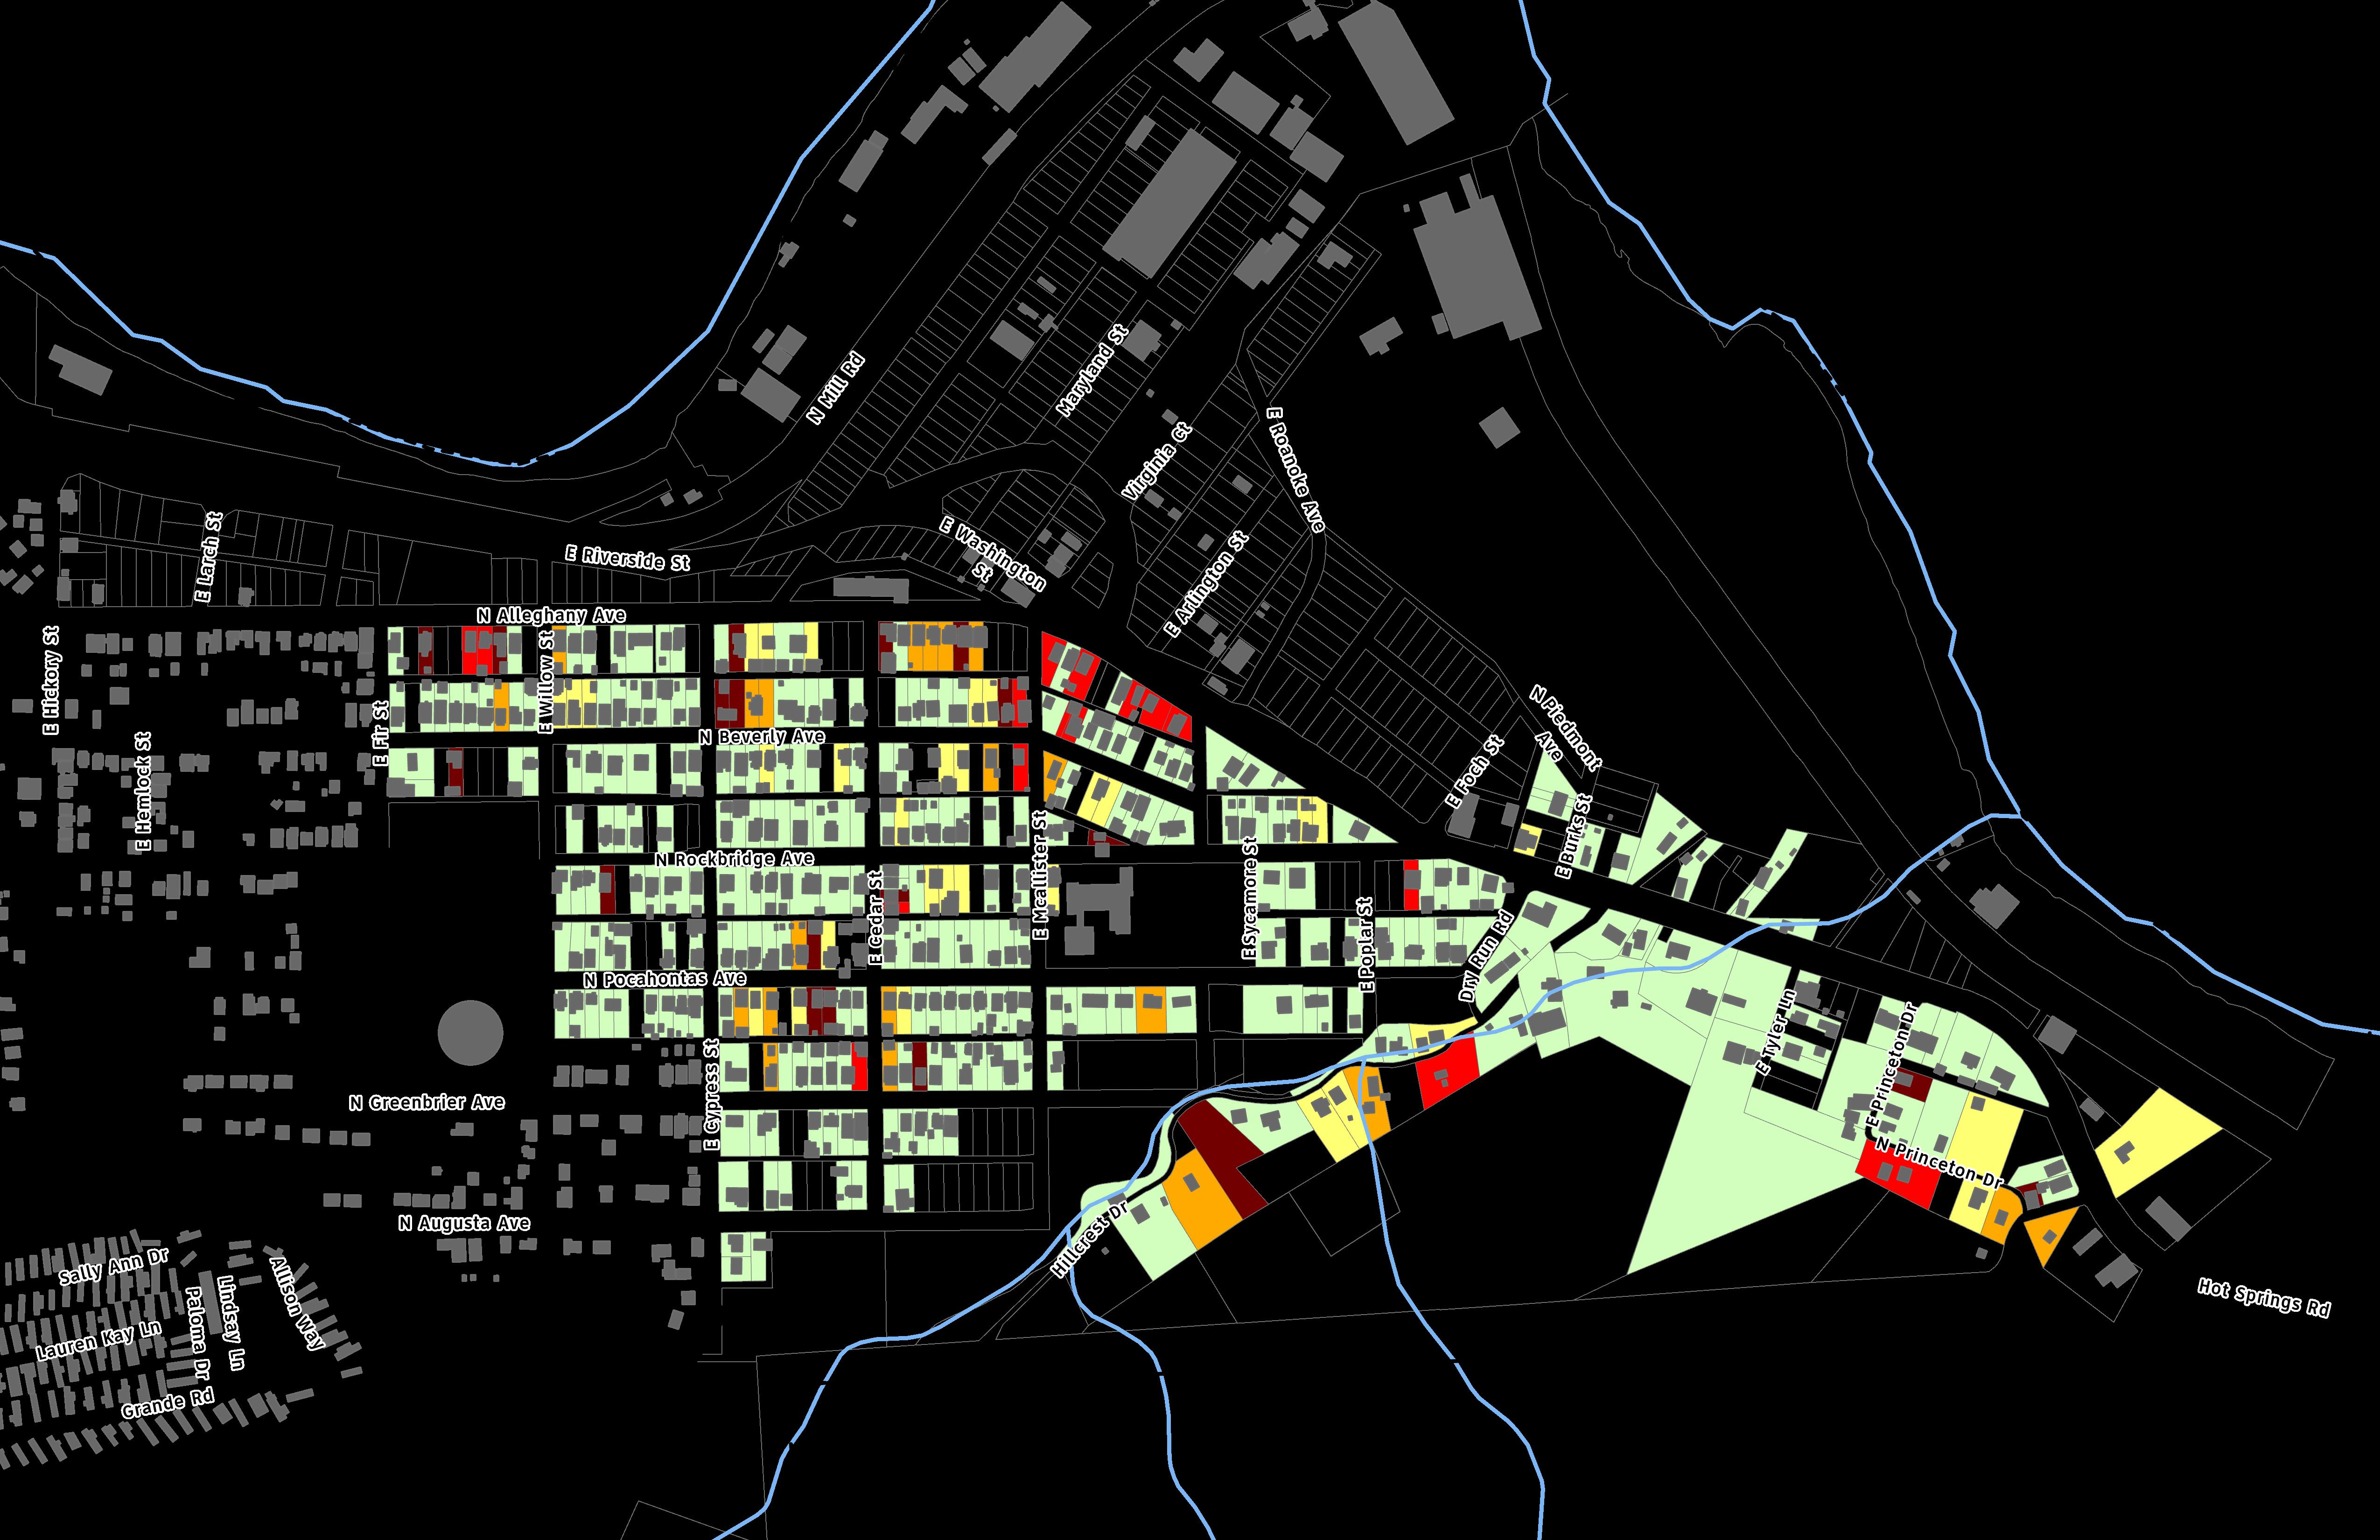
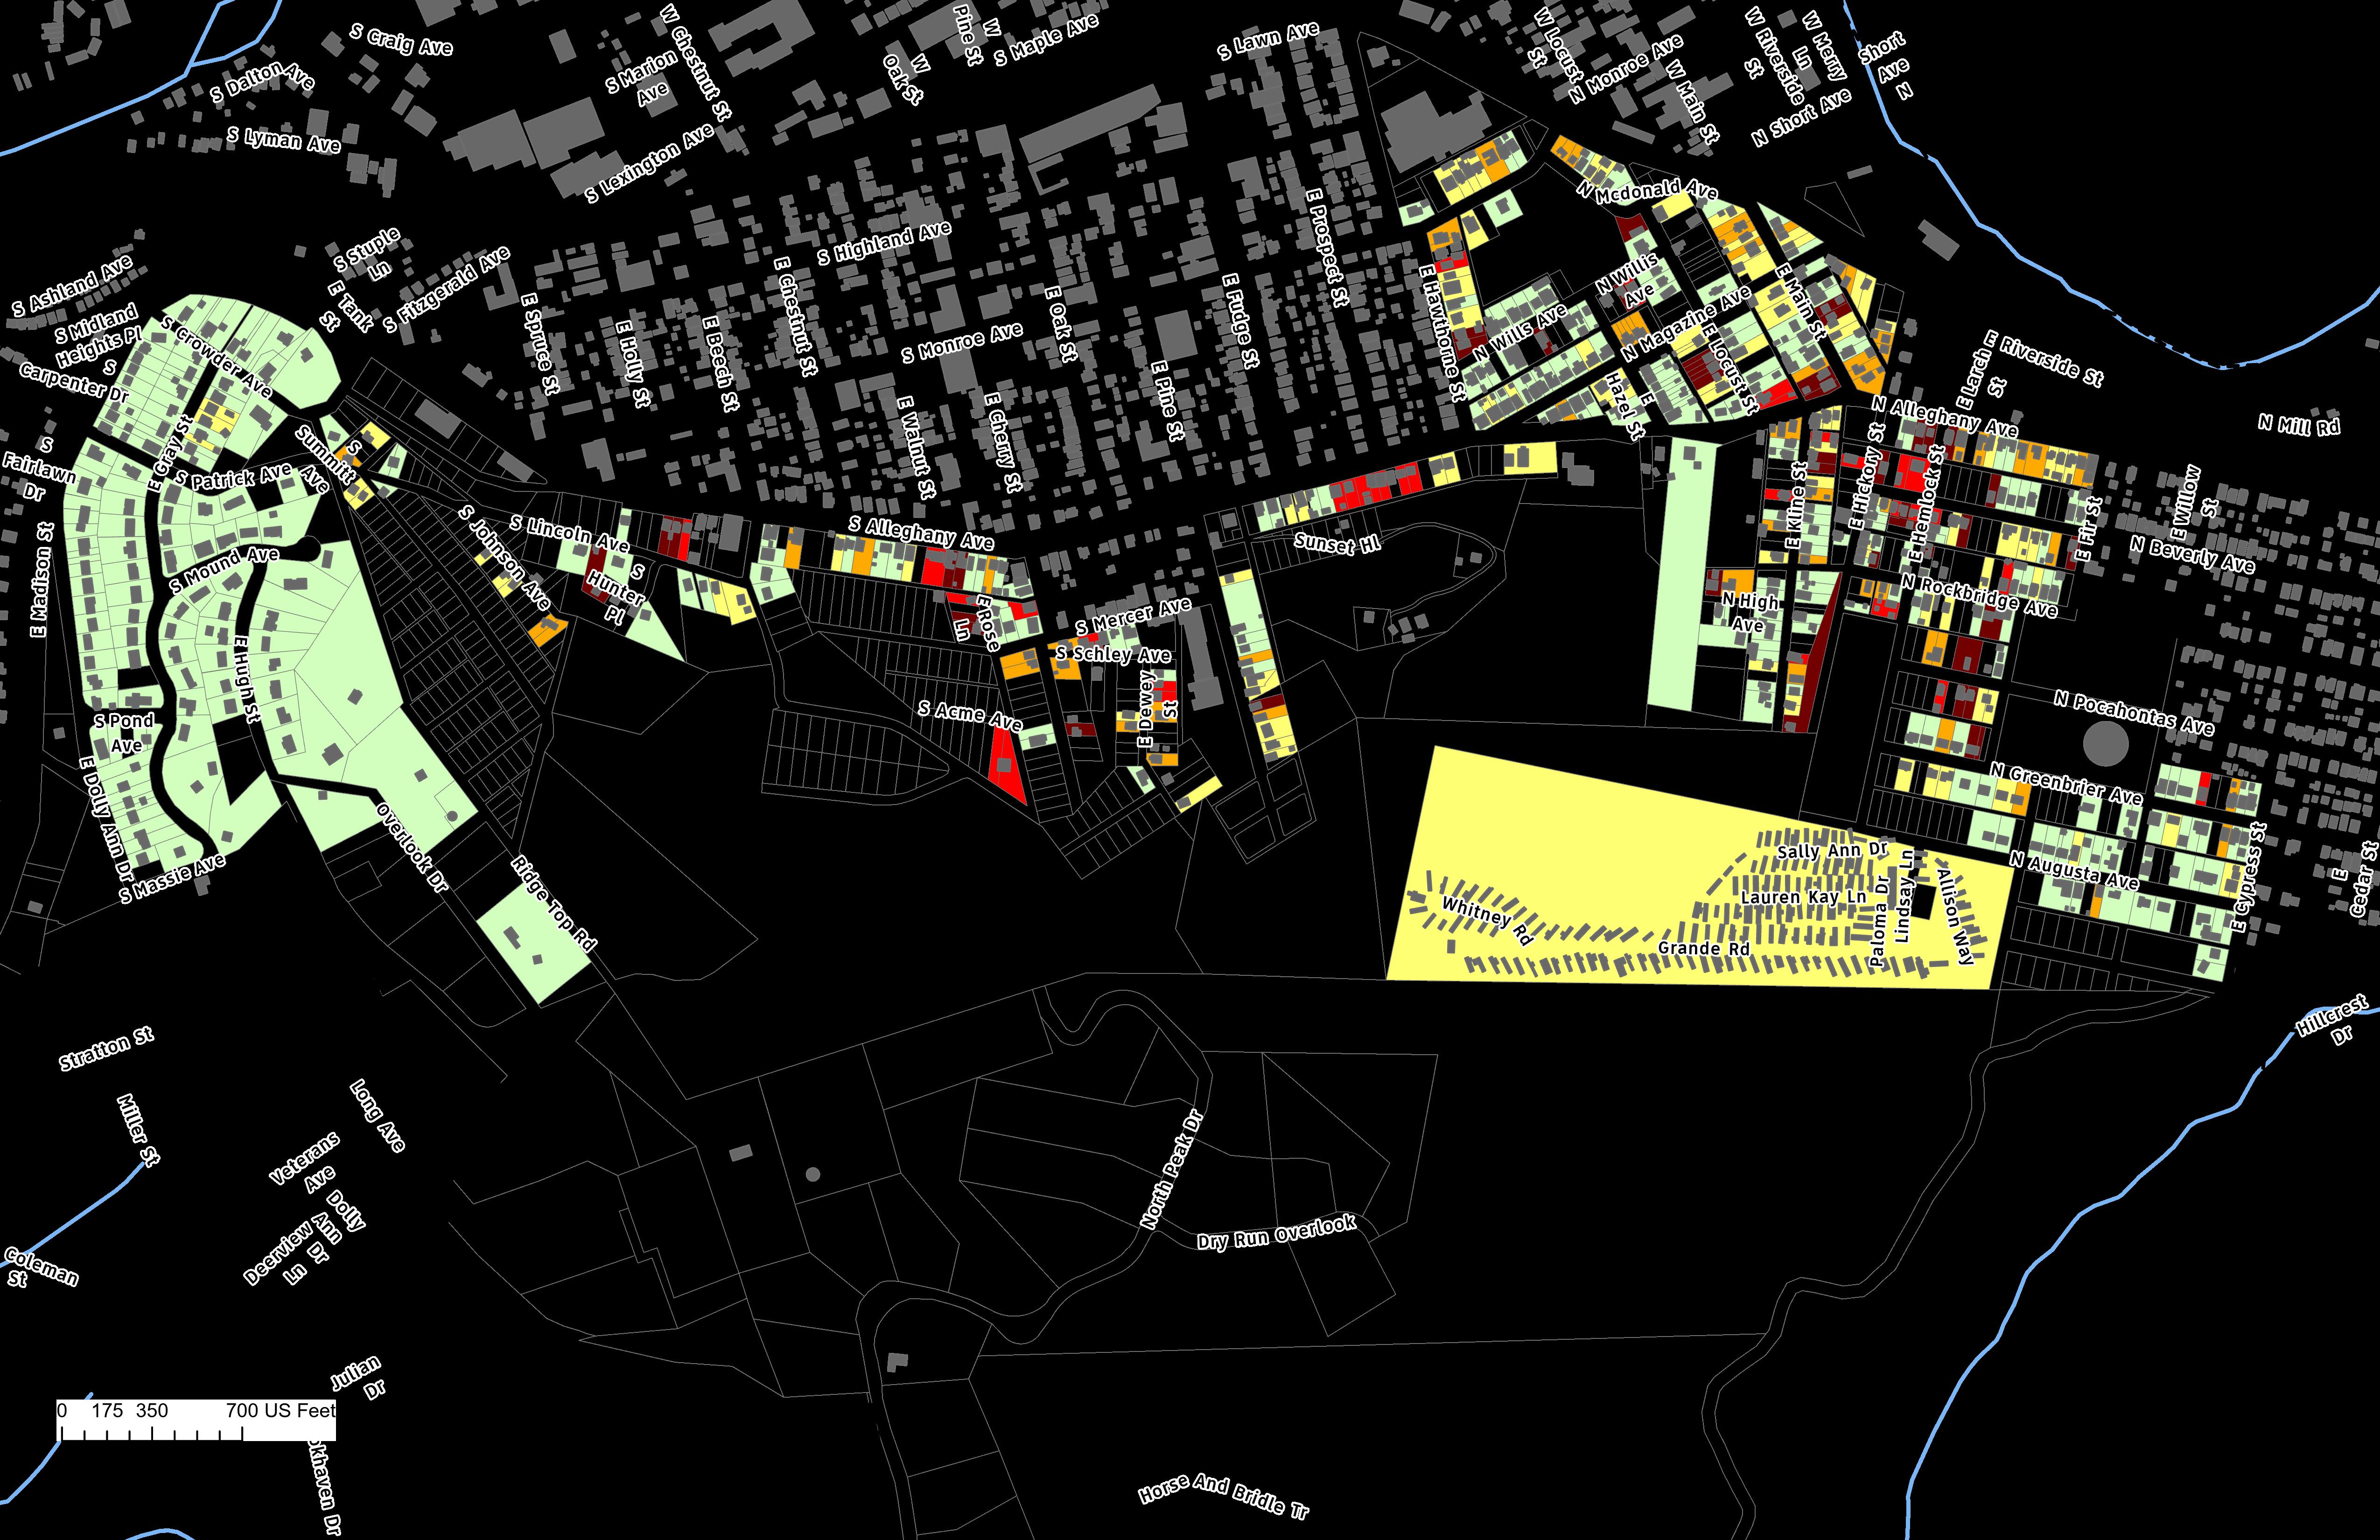
After the assessment was completed, the collected scores of housing conditions were mapped per each area of Covington alongside a brief description of notable features in that area. 1 2 3 4 5
Intermediate Deficiencies, significant defects requiring rehabilitation but do not require clearance.
Major Deficiencies, major defects requiring substantial reconstruction or clearance.
Dilapidated, structure has undergone severe damage or decay with defects requiring clearance.
Sidewalks
Covington’s neighborhoods appear to be fairly well-equipped with existing sidewalks that are connected to the overall network, with the exception of the furthest neighborhoods from downtown on the southern end. In older subdivisions, what were historically roads or sidewalks have been left to be reclaimed by grass and dirt cover. Sidewalks appear to change materials or end abruptly across some lots. Continued work on mapping the sidewalk network, documenting the quality of sidewalks, and implementing ADA-access, crosswalks, and wider sidewalks with generally consistent materials should be undertaken to support the quality of life and safety of Covington’s neighborhoods.
There are stormwater drainage facilities towards major roads and at the lower end of neighborhoods connecting to the City’s system, however, there appear to be somewhat inconsistent ditches and piping throughout subdivisions. With the challenging topography, problem areas may be forming that are difficult to observe outside of rain events. There were signs of severe erosion on some of the end streets on the north side of Rayon Terrace. As weather events intensify in the future, it will be important for cities to pursue a reduction of impervious surfaces, utilize additional plantings to trap and slow stormwater, and provide other facilities to mitigate the impacts from floodwater.
Although the speed limit is marked at 35 miles per hour along North and South Alleghany Avenue, and 25 miles per hour through Covington’s neighborhoods, speeding was consistently observed from vehicular and truck traffic. This is particularly dangerous where older neighborhoods meet major roads, such as S. Alleghany Avenue, and the topography creates many blind spots and awkward turning radii. Rounded back corners and “slip lanes,” such as at N. Magazine Avenue and N. Alleghany Avenue create the conditions for drivers to turn more smoothly and at a higher speed, however, this is more unsafe for pedestrians and bicyclists.
With almost all of Covington being able to be reached through walking and bicycling, particularly with the growth of electronically assisted bicycles (e-bikes), there are many new opportunities for Covington to reduce its local car traffic, speeding, and improve safety and public health through providing for a multi-modal network of bicycle and pedestrian pathways across the community. These can also help support neighborhoods by making them more desirable places to live.
Abandoned road right of way throughout Covington’s neighborhoods could be reconnected to help bring some lots out of isolation and passively encourages more connection with the community and improve ease of code enforcement.


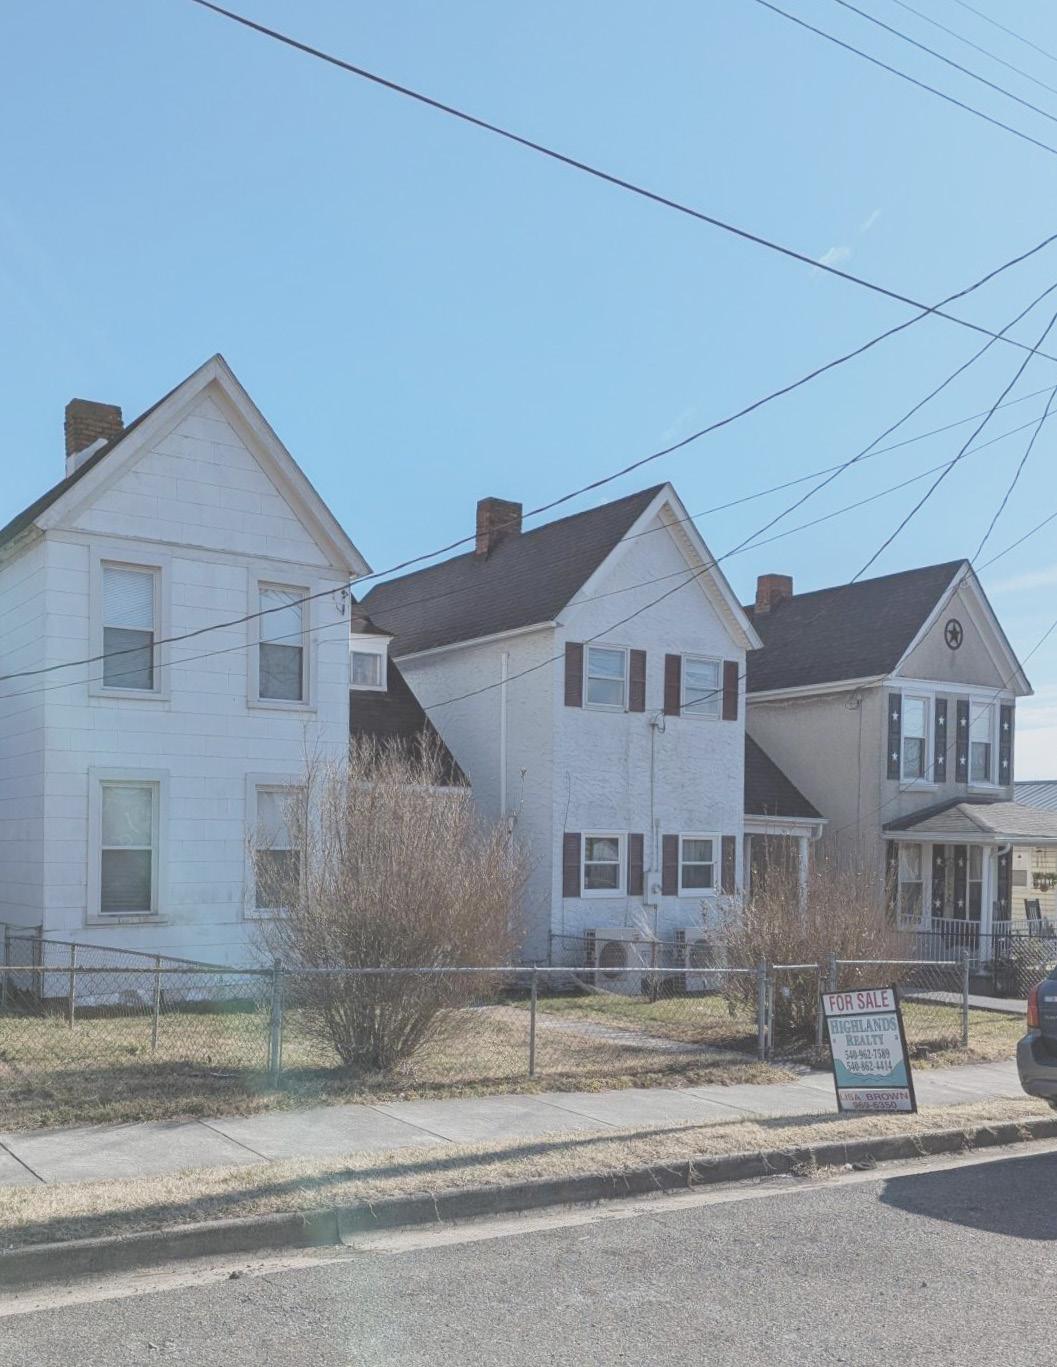
There are many homes in poor condition across Covington. Many units, particularly older and more isolated units in the steep topography, exhibited signs of continued deterioration or abandonment. However, there was also visible rehabilitation occurring in the City. New construction and renovation could be observed, and many homes featured new roofs. There is a sort of “split problem” in Covington, where homes are generally affordable due to their age, condition, and supply, however, local households are overwhelmingly cost-burdened due to housing costs (75% of the community).
Maintenance of an individual detached single family home, which is the predominant unit type in Covington, can be difficult if the household and yard is “more house” than a household needs or wants. These types of houses are also more exposed to the elements, which raises maintenance costs. With a declining population, the situation can expand with more households in a precarious situation and less contractors, supply stores, and other necessary parts of maintaining a housing unit available over time.
Despite this trend, Covington is following its Comprehensive Plan and working collaboratively with Alleghany County to build on its existing “good bones.” Streetscape improvements have been implemented along Maple Avenue, in the downtown, and work continues with Olde Town Covington in revitalizing the area to improve commercial and residential opportunities. Homes near the downtown also showed recent renovations or ongoing maintenance allowing for the unit to remain high quality. Capitalizing on trends of walkability and reutilizing historic properties in the beautiful landscape is an important part of success for Covington’s strategizing for the future. These recommendations build on the City’s Comprehensive Plan and will attempt to more closely describe their relationship with housing.
Diversify the housing stock and reform zoning ordinance.
Reviewing local housing data revealed that Covington’s homes are predominantly single family detached units. As Covington revitalizes its downtown and neighborhoods, it is important to also review the local zoning ordinance and see how it may impact the ability to produce diverse types of housing. Cursory review of the City’s Zoning Map appears to show high density zoning (R-4) that allows many different types of units to be mainly located in areas of intense topography, while areas in the downtown area are zoned at a lower density of R-2. When this restriction on unit type is combined with setbacks and lot size areas, the actual buildable space for creating new, diverse housing types at varying sizes and price points becomes difficult. Density near downtown supports the market potential for new businesses and helps them hire people locally. Covington should seek ways to further diversify its unit types and reform land use restrictions.
Improve safe infrastructure for walking and bicycling.
Almost all of Covington is within walking and bicycling distance. While the windshield survey was being conducted, many members of the community could be observed walking to their destinations. High quality sidewalks, ADA-access ramps, and bicycle infrastructure are important for promoting safety, public health, and livability in neighborhoods. Through Virginia’s Department of Housing and Community Development (DHCD), Community Development Block Grant (CDBG) funding for community improvement projects can be applied for by the City. While supporting housing rehabilitation or targeted neighborhood improvement, streetscape improvements and public infrastructure can also be funded to uplift an area. This public
investment in the area can also make the area more attractive to private investment, allowing new homes to be built on infill lots or previously damaged homes to be renovated.
Re-establish connections in older neighborhoods.
Throughout Covington’s older subdivisions, there are many spots where a road may have been planned, but not constructed due to the slope, or a road existed and has been reclaimed due to maintenance being unfeasible at the time. Even as a sidewalk or trail connection, allowing more movement through these neighborhoods can help bring some properties out of isolation. Many properties that were in poor condition appeared to be hidden away and abandoned, making them less desirable for future purchase and renovation.
Utilize Covington’s Housing Authority and create a spot blight abatement program.
Housing Authorities are granted numerous powers under the Code of Virginia including planning for redevelopment and conservation areas, acquiring property, constructing, rehabilitating, and operating residential housing (Title 36. Housing, Chapter 1. Housing Authorities Law). There is not much information available on the City’s website about the local Housing Authority. Other localities have created housing “resource hubs” on their website, in collaboration with local non-profits, to help guide community members to the best resource to suit their needs. By utilizing the full spectrum of the Housing Authority’s powers, the City could more flexibly and proactively take a role in the provision of housing to address local needs. §36-49.1:1 allows for localities to create a “Spot Blight abatement” program through their housing authority. Throughout Covington, there appeared to be certain properties that had fallen into disrepair or abandonment with no apparent
plans to restore the property to safe conditions. With a spot blight abatement program, the City can proactively address these properties and work to get them ready for rehabilitation or construction, bringing new units to market.
Support the creation of a Community Land Trust.
Community Land Trusts are entities with varying organizational structures, funding sources, and typical projects that are initiated. The core of their concept is to develop and retain affordable units for the community in perpetuity. As a non-profit or quasi-governmental entity, the Community Land Trust can acquire, maintain, or develop new units. Typical arrangements involve a homebuyer purchasing a house on a property that remains owned by the Community Land Trust, as the value increases, the homeowner can benefit from the increased equity value in selling the house while the land beneath the home is perpetually owned by the trust. Different types of housing, including apartment buildings, can assist the City in diversifying the stock.
There are many state and federal funding resources that can improve housing conditions in the City of Covington. Funding should be applied to the improvement of existing houses, as well as the construction of new housing. All potential grant funding and incentives require an affordability component for either all of the units improved or developed or a substantial portions of the units. The U.S. Department of Housing and Development (HUD), typically defines affordability as housing units occupied by or available to households with low-tomoderate income levels (LMI), which is defined as 80% of the Area Median Income (AMI). Affordability is further defined by household size, a threshold that applies to programs such as the Community Development Block Grant Program. Other funding, such as HUD’s HOME Investment Partnership Program, not only require that the program meet the 80% threshold, but also require that a portion of the units be made available to households making 60%, 50%, and 30% of AMI, in addition to the 80% threshold.
However, nothing precludes a locality in Virginia from subsidizing or incentivizing the improvement of existing housing or the development of new housing through its own resources. Many small and medium sized localities within Virginia may struggle to obtain (or maintain) the liquid assets required to fund such projects without government assistance. However, an asset that small and medium sized localities can utilize to develop affordable and market-rate housing is the surplus land they have in their inventory. Such land, acquired by various means including tax sales, can be sold at a discount or transferred for $1 in order to incentivize housing development. Typically, such land transactions take place through a locality’s redevelopment and housing authority or economic development authority, so as to
avoid extra steps it takes for a locality to sell surplus land. To ensure that the development occurs as intended, the deed of transfer or similar legally binding document, is used to put in place performance standards and “clawback” provisions to regain control of the property if performance becomes an issue.
The following subsections delineate the state and federal funding resources that may be applied to improving or developing new housing. They also define the City’s role in tapping into the funding and overseeing their expenditure. For some funding, the City is the sole entity applying for and responsible for the funding, although the administration of the funding/program can be subcontracted. For other funding, a nonprofit or private developer is required to be the lead entity, a requirement particularly relevant to the development or redevelopment of multifamily housing. Finally, for funding provided directly to households, such as first time home-buyer assistance, the City mainly functions in a communicative and educational capacity, informing eligible households of the funding assistance available to them and coordinating efforts to distribute benefits.
As part of the Small Cities CDBG Program, funds are administered by the Virginia Department of Housing and Community Development (VDHCD) and are available to communities that do not receive a direct allocation of funding from HUD (referred to as Non-Entitlement communities). Applications for funding can be submitted one or two times per year. With every Small City in Virginia eligible to apply for funding, the process is very competitive. Communities that are successful in obtaining VCDBG grants are able to
fully explain the housing needs in the community, the number of LMI households, and the level of economic stress in the area, which form the criteria by which grant applications are scored.
VCDBG funding can be utilized in a number of different types of projects, but the most common type of project is Housing Rehabilitation of properties that benefit LMI households, a priority in Virginia and for HUD in general. Housing Rehabilitation Projects are eligible for up to $1.25 million with a cost limit of $125,000 per rehabilitated house. In some cases, where a house is in such condition that it can not be rehabilitated within the cost limit, the home can be replaced as a “substantial reconstruction” on the same footprint. The term “substantial reconstruction” is very intentional in that CDBG funds can not be used for the construction of new housing except in specific circumstances. In most substantial reconstructions, other outside funding has to be tapped to cover the difference between the cost limit and the actual cost of construction. It is also important to note, that the VCDBG program design includes a strong preference for addressing homes for homeowners. Due to rental properties often being mixed in with the home-owned properties, a typical Housing Rehabilitation Project does include several landlord/investor-owned properties where the tenant household is LMI.
In the past, VDHCD required that Housing Rehabilitation Projects be implemented in a narrowly defined neighborhood or portion of a neighborhood so that the impact of the improvements would be more recognizable and create synergy throughout the project area. However, in recent years, VDHCD has allowed for scatter-site Housing Rehabilitation Projects and projects combining rehabilitations intended to address a cluster of housing needs with other
nearby scattered sites where individual houses are in need of rehabilitation, but the surrounding homes are in good condition. This provision is may be helpful in Covington’s case, where the windshield survey conducted identified select properties throughout the City surrounded by otherwise sound homes.
Virginia CDBG funds can be used for Comprehensive Community Development (CCD) projects, where the grant request may include public space improvements in addition to housing rehabilitation. Water and sewer utility upgrades, stormwater improvements, roadway and sidewalk improvements, and other public welfare improvements that enhance the quality of life in the project area are included in this grant. However, when scoring a CCD, VDHCD will be looking for the locality to also put some of its own money into these additional major activities through its capital improvement program, VDOT funds, or other matching grant sources. VDHCD also frowns upon improvements that are simply deferred maintenance that the locality has failed to address in the past.
As a part of any VCDBG-funded project, a portion of the grant funds can be used for administering the grant. This portion can be retained by the locality to compensate for staff time dedicated to the management and administration of the project. Alternatively, a locality can procure the services of an outside consultant or its Planning District Commission for managing and administering the project. However, even where outside assistance is utilized, the locality has to make the application for the funding upon approval of its governing body and is contractually responsible for expending and administering the funds in keeping with VDHCD and HUD requirements. Similarly, per VDHCD guidance and cost limitations, VCDBG funds
can be utilized for the cost of procuring and utilizing the services of a Housing Rehabilitation Specialist, an architecture firm, and/or an engineering firm as needed for the specific project.
VDHCD also provides VCDBG funding toward Planning Grants to do the community outreach, neighborhood research, housing assessments, preliminary architecture, preliminary engineering, planning and budgeting, and project development for potentially eligible VCDBGfunded projects. As mentioned, a portion of the funds can be retained to compensate for staff time put into the planning of the project, or a locality can procure the services of an outside consultant or the area’s Planning District Commission to manage the grant. The funds can also be utilized for the cost of preparing housing assessments and preliminary reports.
Housing Construction Funded by CDBG Funds and Other Virginia Resources
While VCDBG funds can not be used for the construction of new housing, VCDBG grants and other Virginia funding sources can be used in support of new housing construction. VCDBG funding up to a set amount can be used for improvements necessary to bring newly constructed housing units online, whether singlefamily or multifamily. Eligible improvements include the design and development of the infrastructure (water, sewer, storm drainage, and sidewalks/roadways) needed to serve the new homes as well as initial site improvements. At least 51% of housing units or households must be considered LMI to qualify for these funds. Lexington also needs to control the property at the time of the application and through construction, typically via ownership. Afterwards, the City may transfer ownership to a housing
developer. Utilizing VCDBG in this manner is ideal where the City owns a larger vacant parcel of land that is well suited for new housing development. The improvements represent a significant incentive that the City can provide. If coupled with a discount or $1 sale of the land, the incentive is even larger.
Where housing is being constructed for home ownership, the VCDBG funds can also be used for down payment assistance as long as the funding does not exceed 50% of the assistance provided. Many projects created in order to provide affordable first-time home buyer opportunities are developed by certified Community Housing Development Organizations (CHDO), housing development non-profits that receive direct subsidies from VDHCD/HUD in support of their housing efforts. These organizations have extensive knowledge of the grant programs and the effort required to make such a project successful. They also have staff that provide credit counseling, prequalification/under-writing of households eligible for home ownership, home ownership education, and other supportive services required by the grant funding agencies.
VDHCD oversees HOME Investment Partnership Program funding in Virginia and the Virginia Housing Trust Fund. Down payment and closing cost assistance of up to 10% of the value of the home being purchased can be provided to households that have incomes at or below the 80% AMI level and contribute 1% of the sales price to the purchase from their own funds. This assistance is subject to recapture if the home is sold within the 5 to 15 year affordability period depending on the amount of assistance provided. Similarly, an individual who develops housing affordable to those under the 80% LMI income cap can receive a direct subsidy to buy down the cost of newly constructed affordable
homes (not including market-rate homes that might be included in a project.) Furthermore, the home receiving the subsidy would be subject to a 5 to 15 year affordability and recapture period depending on the monetary value of the assistance provided.
Specific programs typically change year to year, please reference the Virginia Department of Housing and Community Development and Virginia Housing websites for the latest information regarding funding opportunities as well as the specific rules and limits on funding availability.
Virginia Housing, Virginia’s housing finance agency, works directly with potential homeowners to educate and prepare them for homeownership. By working with local banks to arrange favorable loan terms, particularly for first-time home buyers. It serves as the gateway for affordable loans through its conventional lending program that requires only 3% down payments and favorable interest rates; FHA loans that require a 3.5% down payment; VA lending that requires no down payment; USDA Rural Housing Service loans that also require no down payment; and even second mortgages for first time and repeat home buyers in federally targeted areas. Virginia Housing also provides down payment grants of 2.0% to 2.5% and closing cost assistance for income-qualified first-time home buyers. Required credit scores for these various programs run from 620 to 660, depending on the program. The City would not have a direct role in accessing Virginia Housing support for homebuyers, however, it does have a role in making sure the community is aware of the resources that are available. By inviting Virginia Housing to provide an information booth
at City-sponsored community events, building awareness among community groups of the support that is available, and communicating the availability of the resources through means such as its website, public service announcements, newsletters, utility bill inserts, and so forth.
The LIHTC program is a tool used by nonprofit and private developers to under gird the rehabilitation of or construction of affordable rental housing. Technically a locality is not involved in the development process other than through zoning and land use decisions that have to be rendered. However, this program is relevant to the City because of the role that Covington can play in incentivizing LIHTC housing development through discounted or $1 land sales. Most LIHTC developments involve larger apartment buildings or complexes in order to make the finances work. Vacant parcels in the City’s inventory could provide a workable location for a LIHTC project. While it is impossible to cover all of the bases of what a LIHTC project involves, this document provides some basic information.
LIHTC tax credits give investors a dollar-for-dollar reduction in their federal tax liability in exchange for providing financing to develop affordable rental housing. Investors’ equity contribution subsidizes low-income housing development, thus allowing some units to rent at below-market rates. In return, investors receive tax credits paid in annual allotments, generally over 10 years. Competitive credits of 9% tend to generate around 70% of a development’s equity over the 10-year period, while less-competitive credits of 4% tax credits are used for those projects seeking financing through tax-exempt lending, whereas projects using the 9% tax credits are not eligible
for such financing. In Virginia, Virginia Housing oversees the LIHTC program. Virginia can only provide the 9% credits in any given year per an allocation of credits provided by the federal government, so the process is very competitive. The 4% credits are limited only by Virginia Housing’s volume cap on its tax-exempt lending and are therefore still competitive, but not nearly as competitive as the 9% credits.
Owners or developers of projects receiving LIHTC tax credits agree to meet an income test for tenants and a gross rent rest. There are three ways to meet the income test:
1. At least 20% of the project’s units are occupied by tenants with an income of 50% or less of AMI for household size.
2. At least 40% of the units are occupied by tenants with an income of 60% or less of AMI.
3. At least 40% of the units are occupied by tenants with income averaging no more than 60% of AMI, and no units are occupied by tenants with income greater than 80% of AMI. The gross rent rest requires that rents do not exceed 30% of either 50% or 60% of AMI, depending upon the share of tax credit rental units in the project. All LIHTC projects must comply with the income and rent tests for 15 years or credits are recaptured. In addition, an extend compliance period (30 years in total) is generally imposed.
The FHA 221(d)(4) lending program guaranteed by the Federal Housing Administration (FHA), is the multifamily industry’s highest-leverage, lowest-cost, fixed-rate loan available for the development of multifamily housing. 221(d)(4) loans are fixed and fully amortizing for 40 years, not including an additional interest-only period of three years during construction. A 221(d)(4) loan
can be used for the construction or substantial rehabilitation of detached, semi-detached, walk up, row, and elevator-type multifamily properties, including market-rate, low-to-moderate income, and subsidized multifamily, cooperative housing and affordable housing properties with at least five units. Commercial and retail space in mixeduse properties is limited to 25% of the new rent-able area and 15% of underwritten effective gross income. Projects funded in this way are subject to numerous FHA requirements and fees and the Davis-Bacon Act’s prevailing wage for the locality, but the lower long-term interest rate associated with a federal guarantee compensates for the additional upfront costs.
- Review of Existing Plans
- HOPE, Inc. Site Design
Demographics
The Comprehensive Plan for the City of Covington was developed as an update to the City’s first official comprehensive plan in 1960. The Census records in 2000 for the City denoted that the population was 6,303, representing a 12.4% loss from 1990 to 2000. In 2000, there were 2,835 households in Covington. According to Census records, Covington’s population peak occurred in 1960, when a total of 11,062 persons lived in the City. Covington was approximately 84% White in 1996, and 15% Black or African American the same year.
The latest income statistics available in the 2002 plan were from census records dated to 1989, indicating that the median household income in Covington that year was $20,913 compared to $33,328 for the State of Virginia. The poverty rate for the City in 1995 was approximately 15%.
Economics
In 2002, the manufacturing sector in Covington revolved around the West Virginia Pulp and Paper Company (now known as WestRock), AET, Inc., Lear Corporation, and other smaller industries. The Comprehensive Plan notes that many of the industries in the City were tied to raw materials such as logging and timber. Approximately a third of workers in Covington in 2002 were employed outside of the City, most of whom worked in Alleghany County and Clifton Forge. Nearly 1,000 workers were employed within Covington but commuted from elsewhere, the majority of whom lived within Alleghany County.
Employment by industry indicated that manufacturing was the most prominent industry by employment in Covington in 1997, providing 2,704 high-paying jobs to residents of Covington, Alleghany County, and nearby environs. In 1997, the annual payroll for manufacturing jobs in Covington was $114,282.
The City of Covington received $20,574,944 in general fund revenues for the fiscal year of 20002001. Non-revenue receipts, property taxes, state government payments, and local taxes made up the majority of the General Fund Revenues for the City. Over half of all revenues were appropriated to public works and education for the same fiscal year.
Covington is situated in an area with steep topography – which is considered a significant limitation in land use decisions.
According to the 2002 Comprehensive Plan – much of the level land in Covington had been utilized already. The Comprehensive Plan cautioned against developing onto steep slopes to prevent loss of slope and soil stability, stormwater runoff, and aesthetic resources.
In 2002, the predominate housing type in Covington was single family, as single family homes were recorded as 78.7% of housing stock in the City. However, it was noted that at least 15% of the housing stock was multifamily and were scattered throughout Covington.
Commercial structures were scattered throughout Covington, with a larger commercial strip located in the West Central section of the City. At the time, a new commercial area called the Riverbend Shopping Center opened south of Interstate 64 in the City.
The comprehensive plan noted that the total number of housing units in Covington had been decreasing from 1960 to 1990 at a loss of over 300 units. According to the Comprehensive Plan the reason for this loss was due to the demolition of 322 units to allow for an expansion of the MeadWestvaco plant. About 40% of the housing stock in Covington was built prior to 1939 according to the 2002 plan, with declining construction of new homes in the following decades.
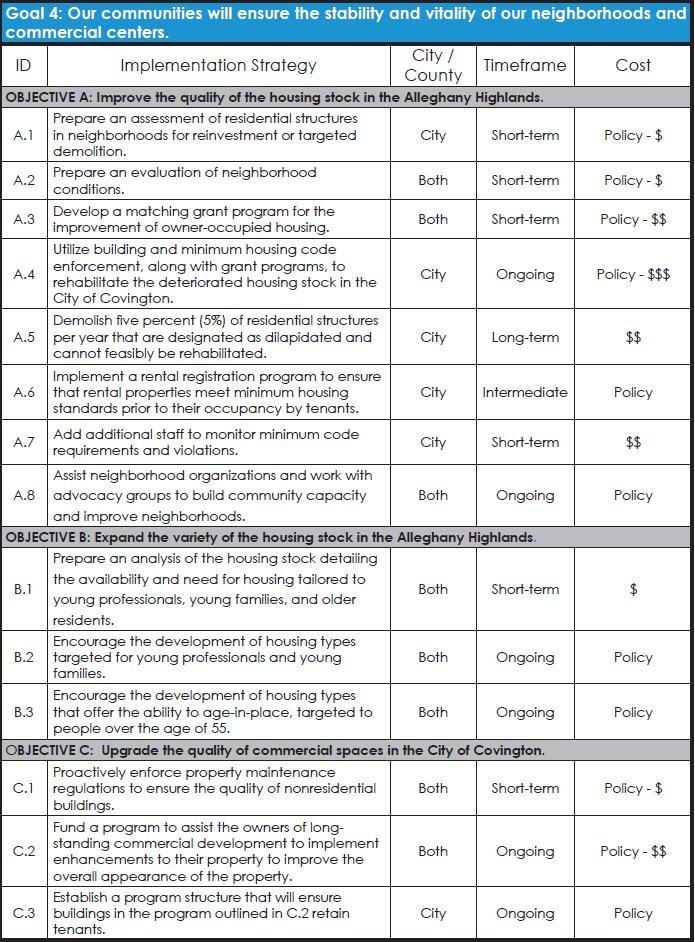
Goals & Objectives
The Goals and Objectives found in Covington’s Comprehensive Plan were developed in tandem with Alleghany County – both localities are sharing the same vision, goals, and objectives in their respective comprehensive plans. When accounting for housing, Goal 4 is most applicable: “Our communities will ensure the stability and vitality of our neighborhoods and commercial centers.” (pg. 7) This goal included the following objectives:
• Improve the quality of the housing stock in the Alleghany Highlands.
• Expand the variety of housing stock in the Alleghany Highlands.
• Upgrade the quality of commercial spaces in the City of Covington.
• Cultivate infill and/or redevelopment within the City of Covington.
• Establish an urban trail network to connect residential and commercial areas with parks, schools, and the regional trail network.
• Launch a gateway development initiative to enhance key entrances into Alleghany County.
• Improve land use compatibility in areas where incompatible development patterns and uses have been established that threaten the integrity of neighborhoods or quality of commercial areas.
• Improve the appearance in the City of Covington’s downtown.
• Revitalize downtown Covington.
• Improve the Alleghany Highland’s road network.
• Decrease the amount of commercial vehicle traffic on residential streets.
• Maintain and upgrade bridge infrastructure.
The City of Covington’s population has been in a downward trend since 1970. (pg. 14) The City’s median age is 44, which is several years older than the state’s median age of 38. The City has a
higher old age dependency rate as a result, which creates more financial stress for the working population as there is a smaller workforce and a larger post-workforce population.
Covington has a poverty rate of about 25% and the City’s median household income was $34,703 in 2019. Much of the City’s working population have high school diplomas and some college as their maximum level of education attainment. (pg. 15)
The population of Covington decreased by almost half from 1979 to 2019. To reverse the negative implications of this population decline, aging population, poverty level, and low educational attainment, the Comprehensive Plan issued a few broad recommendations. These included focusing on community investments, public and private partnerships, economic development, and school programs to attract more residents.
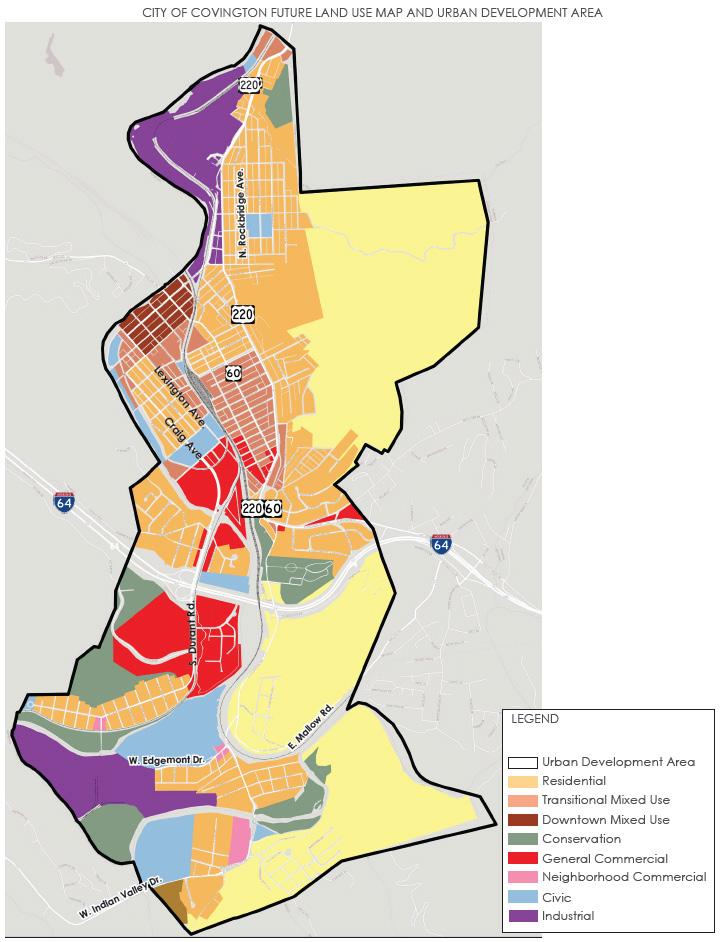
Approximately 60% of Covington’s land area is devoted to residential neighborhoods. An additional 13% of the land is industrial, followed by 5% Commercial, and 3% open space. The future land use map calls for an increase in medium density residential development of 2-8 dwelling units per acre, as well as two mixeduse categories to promote a mix of retail and residential in neighborhoods (pg. 18-19).
In 2019, Covington’s Comprehensive Plan illustrated housing data for the City, finding that there were 3,035 housing units within Covington. (pg. 41) These units are primarily single family, accounting for 86% of all units, with a mix of mobile homes (5%), multifamily (4%), and duplexes (5%) accounting for the other housing units. Approximately 90% of housing units are 39 years and older, and the median home value was $70,900 in 2019.
Covington found some issues in housing in the City as part of the Comprehensive Plan. The vacancy rate in 2019 was 19%, and between 2010 and 2016 there was a 68% increase in the number of homeowners paying 30% or more of their income on a mortgage. There was also an increase of 48 units that lack complete plumbing and the number of units that have more than one occupant per room grew by more than 7 times in the same period.
Much of the housing stock in Covington was built in the early- to mid-1900s, consisting of two-story homes on smaller lots (pg. 42). The Comprehensive Plan noted that “the largest issue for housing in the City of Covington is the lack of available multi-family housing, accounting for only 4% of the housing stock, to accommodate young professionals and aging residents.” Due to the age of most homes, the Plan noted that there is an issue of lack of maintenance, leading to blight in certain neighborhoods. Of the over 3,000 housing units in Covington, 81% were listed as occupied in 2019, indicating a vacancy rate of nearly 20%.
Covington is facing a population decline, and the Comprehensive Plan noted that the City has seen a decline in the number of renters, stating, “the residents leaving the City might have tended to be renters rather than homeowners.” (pg. 44) To address this issue, the Plan recommended that
the City of Covington monitor the rental market to ensure adequate housing for the renterpopulation by partnering with citizens, non-profit groups, and the Virginia Department of Housing and Community Development to leverage resources.
Owner-occupied households are facing issues of maintenance costs, creating the potential of blight conditions. The Comprehensive Plan recommended that the City adopt a similar approach by partnering with a variety of stakeholders to seek out resources to support homeowners. This was identified as a key need, as “removing blight from neighborhoods where maintenance has not been a priority will help to improve the City’s housing infrastructure and stabilize neighborhoods in decline.” No one specific neighborhood or area of the City was mentioned as a priority area, but the Plan recommended that it not be restricted to one or two neighborhoods and instead have a City-wide prioritization plan for housing improvement.
Economic Development
According to Covington’s Comprehensive Plan, the top three economic sectors in the City were retail (14%), government (12%), and construction (9%).18 Retail and Construction were projected to increase by 5% and 13% by 2024, respectively. The top growing occupations in the City were personal financial advisors (51.4%), home health aides (47%), nurse practitioners (37%), medical assistants (33%), and physical assistants (32%). The median household income in 2019 was $34,703 in 2016. Over 90% of residents drove alone to work, taking an average of 20 minutes to reach their destination. Over half (63%) of residents work outside of the City, whereas 30% of residents work in the City. The Comprehensive Plan notes that the unemployment rate has been declining from 10% in 2009 to approximately 5% in 2016, however, the poverty level has increased considerably from 2000 to 2010, rising by 6%. (pg. 79) This represents an underemployment challenge, where residents can obtain employment but do not receive the wages necessary to sustain themselves.
Goals and Objectives from the Comprehensive Plan (2019)
Allegheny County listed 8,063 housing units in the County’s Comprehensive Plan from 2019 (pg. 41). Most of these units were noted as single family detached, accounting for 83% of all housing units in the County. The other dominant housing types were mobile homes (8%), multi-family (7%), and duplexes (2%). Nearly three quarters of all housing units in Allegheny County are 39 years of age or older, and the median home value in 2019 was listed as $111,500.
The Allegheny Comprehensive Plan denoted some worrying trends in 2019, namely the 23% increase in the number of renters paying 30% or more of their income on housing (pg. 41). Additionally, there was an 18% increase in the number of homeowners without mortgages spending 30% or more of their income on housing costs.Units were also described as losing some essential home functions between 2010 and 2016, with a 24% increase in units lacking complete kitchens, and a 62% reduction in units lacking complete plumbing in the same time period.
Alleghany County stressed that “The focus of future efforts in the County should be placed upon maintenance and rehabilitation programs, especially kitchens, as well as monitoring the rental market to ensure adequate housing for the renter-population (pg. 45). Recommendations included a multifaceted approach that involves citizens, non-profit groups, and the Virginia Department of Housing and Community Development (DHCD) to leverage resources.
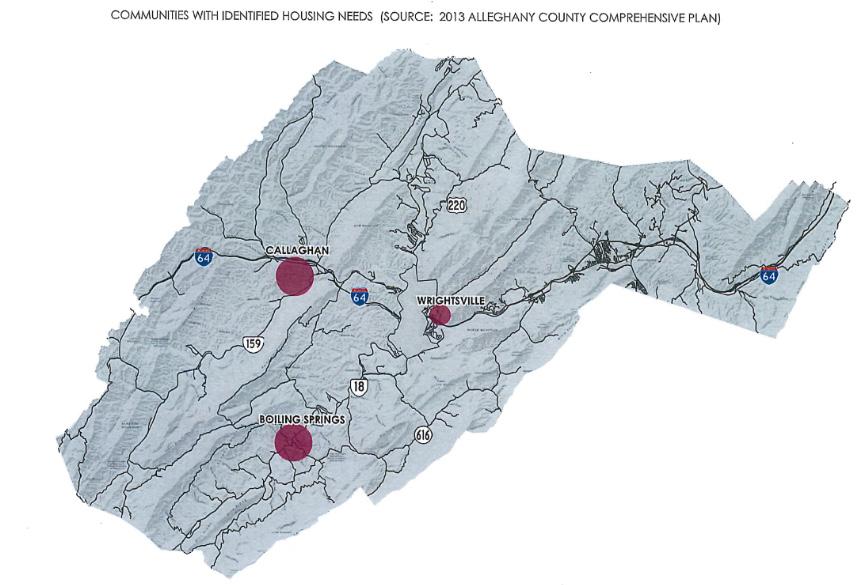
An important point made was that Alleghany County’s population is declining, but that the County can address the current issues without additional pressure for new development potential. The plan further states that “…the County still needs to create the opportunity for new development as a way to invite population back into the region.” Allegheny County also noted three areas that had identified housing needs in the Housing chapter of the Comprehensive Plan. These three areas have high concentrations of renters and manufactured home communities that are in poor repair.
Helping Other People Excel, Inc. (HOPE) is a local grassroots 501c3 non-profit that has been supporting Covington and the region for the past 20 years. The organization’s mission is to provide supportive services, housing, and relief for those disadvantaged or marginalized. Our goal is to help build stability, structure, and resilience for those affected by adversities of life.
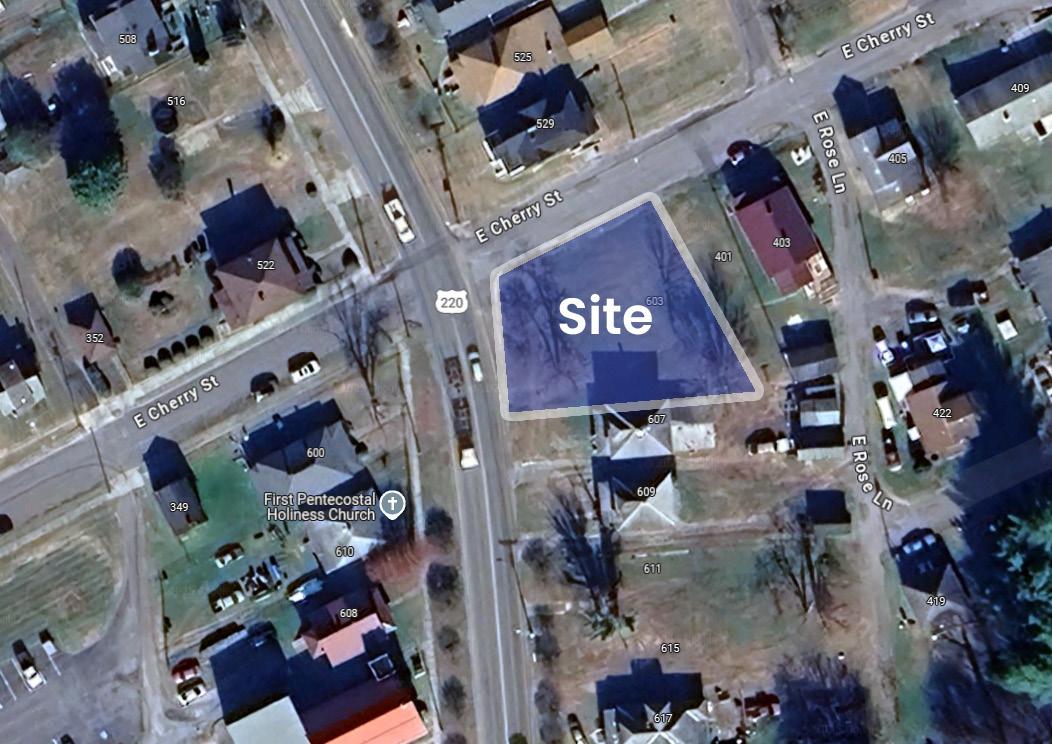
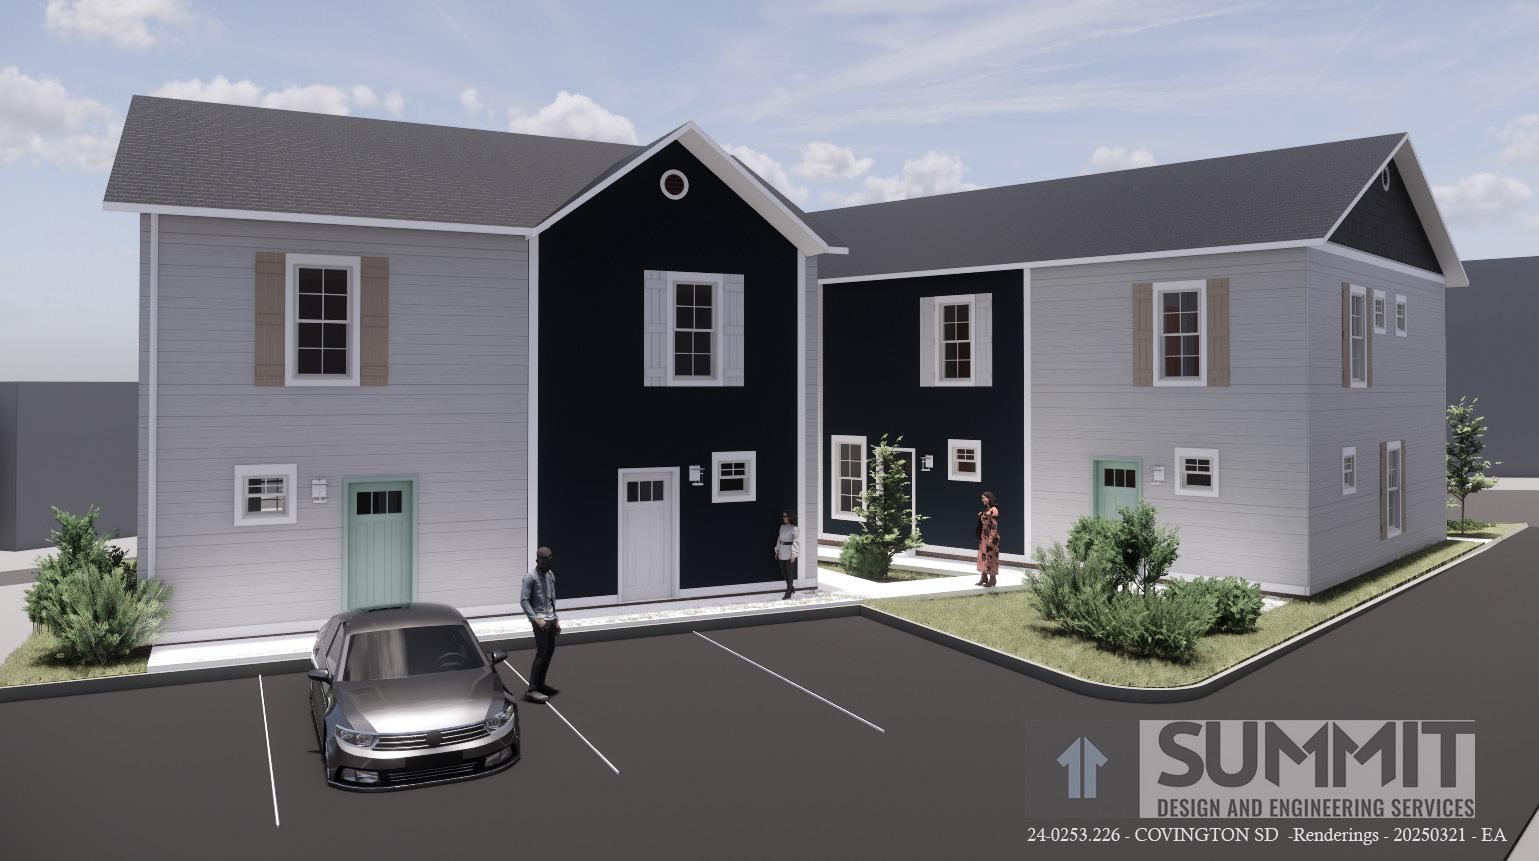
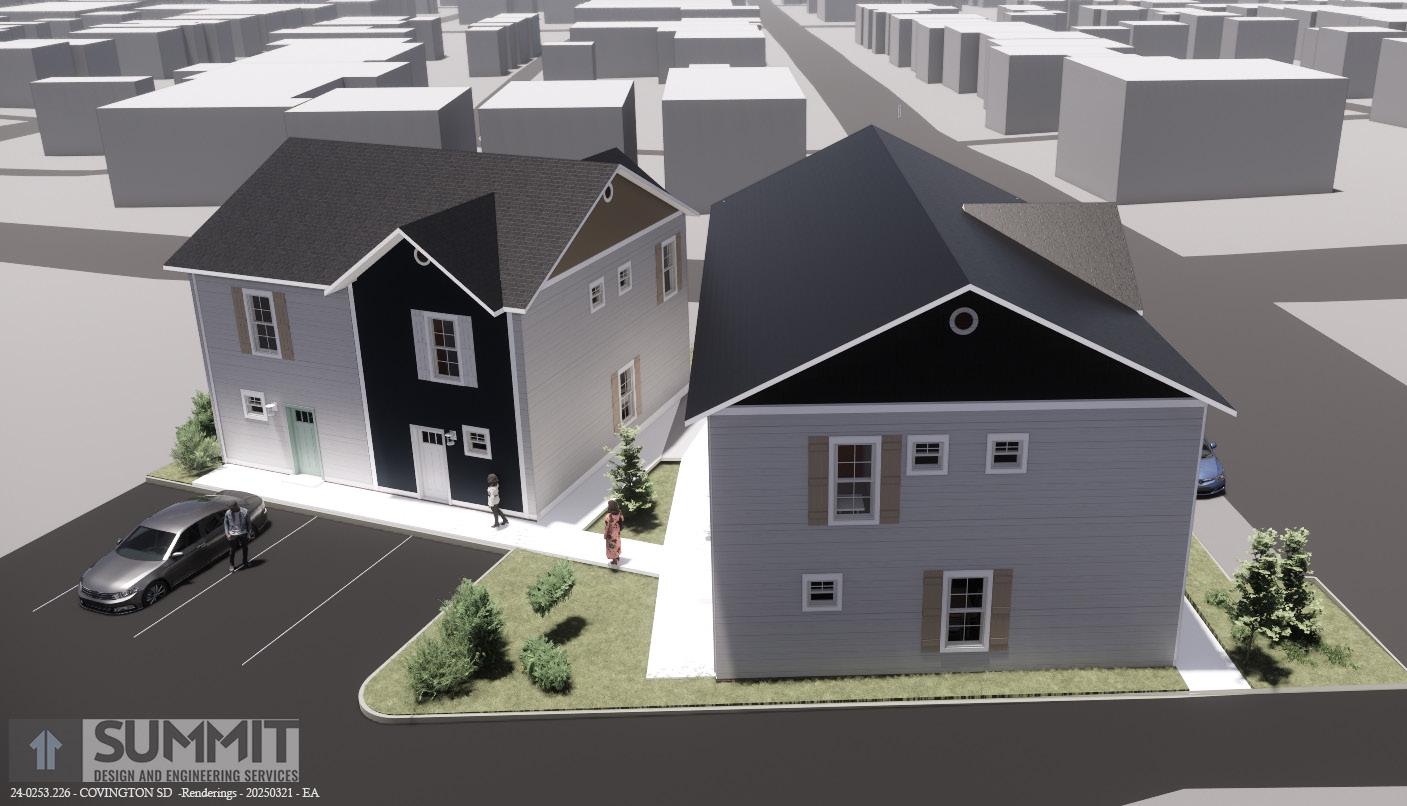
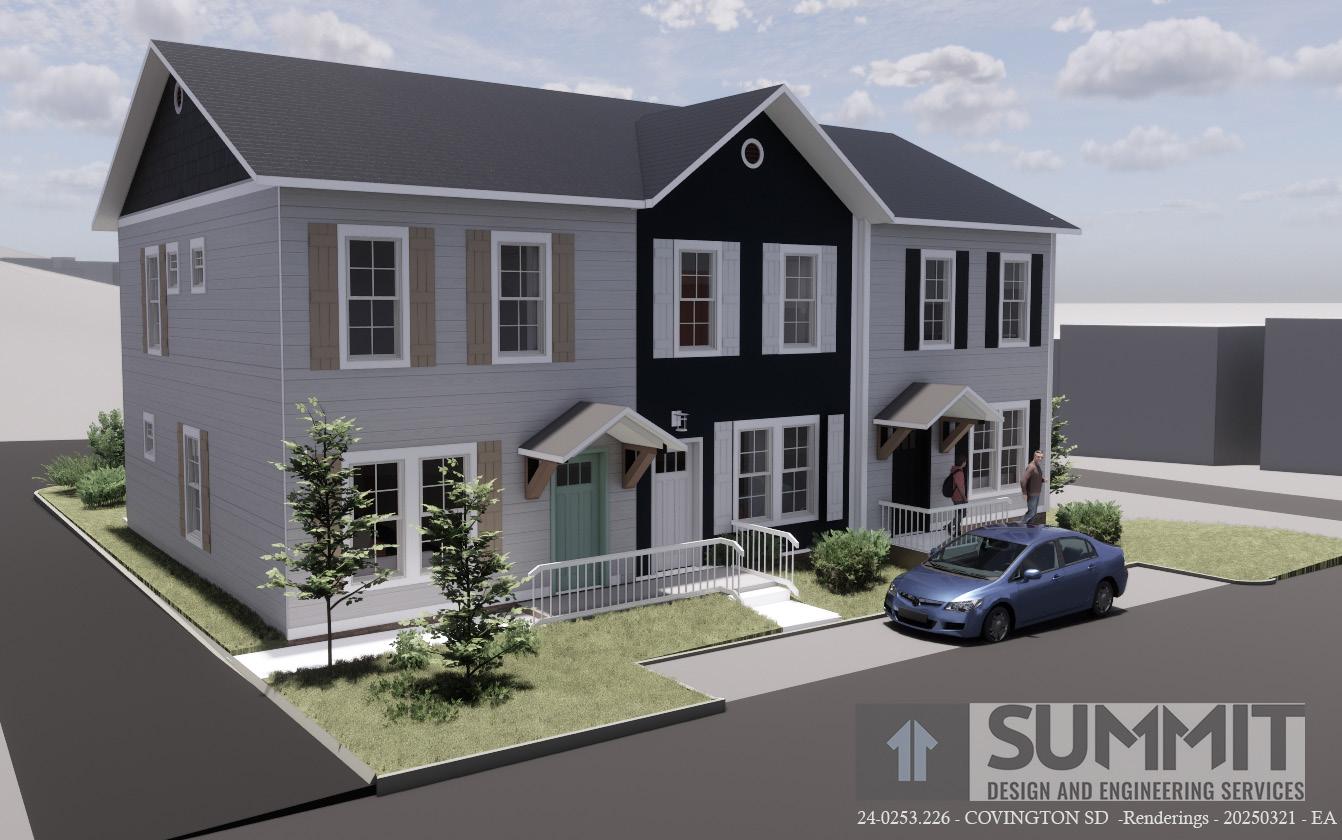
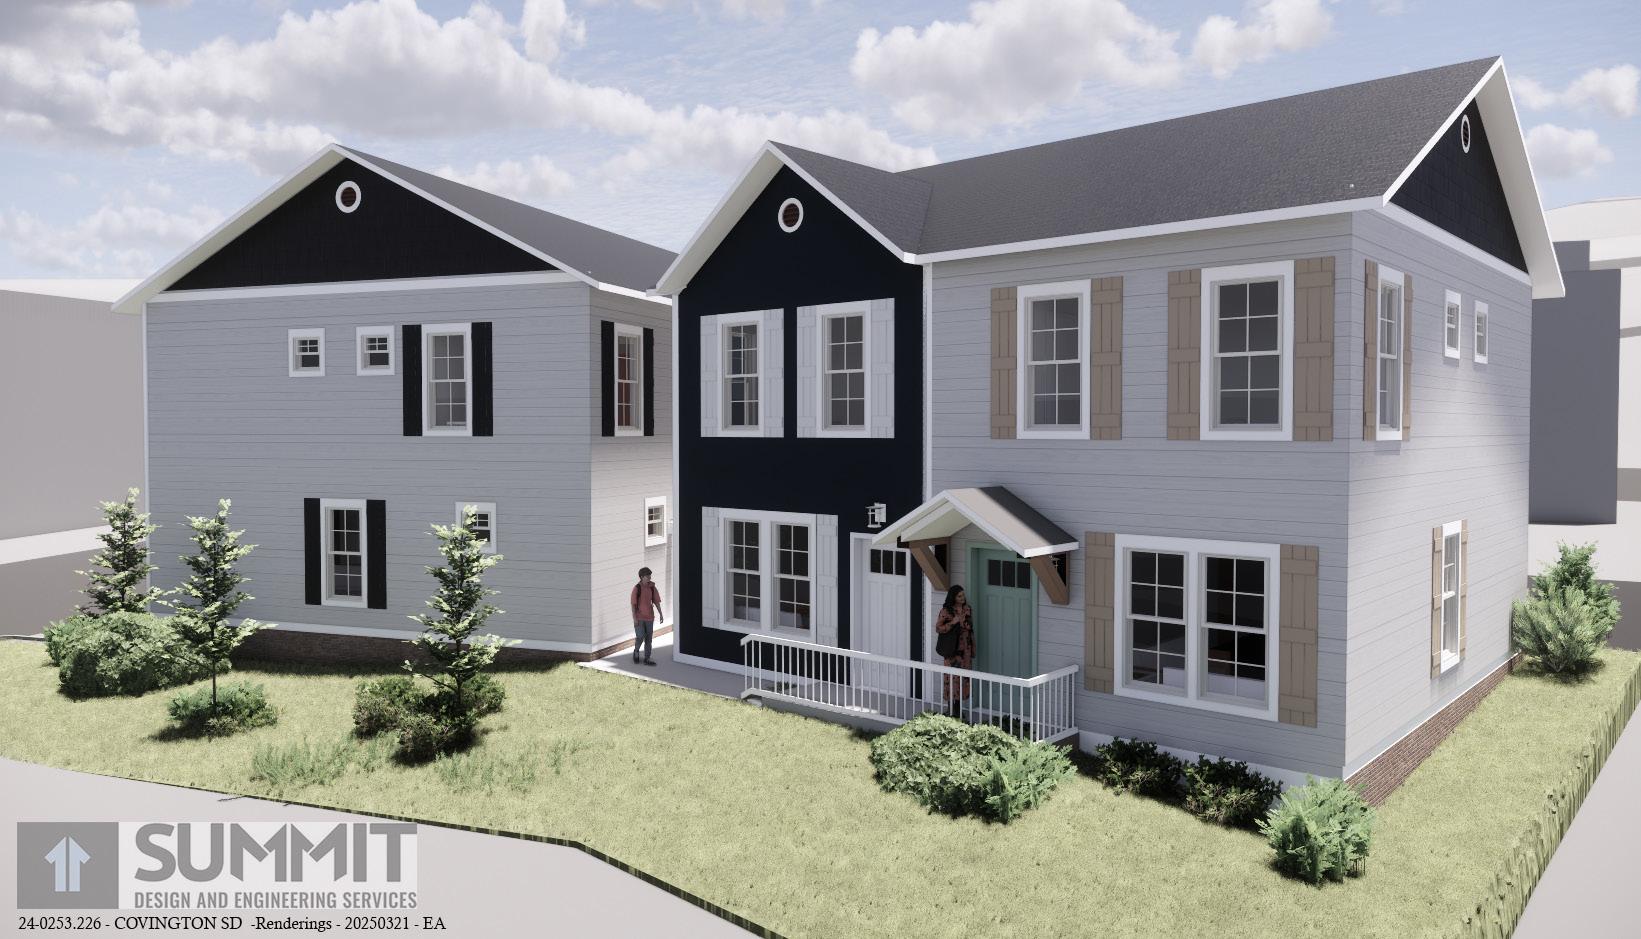
This Covington City-wide Housing Study 2025, was conducted in collaboration with the City of Covington and HOPE to provide conceptual designs and a site plan for a property at the corner of S. Alleghany Ave. and E. Cherry St.
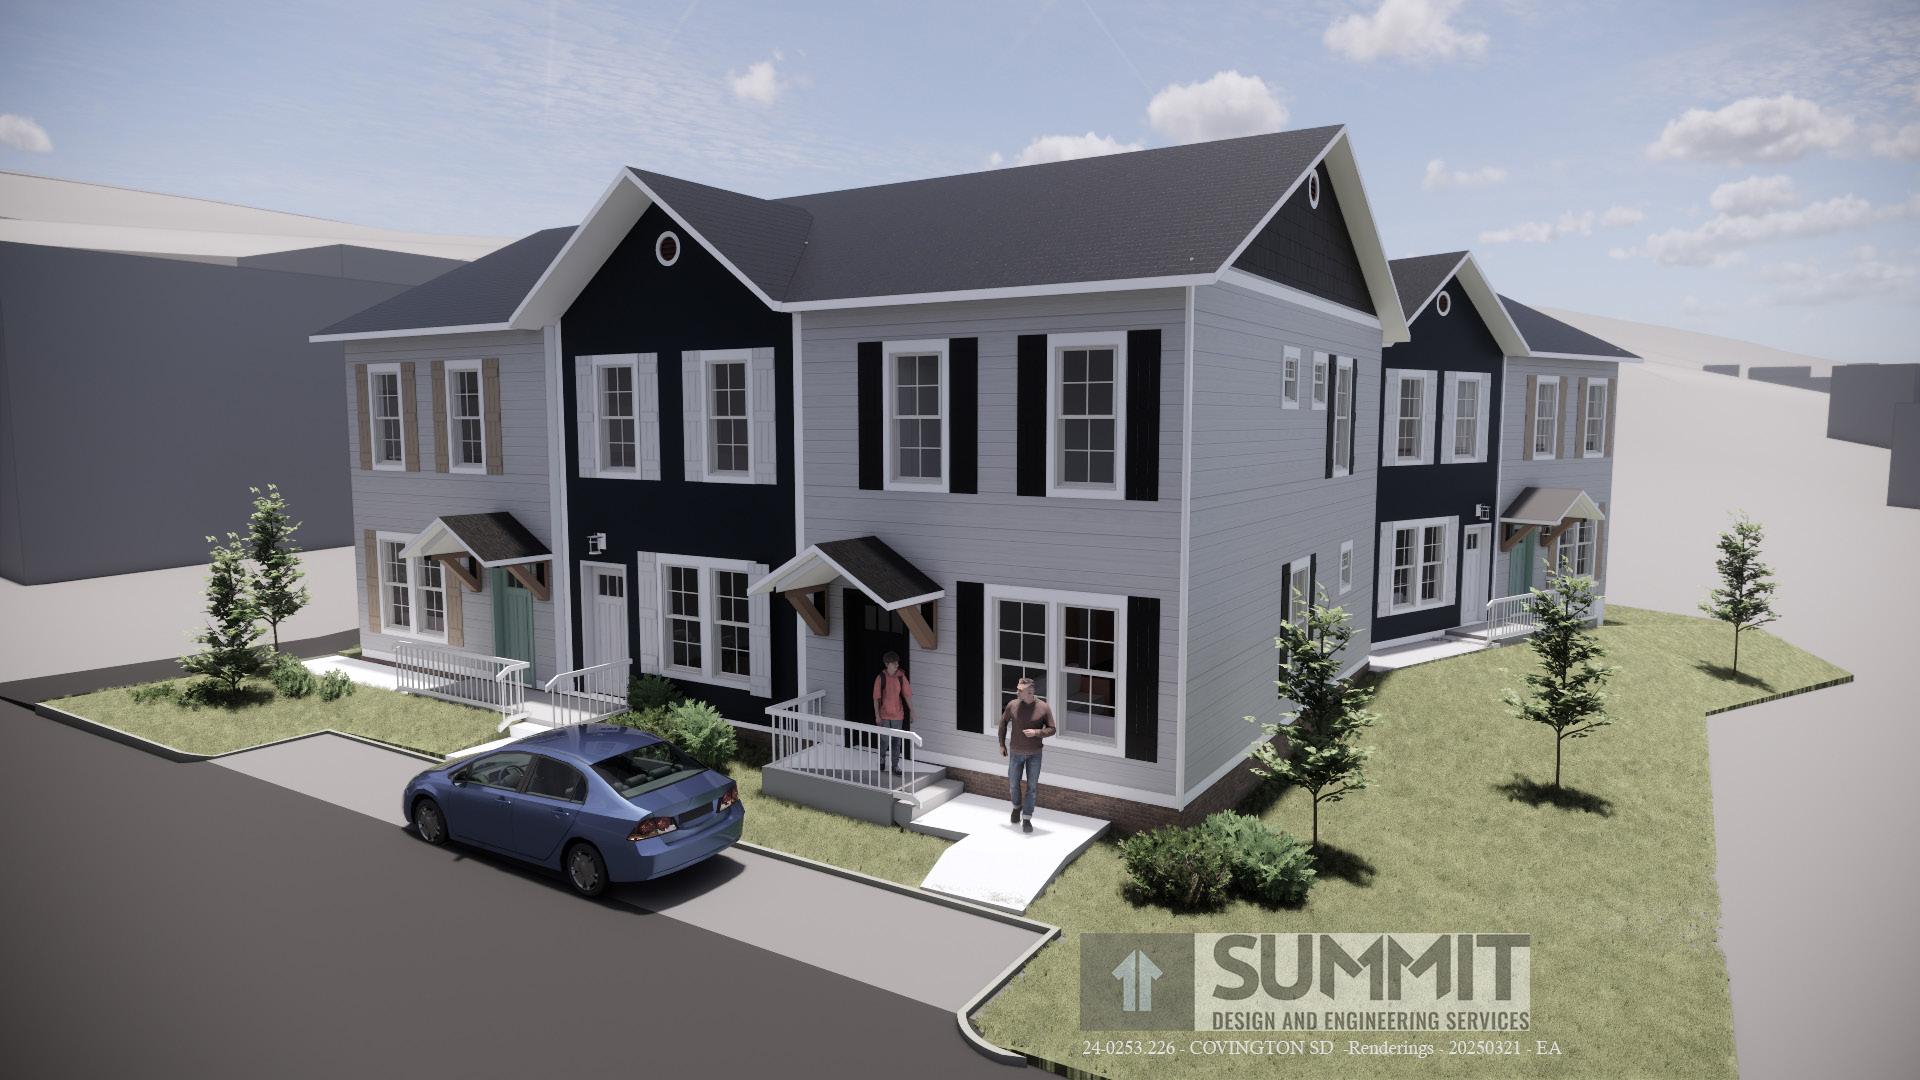
The design provides five affordable units with four parking spaces. The units are two stories and feature usable outdoor space, providing quality homes for community members. The project responds directly to conditions seen during the housing study, including a lack of diversity by housing type and size, and issues with maintenance. Homes of this type could provide a new model for Covington to develop new housing where infrastructure is available for a more livable future.
The concept plan is followed by the pro-forma, which analyzes the project’s financial feasbility.
Introduction
For the purposes of this feasibility study, we looked at residents within a 30-minute drive time from Covington City Hall to determine whether there is a market for five, 2-bedroom houses and to look at potential rents. We also investigated the market within a 45-minute drive time and a 60-minute drive time. The 30-minute and 45-minute drive time data is presented below, but the 60-minue drive time was not significantly different in terms of statistical vacancies, income, rents or really anything pertinent, other than just representing a significantly larger population. While there may be some people living in this additional 15 -minute drive time area that would be interested in a new construction apartment/ house in Covington, considering that the additional area includes Lexington, we decided to exclude it from our consideration.
30-Minute Drive Time Housing Data:
The 30-minute drive time data is the primary market for Covington. It includes Clifton Forge, but otherwise is mostly rural and low-density areas with several small towns and settlements. There are 22,745 people in this area and a total of 9,724 households. Of these households, there are 2063 renters within 30 minutes of Covington City Hall, or approximately 21.2% of households. Of these renter households, 1941 pay for utilities in addition to rent (94%).
The median rent is $732/month, which is very low by national and state standards. However, approximately 25% of renters pay more than $900/month for rent.
While it is difficult to know when the rental units, specifically, were built, more than 80% of all housing units in Covington are 35 years old or more and 60% are at least 50 years old.
The housing market in Covington’s primary housing market has very low turnover. More than 75% of all residents have been in their current home for at least 15 years, and 61% of all renters have been in the same residence for 7 or more years.
There are a total of 2487 unoccupied housing units within a 30-minute drive time of Covington City Hall. 6.2% of the unoccupied residential units are currently for rent and unoccupied (155 units). When added to the occupied rental units, this means there are 2,218 total rental units in Covington, of which just under 7% are vacant. This shows strong demand, especially as, statistically, most of those vacant units are likely outdated (more than 35 years old).
The 45-minute drive time data includes the primary market for Covington, plus an additional secondary market. It includes Clifton Forge, but otherwise does not include any significant settlements or incorporated areas and is very sparsely population, somewhat to do with including significant portions of National Forest. There are 52,020 people in this area and a total of 21,484 households. Of these households, 5,434 are renters within 45 minutes of Covington City Hall, or approximately 25.3% of households, which is slightly higher than the percentage within 30 minutes of Covington. Of these renter households, 4985 pay for utilities in addition to rent (91%).
The median rent is $824/month, which is 12.5% higher than the median rent in the 30-minute area but still low by national and state standards. However, approximately 34% of renters pay more than $900/month for rent.
The housing stock is slightly newer in the broader area, but still, approximately 75% of all residential units are at least 35 years old and more than 60% are at least 50 years old.
Turnover is similar to 30-minute numbers: 75% of all residents have been in their current home for at least 15 years and 61% of renters have been in their current residence for at least 7 years.
There are a total of 5657 unoccupied housing units in the broader 45-minute drive time area,. 7.8% of the unoccupied units are for rent and vacant (439 units), which is a 7.4% vacancy rate. Again, given that most of these vacant units are likely to be outdated and less appealing, this vacancy rate shows strong demand.
The median household income in this area is $49663. Virginia Housing and HUD use a median of $69,500 for the Alleghany/Covington/Clifton Forge area and 80% AMI as $58640. 31% of households earn between $50,000 and $100,000 per year. When looking at household led by a person between the ages of 25 and 44, the percent of households with annual earnings between $50,000 and $100,000 rises to 36.7%. This is important, because HUD considers a household “Housing cost burdened” If their housing costs exceed 30% of their annual income. At $50,000, this would equate to housing costs of $1,250; at $75,000 the housing costs must remain under $1875, and for a household earning $100,000 annually, the maximum rent and utilities should not exceed $2500.
83.7% of households are 1, 2, or 3 person households, likely because of an older than average population. 50% of households are 2 or 3 person households, which would be the target market for a 2-bedroom home. Accordingly,
22.9% of households have a child in the home, also indicating demand for two-bedroom homes. None of these points are statistically different at 30-, 45-, or 60-minute drive time areas.
*Note that this household information is provided to illustrate potential demand. In housing, it is not legal to discriminate based on familial status.
According to this data, there is demand for 2 bedroom living units in Covington and surrounding areas. The median rents are low and the allowable 80% AMI affordable rents ($1320, including utilities) are higher than the prevailing median rents for the region. However, there are a significant number of housing units renting for more than $900/month (~25% in a 30-minute area, and >30% in the 45-minute area).
With the so much of the current housing stock being older than 35 years, this leaves a very limited number of available newer units that have modern amenities and energy efficiency. Having a new-construction apartment, with amenities such as modern HVAC, new range, refrigerator and dishwasher and in-home laundry should be very appealing to a number of potential tenants and attract a premium over the prevailing median market rate, which is constrained by the age and condition of many of the units in Covington and the surrounding areas.
While we don’t have accurate data for existing rental unit size or price per square foot, we expect that, at just over 1,100 sf each, these homes are larger than most existing rental units. Therefore, rents should be able to be sustained that are higher than the median, even after adjusting for improved condition and amenities.
Additionally, the location on the edge of the Downtown district is considered moderate, in that while not a premium location, it is better located than many existing apartments that are farther from services and conveniences such as food stores and restaurants.
With all of these advantages, each of the new units should be able to attract a rent premium of 18-24% above the current median rent. This is a range of $972 - $1,022. Assuming an average of $300/month for necessary utilities, the total housing burden would range from $1,272 - $1,322 per month, which is less than 30% of income for any household earning more than $50,880 a year on the low end and $52,880 on the higher end. This is $1,137 and $3,137 more than the true area median income, but fits within the Virginia Housing and HUD guidelines for 80% AMI. Additionally, Virginia Housing caps rent for their 80% AMI programs at $1,328 for a 2-bedroom residence, so these rents fit within these limits.
Note: The following are approximate costs based on mid-level finishes and fixtures. They can vary widely based on market forces such as tariffs and labor shortages but are based on current costs.
Currently, the starting estimate for construction is $230/sf. This project could see some savings due to it’s shared walls, but using $230/sf at a total area of 5,511 sf provides a starting cost estimate of $1,267,530 for the project. It may be possible to modify the project somewhat and employ a manufactured housing construction process, whereby portions of the house are manufactured in a factory and delivered and assembled onsite. This process could save up to $15/sf, reducing the cost estimate to $1,185,000 for a savings of up to $78,000.
An additional factor in the building cost is site preparations work. Some sites require far more work to create a suitable building site than others. Without the benefit of an engineering study, we do not have the information to make a precise estimate of the cost of preparing the site for construction. The standard site work costs are included in the $230/sf estimate, but could vary the cost by as much as $5-15/ft.
*NOTE: because the proformas were not positive with 5 rent producing units, we did not run full pro formas for scenarios where one unit was reserved for transitional housing.
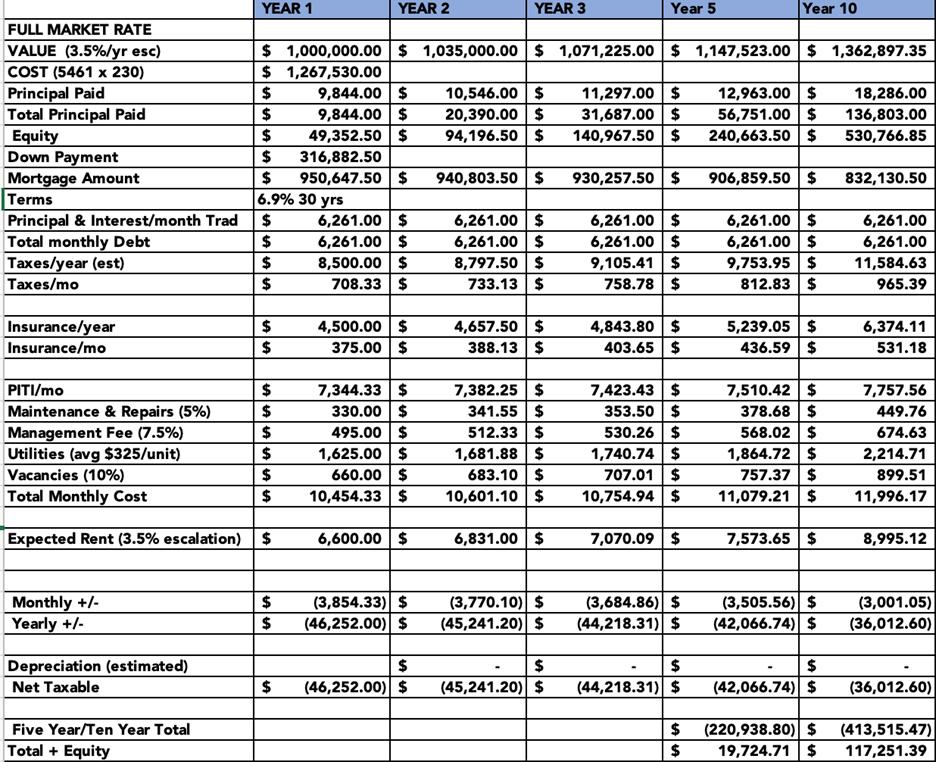
Market Rate:
The starting assumptions for the feasibility of the project are that the project will cost $230/ sf ($1,267,530) and be financed at 75% with a 25% Down Payment ($316,883.50). The market rate financing is a standard mortgage at 6.9% interest with a 30-year term. The rents used for the proforma are the maximum $1320/month allowable for HUD/Virginia Housing for 80% AMI, which coincides with the estimates for market rate rents on the units and meets the goals of the City and Hope to create affordable housing.
Other assumptions are:
• 7% Management Fee
• 5% for Maintenance and Repairs
• 10% Vacancy Rate (6 months total vacancy per year)
• $4500 for annual Insurance
• $325 per month per unit for Utilities
• 3.5% annual escalation for all income, values, and variable costs
We are using a $1,000,000 starting valuation for the development. This is roughly 80% of the projected cost. A more precise market value
would be calculated using a ~8% capitalization rate (CAP Rate). However, for projects like these, those calculations come in very low. For instance, using an 8% CAP Rate on the initial project income leaves a valuation of well under $400,000.
Based on this Market Rate assessment, the project is not feasible, as it loses $3,310 each month on a cash flow basis for a net loss of $39,718.24 in the first year. While the numbers do get better each year, after 10 years, the project still loses $3,001.05 each month, or $36,012.60 for the year. Additionally, the project requires $316,882.50 in Down Payment and results in a 10-year equity stake of $530,766.85. Once the annual losses are calculated, the project has a net 5-yr return on cash of $19,724.71, which means a net loss of $297,157.79. If the development was sold at the ten-year mark, the net loss is projected to be $199,631.50.
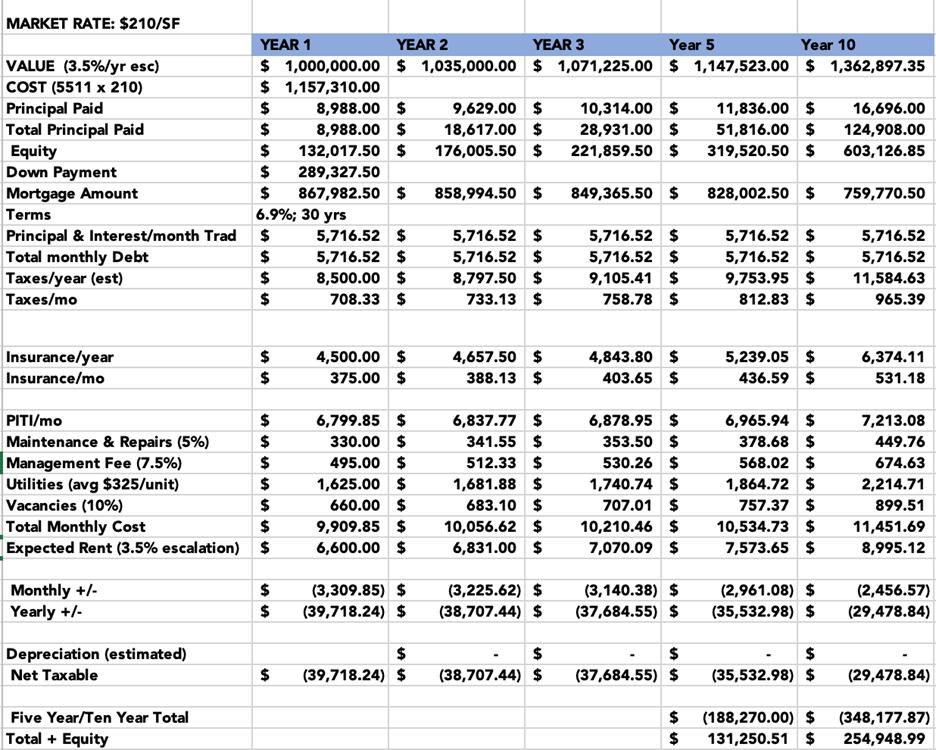
$210/SF Assessment:
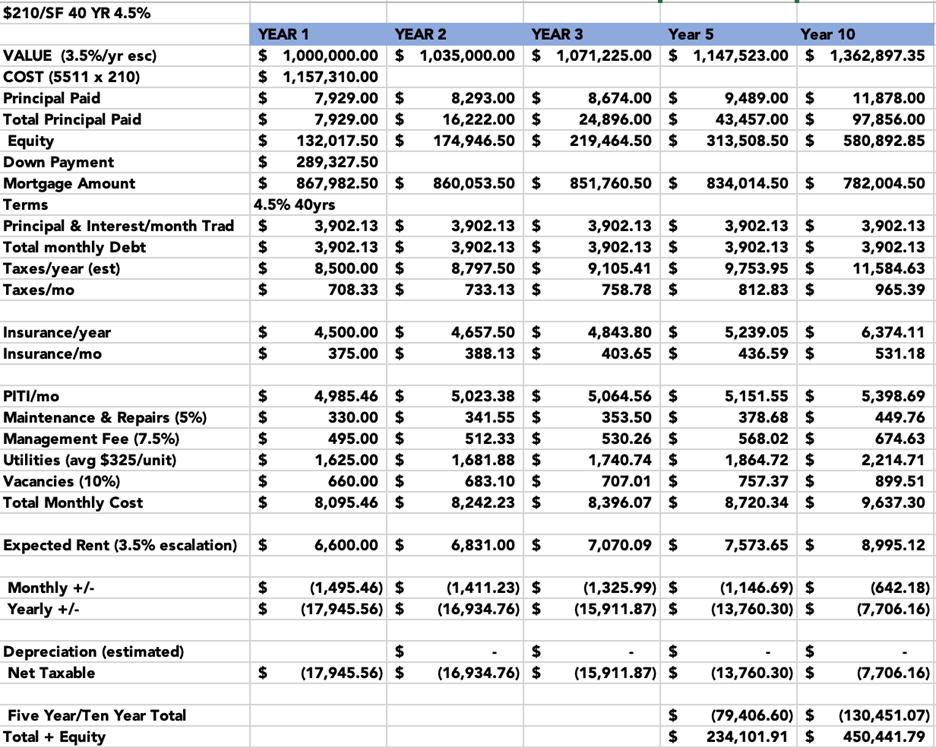
In the following scenario, all assumptions are the same as above, except the total cost of the project is based on $210/sf rather than $230/sf. This could potentially be achieved by using a manufactured housing process, reducing the level of fixtures and finishes, having the City perform site work, and/or removing or reducing one of the bathrooms.
This reduced rate results in a total cost of $1,157,310. This also reduces the Down Payment to $289,327.50 and the monthly cost of the mortgage ($867,982.50) to $5716.52. While the reduced costs benefit the bottom line significantly, the project still loses $3,308.45 each month in the first year and $2,456.57 in year 10. However, if the development were sold in the 10th year, it would come close to breaking even, with a net loss of only $31,378.52.
Alternatives:
With the results of these two Market Rate scenarios in mind, looking at alternatives is necessary. These include alternative financing models, as well as considering alternative scopes such as reducing the number of units or phasing the construction.
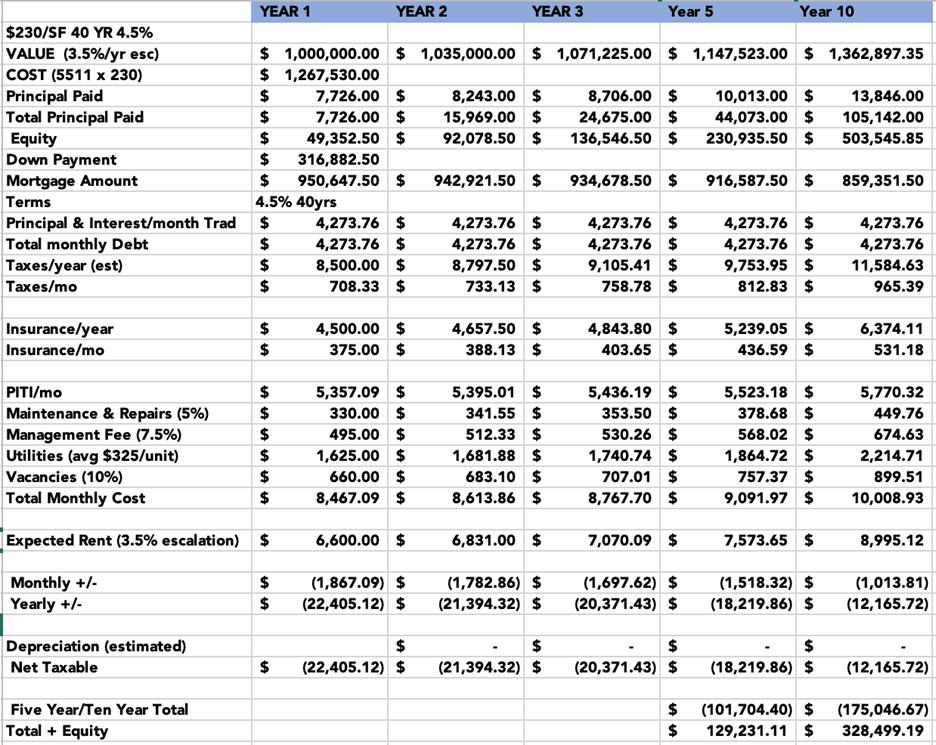
The simplest approach is to work with Virginia Housing to obtain a lower interest loan that is amortized over a longer period. Virginia Housing works to provide flexible terms to communities who need nontraditional financing to make their housing projects work. Targeting Low-to-Moderate Income residents makes this project more attractive to Virginia Housing. While their rates vary daily and their terms are somewhat negotiable based on the project needs, using a 4.5% interest rate and a 40-year term results in a monthly mortgage payment of $4,273.76. With all other assumptions the same as in the previous scenarios, this results in a monthly net loss of $1867.09 in the first year, or a loss of $22,405.12 in Year 1. By Year 10, the project earns a monthly loss of $1,013.81.
If cost reductions were successful in bringing the cost per square foot down to $210/sf and using a 4.5% interest rate and a 40-year term, the monthly mortgage payment is $3,902.13. With all other assumptions the same as in the previous scenarios, this results in a monthly net loss of $1,495.46 in the first year, or a loss of $17,945.56 in Year 1. By Year 10, the project runs a loss of $642.18 per month.
Items to note are that all of the scenarios thus far are including a monthly real estate tax bill of $708.33 and a 7.5% management fee of $495/month, which both increase at a 3.5% rate each year. If the City is able to remove this property from the tax rolls (or provide other tax relief) and the properties are managed “in-house” by Hope, then, in the $210/sf and 40 year, 4.5% interest scenario, the project loses $292.13 per month ($3,505.56 annually) in the first year, and is cash flow positive in Year 4. By Year 10, the project should turn a profit of roughly $1,000/month. Two other expenses are vacancies and utilities. Both of these are projected fairly high. If the units remain rented with little turnover, the vacancy losses can be reduced. Similarly, if high efficiency HVAC equipment is used and the houses are well insulated, then the monthly utility costs of $325 per unit can be reduced. Each of these reduced costs add to the bottom line in every scenario, but could allow Hope to break even earlier and possibly reduce rents or cancel rent increases in the future.
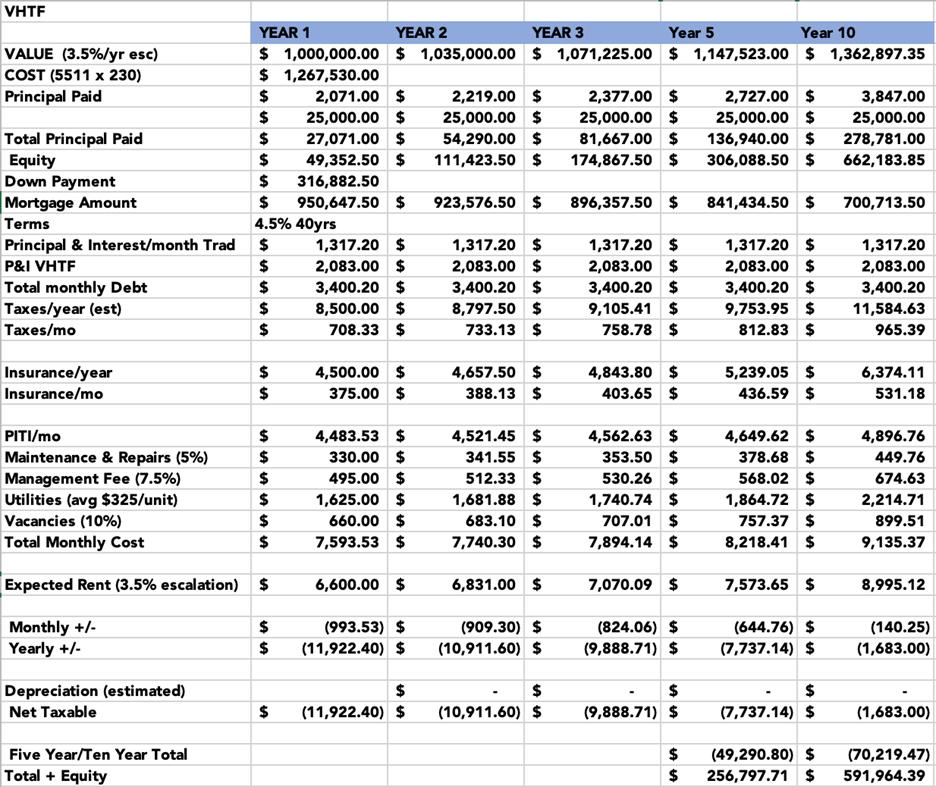
Virginia Housing Trust Fund:
The final scenario tested was to utilize a Virginia Housing Trust Fund (VHTF) award for the maximum $750,000 in order to provide a 0% interest loan to be matched with a market rate loan of $200,000 at 6.9%. This project should be eligible for VHTF funding because it meets the minimum of 5 units and is already set up to provide housing for households at 80% of AMI, which are the two most basic requirements. VHTF is run through Virginia Department of Housing and Community Development (DHCD).
In this scenario, the Year 1 monthly deficit is $993.53 for an annual loss of $11,922.40. These amounts reduce slowly each year, resulting in an annual loss of $1,683 in Year 10. However, since so much of the payments are going toward paying down the balance of the loan, by the end of the 10-year projection period, there should be well over $600,000 of equity in the project. As with the previous scenario, exempting the providing local property tax relief and/or managing the property in-house would create an immediately profitable situation. Additionally, finding a way to reduce the rate on $200,000 in market rate financing would help to reduce losses.
Summary and Recommendations:
While the Covington housing market looks to have the ability to easily absorb this development and there is likely to be high demand for the residences, the financing picture is difficult. This may be the reason that there have not been many new construction housing projects over the past few decades. However, Virginia, through Virginia Housing and DHCD, has several products that may be available to bring this development to fruition. First among these is the Virginia Housing Trust Fund. This program allocates more than $4 million each year to rental housing projects of 5 or more units that serve Lowto-Moderate Income (LMI) households earning no more than 80% of AMI ($58,640 as of March 2025). The rents for this program are capped at $1,320, including necessary utilities (heat, electricity, water & sewer). This project, as designed, meets these requirements and the rents match the rates that the demand study shows as appropriate for the units.
The VHTF program looks to be the best opportunity for financing the project, but still does not fully fill the gaps in financing. The project will still need ~ $400,000 - $500,000 in additional financing, including a down payment. All the pro formas were run using a 25% down payment that ranged from $290,000 -$320,000 depending on the overall cost of construction. Some of this amount could be financed through a local or regional Housing Revolving Loan Fund with reduced rates and beneficial terms, such as interest only for the first few years. LOCUS, a CDFI serving Virginia stated that they have worked with foundations in Virginia to establish revolving loan funds with a blended market rate (from LOCUS capital) and reduced rate (from foundation funds). Additionally, a Housing Revolving Loan Fund may be eligible for capitalization through Virginia Housing’s Innovation Grant, USDA RD programs, and CDBG.
*Note: It is not recommended to scale back the scope of the project or introduce phasing the project, as any savings would likely be lost by becoming ineligible for the VHTF.
The primary recommendation is to pursue this project with VHTF financing and alternative financing and funding sources to close the “last mile” gap of $400,000 - $500,000.:
• Arrange a Round Table meeting with Virginia Housing, DHCD, and the Alleghany Foundation to discuss this report and investigate the VHTF and other funding and financing sources, including discussion of a Regional Housing Revolving Loan Fund.
• Discuss opportunities for adapting this project for manufactured housing. Ask Virginia Housing for examples of similar projects using manufactured housing and their contacts.
• Pursue a Pre-development Loan from Virginia Housing to create construction documents, including ways to ensure the properties are highly efficient and ways to decrease costs.
• Contact LOCUS to discuss construction financing and permanent financing of the amount above the VHTF $750,000 cap.
• Consider removing the parcel from the City’s Tax Rolls or providing an annual grant to Hope in the amount of the taxes paid on the parcel.
• Consider the organization’s ability to manage the property in-house.
• Consider having the City complete the site work with City staff and equipment.
RATE: $210/SF