Brisbane Office Suite A Level 10, 300 Queen St, Brisbane QLD 4000 Australia
Postal Address PO Box 133, Brisbane Qld 4001 Australia
P 07 3331 3314
E sra@sugarresearch.com.au
W sugarresearch.com.au
ABN 16 163 670 068 | ISSN 2203--7705
Acknowledgement of Country
In the spirit of reconciliation, SRA acknowledges the Traditional Owners of Country and their unique cultural and spiritual relationships to the land, waters and seas and their rich contribution to society. We pay our respects to Elders past, present and emerging, and extend that respect to all Aboriginal and Torres Strait Islander peoples today.
Acknowledgements
SRA acknowledges and thanks its investors, including levy payers (sugarcane growers and millers), the Commonwealth Government and the Queensland Government.
Numbers in charts and tables included in this plan may be affected by rounding.
Sugar Research Australia (SRA) is Australia’s specialist sugarcane research organisation, under the Sugar Research and Development Services Act 2013 (Cth). We invest in evidence-based research, development and adoption (RD&A) activities on behalf of sugarcane growers and millers to meet industry challenges and opportunities.
OUR VISION
To be a trusted partner, shaping the future prosperity of the Australian sugarcane industry and regional communities through innovation and ingenuity.
OUR PURPOSE
We keep the Australian sugarcane industry competitive, productive and sustainable through innovative research and product development.
SUGARCANE REGIONS, AUSTRALIA
Sugar growing areas
SRA stations & facilities
Mossman
Cairns
Innisfail
Tully
Townsville
Meringa
Ingham
Brandon
Proserpine
Mackay
Rockhampton
Bundaberg
Gympie
Brisbane
Woodford
Broadwater
Ballina
Grafton
Harwood
Condong
Maryborough
Sarina
Childers
2023/2024 HIGHLIGHTS
in RD&A for the sugarcane industry million investment
2024-2034 released Ten-Year R&D Plan higher degree by research positions funded and delivery partners research investment
including SRA43 in Herbert, SRA44 in Southern, and SRA45 in NSW new varieties released
Genomic Code Cracked Cultivar R570
investigators delivering grant projects funded research
published from funded research research papers
of total production in 2023 harvest New SRA varieties = deployed to improve biosecurity
income from externally funded grant projects & services for industry Environmental DNA technologies
to 1 return on research
investments funded by SRA since 2015
JOINT MESSAGE FROM THE CHAIR AND INTERIM CEO
On behalf of the Board of Sugar Research Australia (SRA), we are pleased to present the Annual Report for 2023-2024.
The past year has been a period of significant change to achieve the growth, innovation, and resilience needed to advance our mission of supporting the Australian sugarcane industry through research, development, and adoption.
The strength of SRA lies in the dedication and expertise of our team, the collaboration with industry partners, and the support of all levy payers and members. Together, we have navigated challenges and seized opportunities to drive forward the productivity, profitability, and sustainability of our industry.
This year, SRA has made significant strides in several key areas:
• Research and Innovation: Our research portfolio continues to deliver tangible benefits to the industry, with projects focused on enhancing productivity, improving disease resistance, and developing sustainable practices. The quantum of research is increasing with the SRA Board’s decision to create the 10 th Anniversary Research Fund and to overhaul the way that we deliver research by incorporating all activities into one portfolio.
• Collaboration and Partnerships: Strong partnerships with industry stakeholders, research institutions, and government bodies have been central to our success. These collaborations have enabled us to leverage additional resources, share knowledge, and ensure that our research is aligned with industry needs.
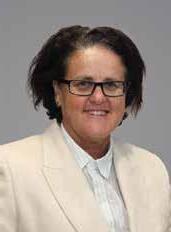
Rowena McNally Chair, Sugar Research Australia
• Sustainability Initiatives: As the global focus on sustainability intensifies, SRA has been proactive in driving initiatives that reduce the environmental impact of sugarcane production. Our efforts in this area together with agencies such as the Great Barrier Reef Foundation and Department of Agriculture and Fisheries are positioning the Australian sugarcane industry as a leader in sustainable agriculture.
• Member Engagement: We have continued to prioritise engagement with our members and other key stakeholders to ensure that our research priorities and strategic direction aligns with industry priorities.
• Service Focus: SRA’s business units have been realigned to better support SRA’s focus on regional service delivery, with significant investment in necessary capital works programs to secure future research and trial work.
The Independent Performance Review has confirmed the benefit of the work that has been undertaken by SRA in the past 12 months. This work has put us in a good position to deliver on SRA’s strategic plan.
On behalf of SRA, we thank all our stakeholders for their continuing support of SRA. We particularly thank SRA’s staff for their work, support and continued focus on excellence and service during the past twelve months.
Shaun Coffey Interim CEO, Sugar Research Australia
ABOUT SUGAR RESEARCH AUSTRALIA
Sugar Research Australia (SRA) is the specialist research organisation for the Australian sugarcane industry, established in 2013 as a company owned by sugar growers and millers.
SRA also serves as the declared Industry Services Body for the Australian sugarcane industry under the Sugar Research and Development Services Act 2013 (Cth).
SRA was formed through the merger of two previous entities, the Sugar Research and Development Corporation (SRDC) and the Bureau of Sugar Experiment Stations (BSES), both of which made significant contributions to the Australian sugar industry. By combining their experience, expertise, resources, and knowledge, SRA was created to drive innovation and sustainability in the industry.
Unique to the rural research and development corporation (RDC) landscape, SRA operates an extensive network of research farms, laboratories, and offices throughout the industry’s regions. This widespread presence ensures that SRA staff, as well as research and extension efforts are accessible to all growers and millers.
The primary source of funding for SRA’s activities is the statutory sugarcane levy, which is paid by growers and millers to support research and development activities. SRA also receives matching funding and grants for eligible research and development activities from Commonwealth and Queensland government departments and agencies including the Federal Department of Agriculture and Fisheries and Forestry (DAFF).
The strategic direction and governance of SRA are overseen by a skills-based board. The Board is selected by an Independent Director Selection Committee, endorsed by Members at an Annual General Meeting, ensuring a high level of expertise and accountability in guiding the organisation.
KEY RESPONSIBILITIES
SRA’s key responsibilities are to:
• Deliver cost-effective research and development services to the Australian sugarcane industry to enhance its viability, competitiveness, and sustainability
• Carry out, coordinate, and provide investment for R&D activities in relation to the Australian sugarcane industry
• Facilitate the dissemination, extension, adoption, and commercialisation of results of R&D activities.
KEY CAPABILITIES
With a Full-Time Equivalent (FTE) of 132.7 employees across eight research stations and six farms, SRA is uniquely positioned with extensive in-house research and adoption capability across critical research disciplines, including sugarcane variety development, agronomy, entomology, pathology, soil, weed and environmental science.
SRA has an impressive track record of collaboration and an extensive network of international and national partners. SRA draws upon the combined capability of these partners to deliver high quality R&D to the industry and transfer scientific breakthroughs which happen in other sectors, seamlessly into the Australian sugarcane industry.
As at 30 June 2024, SRA had:
10.3 - 1 205
11 return on research investments funded by SRA since 2014-15 funded research investigators delivering grant projects
66
research investment and delivery partners higher degree by research positions funded
CORPORATE GOVERNANCE FRAMEWORK
The Board of Directors is responsible for the direction, policies, strategies and financial objectives of SRA.
SRA’s Board operates in accordance with its charter and has reserved certain powers for itself.
Four Standing Committees assist the Board with effectively discharging its responsibilities, including:
• Audit and Risk Committee
• People, Performance & Remuneration Committee
• Research Funding Panel
• Director Selection Committee.
Day-to-day management of SRA, and the implementation of approved business plans and corporate strategies, have been delegated to the CEO, who in turn may further delegate to the Executive Team.
Stakeholders
LEADERSHIP BOARD OF DIRECTORS
The Board of Directors is responsible for the overall governance and strategic direction of the organisation.
The skills-based Board of Directors in place following SRA's Annual General Meeting in 2023, included the following NonExecutive Directors:
Rowena McNally
LLB, FAICD, FIML, FR I
Independent | Non-Executive Chair
Director and Chair since 21 October 2021
Member of the Audit and Risk Committee (since 14 December 2021), the People, Performance and Remuneration Committee (since 14 December 2021), and the Research Funding Panel (since 14 December 2022)
Rowena has more than 20 years’ experience as a Board Chair and Board Director with extensive experience in regional Queensland. She has held various roles in the sugar industry including several years as the Sugar Industry Commissioner and Chair of the Sugar Authority and various roles with the then statutory marketing authority. Rowena has also held several chair and board roles in the water, energy and hospital and health sectors.
Rowena is the Chair of Mercy Community Services SEQ, Mercy Health and Aged Care CQ and Mercy Community Services Nth Qld, the Qld Energy & Water Ombudsman’s Advisory Council and Isa Rodeo Limited. She also serves on the Board of St John Henry Newman College.
Chris Bosworth
Independent | Non-Executive Director
Director since 16 November 2023
Member of the Audit and Risk Committee (since 14 December 2023)
As a sugarcane grower within the Herbert River district, Chris Bosworth brings more than 45 years’ experience and commitment to the sugarcane industry.
Chris has held various board positions across the industry, representing growers locally and more broadly.
As a current Director of Queensland Cane Growers Organisation Ltd (QCGO) and Chair and Director of Cane Growers Herbert River District, Chris is committed to supporting SRA’s role as the industry’s peak research body.
LEADERSHIP (CONTINUED)
Donna Campagnolo BSc
Independent | Non-Executive Director
Director since 16 November 2023
Member of the People, Performance and Remuneration Committee (since 14 December 2023)
Donna Campagnolo is a third-generation sugarcane farmer and holds a Bachelor of Science degree from the University of Queensland. She has an extensive background in research, development, and extension, in addition to biosecurity, within the sugar industry and the public sector.
Donna’s experience has allowed her to develop a deep, practical understanding of legislative processes and procedures, particularly concerning potential risks to Australia's biosecurity.
Significant roles on various industry and sporting committees provide Donna with a unique set of skills to drive the strategic direction of Sugar Research Australia.
Shaun Coffey
BAgrSc(Hons),
MAgrSc, FTSE. FAIA, FAICD, CRSNZ
Independent | Non-Executive Director and Interim Chief Executive Officer
Director from 21 November 2022 to 9 July 2023
Interim Chief Executive Officer since 10 July 2023
Member of the Audit and Risk Committee (since 30 May 2023), the People, Performance and Remuneration Committee (since 14 December 2022), and the Research Funding Panel (since 21 November 2022). Shaun ceased to be a member of any committee upon his resignation as a director of SRA.
Shaun is an internationally acknowledged leader in science and innovation.
His interests in the sugar industry stem from the 1990s, when he was a Regional Director, then Director of Research and Extension, at the Queensland Department of Primary Industries.
An agronomist by training, Shaun has developed broad interests across science and technology through key leadership roles, such as Foundation Chief of the CSIRO Division of Livestock Industries (2002-2006) and as CEO of the NZ Crown entity, Industrial Research Ltd (2007-2013).
Shaun serves on the Board of the Future Fuels Cooperative Research Centre, as Chair of the Agriculture and Food Forum of the Australian Academy of Technological Sciences and Engineering, and as Director of Capacity Building in the Crawford Fund for a Food Secure World.
Mark Day
BAppSC (Mathematics)
Independent | Non-Executive Director
Director since 21 October 2021 to 29 February 2024
Member of the Audit and Risk Committee (3 November 2021 to 14 December 2023) and People, Performance and Remuneration Committee (24 August 2023 to 14 December 2023)
Mark was appointed to the Board of Mackay Sugar Limited (MSL) in May 2017 and was Chair of MSL from November 2017 until August 2019. Mark also acted as Chief Executive Officer of MSL from January 2018 until April 2020.
Mark completed three and a half years in Brazil as Operations Director for eight sugar cane factories.
Prior to that, Mark had an extensive career with CSR/ Wilmar in sugar, managing CSR’s cane sugar businesses as Executive General Manager for six years and two years in Indonesia with Wilmar.
Mark has served as a Director on the Board of Sugar Terminals Limited, the Bureau of Sugar Experiment Stations, Sugar Research Institute and Australian Molasses Trading, and was also a Director and Chair of the Australian Sugar Milling Council for a period.
Rosemary Richards
BAgEc, MBA, GAICD FAICD, CRSNZ
Independent | Non-Executive Director
Director since 21 November 2022
Member of the Audit and Risk Committee (since 30 May 2023), the People, Performance and Remuneration Committe e (since 14 December 2022), and an Observer of the Research Funding Panel (since 14 December 2022)
Rosemary has more than 20 years’ experience in the food and agribusiness sectors, including considerable executive and board experience.
She has held various roles in broadacre cropping including board roles in the grains, cotton and the research and development sectors.
She is a passionate communicator and industry advocate. Her experience in project management, trade policy and strategy development extends across all facets of the agricultural and food sectors.
Rosemary has extensive experience in the biotechnology sector, including regulatory frameworks, commercialisation, and advocacy.
Rosemary is the Chair of the Australian Oilseeds Federation and Chair of Sustainable Grain Australia. She is also a member of the Grains Market Access Council.
LEADERSHIP (CONTINUED)
Peter Russo
LLB, FAICD, FIML, FR I
Independent | Non-Executive Director
Director since 25 October 2018 to 16 November 2023
Member of the Audit and Risk Committee (14 December 2021 to 16 November 2023) and People, Performance and Remuneration Committee (to 14 December 2021)
Peter has more than 40 years of experience in sugarcane growing and milling.
Working in a farming partnership with his two sons in the Childers region, he is knowledgeable in all aspects of sugarcane farming and is particularly passionate about the adoption of innovative practices ranging from irrigation to land management to harvesting.
Peter was Chairman of the Board of the Isis Central Sugar Mill and served on the Board from 1990 to 2020. He has served on various committees while on the Isis Central Sugar Mill Board and has also previously been a Board member of St Luke’s Anglican School, Bundaberg.
Chair of the Audit and Risk Committee (since 30 May 2023)
Member of the Audit and Risk Committee (since 14 December 2022)
Gavin is an experienced property, agribusiness and food sector executive and non-executive director.
He has an extensive background across the broader food and agribusiness supply chain, having held executive roles in the agricultural property, grain, beef, cotton and chicken meat industries.
His roles have extended from research and development, corporate advisory and capital-raising work through the production, processing and distribution sectors.
Rowley Winten
BAgSc, Grad Dip Business Studies, MAICD
Independent | Non-Executive Director
Director since 21 October 2021
Chair of the People, Performance and Remuneration Committee (since 14 December 2022)
Member of the People, Performance and Remuneration Committee (since 14 December 2021)
Rowley is an international marketing professional with an agronomy background having worked in Australia, Asia Pacific and Europe with more than 40 years’ experience in agriculture across a diverse range of broadacre and intensive farming systems. He has held senior roles in R&D and strategic marketing for a number of leading multinational crop protection companies during this time.
Rowley has broad experience in marketing strategy, brand portfolio management, product development, business transformation and change management.
Rowley’s current focus is on developing innovation to drive productivity improvement across cropping systems in Asia, Middle East, Africa and Russia - Kazbec countries to benefit farmers and their communities.
Rowley has represented industry on a number of national committees.
Rowley is a current director of Winagri Pty Ltd and the AMEA Head of Product Biology for Syngenta Crop Protection.
The following persons were Directors of the Company during the 2023-2024 financial year:
• Rowena McNally – Independent NonExecutive Chair
• Chris Bosworth – Independent NonExecutive Director
• Donna Campagnolo – Independent NonExecutive Director
• Shaun Coffey – Independent NonExecutive Director (retired effective 9 July 2023) and interim Chief Executive Officer (appointed effective 10 July 2023)
• Mark Day – Independent Non-Executive Director (retired effective 29 February 2024)
• Rosemary Richards – Independent NonExecutive Director
• Peter Russo – Independent Non-Executive Director (retired effective 16 November 2023)
• Gavin Whiteley – Independent NonExecutive Director
• Rowley Winten – Independent NonExecutive Director
BOARD COMPOSITION
The six-member Board is committed to ensuring that it comprises individuals with an appropriate range of skills, experience, expertise and diversity to deal with current and emerging issues with regard to the sugarcane industry.
CORPORATE GOVERNANCE STATEMENT
Our corporate governance framework and practices have complied with the ASX Corporate Governance Council’s Corporate Governance Principles and Recommendations (4th Edition) (ASX Recommendations) throughout the 2023/24 financial year.
SRA’s 2024 Corporate Governance Statement provides detailed information on our corporate governance practices for the year ended 30 June 2024.
The Corporate Governance Statement is available at: www.sugarresearch.com.au/about/ corporategovernance
POLICIES AND PRACTICES
As part of our commitment to operating to the highest standards of ethical behaviour, we have a range of policies and practices that set ethical standards for directors, employees, contractors and third parties. These policies describe core principles designed to ensure ethical conduct is maintained in the interests of members and other stakeholders.
The SRA Code of Conduct is our code for business conduct – it contains principles and standards of conduct which are based on SRA’s values and represents our commitment to uphold ethical business practices and meet applicable legal requirements. The Code of Conduct applies to all directors and officers of the Company.
The Code of Conduct is supported by several governance policies that guide how SRA conducts its business and outlines expected standards of behaviour. These include but are not limited to:
• Board Governance Policy
• Declaration of Interests
• Diversity Policy
• People & Culture Policy
• Compliance Policy
• Risk Management Policy and Risk Management Plan
• Fraud Control Policy and Plan
• Health and Safety Policy
• Whistleblower Policy.
SRA’s policies were reviewed throughout the year and have been updated as required to ensure they reflect industry standards, transparency and accuracy.
STRATEGIC PLAN UPDATED
In 2021, SRA launched a new Strategic Plan (20212026), after significant engagement with key industry stakeholders to ensure we continued to evolve to meet the needs and priorities of growers and millers and the sugarcane industry more broadly.
The plan had a transformational focus, providing a vision for progressing and evolving SRA to stay relevant, innovative, commercial, and sustainable.
In February 2023, the SRA Board reviewed the first year of the plan’s implementation to ensure it continues to guide those responsible for planning, delivering, and translating research and services to benefit our levy payers and the communities that the sugarcane industry supports.
Purpose:
The Strategic Plan 2021-2026 Update completed in 2023, narrowed our focus to provide a strategic roadmap, that comprehensively addresses the opportunities and challenges that lie ahead for our industry and regional communities.
Using the updated SRA Strategic Plan 2021-2026, we will continue to progress forward through constant improvement and a visionary mindset, to ensure we continue to meet the needs and priorities of growers and millers, and the sugarcane industry more broadly, now and into the future.
VISION
Delivering Industry Benefit
TEN-YEAR R&D PLAN
In June 2024, SRA released its Ten-Year Research and Development (R&D) Plan 2024-2034 to chart our course for investment in research, aimed at addressing key issues and critical challenges faced by Australian sugarcane growers and millers.
The purpose of the R&D Plan is clear: to bolster the industry’s competitiveness, productiveness and sustainability through innovative R&D while benefiting the regional communities within which the industry is located.
The Plan aims to steer investment in research on behalf of the Australian sugarcane growers and millers and the Australian government to improve the profitability and sustainability of the industry using an integrated approach across five R&D programs including:
VARIETIES
Create the potential
• Step-change in plant breeding
• New varieties with improved production and processing performance
• Correct variety adoption decisions.
AGRONOMY & FARMING SYSTEMS
Achieve the potential
• Optimise agronomic inputs
• Improve sugarcane soil condition
• Integrate data, technology, and innovation
• Sustainable production.
CROP PROTECTION
Safeguard the potential
• Sustainable management of pests
• Sustainable management of weeds
• Sustainable management of pathogens
• Biosecurity preparedness
• Data and emerging technology.
MILLING & PROCESSING
Deliver the potential
• Optimise operations
• Highly skilled and professional workforce
• Opportunities for diversified income.
ADOPTION
Reach the potential
• The right information
• Regional approaches
• Industry transformation.
OUR FUTURE DIRECTION
SUGAR PLUS: FUELLING THE FUTURE OF FOOD, ENERGY AND FABRICATION
The industry-led Sugar Plus vision details a roadmap to strengthen and build the Australian sugarcane industry, whilst charting a path to a bigger, bolder future for the businesses and communities at the heart of the industry’s future. While some parts of the roadmap are focused on better business-as-usual and adding value to current operations across the value chain, other parts are about the steps required to unlock the vast opportunities presented by the bioeconomy.
ANNUAL OPERATING PLAN
The Annual Operating Plan (AOP) 2023-24 details investment in Research, Development and Adoption (RD&A) activities and outputs, aligning with SRA’s Strategic and Ten-Year R&D Plans, to be managed by SRA over the coming year. It includes all core and contestable funded activities such as grant projects, programs and services, and district productivity plan activities, specifying the delivery provider and aggregate expenditure.
SRA has a balanced and collaborative research portfolio of investments that deliver tangible solutions and options to advance the productivity, sustainability, profitability, and long-term growth prospects for the Australian sugarcane industry. By aligning research investment with the five R&D Programs described opposite - as opposed to Research Missions as in previous AOPs - SRA will embark on a new method of reporting by R&D program, offering consistency with the Ten-Year Plan.
STAKEHOLDER ENGAGEMENT IS AT THE HEART OF THE AOP
SRA’s Stakeholder Engagement Plan was designed to enhance and guide stakeholder interactions to support our vision, purpose and strategy.
This comprehensive plan outlined the structured and integrated approach for SRA’s effective communication and engagement with stakeholders, and demonstrated SRA’s alignment with organisational goals and activities.
The Plan served as a roadmap for SRA’s communication and engagement efforts, ensuring consistency, coherence, and accountability. In line with performance expectations under our Department of Agriculture, Fisheries and Forestry (DAFF) Statutory Funding Agreement, we developed engagement plans for strategy prioritisation and development processes to ensure industry stakeholder input was captured and considered in decisions about SRA’s direction and investments.
ANNUAL OPERATING PLAN TIMELINE
Draft Plan: Preparation of the Draft R&D Plan by SRA for industry discussion and feedback.
SRA is committed to listening and responding to the RD&A priorities identified by industry and government stakeholders to deliver impacts for the industry, and benefits for the broader Australian community. For example, in shaping the Stakeholder Engagement Plan, we gathered feedback about priorities through SRA’s R&D Showcase and Feedback session held in March 2024 with representatives from industry peak bodies (millers and growers), industry service providers, and Australian and Queensland government stakeholders.
Feedback was also received from industry stakeholders and research partners via written submissions. The feedback was incorporated into SRA’s Ten-Year R&D Plan 2024-2034 and informed funding priorities for SRA’s 10th Anniversary Research Fund and procurement of existing and new RD&A activities.
Synthesis and plan review: Incorporation of industry feedback into the R&D Plan.
Develop Annual Operating Plan: Incorporation of industry and government feedback into 10th Anniversary Research Fund and procurement of new RD&A activities.
R&D Showcase and Feedback Session:
An industry forum where growers, millers, levy payers (growers and millers), industry and government stakeholders gathered to provide insights and input.
Plan endorsed: By the SRA Board.
Plan reviewed: By the SRA Research Funding Panel and recommendation to the SRA Board.
Final Plan: Publish on SRA website and advise industry and stakeholders.
OUR INVESTMENT PROCUREMENT PROCESS
CONTESTABLE RD&A ACTIVITIES
A call for expressions of interest in SRA's 10th Anniversary Research Fund was launched was launched in November 2023 to commemorate the organisation’s anniversary and to procure contestable RD&A investments to commence in 2024-25.
With a budget of $16 million, the fund provides additional investment over three to four years to drive innovative research and development in the sugarcane industry, foster greater collaboration across the research ecosystem, and enhance engagement with and delivery to the industry.
The anniversary call aligns with objectives outlined in our Strategic and R&D Plan and addresses research priorities identified by industry and government stakeholders during SRA’s R&D Showcase and Feedback session held in March 2024.
Procurement for the anniversary call involved a two-stage process. First, providers were asked to submit a concept that detailed an opportunity statement, the proposed innovation, and resources required. Concepts were assessed by SRA and external research specialists and our co-investment partner, the Queensland Government’s Department of Agriculture and Fisheries (DAF), before recommendations were made by SRA’s Research Funding Panel (RFP) to the Board for review and approval.
In stage two, providers who submitted selected concepts were invited to complete a Full Research Proposal including detailed information about the proposed RD&A activity. Providers were required to demonstrate in their proposal alignment between the proposed activity and the priorities outlined in the R&D Plan which included those identified by industry and government stakeholders.
Publish AOP: Distribute to Industry and government stakeholders and research partners.
JULY 2024
Providers were also required to demonstrate that their proposal would make a significant contribution to addressing pressing industry challenges; present a highquality approach with a multi-disciplinary team; have access to resources and technologies; and have a credible pathway to adoption to benefit growers and millers and the industry broadly.
In addition to the 10th Anniversary Research Fund, SRA will continue to invest in existing and new contestable RD&A activities such as Postgraduate Research Scholarships, Small Milling Research Projects, Research Awards, and cross-sectoral programs with other RDCs.
CORE RD&A ACTIVITIES
SRA’s Board approved continued funding in 2023-24 of core RD&A activities identified as a priority by industry and government stakeholders. These include:
• Plant breeding and biosecurity programs to produce new varieties for the industry
• Diagnostic services for growers to screen plant material and soil for diseases, pests and pathogens
• Near-infra red (NIR) service for milling companies to automate cane payment
• Chemistry laboratory to provide compositional analyses of soil, plant tissue, water, mill products, and other samples, supporting SRA grant projects and programs, and some external clients
• District productivity plans including local events and activities to address productivity constraints. In addition, SRA’s core research team continued to deliver grant projects funded by external providers.
Synthesis and plan review: Incorporation of industry and government feedback into the R&D Plan.
Publish updated AOP: Including new contracted RD&A activities following the conclusion of SRA’s 10th Anniversary Research Fund.
OCTOBER 2024
STRATEGIC PILLARS
Pillar 1: A high-performing research portfolio
Pillar 2:
Translation expertise
Pillar 3:
World-class sugarcane varieties
Pillar 4:
Commercial benefits and rewards
PILLAR 1 A HIGH-PERFORMING RESEARCH PORTFOLIO
OBJECTIVE:
Design and deliver a focused, balanced and collaborative portfolio of Research, Development & Adoption (RD&A) investments and initiatives that deliver tangible solutions and options to advance the productivity, sustainability, profitability and long-term growth prospects for the Australian sugarcane industry.
Deliver higher returns Achievement of success criteria for research missions
Delivery performance (time, cost, and quality)
Make more informed research investments across:
• Advanced crop protection
• Sustainable farming and milling practices and supply chain optimisation
• Future uses for sugarcane
Stakeholder/ investor satisfaction with research portfolio balance measured by survey results
Return on investment (ROI) of RD&A spend
In 2023/24, there were 10 measures that recorded improvements from previous results.
Progress on this measure will be reported in future annual reports.
Following the 2023/24 Independent Performance Review, annual surveys were moved from June to October.
Performance increase
Not measured during period
Not measured during period
Make bolder investments % portfolio involving collaboration (excluding investments in plant breeding)
Involve industry Industry satisfaction and awareness (survey measures)
In 2023/24, evaluations of five SRA and Queensland Government’s Department of Agriculture and Fisheries (DAF) co-funded projects showed a return on investment for SRA of 3 to 1, down from 72.8 to 1 the previous year, though the historical average remains high at 10.3 to 1.
About 37% of the research portfolio, excluding breeding, had investment from other partners, similar to the previous year.
Annual surveys were rescheduled from June to October. Feedback from SRA-led events indicates that about 87% of levy payers and industry stakeholders report overall satisfaction with SRA during 2023/24.
Performance decrease
No change in performance
Not measured during period
PILLAR 2 TRANSLATION CAPABILITY
OBJECTIVE:
Translate research findings into tools, products and services that save industry time and money, and improve environmental performance.
KEY FOCUS AREAS MEASURE
Continue to refresh SRA’s service delivery model
Overall satisfaction with SRA by levy payers
Levy payer satisfaction with district support
DETAILS
Lower service costs and lower production costs for SRA screening and testing services
Make it easier and costeffective for industry to adopt research
Number of extension and adoption packages delivered to industry
Grower preparedness for biosecurity threats, levy payer take-up of online resources and self service options
RATING
Annual surveys were rescheduled from June to October. Feedback from SRA-led events indicates that about 86% of levy payers report overall satisfaction with SRA during 2023/24. Not measured during period
Annual surveys were rescheduled from June to October, when satisfaction with district support will be measured. In 2022/23, 74% of levy payers reported being satisfied with SRA’s District Managers and Translational Researchers.
Since 2021/22, the cost to deliver SRA’s Near-infra Red (NIR) spectroscopy and disease screening and analytical chemistry services has decreased by 17% to $1.1M in 2023/24.
There were 18 packages delivered to growers, millers and other stakeholders during 2023/24, a slight increase from 17 the previous year.
In 2023/24, there were 307 users, an increase of 86% from the previous year, using the Online Sugarcane Nutrient Management program to support decision making about nutrient application. Additionally, growers and harvesting contractors responsible for approximately 4% of the crop adopted Harvest Mate during the 2023 season, demonstrating moderate uptake of the tool in the first year of its release.
Not measured during period
Performance increase
Performance increase
Performance increase
KEY FOCUS AREAS MEASURE
Build a deeper understanding of industry
Improve adoption of clean seed
District productivity growth – measured as tonnes of cane per hectare (TCH) and tonnes sugar per hectare (TSH)
Participation in district planning process
DETAILS
Since the start of the strategic plan period in 2021, average TCH across all districts has decreased by 0.2% to 87.7 in 2023. Conversely, average TSH has increased by 0.8% to 12.9 over the same period.
Building on the previous year, SRA’s District Managers continued extensive consultations with growers, millers, and industry stakeholders on local RD&A priorities for the 2024 plans. Each district plan, available on our website, includes an overview of engaged stakeholders and their priorities.
RATING
Performance decrease
New varieties as a % total commercial production
Production from new varieties increased to 10% of total production in the 2023 season from 6.4% in the previous year.
Not measured during period
Performance increase
PILLAR 3 WORLD-CLASS SUGARCANE VARIETIES
OBJECTIVE:
Accelerate innovation in variety development to offer innovative, high-performing varieties that consistently underpin the success of the industry’s crop production and protection while lowering development costs and shortening cycle-times.
KEY FOCUS AREAS
Achieve operational excellence and sustainable improvement in the variety development programs
Leverage advances in science and technology including monitoring game-changing breeding technologies
New varieties as a % total commercial production
Genetic gain 2% per annum
Number and value of elite clones in aggregate and per regional breeding program
Proportion of Final Assessment Trial (FAT) clones resistant to Pachymetra and smut
Production from new varieties increased to 10% of total production in the 2023 season from 6.4% in the previous year.
Long term genetic gain has increased from 0.04% in 2017 to 1.27% in 2023.
Number of elite clones with higher industry profitability than the commercial benchmark has increased from 35 clones in 2014 to 286 clones in 2023.
The proportion of FAT clones resistant to Pachymetra reduced from 68% to 52% in 2022 from the previous year. Conversely, the proportion of clones resistant to smut increased from 54% to 55%.
Despite these results, historically, the frequency of resistance to Pachymetra and smut has increased significantly from 36% and 44% respectively, since 2013.
Performance increase
Performance increase
Performance increase
Performance decrease
KEY FOCUS AREAS MEASURE
Build innovation into the supply and distribution channels
Grower satisfaction with quality of varieties, distribution mechanisms and information support
DETAILS
Annual surveys were rescheduled from June to October, when satisfaction with the quality and distribution of varieties will be measured. In 2022/23, 55% of growers were satisfied with the quality of new varieties and 79% were satisfied with their distribution.
RATING
Not measured during period
Leverage Plant Breeder's Rights (PBR) and plan for future uses of high-fibre cane varieties
Revenue derived from variety development (alternate revenue opportunities) - $ per annum
Progress on this measure will be reported in future annual reports. Not measured during period
PILLAR 4 GROWING RESEARCH AND DELIVERY CAPACITY
OBJECTIVE:
Take our research work and investments to the next level by securing investors and funding and extracting commercial value from our intellectual property, research capacity, facilities and strategic partnerships.
KEY FOCUS AREAS MEASURE
Deliver value from our research expertise, intellectual property, facilities and delivery services
Industry adoption and estimation of impact
Create new products and service opportunities from research discoveries
Form research and delivery partnerships and ventures
Expand into new domestic and international markets
Increased number of innovations and technology available to industry
Positive change in research leverage
DETAILS
Adoption of new varieties increased in 2023/24 rising to 10% of total production in the 2023 season from 6.4% in the previous year. Additionally, growers and harvesting contractors responsible for around 4% of the crop adopted Harvest Mate during the 2023 season, demonstrating moderate uptake of the tool in the first year of its release. The impact of these technologies will be reported on in the future.
Three products funded by SRA and DAF were released in 2023/24 including genomic selection software and methods, the Harvest Mate app, and environmental DNA sampling procedures.
In 2023/24, SRA delivered 15 research projects and activities funded by external partners, generating $3.8M in additional revenue over the period.
RATING
Performance increase
Performance increase
Performance increase
Achievement of specific targets
Progress on this measure will be reported in future annual reports.
Not measured during period
RESEARCH MISSIONS
Research Mission 1: Profitable and Productive
Research Mission 2: Resilient and Enduring
Research Mission 3: Diversified and Adaptable
Research Mission 4: Sustainable and Efficient
Research Mission 5: Resourced and Skilled
1
RESEARCH MISSION 1 PROFITABLE AND PRODUCTIVE
Aim:
Continuous improvement in farming and milling profitability.
Investment 2023/24: $14M
Objective:
Increase ongoing competitiveness of the Australian sugarcane industry by supporting year-on-year improvements to productivity in aggregate at a regional level.
Grant Projects
Validate genomic selection in plant breeding program to accelerate improvements in yield, commercial cane sugar, and other key traits, led by the University of Queensland (UQ) (2017002)1
Develop a harvesting decision-support tool, Harvest Mate, to maximise cane recovery, led by SRA (2020003). 2
Develop a machine learning system to measure the extraneous matter mass and billet length of cane consignments that enter mills, led by Queensland University of Technology (QUT) (2022012). 2
Small Milling Research Project (SMRP): Assess the feasibility of mill waste streams for supplemental income, led by Isis Central Sugar Mill (2022201).
Develop training modules for milling personnel as part of phase three of the Australian Sugar Industry Training Program, led by QUT (Project: 2022014).
Commercial assessment of CEEDS technology to determine the potential role for synthetic seed, led by SRA (2023001).
SMRP: Benchmark bagasse fly ash system performance, led by Wilmar Sugar Australia (2023201).
SMRP: Evaluate the suitability of measuring massecuite dry substance for control on Australian pan stages, led by Mackay Sugar (2023202).
SMRP: Advance a prototype system measuring billet length using artificial intelligence and computer vision in the Condong Mill, operated by Sunshine Sugar, and integrating data across harvesting and milling platforms in near real-time, led by Griffith University (2023203).
Programs and services
The plant breeding program will produce new varieties to make the industry more productive, sustainable and competitive. Starting in the 2024 season with more than 248,000 yield and propagation plots in the field, 90,000 new potential varieties will be planted as families for the first stage of testing. They will join the 90,000 that will be harvested as plant crop. A further 90,000 are in first ratoon. Selected individuals will progress through the selection program with increased complexity and rigour of testing at each stage. Information from marker assisted selection, genomic selection (PLANDNA), fibre quality assessment (PLANSTH), sugar quality defect testing (PLANCEN), and CCS measurements (PLANSPE) will be consolidated with yield, adaptation and disease resistance data to inform promotion decisions. Around four candidates typically make it through to commercial release after 10-12 years of testing. The six Regional Variety Committees will meet in April/May 2025 to review performance data and make release decisions about the next group of new varieties.
A new online reporting tool will be made available to growers and industry advisors providing access to commercial variety performance information and results from SRA field trials (PLANQCS and PLANINT). This will supplement the Variety Guides, Fact Sheets and direct industry engagement.
On-farm engagement opportunities will increase through additional Regional Variety Trials, new grower strip trials, a smut resistance validation trial, and support for regional variety management groups.
SRA’s Near-infra Red (NIR) spectroscopy service provides milling companies with an automated Cane Analysis System (CAS) using SRA technology and a NIR instrument to measure brix, pol, fibre, CCS, and more, eliminating the need for manual analysis. SRA’s NIR research focuses on maintaining system performance, expanding technology applications, and delivering data to improve farming and milling practices (PLANCAS, NIRDMER).
District Productivity Plans
Deliver local events such as field days and training workshops, and activities to increase awareness and adoption of SRA-funded technologies, varieties, and management practices, and address districtlevel productivity constraints. Key activities include, but are not limited to, the following:
Far north
Activities to improve understanding of ripener efficacy, crop parameters, and management opportunities to maximise profitability (Project: DPF0004).
Support the development of a brix/ moisture/ maturity calibration for microNIR for an in-field rapid measurement tool for crop maturity (Project: DPF0006).
Work with Mulgrave growers to increase the proportion of cane harvested at optimum maturity, decrease extraneous matter in cane supply, and improve understanding of management practices influencing CCS (Projects: DPF0006 and DPF0007).
North
Produce CCS maturity curves for newly released varieties and accelerated clones in the Herbert and South Johnstone areas for optimum harvesting (Project: DPN0002).
Central
Improve adoption of new varieties by providing growers with additional information on variety performance. In addition, provide growers with an assessment of the suitability of crop ripeners on farm to improve early CCS (Projects: DPC0006; DPC0008).
Southern, Rocky Point and New South Walkes
Enable access to monitors, telemetry services and data analysis for New South Wales sugarcane growers to view harvesting performance (Project: DPS0003).
Contract an agricultural economist to undertake a local analysis of the scale and financial benefit of harvesting one-year-old cane versus two-year old cane in New South Wales (Project: DPS0003).
MEASURE
Increased throughput – tonnes of cane per hectare
Increased sugar per hectare
Rate of adoption of productivity-enhancing technology
DETAILS
The rolling five-year average for tonnes of cane per hectare (TCH) increased slightly by 0.5% to 89.1, despite a 11.5% decrease from the 2022 to 2023 season.
The rolling five-year average for tonnes of sugar per hectare (TSH) remains unchanged at 12.1 from the 2022 season.
The 2023 season recorded an increase in the number of hectares planted using approved clean seed, increasing by 11% to 2,339 hectares or 0.7% of total production, suggesting an increase in the uptake of best management practices. Additionally, growers and harvesting contractors responsible for approximately 4% of the crop adopted Harvest Mate, demonstrating moderate uptake of SRA-funded technologies.
RATING
Performance increase
No change in performance
Performance increase
Number and value of elite clones
Reduce development cycle-times for the variety program
The number of clones superior to Q208 has grown significantly, from 35 in 2014 to 286 in the 2022 trial series recorded in 2023-24. This includes a 32% increase from 2021 to 2022, demonstrating the potential of new varieties to drive productivity improvements greater than that achieved using Q208
Experimental clones fast-tracked using tissue culture technology were evaluated in field trials in 2023/24, and elite clones were identified for further field and disease testing. Genomic and marker-assisted selections were applied to seedlings from a high-valued cross generated in 2023/24 and selected individuals were planted directly into the first clonal stage. This will accelerate the time to release by four years.
Performance increase
Value of milling process innovation
In 2022/23, a benefit-cost analysis of SRA’s Near-infra Red (NIR) spectroscopy service and research estimated annual wage cost savings of $965,000 and productivity gains worth $2.6 million. In the evaluation period from 2013/14 to 2022-23, the service generated an estimated $45.6 million in economic value, with 60% benefiting millers and 40% benefiting growers.
Performance increase
Not measured during period
CASE STUDY GENOMIC SELECTION FOR SUGARCANE VARIETY DEVELOPMENT (2017002)
THE CHALLENGE:
Genomic selection is widely implemented as a powerful tool to improve efficiency in modern animal and plant breeding programs. The advanced method offers new opportunities for accurate prediction of non-phenotyped (i.e. non-observable characteristics or traits of an organism such as its genomic sequence or individual genes) in sugarcane. This could help breeders to accelerate the improvement of complex traits.
Breeding to develop more resistant varieties could be accelerated if genomic predictions (based on genome-wide markers) were available, enabling selection at the seedling stage.
Genomic selection enables early selection of clones for breeding, and if the genomic estimated breeding values (GEBV) are accurate enough, selection can use these values alone without the need to phenotype every selection candidate.
The objective of this project is to develop genomic selection software to produce genomic estimated breeding values (GEBV) to improve sugarcane selection and breeding efficiency within SRA's Breeding Program.
SOLUTION:
A reference population for genomic selection was established by genotyping 3,669 clones with the 40,000 array developed by SRA and the Commonwealth Scientific and Industrial Research Organisation (CSIRO). Notably, software was developed and implemented to produce genomic evaluations for breeding candidates within the evaluation pipeline utilised by the SRA breeding program. Additionally, a detailed computer simulation of the breeding program identified the most cost-effective implementation of genomic selection, suggesting a return on investment of $5 for every $1 spent on genotyping.
Genomic best linear unbiased prediction (GBLUP) was recommended by the project team for routine evaluations due to its compatibility with the evaluation pipeline used by the breeding program and low computational time compared with other methods. GEBV was also evaluated for its accuracy in estimating resistance to key sugarcane diseases including smut and Pachymetra.
The accuracies were 0.45 and 0.3 for smut and Pachymetra, respectively. These predictions can be readily implemented in breeding programs operated by SRA and Wilmar Sugar Australia, alongside other key estimates including Tonnes of Cane per Hectare (TCH), Commercial Cane Sugar (CCS), and fibre, to drive improvements in the quality of varieties available to the Australian industry.
Several other highlights were recorded by the project including evaluations of machine learning methods to predict sugarcane clone performance. Additionally, mate allocation strategies that leverage non-additive and heterozygosity effects were developed, thereby improving clonal performance for TCH, CCS, and fibre, and controlling inbreeding depression compared to random mating. Finally, continuous genotyping as a proxy for allele dosage was investigated with initial work suggesting increased prediction accuracy for CCS and fibre.
IMPACT:
The project developed and implemented genomic selection software and processes to improve yields in sugarcane. Genomic selection for TCH, CCS, and fibre has been adopted by breeding programs by SRA and Wilmar Sugar Australia and is expected to accelerate the development of new, more profitable varieties with greater disease resistance. Specifically, estimates suggest the impact of this research could be an increase in the rate of genetic gain from 1% to 2% valued at $12.5 million per
year in additional profit from yield improvement. It is important to note that the accuracy of these predictions cannot be validated until the selected clones have progressed to Final Assessment Trials in 10-12 years’ time. Estimates are based on simulations by the project team. Looking forward, new research is focused on reducing the costs associated with genomic selection. The expected outcome of this research will be improved efficiency in the selection process of sugarcane varieties.
RESEARCH MISSION 2
RESILIENT AND ENDURING
Aim:
Position the industry to stay ahead of climate, environmental and biosecurity threats
Investment 2023/24:
$4.8M
Objective:
Minimise and control risk to production from pests, diseases, weeds and climatic / environmental threats 3
Grant Projects
Obtain validation data sets to support the emergency registration of novel insecticides to control a moth borer incursion, led by SRA (2018010)3
Obtain validation data sets to support the emergency registration of novel insecticides to control canegrubs, led by SRA (2020004) 4
Establish proof of concept of novel biopesticide to control sugarcane root-feeding pests using RNAi technologies, led by UQ (202008) 4
Update the Sugarcane Industry Biosecurity Plan, led by Plant Health Australia (2022002).
Develop an artificial diet for soldier fly to accelerate the development of new control options, led by SRA (2022004)3
Develop resistance screening method for chlorotic streak, led by SRA (2022006).
Produce novel LAMP and NIR technologies to detect ratoon stunting disease at the mill, led by SRA and UQ (2022007 and 2022015).
Establish proof of concept of novel biopesticide to control sugarcane root-feeding pests using virus technologies, led by UQ (2022016)3
Develop a map of weed distribution and severity, and management strategies for navua sedge, balsam pear and itch grass species, led by SRA (2022005).
New diagnostics for early and accurate diagnosis and rapid response to threats of plant industries, including sugarcane to be developed by the Plant Biosecurity Research Initiative - Phase III, led by Hort Innovation (2022604).
Improve seasonal outlook products and services used by growers and other agricultural producers, led by the Bureau of Meteorology (2022901) 4
Programs and services
SRA’s biosecurity program develops genetic solutions for endemic diseases comprising smut, Pachymetra, red rot, leaf scald, Fiji leaf gall, mosaic, yellow spot and orange rust, by screening breeding germplasm to develop resistant varieties (BIODTLY, BIOPIND, BIOPTLY, BIOPWFD, BUV4700).
SRA’s quarantine activities facilitate the import and export of sugarcane varieties with other sugarproducing countries such as the United States and Brazil, supporting enhanced genetic diversity of varieties and managing the risk of exotic pests and diseases entering Australia (BIOQUAR).
Establishing the baseline risk to the Australian industry from exotic pests will commence with establishing sentinel crops of six varieties in Indonesia (PLANVPD and BUV4000).
SRA’s subsided screening services for diseases, pests, and pathogens enables growers to test plant material and soil for Pachymetra, nematodes, and ratoon stunting disease (RSD) and avoid related production losses (BIORSDL, BIOSPLY).
Specialised diagnostic and response activities to endemic and exotic pests, diseases and weeds identified by industry by SRA (BIOEMER).
District Productivity Plans
Deliver local events such as field days and training workshops, and activities to increase awareness and adoption of SRA-funded technologies, varieties, and management practices, and address districtlevel productivity constraints. Key activities include, but are not limited to, the following:
Far north
Conduct pot trials and develop management strategies for emerging weeds including balsam pear, navua sedge, and itch grass. Further, investigate the efficacy of registered herbicides for aerial application on vine species (DPF0005).
North
Develop a prototype sterilisation unit to be installed on the harvester to manage RSD and conduct testing (DPN0005).
Conduct survey across the Herbert region to measure the incidence and severity of Pachymetra and RSD (DPN0008).
Burdekin
Investigate applying liquid imidacloprid in early plant cane as an alternative to granular products to control canegrubs (DPB0002).
Install harvester sterilisation unit to manage RSD and coordinate small scale demonstration to contractors (DPB0003).
Conduct trials comparing spot spray system and blanket application for targeted weed species (DPB0003).
Southern, Rocky Point and New South Walkes
Undertake research of RSD in the Rocky Point area and promote management strategies to growers to avoid production losses (DPS0004).
MEASURE
Improved resistance ratings of newly released varieties
Estimated avoided costs to production of potential, new and emerging pests, diseases and weeds
Estimated avoided production loss from advanced crop protection and management technologies
Farmer understanding of climate-related threats and opportunities (survey)
DETAILS
Selection for disease resistance ratings is a high priority for SRA’s Variety Development Program to provide significant risk mitigation on a whole-of-industry scale. For new varieties, the weighted average resistance rating for smut disease has decreased from 6.4 in 2006, when the disease first arrived in Australia, to 3.4 in both 2022 and 2023. This is using a ninepoint scale where 1 indicates a high degree of resistance and 9 indicates no resistance. In addition, the weighted average resistance rating of varieties for Pachymetra has modestly decreased from 4.4 in 2012, which was the highest level in the past 10 years, to 4.2 in both 2022 and 2023.
In 2023/24, SRA and DAF invested in eDNA technology and sampling methods to improve detection of exotic sugarcane diseases like Ramu stunt, which can cause yield losses of up to 60%. This investment will enable biosecurity personnel to detect threats to prevent significant yield losses.
In 2022/23, a benefit-cost analysis of SRA's Pathology Laboratory, which rapidly assesses the presence of Ratoon Stunting Disease (RSD), estimated a 5.3% productivity gain in avoided losses. This results in $15 million annually for growers and $10 million for milling companies. From 2013-14 to 202223, the service delivered an estimated $328 million in economic value, benefiting growers and millers by 58% and 42%, respectively.
In 2016/17, 22% of growers identified climate-related threats such as drought, rainfall, and weather extremes as key constraints to farm productivity. By 2021/22, this figure rose to 33%, indicating increased awareness among growers of the impact of climate issues on productivity.
RATING
No change in performance
Not measured during period
Not measured during period
Not measured during period
CASE STUDY ADVANCING RSD DETECTION & MANAGEMENT
THE CHALLENGE:
Ratoon Stunting Disease (RSD) is a global disease which significantly affects the productivity and profitability of sugarcane production and occurs across all growing districts. RDS is caused by a bacterium, Leifsonia xyli subsp. xyli that infects and replicates within the vascular system of sugarcane (Saccharum sp. hybrids). The bacterium was first recognised in Australia 80 years ago.
The disease is difficult to diagnose because it has no unique external symptoms. Affected crops are lower yielding than healthy crops but the extent varies according to variety and moisture stress.
RSD is easily spread between farms in planting material, using shared fungicide dip planters, and by mechanical cutting equipment. If planting material is diseased, all subsequent harvests from its crop will also be diseased. RSD will remain until the diseased cane stools are removed.
Production losses are estimated to be between 10-20% for plant crops and between 15-35% for ratoon crops, valued at more than $25 million annually. This reduced production has downstream impacts for harvesting contractors and sugar milling companies.
SOLUTION:
Sugar Research Australia (SRA) has invested in novel technologies to detect and manage RSD in order to limit sugarcane production losses:
a. Planting disease-free material is critical for controlling RSD, and SRA’s subsidised RSD diagnostic service uses sensitive and accurate quantitative polymerase chain reaction (qPCR) assays to identify disease-free planting material prior to planting.
b. Despite the benefits and accuracy of the qPCR, it cannot be applied to commercial crops because of the scale. However, a research grant project is currently focused on extending the use of Near-infra Red (NIR) spectroscopy to detect RSD in every batch of cane that enters the sugar mill. This will allow RSD incidence to be mapped
across an entire mill area, providing a better indication of spread and potentially improved management of the disease. Preliminary mapping of key sugarcane growing regions including South Johnstone and Tully has already been trialled.
c. Two recent projects have delivered inexpensive portable diagnostics technologies for use in the regions, not requiring laboratory analysis. A more rapid RSD result will assist industry advisors to respond accordingly when urgent results are required.
d. The prototype of an on-board automated sterilisation system for sugarcane harvesters is currently being tested for effectiveness, with the aim of limiting transmission of RSD from farm to farm.
IMPACT:
A recent benefit-cost analysis of SRA’s subsidised RSD diagnostic service estimated that the service had delivered $328 million in net present value to growers and millers between 2013-2023 and a return on investment of 68 to 1.
SRA has produced and distributed publications such as the Wet Tropics Ratoon Stunting Disease Extension Package through regular
grower workshops to increase adoption of RSD management practices.
Recent estimates suggest these efforts are beginning to work with 64% of growers reporting that they obtain cane from approved seed plots every year or almost every year. Further, 40% of growers utilise SRA’s diagnostic service to test for RSD.
RESEARCH MISSION 3 DIVERSIFIED AND ADAPTABLE
Aim:
Capitalise on changing consumer preferences, and the growing bio and green economies to develop diversification opportunities
Investment 2023/24:
$0.4M
Objective:
Deliver research, development and analysis to support the sugarcane by:
• Increasing revenue through leveraging existing resources, brand reputation and supply chain
• Remaining profitable during sugar price fluctuations
• Finding opportunities to monetise biomass potential.
Grant Projects
Build a network of existing and new industry value chain partners to uncover diversification opportunities, led by QUT (2022018).
Percentage of farms and mills generating revenue from alternative products
Industry contribution to gross domestic product
Progress on this measure will be reported in future annual reports.
The total sugar supply chain is estimated to contribute $4 billion to Australia’s gross domestic product 5 . In 2023/24, the nominal value of Australian sugarcane production was forecast to rise by 11% to $2.2 billion due to high global prices despite lower production.
Satisfaction with R&D support for the industry’s diversification and trade and market access opportunities
* See page 94 for TRL summary.
In 2022-23, growers and millers reported moderate satisfaction with SRA's investments in diversification and trade and market access opportunities. On a scale of 0 to 10, where 0 is extremely dissatisfied and 10 is extremely satisfied, growers rated their satisfaction at 6.6 for diversification R&D and 7.1 for trade and market access R&D, while millers reported 6.1 and 6.6, respectively.
CASE STUDY BUILDING A BETTER BIOECONOMY (2022018)
THE CHALLENGE:
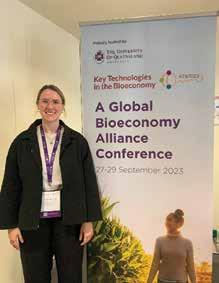
There is significant opportunity for diversification into the bioeconomy for the Australian sugar industry, and collaboration is key. Queensland University of Technology’s Madeline Smith was engaged to better integrate millers and canegrowers into the bioeconomy research and business landscape by strengthening industry connections and networks with the aim of catalysing partnerships to attract investments, resources and capabilities.
Madeline began by mapping existing research investment and partnerships which could help to support the sugar industry to generate future diversification pathways. Then a series of webinars was held to build greater awareness of companies, research organisations and industry bodies engaged in understanding or exploring opportunities in the bioeconomy in sugarcane growing regions. This series was the first step in building a network to connect key industry stakeholders in this emerging supply chain and to create new partnerships.
SOLUTION:
Three webinars were presented which followed the key areas identified by the industry’s bioeconomy roadmap Sugar Plus – Fuelling the Future of Food, Energy and Fabrication . The Bioeconomy in Focus webinar series featured discussions from key players across sustainable aviation fuels (SAF), future plant-based ingredients, and biopolymers (used for sustainable food packaging), talking about research to understand the potential value of these markets for the sugarcane industry. Each webinar featured a panel of experts discussing potential
diversification opportunities for the sugarcane industry. More than 300 people - including farmers, millers, researchers, start-ups and investors –attended the webinars and a similar number have watched the recordings online since. Information resources for researchers, millers and growers were developed to better understand sugarcane in the bioeconomy. The webinar recordings and associated resources can be found on the SRA website.
IMPACT:
This series has influenced domestic policy analysis to support industry growth in the bioeconomy. The Cellular Agriculture Australia’s report: Producing Food through Precision Fermentation released in August 2024 has referenced the webinar series extensively, using the information presented to outline the opportunities and challenges to capitalise on forecasted future demand such as skills, scale-up infrastructure, research funding and partnerships, regional networks and critically, feedstocks, especially sugarcane.
Madeline Smith was previously funded by SRA to complete her Masters, optimising precision fermentation technologies and processes. As part of SRA’s relentless drive to build researchers with deep empathy and understanding of the industry’s research problems, with a constant focus on having impact and benefiting the industry, this project gave Madi invaluable experience and networks across the sugar and bioeconomy business and innovation ecosystem. SRA aims to secure the Industry's future growth with the assistance of engaged and productive experts through research and applications.
RESEARCH MISSION 4 SUSTAINABLE AND EFFICIENT
Aim: Position the Australian sugarcane industry as leaders in profitability, environmental sustainability and resource-use efficiency
Investment 2023/24:
$5.5M
Objective: Recognise that the future success of the industry depends on the sustainable use of inputs including land, water, carbon and energy. Aims to ensure that the Australian sugarcane industry’s practices sustain the natural environment and are profitable for growers and millers
INVESTMENT DETAILS
Grant Projects
Deliver training and adoption activities for the Cane to Creek Mackay Whitsunday project targeting improved nutrient and pesticide management solutions for growers and enhanced water quality in the Central district, led by SRA (2020802)5
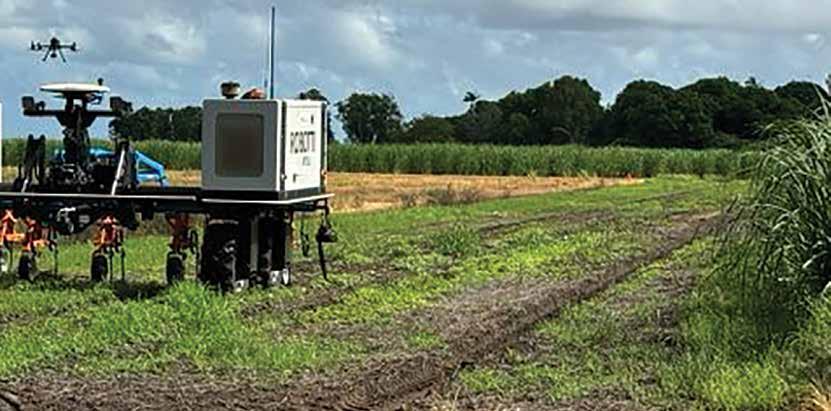
Investigate strategic tillage practice vs herbicide application practices and reducing pesticide use by adapting a smart spot spraying machine that detects weeds from soil and sugarcane, led by James Cook University (JCU) (SRA is a delivery partner) (2020804) 6
Deliver training and adoption activities for the Burdekin Irrigation Project targeting improved irrigation efficiency and water quality solutions for growers in the Burdekin district, led by SRA (2020805)7
Develop a Sustainability Framework for the Australian sugarcane industry to drive improvements in the industry’s environmental impact, led by Roth Rural (2021008) 8
Deliver training and adoption activities for the Mobilising the Murray Project targeting whole-offarm solutions for productivity constraints experienced by growers in the Tully region, led by SRA (2021804) 9
5 The Cane to Creek Mackay Whitsunday project is funded by the partnership between the Australian Government’s Reef Trust and the Great Barrier Reef Foundation with support from Sugar Research Australia, Mackay Area Productivity Services and Plane Creek Productivity Services.
6 This project is funded by the partnership between the Australian Government’s Reef Trust and the Great Barrier Reef Foundation, and supported by James Cook University, AutoWeed and Sugar Research Australia.
7 The Burdekin Irrigation Project is funded by the partnership between the Australian Government’s Reef Trust and the Great Barrier Reef Foundation with support from Sugar Research Australia, Farmacist, AgriTech Solutions, Burdekin Productivity Services, Burdekin Bowen Irrigated Floodplain Management Advisory Committee, NQ Dry Tropics, James Cook University and the Queensland Department of Agriculture and Fisheries
8 This project is funded by the Department of Agriculture and Fisheries and Sugar Research Australia.
9 The Mobilising the Murray Project is funded by the Australian Government’s Reef Trust and delivered by Terrain NRM in partnership with Sugar Research Australia.
INVESTMENT DETAILS
Grant Projects
Deliver training and adoption activities for the project Soil specific management for sugarcane production in the Wet Tropics, targeting improved knowledge and understanding of soils across the Wet Tropics region to support profitable and sustainable production, led by SRA (2021805)10
Complete industry-wide leaf and soil survey to detect hidden macro and micronutrient constraints in sugarcane, led by SRA (2022010).
Develop best practice, soil specific phosphorus management practices for sustainable sugarcane production, led by SRA (2022011).
Deliver training and adoption activities as part of the XXXX Burdekin Smart Irrigation and Lower Burdekin Cane Incentives projects to improve irrigation efficiency and water quality solutions for growers in the Burdekin district, led by NQ Dry Tropics (SRA is a delivery partner) (2022801 and 2022802)11
Deliver training and adoption activities targeting improved nutrient use efficiency and reduced amounts of Dissolved Inorganic Nitrogen flowing into waters in the Northern district, led by CANEGROWERS (Cassowary Coast Reef Smart Farming Project) (SRA is a delivery partner) (2022803)12
Provide nutrient management plans for growers and farm demonstrations and trials focussed on best practice nutrient management practices (2022805).
Develop a standardised carbon calculation engine for Australian agriculture, fisheries, and forestry industries, to determine the carbon footprint for both sugarcane farms and mixed farming enterprises, led by Agricultural Innovation Australia (AIA) (2023901).
10 This project is supported by Sugar Research Australia and the University of Southern Queensland, through funding from the Australian Government’s National Landcare Program.
11 These projects are funded by the partnership between the Australian Government’s Reef Trust and the Great Barrier Reef Foundation, and Castlemaine Perkins.
12 The Cassowary Coast Reef Smart Farming project is funded by the partnership between the Australian Government’s Reef Trust and the Great Barrier Reef Foundation.
* See page 94 for TRL summary.
Programs and services
SRA’s chemistry laboratory provides compositional analyses of soil, plant tissue, water, mill products, and other samples, supporting SRA grant projects and programs such as plant breeding, as well as some external clients (PLANLAB).
District Productivity Plans
Deliver local events such as field days and training workshops, and activities to increase awareness and adoption of SRA funded technologies, varieties, and management practices, and address districtlevel productivity constraints. Key activities include, but are not limited to, the following:
North
Refine nutrient recommendations using the SIX EASY STEPS ® program following application of subsurface banded mill by-products to manage the effect on yield and CCS for growers in the Herbert and Tully regions (DPN0003).
Enhance mill by-product use for Tully growers by providing detailed costs and requirements for equipment upgrades or purchases to improve placement and rate control. Review NIR mill mud data to offer better nutrient composition information for refining nutrient inputs (DPN0004).
Burdekin
Investigate the use of subsurface mill by-products at low rates in the outer regions of the Burdekin district. Measure the response, evaluate profitability, and address economic barriers (DPB0001).
Measure baseline irrigation volumes and energy use, promote the use of IrrigWeb, Opticane and i-RAT, and automated irrigation systems and tools, and develop demonstration sites, field walks and training workshops for growers and advisors (DPB0005).
Central
Provide a soybean planter to growers in the central region to trial growing fallow crops for adoption consideration (DPC0001).
Improve irrigation utilisation by establishing low-cost irrigation control/automation demonstration sites to raise awareness of available technologies and support growers to adopt low-cost irrigation scheduling tools and system efficiency tools (DPC0005).
Southern, Rocky Point and New South Walkes
Deliver the Burnett Mary Agronomy Project including one-on-one extension activities, technical advice, and individual farm reports detailing productivity constraints to 40 growers in the Southern district (DPS0001)13
Deliver SIX EASY STEPS® program demonstration trials for re-establishment and individual productivity plans for growers-based in Rocky Point (DPS0004).
13 The Burnett Mary Agronomy Project (BMAP) delivered by Sugar Research Australia (SRA) is part of the $4.38 million Sugarcane Practice Change Program funded through the Queensland Government’s Queensland Reef Water Quality Program.
MEASURE
Positive progress in environmental credentials measured in industry benchmarking
DETAILS
The 2021 and 2022 Reef Report Card (released in 2023/24) shows moderate water quality improvements, benefiting the Great Barrier Reef. The Murray catchment achieved a 5.3% reduction in fine sediment and the highest pesticide risk rating of ‘very good,’ while the Burdekin catchment saw a 3% reduction in dissolved inorganic nitrogen. However, progress toward the 2025 targets remains limited. Dissolved inorganic nitrogen reduction is rated E, or very poor, with a cumulative 28.4% reduction by June 2022 and only a 0.7% reduction (about 35 tonnes) from July 2020 to June 2022, far short of the 60% target by 2025. Notably, the Burdekin recorded a 2% load reduction (around 15 tonnes), primarily due to sugarcane growers adopting practices that reduced nitrogen use and improved mill mud application.
RATING
Performance increase
Positive external perceptions of sugar industry activities and efforts (government and public views)
Industry participation in green markets
Industry uptake of, and satisfaction with, compliance and decision tools.
In 2021/22, 41% of community members believed the sugar industry responsibly managed land resources sustainably, while 64% viewed sugarcane production as a sustainable industry. Future annual reports will provide updates as new data becomes available.
In 2022/23, 23% of growers reported participating in or planning to participate in green market opportunities such as carbon programs, renewable energy, and environmental stewardship schemes.
In 2023/24, there were 307 users, an increase of 86% from the previous year, using the Online Sugarcane Nutrient Management program to support decision making about nutrient application. Additionally, growers and harvesting contractors responsible for around 4% of the crop adopted Harvest Mate during the 2023 season, demonstrating moderate uptake of the tool in the first year of its release.
Not measured during period
Not measured during period
Performance increase
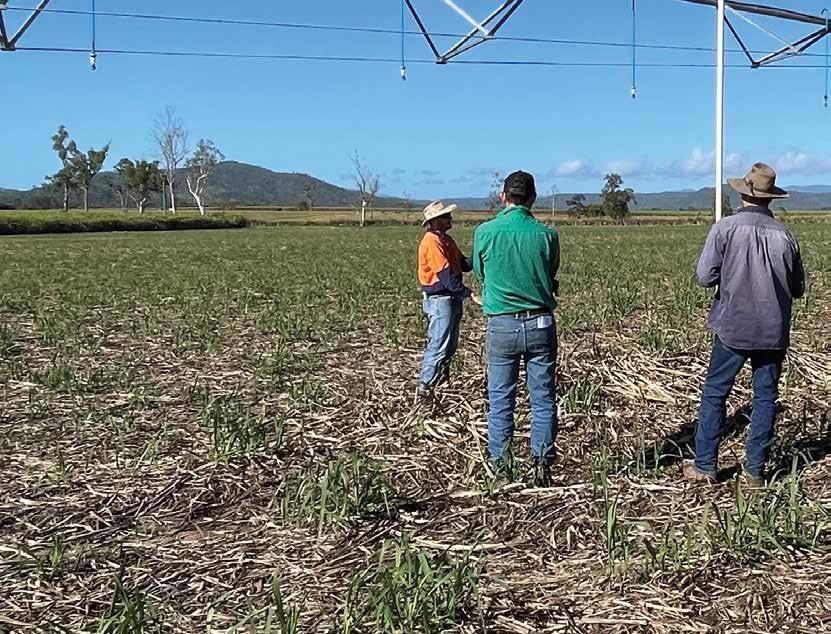
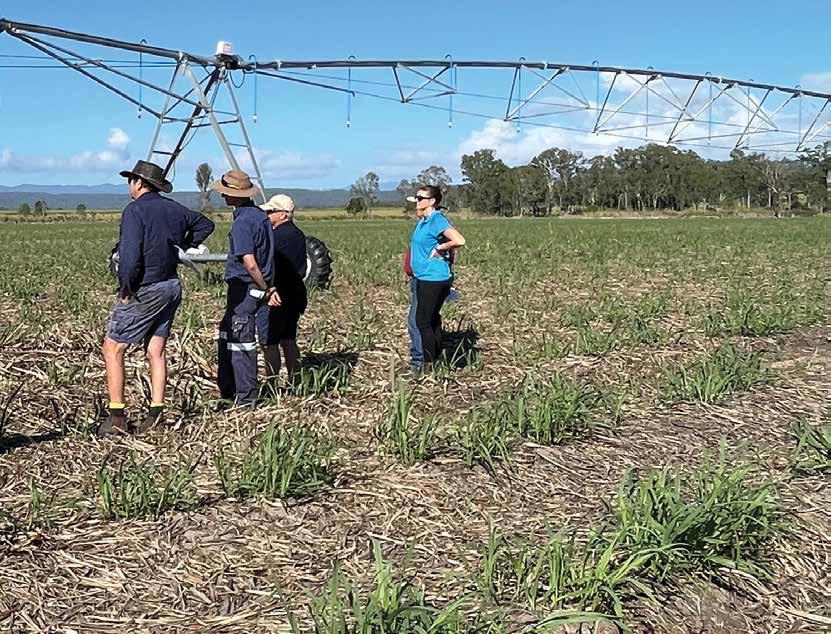
CASE STUDY BURDEKIN IRRIGATION PROJECT (2020805)
THE CHALLENGE:
Increasing industry productivity and profitability through a transformational, whole-of-farming systems approach that delivers water quality benefits.
The Burdekin region of Queensland has 80,000 hectares of land under sugarcane. It typically produces 8,3 million tonnes of cane annually, farmed by approximately 530 growers on 927 farms.
This high yielding sugarcane results from high solar radiation and the availability of a reliable irrigation supply.
Due to excess run-off from low efficiency furrow irrigation systems, the region has been identified as a priority catchment for nitrogen (N) and pesticide loads entering the Great Barrier Reef lagoon. Research shows it is possible to reduce N losses through improved irrigation with no impact to yields.
The Burdekin Irrigation Project aims to maximise industry profitability through smarter irrigation practices which will also improve environmental outcomes. It will do this by supporting growers to transition to scalable, sustainable, and technologically assisted practices in irrigation management.
SOLUTION:
A nine-step ‘Improved Irrigation Efficiency Pathway’ was collaboratively designed and endorsed by a consortium of key extension stakeholders in the region. The process provides the framework to address industry priorities and water quality targets simultaneously.
Through participation in the project, Burdekin growers achieve best management irrigation practices so they can attain high yields, reduce electricity and water costs, and deliver improved water quality outcomes.
To capitalise on improved irrigation, a wholeof-farming systems approach is implemented. Solutions will be delivered not just for irrigation but also for weeds, pests, diseases, and nutrient management.
Project goals include:
• Transition growers to proven world class, scalable, sustainable and technologically advanced practices in irrigation management
• Take a whole-of-farming systems approach that includes water quality monitoring to ensure other priority issues such as improving nutrient and pesticide management are captured
• Maximise industry profitability through smarter irrigation practices
• Standardise the process of grower engagement, to a powerful, multi-partnered and cooperative approach that will deliver more value to growers, investors and industry stakeholders
• Work across organisations to maximise outcomes from strategic coordination, collaborative linkages and consistent messaging.
IMPACT:
The Project results in the delivery of easily accessible and adoptable best management practice guidelines for farmers. It offers a tangible, and demonstratable environmental stewardship program, training farmers in smart irrigation management.
Farmers are embracing digital agriculture, to the benefit of improved industry adoption of smart irrigation leading to improved irrigation use efficiency, minimised input losses and input costs.
Ultimately, the Burdekin sugarcane industry is experiencing overall improvements in water quality, contributing to the Reef 2050 Water Quality Improvement Plan.
ACKNOWLEDGEMENTS:
The Burdekin Irrigation Project is funded by the partnership between the Australian Government’s Reef Trust and the Great Barrier Reef Foundation with support from Sugar Research Australia, Farmacist, Agritech Solutions, Burdekin Productivity Services, Burdekin Bowen Irrigated Floodplain Management Advisory Committee, NQ Dry Tropics, James Cook University and the Queensland Department of Agriculture and Fisheries.
The Burdekin Irrigation Project is a collaborative initiative of Burdekin extension organisations including AgriTech Solutions, Burdekin Bowen Integrated Floodplain Management Advisory Committee, Burdekin Productivity Services, the Queensland Department of Agriculture and Fisheries, Farmacist, James Cook University and Sugar Research Australia.
Aim:
Support the development of an adaptable, professional, commercial and entrepreneurial industry and research community.
Investment 2023/24:
$0.7M
RESEARCH MISSION 5 RESOURCED AND SKILLED INVESTMENT DETAILS
Grant Projects
Objective:
Minimise and control risk to production from pests, diseases, weeds and climate / environmental threats.
Funding for milling research capacity-building and succession-planning for early career researchers, led by QUT (2018015)14
PhD scholarship: Molecular markers and method to measure fibre quality to increase breeding efficiency for SRA’s breeding program, led by UQ (2019102)
PhD scholarship: Develop method to apply mill mud and ash to maximise yield and soil health, and measure soil carbon sequestration, led by James Cook University (JCU) (2021101).
PhD scholarship: Develop biofertiliser with optimal soil nutrient utilisation to increase yields, led by UQ (2021102).
PhD scholarship: Develop a biosensor device to diagnose diseases on farm, led by Griffith University (2022101).
Research award: Identify the gene/enzyme in stingless bees that is responsible for efficiently isomerising the sucrose found in nectar to produce high value alternative sugar, trehalulose, led by UQ (2022401).
Research award: Develop genomics selection software to assess the robustness of clone yield across ratoon crops and enable selection of clones that have more consistent yield across ratoon crops, led by UQ (2022402).
Scholarships and bursaries for undergraduate engineering students to build knowledge and experience of milling and to support employment pathways, led by QUT (2022601). N/A N/A N/A
Deliver a new digital Smartcane BMP learning module, led by SRA (2022804)15
PhD scholarship: Develop an automated system to perform localised in-crop replanting of sugarcane gaps, led by the University of Southern Queensland (USQ) (2023101).
PhD scholarship: Identify the agronomic and financial drivers that influence and improve nitrogen fertiliser management decisions by sugarcane growers by UQ (2023103).
14 This project is funded by Queensland University of Technology, Sugar Research Institute and Sugar Research Australia.
15 This project is funded by CANEGROWERS.
* See page 94 for TRL summary.
District Productivity Plans
Deliver local events such as field days, training workshops, and activities to increase awareness and adoption of SRA funded technologies, varieties, and management practices, and address district-level productivity constraints. Key activities include, but are not limited to, the following:
Central
Collaborating with local networks and committees to establish, support and participate in projects in the district, and improve public perceptions of the sugarcane industry (DPC0002).
MEASURE
The number and diversity of industry and research partners involved in establishing SRA’s R&D goals and strategies
Number of capability building programs, and participation rates for capability programs, including diversity of participation
Number of undergraduate places supported in industry critical areas such as agronomy
Number of PhD submissions relating to the sugar industry
DETAILS
In 2023/24, SRA engaged 83 industry and government stakeholders to identify research priorities for our Ten-Year R&D Plan and to inform investment planning and procurement via our 10th Anniversary Research Fund.
In 2023/24, SRA invested in capability building via the following initiatives:
• two post doctorates funded for early career researchers
• nine PhDs funded for emerging researchers
Performance increase
Performance increase
Since 2021/22, SRA has funded nine undergraduate engineering positions with Sugar Research Institute. No change in performance
No PhDs were submitted in 2023/24; however, two theses are expected to be submitted in early 2024/25.
Performance increase
CASE STUDY AN ECONOMIC AND AGRONOMIC ASSESSMENT OF NITROGEN USE EFFICIENCY AND THE FACTORS INFLUENCING IT (2023103)
THE CHALLENGE:
Australia’s sugar industry has changed over the last decade as the number of farms has decreased from 5,521 in 2010 on an average 70.5 ha, to 4,502 in 2021 on an average 80.48 ha (source: Australian Bureau of Statistics), and with the adoption of new technologies and management practices.
Of great importance with the proximity of the Great Barrier Reef and cost for fertilisers is efficient nitrogen management. Fertiliser use has declined across Australia’s cane growing regions from 206 kg N/ha in 1997 to 167 kg N/ha in 2020 (Source: Australian Bureau of Agricultural Resource Economics and Science).
A number of approaches to greater nitrogen use efficiency have been developed, eclipsed by the industry standard, SRA's SIX EASY STEPS ®
In this study, we aim to analyse how nitrogen management has been impacted by changes over time as the industry has transitioned and growers encouraged to adopt practices for maximising Nitrogen Use Efficiency (NUE).
With growers having to consider agronomic, financial and business factors, the research project is analysing all these factors to gain insight into what is driving change in nitrogen management in the Australian sugarcane industry. Particular attention is given to the increasing size of sugarcane farms, and how this has affected nitrogen management and NUE.
SOLUTION:
In his PhD research (supported by UQ and SRA), Kristopher Woodrow-Smith focuses on the balance between achieving high sugarcane yields while reducing environmental impact through the efficient use of N fertilisers. The objectives were to:
• Develop an improved understanding of the factors that have historically driven changes in nitrogen (N) management within the Australian sugarcane industry
• Identify which on-farm factors are leading to the greatest improvement in nitrogen management
• Provide insight into future avenues for improved nitrogen management.
The research assesses NUE across the industry, using farm survey data provided by the Australian Bureau of Agricultural Resource Economics and Science (ABARES) from FY2020-21 to 2021-22.
IMPACT:
Analysing N fertiliser application rates and their correlation with sugar yields across Queensland shows the average partial factor (PFP) NUE of 0.72 is near what is currently considered ideal (72% of fertiliser used by crops, 28% entering the environment in various forms). However, there is a significant variation, with PFP NUE ranging from 0.14 to 1.86 across regions and farm sizes.
This means there is a need to investigate reasons for such variability and identify the drivers that make some farms less efficient (86% of fertiliser N may be lost to the environment) while other farms are ‘too efficient’ and are mining soil N.
Kristopher will expand this analysis by incorporating additional variables that could impact NUE. These include different farm management practices such as the use of mill by-products, the integration of legumes during fallow periods,
and the implementation of variable fertiliser application techniques. Furthermore, farm-specific characteristics like soil types will be considered to understand their role in nitrogen use efficiency.
This research is supported by two significant reports from Sugar Research Australia (SRA): SIX EASY STEPS® – Continuing Perspectives in Time and Space and Boosting NUE in Sugarcane through Temporal and Spatial Management Options
Such knowledge is relevant for the industry’s ongoing aim to improve sustainable farming and is relevant to the Reef Protection Regulations.
Kristopher's research aims to support the industry’s transformation towards sustainable practices that is based on nuanced understanding of nitrogen fertiliser use and the contributing factors that ensure efficiency.
Kristopher Woodrow-Smith’s PhD Research Scholarship - An economic and agronomic assessment of nitrogen use efficiency and the influencing factors
OUR STRONG FOUNDATIONS
INDEPENDENT PERFORMANCE REVIEW
Under the Statutory Funding Agreement (SFA) 2021-2031 between SRA and Australian Government’s Department of Agriculture, Fisheries and Forestry (DAFF), SRA is required to engage an independent party to conduct a comprehensive review of our performance against the Performance Principles outlined in the Guidelines for Statutory Funding Agreements.
GHD was commissioned in November 2023 to undertake the review between December 2023 and April 2024. The review period was 2020 to 2023 and it consisted of a desktop review of documents and consultation with a range of SRA’s internal and external stakeholders. More than 250 documents were curated by SRA requiring detailed planning to provide demonstrable evidence that SRA’s business practices are consistent with statutory and constitutional requirements. Additionally, arrangements were made with 65 individuals representing levy payers, government investors, and other industry and research stakeholders for consultation, and the review included an open call for submissions, of which three responses were received.
The review concluded that SRA largely met its obligations under relevant acts, agreements, and its Constitution.
Regarding the Performance Principles, the review found that while SRA conducts extensive stakeholder consultation, there is an opportunity to adopt a more structured, strategic approach through formalised mechanisms. It also called for enhanced reporting to address concerns about lack of transparency with investment allocation and noted that SRA has not utilised all available funding from the Queensland Government’s Department of Agriculture and Fisheries in recent years, highlighting the need for effective engagement with our key partner.
In terms of governance, the review found that SRA is implementing several changes to address weaknesses, including managing perceived conflicts from its dual role as a research funder and provider. The review also identified gaps and renewal needs in many policies and committee charters.
Finally, the review found that our monitoring and evaluation practices align with the Performance Principles, and evaluations on core and contestable investments were conducted in line with guidelines from the Council of Rural Research and Development Corporations. GHD also assessed the status of recommendations from the 2020 review and found that 10 of 16 were completed and 6 were partially completed or in progress.
The review made 20 recommendations covering topics including, but not limited to, addressing leadership stability, need for more structured engagement with stakeholders, provide greater transparency to investment planning and reporting allocations, updating policies, risk reporting, and conducting ex-ante and ex-post evaluations for investment planning and delivery.
A copy of the review is available on our website and a Response Plan that addresses the recommendations by the review will be released in 2024/25.
A DIVERSE WORKFORCE
SRA continues to focus on developing its diversity profile and promoting inclusion in the workplace. We continue to work towards delivering our initiatives which include:
Workplace Gender Equality Agency (WGEA) reporting
SRA has completed the annual WGEA reporting. A number of actions have been identified by the Management group that will look to reduce our gender pay gap.
Women in Technology (WiT)
This year we renewed SRA’s corporate membership to Women in Technology (WiT). All SRA employees can access member benefits, which include programs tailored to support women from culturally and linguistically diverse backgrounds to excel in Science, Technology, Engineering and Mathematics (STEM) careers. In addition, SRA sponsored a section of the 2023 Awards event which gave us an opportunity to present an award and showcase a video of several SRA female researchers in the field. SRA have also supported WiT by hosting meetings in the Brisbane CBD Board room.
Reconciliation Action Plan (RAP)
SRA has formed a Working Group to create a ‘Reflect’ Reconciliation Action Plan (RAP). An extensive Discovery Phase has been undertaken, gathering insights including key learnings, successes and guiding principles from other organisations in the agricultural, land and sea management and research sectors, to help shape SRA’s RAP.
The group has established a project plan to ensure the effective delivery of the Reflect RAP. Our RAP will be developed to guide SRA’s actions towards reconciliation with Australia’s First Nations peoples and will acknowledge the important role and historical contributions of Australian South Sea Islanders to the sugar industry. The RAP aims to help SRA create a better workplace for everyone, foster truth-telling about the past, and build stronger relationships with Aboriginal and Torres Strait Islander communities.
HEALTH, SAFETY AND ENVIRONMENT
Over the past year, SRA continued making significant strides in enhancing its Health, Safety, and Environmental (HSE) performance and its safety culture. Our dedicated staff and leadership remain focused on proactive measures to prevent harm, draw insights from experiences, and cultivate a culture of safety leadership throughout the organisation.
Strong Learning and Risk Management Culture
SRA staff are committed to maintaining high on-time completion rates for safety training, currently at 97%. They actively leverage insights from various safety activities—such as incident investigations, audits, hazard reports, risk assessments—sharing these learnings across the organisation in forums like the regular safety committee meetings for everyone’s benefit.
Timely investigation of incidents is a core principle at SRA that has led to a notable reduction in investigation lead times, now at half the duration of previous years. At the same time, hazard reporting has also seen a significant increase, with reports up by over 60% as of July 2024. Learnings from investigations reinforce our risk management strategy where jobs are assessed before commencement and hazards are promptly addressed.
Efforts on learning from safety activities and on risk assessments have directly contributed to the very low *Serious injury frequency rate, which has been zero for the past 12 months, well below the national rate for agriculture (10.9 rate – Safe Work Australia 2023) and the Queensland rate (11.6 rate – Worksafe Qld 2022). *Serious injury frequency rate is also referred to as Serious claim frequency rate.
Improvement Plan
The initial improvement plan, aimed at systematically enhancing safety and environmental performance, was successfully completed as planned in 2023. This initiative resulted in more robust processes, a safer workplace, a stronger safety culture and greater environmental responsibility. The lessons learned during its implementation have been incorporated into a new improvement plan that will guide SRA’s efforts in HSE from 2024 to 2026.
PARTNERSHIPS
SRA relies on collaborative relationships with research investors and delivery providers, and other industry organisations to achieve many of its goals. We value our partnerships with the following organisations in 2023/24:
• Commonwealth Scientific and Industrial Research Organisation
• Council of Rural Research and Development Corporations
• Dairy Australia
• Department of Agriculture Fisheries and Forestry
• Department of Climate Change, Energy, the Environment and Water
• Department of Regional Development, manufacturing and Water
• EnviroDNA
• Farmacist
• Fisheries Research and Development Corporation
• Forestry and Wood Products Australia
• Grains Research and Development Corporation
• Griffith University
• Great Barrier Reef Foundation
• Heck Group
• Herbert Cane Productivity Services
• Horticulture Innovation Australia
• Indonesian Sugar Research Institute
• Innisfail Babinda Cane Productivity Services
• Isis Central Sugar Mill
• Isis Productivity
• James Cook University
• Kalamia Canegrowers Organisation
• LiveCorp
• Lower Burdekin Water
• Mackay Sugar
• Mackay Area Productivity Services
• Maryborough Cane Productivity Services
• Meat and Livestock Australia
• MSF Sugar
• New Energy Farms
• New South Wales Ag Services
• New South Wales Sugar Milling Co Op
• NQ Dry Tropics
• Queensland Cane, Agriculture & Renewables
• Queensland Department of Agriculture & Fisheries
• Queensland Department of Environment and Science
• Queensland Sugar Limited
• Queensland University of Technology
• Plane Creek Productivity Services
• Plant Health Australia
• Ramu Agri Industries
• Rocky Point Productivity Services
• Roth Rural
• Sugar Research Institute
• Sugar Services Proserpine
• Sugar Terminals Limited
• Sunshine Sugar
• Sunwater
• Terrain NRM
• The University of Queensland
• The University of Southern Queensland
• Tully Cane Productivity Services Limited
• Tully Sugar Limited
• Wine Australia
• Wilmar Sugar Australia
FINANCIAL & STATUTORY REPORTING
Directors' Reports
Financial Statements
Portfolio Balance Summary
Income and Expenditure Summary
Statutory Funding Agreement Reporting
DIRECTORS' REPORT
DIRECTORS’ REPORT FOR THE YEAR ENDED 30 JUNE 2024
The Directors of Sugar Research Australia Limited ABN 16 163 670 068 (“Company ” or “ SRA”) submit their report for the financial year ended 30 June 2024 (“ reporting period ”) as follows:
COMPANY LIMITED BY GUARANTEE
The Company was incorporated on 8 May 2013 and is a public company limited by guarantee. The Company has Group G members and Group M members (together the “ members ”). The Constitution states that, if the Company is wound up, the liability of each member is limited as follows:
a. each member at the time the winding up starts; and
b. each person who, at any time in the 12 months before the winding up started, was a member, undertakes to contribute to the assets of the Company up to an amount not exceeding $2 for payment of the debts and liabilities of the Company, including the costs of winding up.
As at 30 June 2024 there were nine (9) Group M members and 2,430 Group G members. The total amount the members of the Company are liable to contribute if the Company is wound up for 2023/24 is $4,878.
On any winding up of the Company, any surplus property must not be paid to members but must be paid or transferred to another corporation, fund, authority or institution with:
a. objects similar to the Company’s objects; and
b. a constitution which prohibits the distribution of its income and property among its members.
Objectives
The primary long-term objective of SRA over the reporting period has been to enable Australia’s sugarcane industry to be profitable, sustainable and resilient.
In support of this objective, SRA has been focused over the short to medium-term on the following goals:
• Increasing profitability across the sugarcane value chain through innovation-led productivity gains, stepchange, and value-adding;
• Improving sustainability through evidence-based research and sustainable production, biosecurity and environmental management;
• Enhancing capability through strengthened research and industry partnerships, capability development programs and collaborative knowledge transfer and adoption mechanisms; and
• Strengthening organisational excellence through enhanced research, development and adoption investment management, best practice organisational governance and a positive performance-focused organisational culture.
Strategy for achieving objectives
The complete strategy for delivery on SRA’s objectives, and goals over the reporting period is detailed in SRA’s Strategic Plan 2021-2026 which is available on SRA’s website.
The Strategic Plan sets out a revised vision of being: A trusted partner, shaping the future prosperity of the Australian sugarcane industry and regional communities through innovation and ingenuity. and establishes the following five Research Missions:
1. PROFITABLE AND PRODUCTIVE
Continuous improvement in farming and milling profitability.
2. RESILIENT AND ENDURING
Position the industry to stay ahead of climate, environmental and biosecurity threats.
3. DIVERSIFIED AND ADAPTABLE
Capitalise on changing consumer preferences, and the growing bio and green economies to develop diversification opportunities.
4. WEALTH GENERATING THROUGH LAND STEWARDSHIP
Position the Australian sugarcane industry as leaders in profitability, environmental sustainability and resource-use efficiency.
5. SKILLED FOR THE FUTURE
Support the development of an adaptable, professional, commercial and entrepreneurial industry and research community.
It also establishes five Strategic Pillars:
STRATEGIC PILLAR 1 – STRONG FOUNDATIONS
Evolve SRA to keep pace with the changing industry landscape by developing a capable, engaged, and safe workforce, and a lean, agile and entrepreneurial organisation with an agile and efficient cost-base.
STRATEGIC PILLAR 2 – A HIGH-PERFORMING RESEARCH PORTFOLIO
Design a focused, balanced and collaborative portfolio of RD&A investments and initiatives that deliver tangible solutions and options to advance the productivity, sustainability, profitability, and long-term growth prospects for the Australian sugarcane industry.
STRATEGIC PILLAR 3 – TRANSLATION EXPERTISE
Translate research findings into tools, products and services that save industry time and money, and improve environmental performance.
Accelerate innovation in variety development to offer varieties that consistently underpin the success of the industry’s current and future product objectives, crop production and protection while lowering development costs and shortening cycle-times.
STRATEGIC PILLAR 5 – COMMERCIAL BENEFITS AND REWARDS
Take our research work and investments to the next level by securing investors and funding and extracting commercial value from our intellectual property, research capability, facilities and strategic partnerships.
Principal activities during the reporting period
The Company’s principal activities during the reporting period consisted of research, development and adoption activities to contribute to the development of the Australian sugar industry. As detailed in the Constitution, the Company receives, amongst other funding, funds from the Commonwealth of Australia by way of proceeds from the sugarcane levy payable by sugarcane growers and millers under the Primary Industries (Excise) Levies Act 1999 (Cth).
Through utilisation of the sugarcane levy (and funding from other sources) the Company carries out, coordinates and invests in research and development activities, to facilitate dissemination, adoption and commercialisation of results of research and development activities in relation to the Australian sugar industry.
DIRECTORS' REPORT (CONTINUED)
Financial Result
The financial result for the reporting period is a $1,132,000 surplus (2023: $16,843,000 surplus), including:
• $1,362,000 deficit (2023: $15,485,000 surplus) from operating activities
• $2,494,000 (2023: $1,358,000) of interest income
Performance measurement
SRA’s five-year Strategic Plan and Annual Operational Plans set out SRA’s strategic and operational agenda, by which delivery against this agenda is measured. The 2021-26 Strategic Plan was developed in collaboration with SRA’s industry and government investors and is underpinned by the five Research Missions referred to above.
SRA entered into its new Statutory Funding Agreement 2021-2031 (“ SFA”) with the Commonwealth Department of Agriculture, Water and the Environment (now the Department of Agriculture, Fisheries and Forestry) (DAFF ) on 3 August 2021. As of January 2022, DAFF requires Research and Development Corporations (RDCs) to report on performance indicators outlined in the relevant SFC (SFC Performance Principles). These include five interlinked principles: stakeholder engagement; Research, Development and Adoption (RD&A) activities; collaboration; governance; and monitoring and evaluation. Each SFC Performance Principle includes outcomes and key performance indicators (KPIs) which are mandatory for RDCs to report against.
SRA has developed a new monitoring and evaluation (M&E) plan for the SFC Performance Principles. This includes the indicators and methods SRA will use to report on the SFC Performance Principles referred to above and as outlined in the Guidelines for Statutory Funding Agreements
SRA’s M&E plan employs an impact pathway logic-based model to guide the assessment of SRA’s performance against delivery of its Strategic and Annual Operational Plans.
The primary mechanisms within SRA’s M&E plan include:
• Project milestone and output monitoring and reporting;
• Operational and strategic reporting to the Board and Audit and Risk Committee;
• Six-monthly exception reporting to the Board on progress against the Strategic Plan;
• Annual reporting on performance to DAFF as required under SRA’s SFC entered into with DAFF on 3 August 2021;
• Project and program impact assessments;
• Annual grower and miller surveys on practice change and investor satisfaction;
• Annual performance reports, including traffic light reporting against the KPIs in SRA’s Strategic Plan and Annual Operational Plan;
• Independent Performance Reviews; and
• Cross Research and Development Corporations Impact Assessment Program.
The Audit and Risk Committee reviews, on an ongoing basis, a suite of reports that cover SRA’s operational and strategic performance. These include: SRA operational reports, such as Finance, Risk Management; and reports on the investment project portfolio. Where required, the Audit and Risk Committee provides the SRA Board with recommendations for remedial action to be taken to ensure SRA’s operational and strategic performance remains on-track.
SRA also regularly communicates with its investors and other stakeholders on the Company’s strategic and operational performance and uses feedback on its performance to continually improve the quality of its research and investment processes, programs and activities.
Board of directors
The following persons were Directors of the Company during the 2023-2024 financial year:
• Rosemary Richards – Independent Non-Executive Director
• Gavin Whiteley – Independent Non-Executive Director
• Rowley Winten – Independent Non-Executive Director
• Donna Campagnolo – Independent Non-Executive Director
• Chris Bosworth – Independent Non-Executive Director
• Shaun Coffey – Independent Non-Executive Director (retired effective 9 July 2023) and interim Chief Executive Officer (appointed effective 10 July 2023)
• Mark Day – Independent Non-Executive Director (retired effective 29 February 2024)
• Peter Russo – Independent Non-Executive Director (retired effective 16 November 2023)
Those Directors listed as Independent Non-Executive Directors have been independent throughout the period of their appointment. Details of their qualifications, experience, and responsibilities are set out on pages 5 and 6.
Company Secretary
Jin Poh held the position of Company Secretary from 27 March 2023 to 25 July 2023.
Shaun Coffey held the position of Company Secretary from 24 August 2023 to 26 July 2024.
Directors’ and Officers’ Indemnification and Insurance
Under the Company’s Constitution, the Company may indemnify any current or former director, company secretary and officer to the extent permitted by law, against:
• every liability owed by the person in that capacity (except a liability for legal costs); and
• all legal costs incurred by them in defending or resisting (or otherwise in connection with) proceedings, whether civil or criminal or of an administrative or investigatory nature, in which the person becomes involved because of that capacity, except, to the extent that the Company is forbidden by law to indemnify the person against the liability or legal costs, or an indemnity by the Company of the person against the liability or legal costs would, if given, be made void by law.
Consistent with the provisions of the Constitution, the Company has entered into deeds of access, indemnity and insurance with all directors, under which the Company indemnifies the director against the full amount of any liabilities, costs and expenses (including legal fees) incurred by them in their respective capacities, subject to certain exclusions, including to the extent that the indemnity by the Company of any such person is prohibited by the Corporations Act or other applicable law.
During the reporting period, the Company paid an insurance premium in respect of an insurance policy for the benefit of directors, company secretary and other officers of the Company and an additional premium in respect of professional indemnity insurance. The directors’ and officers’ liability insurance policy grants indemnification in respect of certain liabilities for which the Corporations Act 2001 (Cth) allows indemnification. In accordance with normal commercial practice and under the terms of the insurance policies, the nature of the liabilities insured against, and the amount of premiums paid remain confidential.
DIRECTORS' REPORT (CONTINUED)
Meetings of Directors
The number of Directors’ meetings and Board committee meetings held during the reporting period and the number of meetings attended by each Director were as follows:
Where a Director did not attend all meetings of the Board or relevant committee, the number of meetings for which the Director was eligible to attend is shown in brackets.
* The Company has established a Director Selection Committee which does not comprise any Directors and is comprised of an independent chair and 2 representatives from Group M members and 2 representatives from Group G members. This Committee held 3 meetings during the reporting period.
1 Commenced as Director following appointment on 16 November 2023
2 Granted leave of absence from 1 November 2023 to 29 February 2024, and resigned as Director on 29 February 2024
3 Retired as Director on 16 November 2023
4 Appointed as member of the People, Performance and Renumeration Committee on 14 December 2023
5 Appointed as member of the Audit and Risk Committee on 14 December 2023
6 Appointed as member of the People, Performance and Renumeration Committee on 24 August 2023 to 14 December 2023
^ Indicates Chair
Corporate Governance Statement
The Company’s Corporate Governance Statement for the financial year ended 30 June 2024 is set out in the section of the Annual Report 2023/24 entitled Corporate Governance and these pages form part of this report.
Proceedings on behalf of the Company
No person has applied to the Court under section 237 of the Corporations Act for leave to bring proceedings on behalf of the Company, or to intervene in any proceedings to which the Company is a party for the purpose of taking responsibility on behalf of the Company for all or part of those proceedings.
Rounding
The Company is of a kind referred to in ASIC Corporations (Rounding in Financial/Directors’ Reports) Instrument 2016/191 and in accordance with that instrument, amounts in the financial report and director’s report have been rounded off to the nearest thousand dollars, unless otherwise stated.
Registered office
Level 10, Suite A, 300 Queen Street, Brisbane QLD 4000
Auditor’s independence
The Auditors Independence Declaration in relation to the audit for the year ended 30 June 2024 as required under section 307C of the Corporations Act 2001 (Cth) has been received by the Company and is included on page 35 and forms part of the Directors' report for the reporting period ended 30 June 2024.
This report is made in accordance with a resolution of the Board of Directors and is authorised for and on behalf of the Directors by:
Brisbane 27 August 2024
Rowena McNally (Chair)
Gavin Whiteley (Director)
Statement of profit or loss and other comprehensive income
For the year ended 30 June 2024
The above statement of profit or loss and other comprehensive income should be read in conjunction with the accompanying notes.
Statement of financial position
As at 30 June 2024
Statement of changes in equity
For the year ended 30 June 2024
The above statement of changes in equity should be read in conjunction with the accompanying notes.
Statement of cash flows
For the year ended 30 June 2024
The above statement of cash flows should be read in conjunction with the accompanying notes.
Notes to the financial statements
For the year ended 30 June 2024
1. Reporting entity
Sugar Research Australia Limited Registered office is at level 10, 300 Queen Street, Brisbane. The Company primarily invests in and manages a portfolio of Research, Development and Adoption (RD&A) projects that drive productivity, profitability and sustainability for the Australian sugarcane industry.
2. Basis of preparation
(a) Statement of compliance
The financial report is a general-purpose financial report that has been prepared in accordance with Australian Accounting Standards – Simplified Disclosures. This includes compliance with the recognition and measurement requirements of all Australian Accounting Standards, Interpretations and other authoritative pronouncements of the Australian Accounting Standards Board and the disclosure requirements of AASB 1060 General Purpose Financial Statements – Simplified Disclosures for For-Profit and Not-for- Profit Tier 2 Entities.
These financial statements were authorised for issue by the Board of Directors on the date of signing of the directors’ declaration
(b) Basis of measurement
These financial statements have been prepared on the historical cost basis.
(c) Functional and presentation currency
These financial statements are presented in Australian dollars, which is the Company’s functional currency.
The Company is of a kind referred to in ASIC Corporations (Rounding in Financial / Director’s Reports) instrument 2016/191 and in accordance with that instrument, amounts in the financial report and director’s report have been rounded off to the nearest thousand dollars, unless otherwise stated.
(d) Use of judgements and estimates
The preparation of financial statements in conformity with Australian Accounting Standards – Simplified Disclosure Requirements requires management to make judgements, estimates and assumptions that affect the application of accounting policies and the reported amounts of assets, liabilities, income and expenses. Actual results may differ from these estimates.
Estimates and underlying assumptions are reviewed on an ongoing basis. Revisions to accounting estimates are recognised in the period in which the estimates are revised and in any future periods affected.
Estimation of useful lives of assets
The company determines the estimated useful lives and related depreciation and amortisation charges for its property, plant & equipment and intangible assets. The useful lives could change significantly because of technical innovations or some other event. The depreciation and amortisation charge will increase where the useful lives are less than previously estimated lives, or technically obsolete or non-strategic assets that have been abandoned or sold will be written off or written down.
Employee benefits provision
The liability for employee benefits expected to be settled more than 12 months from the reporting date are recognised and measured at the present value of the estimated future cash flows to be made in respect of all employees at the reporting date In determining the present value of the liability, estimates of attrition rates and pay increases through promotion and inflation have been considered.
2. Basis of Preparation (continued)
(d) Use of judgement and estimates (continued) Lease agreements
-Critical judgement in identifying a lease
The Company has identified readily observable factors to determine whether a contract conveys the right to control the use of an identified asset for a period of time. Once a contract has been identified as having a lease, further analysis is conducted to ensure that it is correctly reflected in the financial statements.
-Critical judgement in determining the lease term
In determining the lease term, the Company considers all facts and circumstances that create an economic incentive to exercise an extension option or remain in a leased position. Extension options are only included in the lease term if the lease is reasonably certain to be extended.
-Critical judgement in determining components of a lease
In determining the components of a lease, the Company considers all facts and circumstance that distinguish between the different components of a lease as well as any services provided within the lease contract. Where non-lease components are found, they are accounted for separately from lease components and are based on their relative stand-alone selling price. Otherwise, non-lease components are bundled together with lease components as a single lease component.
-Critical judgement in determining the appropriate discount rate
In determining the appropriate discount rate, the Company considers all fact and circumstances surrounding the lease and whether it forms part of a portfolio of leases, the current economic environment in which the Company operates, the underlying nature of the lease asset, available resources and whether the impact on the financial statements is material or not.
The Company has also identified readily observable factors to determine if the rate should change due to changes in those underlying factors.
- Critical judgement in determining whether a sale and leaseback exists
In determining whether a sale of an asset has occurred, the Company needs to consider whether the transaction qualifies as a sale of an asset. Where the transaction qualifies as a sale, judgement is required in measuring the right of use asset that relates to the portion retained by the seller – lessee. The fair value of consideration received also needs to be established in this process. This is by reference to the present value of contractual payments for the lease at market rates.
Revenue recognition
Judgement is involved in determining whether grant agreements are enforceable and sufficiently specific and whether in the scope of AASB 1058 Income of Not-for-Profit Entities or AASB 15 Revenue from Contracts with Customers. Furthermore, where under AASB 15, consideration needs to be given to the point in time or time period over which grant revenue should be recognised. For grant revenue recognised over time, the Company uses the input method which is on the basis costs incurred relative to total costs expected in satisfying the Company’s performance obligation of the contract multiplied by the value of the contract. This involves estimates of total forecast contract costs.
Given the inherent nature of the unknown outcome for research projects, the knowledge and experience of the Company's managers and research staff is used in assessing the status of progress, the estimated recoverable amounts can be measured, and the associated judgement and estimates employed believed to be reasonable under the circumstances.
Costs and revenue estimates and judgement are reviewed and updated monthly, and more frequently as determined by events or circumstances. When it is probable that the total contract costs will exceed total contract revenue, the expected loss is recognised immediately
3. Material accounting policy information
The accounting policies set out below have been applied consistently for the period presented in these financial statements.
(a) Determination of fair values
A number of the Company’s accounting policies and disclosures require the determination of fair value, for both financial and non-financial assets and liabilities. When applicable, further information about the assumptions made in determining fair values is disclosed in the notes specific to that asset or liability.
(b)
Foreign currency transactions
Transactions in foreign currencies are translated to the functional currency of the Company at exchange rates at the dates of the transactions.
(c)
Revenue recognition
Certain Non-for-profit (NFP) transactions would only fall within the scope of AASB 15 – Revenue from Contracts with Customers, if the performance obligations are required by an enforceable contract, and they are ‘sufficiently specific’ to enable the NFP to determine when they have been satisfied. If the contract is enforceable and includes ‘sufficiently specific’ performance obligations, revenue will be recognised as performance obligations are satisfied, rather than when assets are received.
If contracts with customers or grants are concluded to be within the scope AASB 15 – Revenue from Contracts with Customers, revenue is recognised at an amount that reflects the consideration to which the Company is expected to be entitled in exchange for transferring goods or services to a customer. For each contract with a customer, the Company uses a 5-step recognition and measurement model for revenue recognition:
1. identifies the contract with a customer
2. identifies the performance obligations in the contract
3. determines the transaction price
4. allocates the transaction price to the separate performance obligations on the basis of the relative stand-alone selling price of each distinct good or service to be delivered
5. recognises revenue when or as each performance obligation is satisfied in a manner that depicts the transfer to the customer of the goods or services promised.
Variable consideration within the transaction price, if any, reflects concessions provided to the customer such as discounts, rebates and refunds, any potential bonuses receivable from the customer and any other contingent events. Such estimates are determined using either the 'expected value' or 'most likely amount' method.
The measurement of variable consideration is subject to a constraining principle whereby revenue will only be recognised to the extent that it is highly probable that a significant reversal in the amount of cumulative revenue recognised will not occur. The measurement constraint continues until the uncertainty associated with the variable consideration is subsequently resolved. Amounts received that are subject to the constraining principle are recognised as a refund liability.
If grants are assessed to fall within the scope of AASB 1058 - Income of Not-for-Profit Entities - income and expense are recognised immediately in the profit and loss statement as they are incurred.
Interest
Interest revenue is recognised as interest accrues using the effective interest method. This is a method of calculating the amortised cost of a financial asset and allocating the interest income over the relevant period using the effective interest rate, which is the rate that exactly discounts estimated future cash receipts through the expected life of the financial asset to the net carrying amount of the financial asset.
3. Material accounting policy information (continued)
(c) Revenue recognition (continued)
Other revenue
Other revenue is recognised when it is received or when the right to receive payment is established. Revenue from cane sales is recognised when ownership of cane transfers to the customer which is typically the point the cane is crushed.
Service Income
The Company entered into agreements with third parties to provide services that would benefit the Sugar industry. Services are recognised at the point in time when services are rendered.
(d) Employee benefits
(i) Defined contribution plans
A defined contribution plan is a post-employment benefit plan under which an entity pays fixed contributions into a separate entity and has no legal or constructive obligation to pay further amounts for example, a superannuation plan. Obligations for contributions to defined contribution plans are recognised as an employee benefit expense in the profit or loss in the periods during which related services are rendered by employees. Prepaid contributions are recognised as an asset to the extent that a cash refund or a reduction in future payments is available.
(ii) Short-term employee benefits
Short-term employee benefit obligations are measured on an undiscounted basis and are expensed as the related service is provided. A liability is recognised for the amount expected to be paid under short-term cash bonus if the Company has a present legal or constructive obligation to pay this amount as a result of past service provided by the employee and the obligation can be estimated reliably.
(iii)
Other long-term employee benefits
The Company’s net obligation in respect of long-term employee benefits is the amount of future benefit that employees have earned in return for their service in the current and prior periods. That benefit is discounted to determine its present value. The discount rate is the yield at the current reporting date on corporate bonds that have maturity dates approximating the terms of the Company’s obligations.
(iv) Termination benefits
Termination benefits are expensed at the earlier of when the Company can no longer withdraw the offer of those benefits and when the Company recognises costs for a restructuring. If benefits are not expected to be settled wholly within 12 months of the end of the reporting period, then they are discounted.
(e) Income tax
The Company is exempt from income tax under Division 50 of the Income Tax Assessment Act 1997, as amended. Under this division the Company is considered to be classified as an entity established for the purpose of promoting the development of various Australian resources, including agricultural resources and not carried on for the profit or gain of its individual members.
(f) Cash and cash equivalents
Cash and cash equivalents comprise cash balances and call deposits that are subject to an insignificant risk of change in fair value and are used by the Company in the management of its short-term commitments.
3. Material accounting policy information (continued)
(g) Financial instruments
Investment and other financial assets
Classification
The Company classifies its financial assets in the following measurement categories:
• Those measured subsequently at fair value (either through Other Comprehensive Income, or through profit or loss), and
• Those measured at amortised cost.
The classification depends on the Company’s business model for managing the financial assets and the contractual terms of the cash flows. For assets measured at fair value, gains and losses will either be recorded in profit or loss or Other Comprehensive Income.
The Company reclassifies debt investment when and only when its business model for managing those assets changes.
Measurement
At initial recognition, the Company measures a financial asset at its fair value plus, in the case of a financial asset not at fair value through profit or loss, transaction costs that are directly attributable to the acquisition of the financial asset.
Debt instruments: Subsequent measurement of debt instruments are done under the amortised cost method. This is based on the Company’s business model for managing asset and cash flow characteristics of the asset.
Assets that are held for collection on contractual cash flows where those cash flows represent solely payments of principal and interest are measured at amortised cost. Interest income from these financial assets is included in finance income using the effective interest rate method. Any gain or loss arising on derecognition is recognised directly in profit or loss and presented in other gains/(losses). Impairment losses are presented as separate line items in the statement of profit or loss.
(h) Property, plant and equipment
(i) Recognition and measurement
Items of property, plant and equipment are measured at cost less accumulated depreciation and accumulated impairment losses.
Cost includes expenditure that is directly attributable to the acquisition of the asset. The cost of self-constructed assets includes the following:
• the cost of materials,
• any other costs directly attributable to bringing the assets to a working condition for their intended use,
• when the Company has an obligation to remove the assets or restore the site, an estimate of the costs of dismantling and removing the items and restoring the site on which they are located.
Purchased software that is integral to the functionality of the related equipment is capitalised as part of that equipment.
When parts of an item of property, plant and equipment have different useful lives, they are accounted for as separate items (major components) of property, plant and equipment.
Any gains and losses on disposal of an item of property, plant and equipment (calculated as the difference between the net proceeds from disposal and the carrying amount of the item) is recognised in the profit or loss.
(ii) Subsequent costs
Subsequent expenditure is capitalised only when it is probable that the future economic benefits associated with the expenditure will flow to the Company. Ongoing repairs and maintenance are expensed as incurred.
3. Material accounting policy information (continued)
(h) Property, plant and equipment (continued)
(iii) Depreciation
Items of property, plant and equipment are depreciated from the date that they are installed and are ready for use, or in respect of internally constructed assets, from the date that the asset is completed and ready for use.
Depreciation is calculated to write off the cost of property, plant and equipment less their estimated residual values using the straight-line basis over their estimated useful lives. Depreciation is generally recognised in the profit or loss unless the amount is included in the carrying amount of another asset. Land is not depreciated.
The estimated useful lives for significant items of property, plant and equipment are as follows:
2024
2023
• buildings 5 - 50 years 5 - 50 years
• plant and equipment 3 - 40 years 3 - 40 years
• office equipment 2 - 15 years 2 - 15 years
Depreciation methods, useful lives and residual values are reviewed at each financial year-end and adjusted if appropriate.
(i) Intangible assets
(i) Research and development
Expenditure on research activities, undertaken with the prospect of gaining new scientific or technical knowledge and understanding, is recognised in the profit or loss as incurred.
Development activities involve a plan or design to produce new or substantially improved products and processes. Development expenditure is capitalised only if development costs can be measured reliably, the product or process is technically and commercially feasible, future economic benefits are probable, and the Company intends to, and has sufficient resources to, complete development and to use or sell the asset. The expenditure capitalised includes the cost of materials, direct labour and overhead costs that are directly attributable to preparing the asset for its intended use, and capitalised borrowing costs. Other development expenditure is recognised in the profit or loss as incurred.
Capitalised development expenditure is measured at cost less accumulated amortisation and any accumulated impairment losses.
(ii) Subsequent expenditure
Subsequent expenditure is capitalised only when it increases the future economic benefits embodied in the specific asset to which it relates. All other expenditure, including expenditure on internally generated goodwill and brands, is recognised in the profit or loss as incurred.
(iii) Amortisation
Intangible assets, less amount impaired, are amortised on a straight-line basis in the profit or loss over their estimated useful lives, from the date that they are available for use.
The estimated useful lives are as follows:
• Software
2024 2023
2 - 10 years
2 - 10 years
Amortisation methods, useful lives and residual values are reviewed at each financial year-end and adjusted if appropriate.
3. Material accounting policy information (continued)
(j) Impairment
(i) Non-derivative financial assets
A financial asset not classified at fair value through the profit or loss is assessed at each reporting date to determine whether there is objective evidence that it is impaired. A financial asset is impaired if there is objective evidence of impairment because of one or more events that occurred after the initial recognition of the asset, and that the loss event(s) had a negative effect on the estimated future cash flows of that asset that can be estimated reliably.
Objective evidence that financial assets are impaired includes default or delinquency by a debtor, restructuring of an amount due to the Company on terms that the Company would not consider otherwise, indications that a debtor or issuer will enter bankruptcy, adverse changes in the payment status of borrowers or issuers, economic conditions that correlate with defaults or the lack of presence of an active market.
Financial assets measured at amortised cost
The Company considers evidence of impairment for financial assets measured at amortised cost (loans and receivables and held-to-maturity financial assets) at both a specific asset and collective level. All individually significant assets are assessed for specific impairment. Those found not to be specifically impaired are then collectively assessed for any impairment that has been incurred but not yet identified. Assets that are not individually significant are collectively assessed for impairment by grouping together assets with similar risk characteristics.
In assessing collective impairment, the Company uses trends of the probability of default, timing of recoveries and the amount of loss incurred, adjusted for management’s judgement as to whether current economic and credit conditions are such that the actual losses are likely to be greater or lesser than suggested by trend analysis.
(ii) Non-financial assets
The carrying amounts of the Company’s non-financial assets are reviewed at each reporting date to determine whether there is any indication of impairment. If any such indication exists, then the asset’s recoverable amount is estimated. An impairment loss is recognised if the carrying amount of an asset cash-generating unit (CGU) exceeds its recoverable amount.
The recoverable amount of an asset or CGU is the greater of its value in use and its fair value less costs to sell. In assessing value in use, the estimated future cash flows are discounted to their present value using a pre-tax discount rate that reflects current market assessments of the time value of money and the risks specific to the asset. For impairment testing, assets are grouped together into the smallest group of assets that generates cash inflows from continuing use that are largely independent of the cash inflows of other assets or CGUs.
Impairment losses are recognised in the profit or loss. Impairment losses recognised in respect of CGUs are allocated to reduce the carrying amounts of assets in the CGU (or group of CGUs) on a pro rata basis.
An impairment loss is reversed only to the extent that the asset’s carrying amount does not exceed the carrying amount that would have been determined, net of depreciation or amortisation, if no impairment loss had been recognised.
(k) Provisions
A provision is recognised if, because of a past event, the Company has a present legal or constructive obligation that can be estimated reliably, and it is probable that an outflow of economic benefits will be required to settle the obligation. Provisions are determined by discounting the expected future cash flows at a pre-tax rate that reflects current market assessments of the time value of money and the risks specific to the liability. The unwinding of the discount is recognised as a finance cost.
3. Material accounting policy information (continued)
(l) Leases
The Company has entered into several lease arrangements primary covering properties, motor vehicles and some office equipment.
AASB 16 requires all leases to be recognised on the Balance Sheet unless the underlying asset is of low value or the lease has a term of 12 months or less. The Company recognises a ‘right-of-use asset’ representing its right to use leased assets and a ‘lease liability’, measured as the present value of future lease payments. The income statement includes depreciation of the right-of-use asset and any interest expense on the lease liability over the lease term.
Payments associated with short-term lease and leases of low-value assets are recognised on a straight-line basis as an expense in the profit or loss. Short term leases are leases with a term of 12 months or less. Low-value assets primarily comprise office equipment.
The Company has not elected to measure right of use asset at initial recognition at fair value for leases that have significantly below market terms and conditions principally to enable the Company to further its objectives.
Extension Options
Extension options are included in several property and equipment leases across the Company. The terms are used to maximise operational flexibility in terms of managing contracts. All extension options held are exercisable by the Company and not the respective lessor.
Sale and Lease back
A sale and leaseback transaction occurs when the Company enters into a contract to sell an asset and lease it back from the buyer, and the transaction qualifies as a sale. Where the transaction qualifies as a sale the Company will de-recognise the asset and apply the lease accounting requirements, measure the right of use asset as the retained portion of the previous carrying value and record again a loss on the rights transferred to the lessor. Where the transaction does not qualify as a sale the Company will continue recognition of the asset with the amounts received recorded as a financial liability.
(m) New or amended Accounting Standards and Interpretations adopted
The Company has adopted all of the new or amended Accounting Standards and Interpretations issued by the Australian Accounting Standards Board ('AASB') that are mandatory for the current reporting period.
The adoption of these Accounting Standards and Interpretations did not have any significant impact on the financial performance or position of the Company.
Any new or amended Accounting Standards or Interpretations that are not yet mandatory have not been early adopted These are not expected to have a material impact on the Company.
(n) Current and non-current classification
Assets and liabilities are presented in the statement of financial position based on current and non-current classification.
An asset is classified as current when: it is either expected to be realised or intended to be sold or consumed in the Company’s normal operating cycle; it is held primarily for the purpose of trading; it is expected to be realised within 12 months after the reporting period; or the asset is cash or cash equivalent unless restricted from being exchanged or used to settle a liability for at least 12 months after the reporting period. All other assets are classified as non-current.
A liability is classified as current when: it is either expected to be settled in the Company’s normal operating cycle; it is held primarily for the purpose of trading; it is due to be settled within 12 months after the reporting period; or there is no unconditional right to defer the settlement of the liability for at least 12 months after the reporting period. All other liabilities are classified as non-current.
(o) Contract assets
Contract assets are recognised when the Company has transferred goods or services to the customer but where the Company is yet to establish an unconditional right to consideration. Contract assets are treated as financial assets for impairment purposes.
3. Material accounting policy information (continued)
(p) Contract liabilities
Contract liabilities represent the Company’s obligation to transfer goods or services to a customer and are recognised when a customer pays consideration, or when the Company recognises a receivable to reflect its unconditional right to consideration (whichever is earlier) before the Company has transferred the goods or services to the customer.
(q) Goods and Services Tax ('GST') and other similar taxes
Revenues, expenses and assets are recognised net of the amount of associated GST, unless the GST incurred is not recoverable from the tax authority. In this case it is recognised as part of the cost of the acquisition of the asset or as part of the expense
Receivables and payables are stated inclusive of the amount of GST receivable or payable. The net amount of GST recoverable from, or payable to, the tax authority is included in other receivables or other payables in the statement of financial position.
Cash flows are presented on a gross basis. The GST components of cash flows arising from investing or financing activities which are recoverable from, or payable to the tax authority, are presented as operating cash flows.
Commitments and contingencies are disclosed net of the amount of GST recoverable from, or payable to, the tax authority.
(r) Comparatives
Where necessary, comparative information has been reclassified and repositioned for consistency with current year disclosures.
4. Revenue from operating activities
Levy Funds and Matching Payments
(i) Industry contribution and Commonwealth matching contribution
A statutory funding contract is in place between the Commonwealth Government of Australia (Commonwealth) and Sugar Research Australia Limited. This agreement establishes terms on which the Commonwealth remits industry contributions toward research and development to the Company. This is recognised monthly on the cane crushed in that month.
The agreement also establishes the terms for Commonwealth matching contributions. Commonwealth matching contribution matches industry contribution dollar for dollar to a maximum level of 0.5% of the gross annual value of production of the sugar industry, provided conditions of the agreement are met. Revenue from the Commonwealth matching contributions are recognised based on the gazetted Gross Value of Production for the season.
(ii) Commonwealth government grant income
The Company has entered into Commonwealth Grant Agreements to fund collaborative research and development projects to support continued innovation in Australia’s primary industries.
Revenue amounting to $15,361 (2023: $125,000) relates to contracts without sufficiently specific performance obligations. Accordingly, this revenue has been recognised at a point in time during the financial year.
The remaining contracts have been assessed to be enforceable and sufficiently specific and revenue is recognised over time as performance obligations are satisfied. Revenue is recognised using the input method, based on the entity’s costs incurred to satisfy performance obligations relative to the total expected costs to complete the project.
If grant funding is received before the company satisfies these performance obligations, the grant will be recognised in the statement of financial position as a contract liability (Note 13) until those performance obligations are met. Conversely, if performance obligations are satisfied by the company prior to receipt of grant funds, these costs incurred are recorded as contract assets (Note 10).
(iii) Queensland government income
The company entered into grant deed agreements with Queensland government to co-invest and facilitate research and development project activity that aligns to objectives of the Department of Agriculture and Fisheries Strategic Plan.
These contracts have been assessed to be enforceable and sufficiently specific and revenue is recognised over time as performance obligations are satisfied. Revenue is recognised using the input method, based on the entity’s costs incurred to satisfy performance obligations relative to the total expected costs to complete the project.
If grant funding is received before the company satisfies these performance obligations, the grant will be recognised in the statement of financial position as a contract liability (Note 13) until those performance obligations are met. Conversely, if performance obligations are satisfied by the company prior to receipt of grant funds, these costs incurred are recorded as contract assets (Note 10).
4. Revenue from operating activities (continued)
(iv) Collaboration income
Collaboration income are contributions received from third parties where the Company is collaborating with them to achieve project objectives.
Revenue amounting to $77,832 (2023: $860,640), relates to contracts without sufficiently specific performance obligations. Accordingly, this revenue has been recognised at a point in time during the financial year.
The remaining contracts have been assessed to be enforceable and sufficiently specific and revenue is recognised over time as performance obligations are satisfied. Revenue is recognised using the input method, based on the entity’s costs incurred to satisfy performance obligations relative to the total expected costs to complete the project.
If grant funding is received before the company satisfies these performance obligations, the grant will be recognised in the statement of financial position as a contract liability (Note 13) until those performance obligations are met. Conversely, if performance obligations are satisfied by the company prior to receipt of grant funds, these costs incurred are recorded as contract assets (Note 10).
(v) Services income
The Company entered into agreements with third parties to provide services that would benefit the Sugar industry
5. Other revenue
(*) During the 2023 year, the Company entered an arrangement for a leaseback from a sale of property in Brisbane. This resulted in a profit on sale of $11,736,674 and a gain on leaseback of $325,666 recorded in Sundry Income.
6. Operating expenses
7. Leases
During 2023, the Company has entered into an agreement to lease office space in the Brisbane CBD for a period of five years with an option for a new lease for another three years. The extension option has not been included in the lease term. On renewal, the terms of the new lease are to be the same as the original lease except for minor amendments relating to lease payments, rent review and dates of the new lease.
Lease payments during the lease are to be reviewed annually and increase by a fixed percentage. The agreement has required the Company to provide a bank guarantee for the term of the lease.
The Company also lease two properties with 10-year terms.
The Company also leases motor vehicles most of which have a term of five years.
8. Cash and cash equivalents
Cash and cash equivalents consist of cash on hand and balances with banks, and investments in on call term deposits. Cash and cash equivalents included in the statement of cash flows comprise the following amounts in the statement of financial position:
Cash restriction
Restricted cash relates to contract liabilities (see note 13) for unspent grant funds.
11. Property, plant and equipment (continued)
12. Intangible assets
Accumulated amortisation and impairment losses
13.
As at 30 June 2024 there were no intangible assets under construction (2023: nil).
Impairment charge
In the year ended 30 June 2024, there was no impairment charge.
Plant breeders’ rights (PBR’s), with a fair value of $8,900,000 were acquired on 2 August 2013 as part of a business combination involving the acquisition of most activities of BSES Limited by the Company.
The Company has assessed the recoverable amount of PBR on 2 August 2013 to be nil. The PBRs were acquired as part of the business combination and transfer of assets from BSES Limited. The main source of funding of the Company is the receipt of a Statutory Levy and as a result there are no cash flows from PBR’s in the Company and an $8,900,000 impairment loss has been recognised in the statement of profit or loss and other comprehensive income in the period 8 May 2013 to 30 June 2014.
13. Trade and other payables
14. Employee benefits
Defined contribution superannuation plans
The Company has paid contributions of $1,819,681 (30 June 2023: $1,606,000) to defined contributions plans on behalf of employees for the reporting period.
15. Contingencies and commitments
The Company has outstanding milestone commitments of $6,936,000 (2023: $3,677,000) as at 30 June 2024
16. Capital and reserves
The Company is a company limited by guarantee, and as such, does not have share capital. The Company’s capital consists of financial assets and retained earnings.
Membership is divided into grower members (group G) and miller members (group M).
At the reporting date there were 2,430 (2023: 2,645) group G members and 9 (2023: 9) group M members guaranteeing to contribute up to $2.00 each to the property of the Company in the event of it being wound up.
17. Related parties
During the year ended 30 June 2024, the Company did not enter into transactions with related parties (2023: nil).
Also refer to note 19 in relation to director’s fees paid under a Director Service Agreement.
Any transactions were conducted on an arm’s length basis and on normal commercial terms.
No amounts remain outstanding or as commitments as at 30 June 2024 (2023: nil)
Auditor of the company: Audit of the financial statements
(*) Other services includes internal grant audits (22/23)
19. Key management personnel compensation
The aggregate compensation made to Directors and members of key management personnel of the Company was $3,105,437 (2023: $3,287,643) Two of SRA’s Directors receive their directors’ fees via a Director Service Agreement These agreements are with Winagri Pty Ltd and Micketymulga Agribusiness Pty Ltd.
20. Events occurring after the reporting date
The financial report was authorised for issue on 27 August 2024 by the Board of Directors.
No matters or circumstances have arisen since the end of the financial year which significantly affected or could significantly affect the operations of the Company, the results of those operations or the state of affairs of the Company in future financial years.
Consolidated Entity Disclosure Statement
As at 30 June 2024
Sugar Research Australia Ltd is not required by Australian Accounting Standards to prepare consolidated financial statements.
In accordance with subsection 295(3A) of the Corporations Act 2001, no further information is required to be disclosed in this consolidated entity disclosure statement.
Directors’ declaration
In the opinion of the directors of Sugar Research Australia Limited:
(a) the financial statements and notes that are set out on pages 11 to 33 are in accordance with the Corporations Act 2001, including:
(i) giving a true and fair view of the Company’s financial position as at 30 June 2024 and of its performance, for the financial period ended on that date; and
(ii) complying with Australian Accounting Standards – Simplified Disclosure and the Corporations Regulations 2001; and
(b) there are reasonable grounds to believe that the Company will be able to pay its debts as and when they become due and payable.
(c) the information disclosed in the attached consolidated entity disclosure statement is true and correct
Signed in accordance with a resolution of the directors:
Dated at Brisbane, 27th day of August 2024.
Rowena McNally
Gavin Whiteley Chair Director
Level 38, 345 Queen Street
Brisbane, QLD 4000
+61 7 3222 8444
pitcher.com.au
The Directors Sugar Research Australia Limited
Level 10, Suite A
300 Queen Street Brisbane QLD 4000
Auditor’s Independence Declaration
In relation to the independent audit for the year ended 30 June 2024, to the best of my knowledge and belief there have been:
(i) no contraventions of the auditor independence requirements of the Corporations Act 2001 ; and
(ii) no contraventions of APES 110 Code of Ethics for Professional Accountants (including Independence Standards).
PITCHER PARTNERS
ANDREW ROBIN Partner
Brisbane, Queensland 27th August 2024
Independent Auditor’s Report to the Members of Sugar Research Australia Limited
Report on the Audit of the Financial Report
Opinion
We have audited the financial report of Sugar Research Australia Limited (“the Company”), which comprises the statement of financial position as at 30 June 2024, the statement of comprehensive income, the statement of changes in equity and the statement of cash flows for the year then ended, and notes to the financial statements including material accounting policy information, the consolidated entity disclosure statement and the directors’ declaration.
In our opinion, the accompanying financial report of Sugar Research Australia Limited, is in accordance with the Corporations Act 2001, including:
(a) giving a true and fair view of the Company’s financial position as at 30 June 2024 and of its financial performance for the year then ended; and
(b) complying with Australian Accounting Standards – Simplified Disclosures and the Corporations Regulations 2001
Basis for Opinion
We conducted our audit in accordance with Australian Auditing Standards. Our responsibilities under those standards are further described in the Auditor’s Responsibilities for the Audit of the Financial Report section of our report. We are independent of the Company in accordance with the auditor independence requirements of the Corporations Act 2001 and the ethical requirements of the Accounting Professional and Ethical Standards Board’s APES 110 Code of Ethics for Professional Accountants (including Independence Standards) (“the Code”) that are relevant to our audit of the financial report in Australia. We have also fulfilled our other ethical responsibilities in accordance with the Code.
We confirm that the independence declaration required by the Corporations Act 2001, which has been given to the directors of the Company, would be in the same terms if given to the directors as at the time of this auditor’s report.
We believe that the audit evidence we have obtained is sufficient and appropriate to provide a basis for our opinion.
Other Information
The directors are responsible for the other information. The other information comprises the information included in the Company’s directors’ report which was obtained as at the date of our audit report, and any additional other information included in the Company’s annual report for the year ended 30 June 2024, but does not include the financial report and our auditor’s report thereon. The Company’s annual report is expected to be made available to us after the date of this auditor's report.
Our opinion on the financial report does not cover the other information and accordingly we do not express any form of assurance conclusion thereon.
In connection with our audit of the financial report, our responsibility is to read the other information and, in doing so, consider whether the other information is materially inconsistent with the financial report or our knowledge obtained in the audit or otherwise appears to be materially misstated.
If, based on the work we have performed on the other information obtained prior to the date of this auditor’s report, we conclude that there is a material misstatement of this other information, we are required to report that fact. We have nothing to report in this regard.
When we read the annual report, if we conclude that there is a material misstatement therein, we are required to communicate the matter to the directors and use our professional judgment to determine the appropriate action to take.
Responsibilities of the Directors for the Financial Report
The directors of the Company are responsible for the preparation of:
(a) the financial report (other than the consolidated entity disclosure statement) that gives a true and fair view in accordance with Australian Accounting Standards – Simplified Disclosures and the Corporations Act 2001;
(b) the consolidated entity disclosure statement that is true and correct in accordance with the Corporations Act 2001; and
(c) for such internal control as the directors determine is necessary to enable the preparation of:
(i) the financial report (other than the consolidated entity disclosure statement) that gives a true and fair view and is free from material misstatement, whether due to fraud or error; and
(ii) the consolidated entity disclosure statement that is true and correct and is free of misstatement, whether due to fraud or error.
In preparing the financial report, the directors are responsible for assessing the Company’s ability to continue as a going concern, disclosing, as applicable, matters related to going concern and using the going concern basis of accounting unless the directors either intend to liquidate the Company or to cease operations, or have no realistic alternative but to do so.
Auditor’s Responsibilities for the Audit of the Financial Report
Our objectives are to obtain reasonable assurance about whether the financial report as a whole is free from material misstatement, whether due to fraud or error and to issue an auditor’s report that includes our opinion. Reasonable assurance is a high level of assurance, but is not a guarantee that an audit conducted in accordance with the Australian Auditing Standards will always detect a material misstatement when it exists. Misstatements can arise from fraud or error and are considered material if, individually or in the aggregate, they could reasonably be expected to influence the economic decisions of users taken on the basis of this financial report.
As part of an audit in accordance with the Australian Auditing Standards, we exercise professional judgement and maintain professional scepticism throughout the audit. We also:
Identify and assess the risks of material misstatement of the financial report, whether due to fraud or error, design and perform audit procedures responsive to those risks, and obtain audit evidence that is sufficient and appropriate to provide a basis for our opinion. The risk of not detecting a material misstatement resulting from fraud is higher than for one resulting from error, as fraud may involve collusion, forgery, intentional omissions, misrepresentations, or the override of internal control.
Obtain an understanding of internal control relevant to the audit in order to design audit procedures that are appropriate in the circumstances, but not for the purpose of expressing an opinion on the effectiveness of the Company’s internal control.
Evaluate the appropriateness of accounting policies used and the reasonableness of accounting estimates and related disclosures made by the directors.
Conclude on the appropriateness of the directors’ use of the going concern basis of accounting and, based on the audit evidence obtained, whether a material uncertainty exists related to events or conditions that may cast significant doubt on the Company’s ability to continue as a going concern. If we conclude that a material uncertainty exists, we are required to draw attention in our auditor’s report to the related disclosures in the financial report or, if such disclosures are inadequate, to modify our opinion. Our conclusions are based on the audit evidence obtained up to the date of our auditor’s report. However, future events or conditions may cause the Company to cease to continue as a going concern.
Evaluate the overall presentation, structure and content of the financial report, including the disclosures, and whether the financial report represents the underlying transactions and events in a manner that achieves fair presentation.
We communicate with the directors regarding, among other matters, the planned scope and timing of the audit and significant audit findings, including any significant deficiencies in internal control that we identify during our audit.
PITCHER PARTNERS
ANDREW ROBIN Partner
Brisbane, Queensland 27th August 2024
RESEARCH INVESTMENT 2023/24 PORTFOLIO BALANCE SUMMARY
SRA’s research investment portfolio for 2023/24 includes 78 RD&A activities consisting of grant projects, programs and services, and district events and initiatives. Total operating expenditure was $37.9 million.
SRA has designed a balanced portfolio that includes an appropriate mix of RD&A activities. Investment allocation is based on several key factors, including industry and government priorities, SRA’s strategic objectives, the time and risk required to deliver research outputs, the impact on industry and regional communities, district of benefit, cost, and the funding priorities of research partners.
In 2023/24, the allocation of contestable RD&A investment took into account the mix of previously contracted activities. Notional targets were set for new grant projects to address gaps in the portfolio through the 10th Anniversary Research Fund Call to be contracted in 2024/25. Of the total $16 million provided by the Fund Call, over three to four years, investment allocation included, but were not limited to, the following:
• $2 million allocated for research to advance the industry vision and roadmap, Sugar Plus – Fuelling the Future of Food, Energy and Fabrication. Investment will consider opportunities for diversified revenue streams beyond raw sugar such as bioenergy, sustainable aviation fuels, carbon credits, and the wider bioeconomy.
• $2 million allocated for co-investment with other RDCs for research supporting industry and Australian Government priorities such as biosecurity, climate adaptability, cropping systems, and soils.
• $2 million allocated to addressing future research workforce needs such as higher degree by research positions.
• $2-3 million to co-invest in research that addresses objectives shared by SRA and the Queensland Government’s Department of Agriculture and Fisheries.
• $1 million for ambitious “moonshots” research that aims to explore challenging, high risk, and innovative research questions with potential to transform the industry.
• $0.5 million to collaborate with industry to investigate the feasibility of a centre of excellence in milling research.
Allocation of core RD&A investment was determined based on the aforementioned factors and most importantly, priorities identified by industry and government stakeholders.
The charts below illustrate allocation of RD&A investment across key dimensions. Additional charts, including allocation by Australian Government priorities, are reported on page 98.
$12.5M
Early Stage (TRLs 1-3) Mid Stage (TRLs 4-6)
Late Stage (TRLs 7-9)
The total expenditure on RD&A activities, where TRLs can be applied, is $21.9M. The chart excludes $16.1M spent on other RD&A activities, and corporate support, governance, and strategic initiatives.
SRA uses TRLs to assess the maturity of technologies for deployment to industry. This chart reports the target TRL for RD&A activities.
Early-stage technologies have a long delivery time requiring ongoing investment to be validated in experimental and commercial environments before deployment. They are defined as high risk in terms of technology feasibility.
Mid-stage technologies have a medium delivery time requiring further investment to be validated in commercial environments before deployment. They are defined as medium risk.
Late-stage technologies have a short delivery time and are often already deployed or soon to be available as products. They typically require minimal investment and are considered low risk due to their commercial demonstration.
Excluding $12.5M expenditure on corporate support, governance, and strategic initiatives.
Allocation by district is estimated based on the district expected to receive the research output upon deployment. Most RD&A activities benefit multiple districts. In such cases, investment allocation is distributed across districts according to the extent of current and planned activities.
INCOME AND EXPENDITURE SUMMARY
In 2023/2024, SRA invested $25.4 million in the delivery of RD&A activities. This includes direct investment in contestable grant projects, core programs and services such as plant breeding and disease screening laboratories, and district productivity plan activities. Total expenditure on corporate activities was $12.5 million covering all overheads including, but not limited to, assets and facilities, information technology, human resources, health and safety, and risk and compliance, as well as governance and strategic initiatives.
SRA’s income streams consist of a levy from sugarcane produced and processed within Australia paid by growers and millers, matched by a contribution from the Commonwealth Government for investment in research, development, and adoption activities as per the Statutory Funding Contract 2021-2031 between SRA
and the Commonwealth acting through the Department of Agriculture, Fisheries and Forestry. SRA also receives funding from co-investment partners including, but not limited to, the Department of Agriculture and Fisheries, the Queensland Department of Environment and Science, and the Great Barrier Reef Foundation.
The quantum of funding allocated to contestable RD&A activities in 2023/24 was $4.3 million representing approximately 14% of income from industry investment, and co-investment by the Commonwealth and Queensland governments. This figure is lower than expected because investment in new contestable projects, with up to $16M in additional investment, from SRA’s 10th Anniversary Research Fund Call was scheduled for announcement in 2024/25.
INVESTMENT ALLOCATION BY PRIORITIES
Allocation of RD&A investment in 2023/24 is reported below by Strategic Pillars.
$4.6M (12%)
$12.5M (33%)
Allocation by Strategic Pillar Total: $37.9M
$4.2M (11%)
$4.8M (13%)
A high-performing research portfolio
Translation Capability
World-class sugarcane varieties
Growing research and delivery capacity
Foundations
$11.7M (31%)
ALIGNMENT TO STRATEGIC OBJECTIVES
Allocation of RD&A investment by Australian Government priorities are reported below.
$0.8M (3%)
Allocation by Priorities of the Minister for Agriculture, Fisheries & Forestry & Emergency Management
Total: $25.4M
$14.6M (57%)
$0.3M (1%)
$5.4M (21%)
$4.8M (19%)
Allocation by National Agriculture Innovation Priorities Total: $25.4M
$2.4M (9%)
$1.9M (7%)
$4.9M (19%)
Allocation by Science and Research Priorities
Total: $25.4M
$4.9M (19%)
Biosecurity
Climate change and sustainability Trade
First Nations engagement Workforce
$5.2M (21%)
$14.9M (59%)
Excluding $12.5M expenditure on corporate support, governance, and strategic initiatives.
$16.3M (64%)
Trusted exporter of premium food and agricultural products
Champion climate resilience
World leader in preventing and rapidly responding to significant pests and diseases through future-proofing our biosecurity system
Mature adopter, developer and exporter of digital agriculture
Excluding $12.5M expenditure on corporate support, governance, and strategic initiatives.
Food
Soil and water Transport Cybersecurity Energy Resources Advanced manufacturing Environmental change Health
Excluding $12.5M expenditure on corporate support, governance, and strategic initiatives.
STATUTORY FUNDING AGREEMENT REPORTING
GUIDELINES FOR STATUTORY FUNDING AGREEMENT: KEY PERFORMANCE INDICATORS
The Guidelines for the Statutory Funding Agreement 2021-2031 between SRA and the Australian Government acting through the Department of Agriculture, Fisheries and Forestry (DAFF) include five interlinked Performance Principles, each with several Key Performance Indicators (KPIs), including stakeholder engagement, Research, Development and Adoption (RD&A) activities, collaboration, governance, and monitoring and evaluation.
STAKEHOLDER ENGAGEMENT
Strategy prioritisation and development processes include appropriate consultation plans, based on the Best practice guide to stakeholder engagement.
SRA’s Engagement and Consultation Plan was developed and implemented to align our strategy prioritisation and development processes with DAFF’s Best Practice Guide to Stakeholder Engagement . The plan guides our interactions with stakeholders, supporting our vision, purpose, and strategy.
In response to the Independent Performance Review 2023/24 , we have begun updating the plan to include our annual consultative process with stakeholders on research priorities and investment allocation, and reporting.
Demonstrated stakeholder engagement in the identification of RD&A priorities and activities consistent with the Best Practice Guide to Stakeholder Engagement.
In 2023/24, we conducted extensive consultations with industry and government stakeholders to determine RD&A priorities and activities. Key highlights include:
• In September we held roundtable discussions with millers to identify milling and processing priorities to be included in our Ten-Year R&D Plan 2024-2034.
• From December to February, our District Managers engaged with growers, millers, and other industry stakeholders to identify regional productivity constraints and investment priorities.
• In March, we held our inaugural R&D Showcase and Feedback Session, where we presented our draft Ten-Year R&D Plan 2024-2034 and gathered feedback from industry and government representatives, millers, and growers about the priorities included in the plan before publishing a final version in June.
• From March to April, we facilitated our Regional Variety Committees to manage new variety releases and maintain recommended variety lists within each sugarcane biosecurity zone, involving growers, millers, and other industry stakeholders in this process.
Demonstrated incorporation of stakeholder feedback on RD&A priorities and activities.
In March, during the R&D Showcase and Feedback Session, we gathered input from stakeholders on the research priorities outlined in our draft Ten-Year R&D Plan 2024-2034. We documented this feedback along with outlining how we incorporated it into the final version of the plan, which was released in June. We shared this document with our stakeholders in July and it is available on our website.
RESEARCH, DEVELOPMENT AND ADOPTION ACTIVITIES
RDC investments align with strategic plans and have demonstrated outcomes to levy payers and taxpayers, including through growth in the industry, increased profitability of producers, commercialisation, or access to new markets. In 2023/24, all RD&A activities aligned with the outcomes detailed in SRA’s research missions in the Strategic Plan and government and industry priorities and outcomes (see page 97 and 98).
Total expenditure on delivering RD&A activities was $37.9 million. SRA balances its research portfolio based on time to delivery and technology feasibility risk. Refer to our Portfolio Balance on page 93 for more information.
Of levy payers who participated in RDC supported extension and adoption programs: The majority (over half) have gained new knowledge or new information to improve their long-term profitability, productivity, competitiveness and preparedness.
In 2023/24, 89% of levy payers and industry stakeholders who attended SRA led training and adoption activities reported satisfaction with knowledge to improve their business profitability, productivity, and preparedness (average score of 7.6 on a scale of 0-10, a decrease of 0.4 from the previous year).
Of levy payers who participate in RDC supported extension and adoption programs: The majority (over half) intend to make or have made changes to existing practices by adopting the outcomes of R&D.
In 2023/24, 51% of levy payers and industry stakeholders reported adopting or planning to adopt SRA-developed products or practices, down from 69% the previous year. Additionally, 24% indicated they intend to implement changes but have no plans in place yet.
COLLABORATION
Completed, current and future R&D including commercialisation opportunities is accessible through the growAG platform.
In 2023/24, 68% of projects managed by SRA, and were active during the reporting period, were accessible through the growAG platform. Of those funded by SRA, 79% were displayed, a decrease from 92% from the previous year.
Number and quantum of cross-industry and cross-sector RD&A investments available.
In 2023/24, SRA collaborated with other RDCs on five cross-sectoral RD&A investments, a decline from eight from the previous year. Total quantum of cash investment by SRA was $0.7 million.
Number and quantum of RD&A projects and commercialisation projects listed on growAG, including commercialisation outcomes.
In 2023/24, 77 projects funded or managed by SRA were reported on growAG, the same number as the previous year.
GOVERNANCE
Ongoing oversight, planning and reporting of investment activities is done in accordance with legislative and Australian Government requirements and timeframes.
In 2023/24, SRA reported nil breaches and related actions in accordance with legislative and Australian Government requirements, reflecting no change from the previous year.
Demonstrated management of financial and nonfinancial risk.
In 2023/24, SRA commissioned Pitcher Partners to complete an external financial audit that reported no material findings. In addition, SRA appointed Deloitte to complete three internal audits to improve risk management of areas including Contract Management, Research Procurement and Payroll. SRA is now implementing recommendations from these reviews and is undertaking another three reviews during 2024/25.
SRA also has financial and non-financial policies and procedures, codes of conduct, and charters in place for governance and risk management. In addition to SRA’s Board, there are four established committees to monitor risk including the Audit and Risk Committee, People, Performance & Remuneration Committee, Research Funding Panel and Director Selection Committee.
Relevant policies and procedures adopted and implemented (whistle-blower, privacy etc).
SRA’s Code of Conduct contains principles and standards of conduct which are based on SRA’s values and represents our commitment to uphold ethical business practices and meet applicable legal requirements. The Code of Conduct is supported by governance policies to guide how SRA does business and outline expected standards of behaviour, including, but not limited to, the Board Governance Policy, Diversity Policy, Compliance Policy, and Whistle-blower Policy.
Non-financial resources implemented effectively (Human resources, IT, IP etc).
SRA employs contemporary best practices to ensure non-financial resources related to human resources are implemented effectively. These include workforce diversity targets in the Strategic Plan, routine benchmark reporting with the Workplace Gender Equality Agency, employee engagement and culture measurement, and routine monitoring and response to legislative changes.
MONITORING AND EVALUATION
Impact (cost-benefit) assessment of a random sample of RD&A investments undertaken annually.
In 2023/24, impact assessments using benefit-cost analysis were completed on five RD&A projects funded by SRA and DAF. Results suggest these projects delivered net benefits in the order of $7.3 million to the Australian sugarcane industry and a positive benefit cost ratio (BCR) of 3.2, demonstrating moderate effectiveness and efficiency in delivering economic impacts to industry.
Projects assessed include Managing Climate Variability: Forewarned is Forearmed, Smarter Irrigation for Profit Phase 2, Biorefineries for Profit Phase 2, Australian Sugarcane Industry Soil Health Benchmarking in Central and Wet Tropics Regions of Queensland, and PreCommercial Development, Testing and Validation of RSD LAMP Assay for Sugar Mill Out. Total investment by SRA and DAF across the five projects was $3.3 million in present value terms (SRA $2.3M and DAF $1M). The table on the following page reports a summary of key measures for the five projects.
Table 1 Results Summary
2017/901 Managing Climate Variability – Forewarned is Forearmed
2019/901 Smarter Irrigation for Profit – Phase 2
2019/902 Biorefineries for Profit – Phase 2 (Rural R&D for Profit)
2019/903 and 2019/904 Australian Sugarcane industry soil health benchmarking in Central and Wet Tropics regions of Queensland
• Avoided losses from weather and climate extremes
• Adoption of irrigation practices that leads to improvements in on-farm productivity
• Lower electricity costs from lower water pumping needs
• Lower carbon emissions resulting from lower water pumping needs
• Lower water use
• Producing livestock feed from treated bagasse
• Producing probiotics for use by pig enterprises
• Increased farm profitability through use of fallow land for legume crops
• Increased farm profitability through use of reduced tillage practices
• Increased farm profitability through use of controlled traffic practices
• Lower fertiliser costs through the use of fallow land for mixed species cover crops
• Reduced nutrient runoff
• Lower greenhouse gas emissions
• Reduced sediment loss
2021/002 Pre-commercial development, testing and validation of RSD LAMP assay for sugar mill roll-out
• Avoided losses from Ratoon Stunting Disease
Key findings highlight the need for better data collection planning at the start of projects, enhanced monitoring of project activities and outputs to ensure extension efforts are adequate and adjusted as needed, ensuring all research projects are supported by a strong program logic that outlines the adoption pathway and standardised outcomes, and improved data collection to measure environmental and social benefits. In response, SRA has implemented improvements during 2023/24 with more actions scheduled for 2024/25.
Demonstrated consideration of and response to outcomes of monitoring and evaluation processes.
In 2023/24, results from completed assessments were reported to staff to inform learning and improvement and communicated to levy payers and industry stakeholder via SRA communications. Moreover, in response to feedback from industry surveys, SRA undertook several actions to build engagement and increase familiarity
with our research plans and portfolio by industry stakeholders, and to disseminate clear and practical information about new research activities.
Transparent communication to stakeholders (including government) on the impacts and benefits of the RD&A activities.
Results from our surveys were published in the Cane Matters Summer 2023/24 edition. Feedback from levy payers included satisfaction with our performance, advocacy for our products, services, research information, and satisfaction with staff and the research portfolio. Survey reports completed in 2023 have also been published on our website for transparency.
Case studies of impact assessments of RD&A projects funded by SRA were not published during the period due to scheduling and the publication of multiple case studies in late 2022/23. However, findings from new evaluations will be included in 2024/25 publications.
ANNUAL REPORTING REQUIREMENTS IN THE STATUTORY FUNDING AGREEMENT
Under SRA’s Statutory Funding Agreement 2021-2031, the following items must be included in SRA’s Annual report 2022/23. This table provides a cross-reference on where to locate the relevant information throughout the report.
ITEM REQUIREMENT
a Sources of income allowing for separate identification of Levy Funds, Matching Payments and Voluntary Contributions
b Significant R&D activities and transactions undertaken in the year in the conduct of SRA’s functions as the Industry services body
c The full cost of the R&D Activities
d Progress made in implementing the Strategic Plan and Performance Principles including progress against any key performance indicators
LOCATION IN ANNUAL REPORT
Income and expenditure summary – p95-96 Financial statements – p65-92
Strategic pillars 1-4 and our Foundations – p21-57 Research missions 1-5 – p29-54
Income and expenditure summary – p95-96
Research missions 1-5 – p29-54
Statutory Funding Agreement Reporting – p99-104
e Key RD&A deliverables and associated outcomes achieved Strategic pillars 1-4 and our Foundations – p21-57 Research missions 1-5 – p29-54
f An assessment of the efficiency and effectiveness of SRA’s investments
g Material changes to SRAL’s membership
h How SRA responded to any directions made under the Act or Rural Research and Development Priorities given by the Minister under the Agreement or the Guidelines
i Consultation with Levy Payers and Industry Representative Organisations on: SRAL’s Strategic Plan; and RD&A
j SRAL’s contributions to relevant sugar industry sectoral and cross sectoral strategies, including strategies under the National Primary Industries Research Development and Extension Framework
k Details of senior executive and Board remuneration in the format required by the relevant Australian Accounting Standards
l Research and Developments agreements entered into by SRAL with third parties
m Corporate governance practices in place during the Financial Year
n The rationale for the mix of projects included in the Balanced Portfolio
Statutory Funding Agreement Reporting – p99-104
No material change recorded in 2023/24
More information is reported in the Director’s Report – p59-64