PLAYGROUNDS NATIONAL STUDY OF
THE INFLUENCE OF DESIGN ON USE AND PHYSICAL ACTIVITY IN 60 PLAYGROUNDS IN 10 US CITIES
2
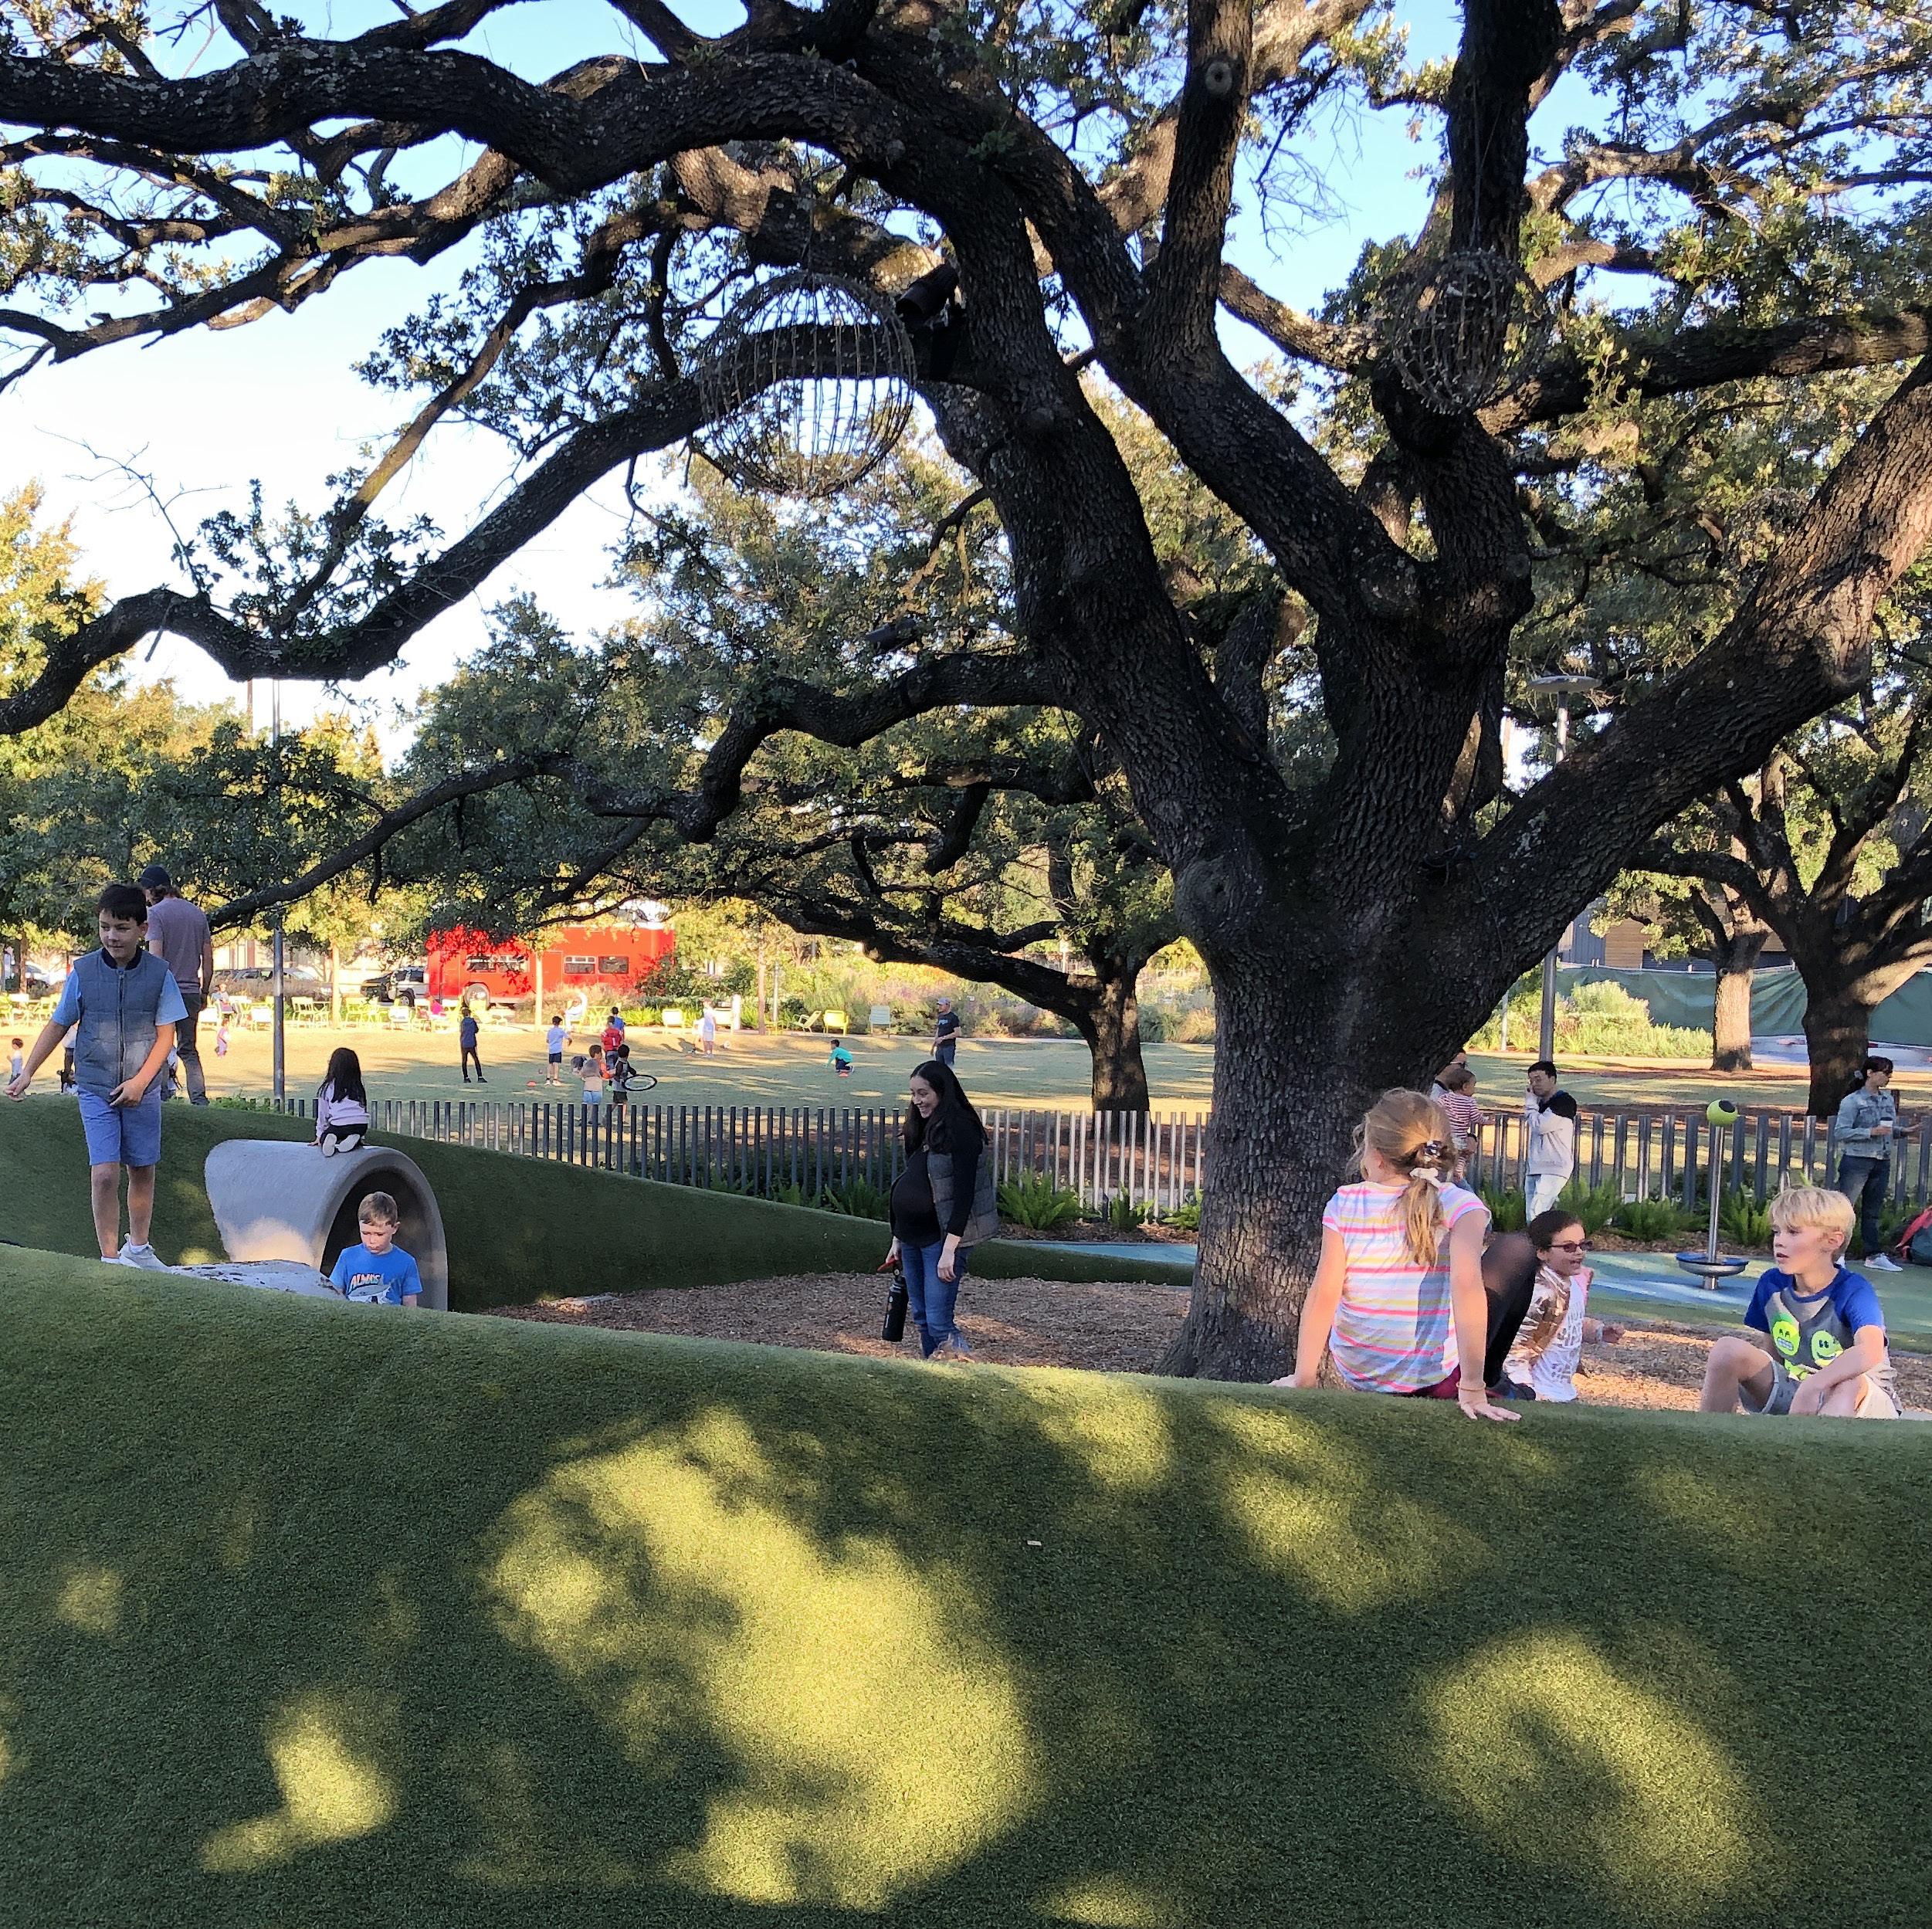
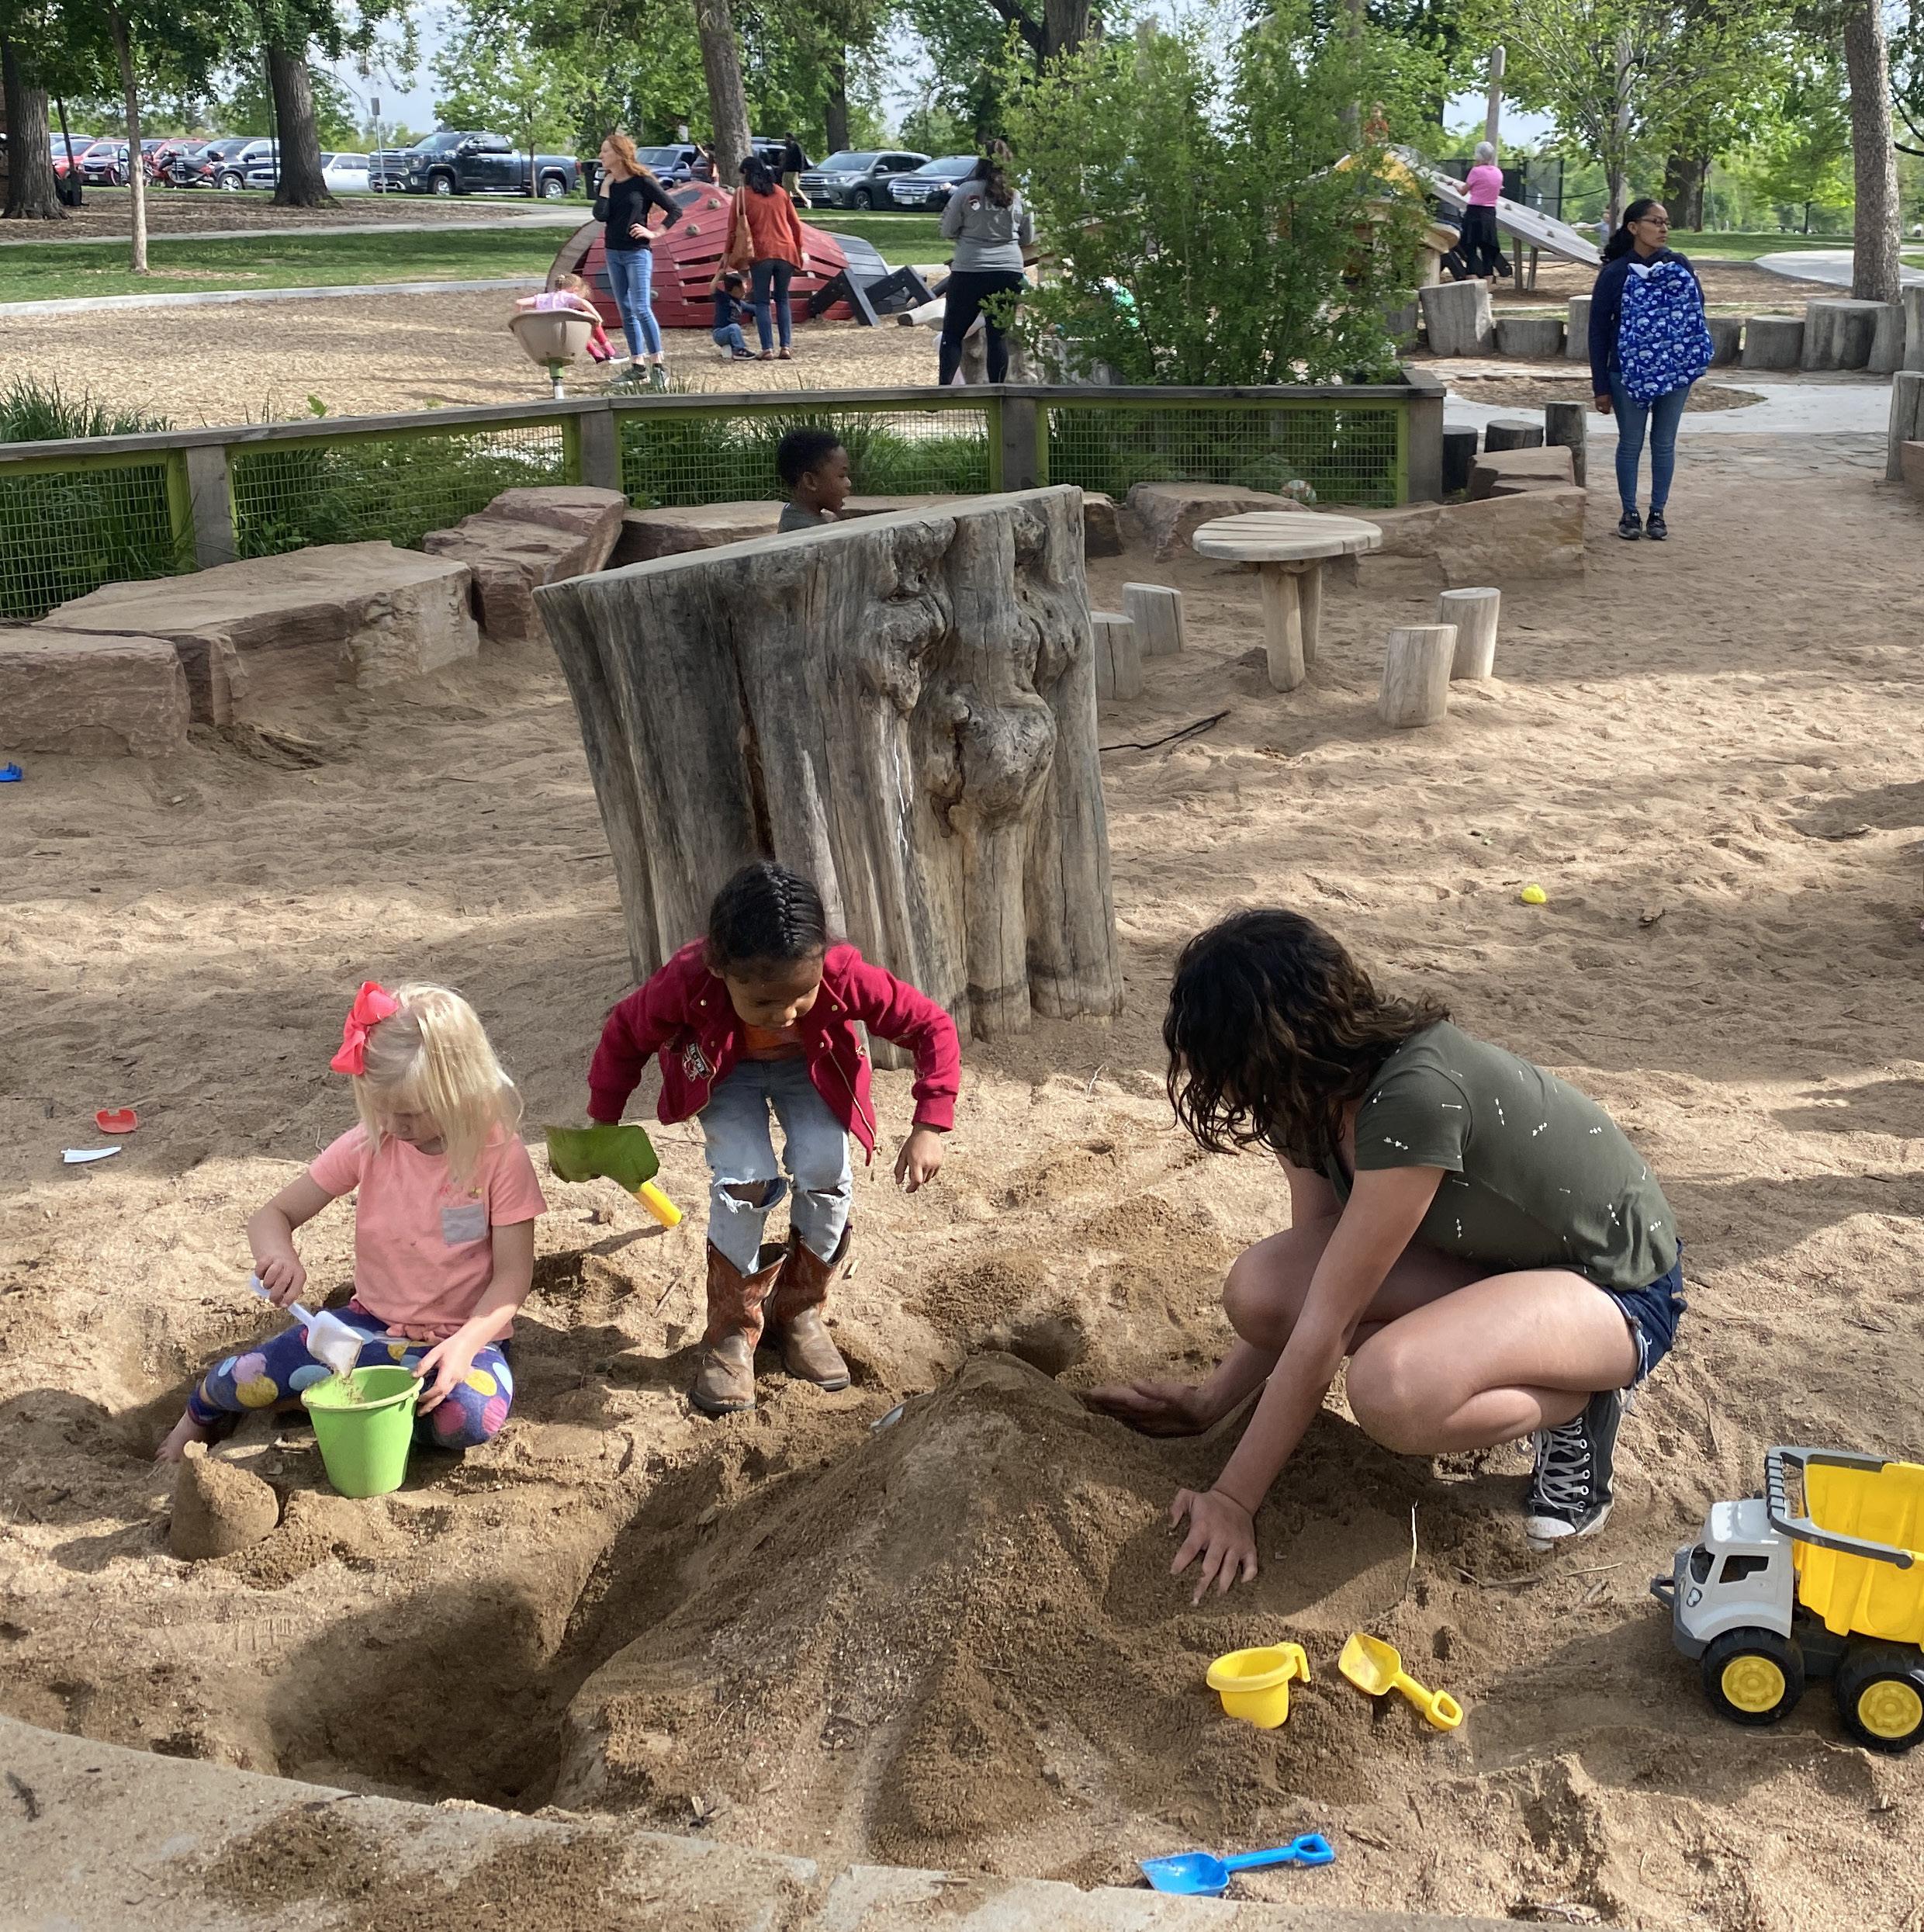
BARBARA FISH DANIEL NATURE PLAY AREA HOUSTON, TX
STUDIO LUDO is a 501(c)3 non-profit founded in 2015 whose mission is building better play through research, advocacy, and design.
Since 2015, our team has led and partnered on three major play research studies (the London Study of Playgrounds, the New York City Study of Play Features and Value, and the National Study of Playgrounds) that combined include data on over 60,000 people in 100 playgrounds in the US and UK. This dataset is the most current picture of behavior and user preference in play environments in the world, and it directly influences all of our play designs.
THE NATIONAL STUDY OF PLAYGROUNDS was led by principal investigator, Dr. Deborah Cohen of Kaiser Permanente, who studies how environmental factors influence the health of communities and affect health disparities.
Additional partners included Dr. Thomas McKenzie, professor emeritus of San Diego State University; Dr. Bing Han, senior research scientist biostatistician at Kaiser Permanente; Dr. Deborah Young, director of the Division of Behavioral Research for the Department of Research & Evaluation at Kaiser Permanente: Stephanie Williamson, Research Programmer, RAND Corporation; and Sarah Eng, biostatistician at Kaiser Permanente.
The study was supported in part by NHLBI # R01HL145145.
3
COVER: SHELBY FARMS WOODLAND DISCOVERY PLAYGROUND MEMPHIS, TN
We regard play as a primary way that humans learn and connect.
We believe play to be a cross-generational and tolerance building aspect of living in community together. Play builds grit, prevents burnout, ignites joy through movement, and helps us become better people together.
WHY PLAY MAKING SPACE FOR PLAY
Play can happen anywhere - in your home, on your stoop, in your garden, or on your street.
But play opportunities are not equal. We believe that everyone deserves space to play, regardless of age, gender, race, or class.
Public play spaces are essential building blocks of a thriving society. They provide opportunities for physical wellness, social cohesion, and emotional health for people of all ages.
BUT WHAT MAKES A GREAT SPACE TO PLAY?
4
5
RAINBOW LAKE PLAYGROUND MEMPHIS, TN
6 PIER SIX PLAYGROUND NEW YORK, NY
BUILDING THE STUDY
In recent years, playgrounds in the US have undergone a design renaissance. Significant investment, as well as experimentation in play features and site elements, have created ideal laboratories to explore what makes a great space to play. We defined these as innovative playgrounds (example on left).
We selected three innovatively designed playgrounds, built within the last ten years, in ten cities or metro areas: Boston, Chicago, Cincinnati, Denver, Houston, Los Angeles, Memphis, New York, San Francisco, and Seattle. This ensured a representative sample of regions within the US (see page 8). Urban areas were selected as the playgrounds were larger, more plentiful, and had a wider diversity of play experiences to analyze.1
The innovative playgrounds chosen met at least three of the following criteria:
(a) a variety of surface types;
(b) naturalized and planted areas designed specifically for play;
(c) open-ended structures that did not dictate play sequences;
(d) loose, movable equipment; and
(e) not comprised solely of traditional post & platform structures.
The innovative playgrounds were then matched with a traditional post and platform playground (example on page 9) that was built or renovated within the last ten years. We additionally matched the playgrounds by neighborhood household poverty level, racial/ethnic demographics, and socio-economic aspects of the surrounding census tract, for a total of 60 playgrounds.
1 For more information on site selection, see Playground Design and Physical Activity, American Journal of Preventive Medicine, 2022.
7


8 NEW YORK CINCINNATI LOS ANGELES CHICAGO HOUSTON DENVER MEMPHIS SAN FRANCISCO SEATTLE BOSTON
SELECTED CITIES
AULT PARK CINCINNATI, OH
INNOVATIVE PLAYGROUNDS
Alexander Kemp Playground
Hoyt-Sullivan Playground
Martin's Park Playground
Maggie Daley Park Play Garden
Mary Bartelme Playground
Dan Ryan Woods Nature Play Garden
Smale Riverfront Adventure Playground
Summit Park Nature Playscape
Washington Park Playground
Paco Sanchez Park Playground
Denver Premium Outlet Play Area
Washington Park Playground
Barbara Fish Daniel Nature Play Area
Exploration Park
Adventure Playground
Rudolph Park Playground
Tongva Park Playground
Rainbow Lake Playground
River Garden Playground
Shelby Farms Woodland Discovery Playground
Chelsea Waterside Playground
East 110th St Playground
Brooklyn Bridge Park Pier 6 Playground
Helen Diller Playgrounds at Civic Center
Mission Dolores - Helen Diller Playground
Mountain Lake Park Playground
Artists at Play Playground
Seattle Children's PlayGarden
Yesler Terrace Park Playground
BOSTON 1 2 3 CHICAGO 4 5 6 CINCINNATI 7 8 9 DENVER 10 11 12 HOUSTON 13 14 15
Levy
Park
LOS ANGELES 16 17 18 MEMPHIS 19 20 21 NEW YORK CITY 22 23 24 SAN FRANCISCO 25 26 27 SEATTLE 28 29 30 10
TRADITIONAL PLAYGROUNDS
Joyce
Shabbona Park Playground
Hayes Playground
Ault Park Playground
Francis RecreAcres Playground
Caldwell Playground
Lakewood / Dry Gulch Park Playground
Ruby Hill Park Playground
Atzlan Recreation Center Playground
Donovan Park Playground
Sagemont Park Playground
Turtle
Hilltop
Memorial Park Playground
Park
Zodiac
Park Playground
Pulaski Playground
Seward Park Playground
Potrero del Sol Playground
Moscone Park Playground
Douglass Park Playground
Wallingford Playfield Playground
David Rogers Park Playground
Pratt Park Playground
11 BOSTON 31 32 33 CHICAGO 34 35 36 CINCINNATI 37 38 39 DENVER 40 41 42 HOUSTON 43 44 45 LOS ANGELES 46 47 48 MEMPHIS 59 50 51 NEW YORK CITY 52 53 54 SAN FRANCISCO 55 56 57 SEATTLE 58 59 60 Draper Playground
B. Waldstein Playground
Jean
Playground Ward Park Playground
Tanglewood Park Playground Rock Park Playground
Park Playground
Hawthorne
Playground
Binghampton
East Park Playground
St. Vartan Playground
4,278
12 SOPARC-G 33,930 PLAY LOOP DWELL TIME 3,719 SURVEYS USERS OBSERVED
1,133
DATA COLLECTION
To understand how the playgrounds were used, we utilized several protocols.1
The System for Observing Play and Recreation in Communities (SOPARC) is a validated tool that provides a snapshot of user behavior associated with space. Data collectors record user demographics (age, gender, race), physical activity (sedentary, moderate, vigorous), and location. We modified SOPARC to be more granular (SOPARC-G), observing at specific play features (swings, slides, platforms), site elements (benches, tables), and surfaces.
Play Loop, a new systematic observation tool, was developed to understand how play behaviors and social interactions might change over time and space. Individuals were observed for up to 8 minutes, in 20 second increments, collecting demographics, physical activity, social interactions, and location.
Dwell Time, another new systematic observation tool, was created to document how long users stay in playgrounds. Groups were observed every 10 minutes for up to four hours, and their demographics and locations were recorded.
Intercept surveys of adults were used to assess play preferences, distance traveled, modes of transport, frequency of use, impacts of social factors (homelessness, smoking, alcohol), and if COVID-19 or vaccination rates influenced visitation.
Data were collected in summer 2021.
1 For more information on protocols, see Playground Design and Physical Activity, American Journal of Preventive Medicine, 2022.
13
WHAT WE LEARNED
Everyone loves to play! And people are most active and socially engaged when playing with others.
People like to visit spaces that feel good to them, especially where they are welcome and cared for.
Well-designed spaces attract the most people, but having playgrounds close to home encourages repeat visits and active transport, like walking or cycling.
WHY IT IS IMPORTANT
Play is the one of the best investments that we can make in community health.
Our studies show that playgrounds serve more people of all ages, abilities, genders, and demographics than almost any other public space amenity.2 Play gets people to move more, connect more, and spend more time outdoors, laying the foundation for a lifetime of health and happiness.
DISCOVER MORE ABOUT OUR FINDINGS...
14
2 Innovative Playgrounds: Use, Physical Activity and Implications for Health, Public Health, 2019.
SMALE RIVERFRONT PARK ADVENTURE PLAYGROUND CINCINNATI, OH 15
2X
MORE ACTIVITY
MORE USERS 3X IN INNOVATIVE
PLAYGROUNDS
16
DESIGN MATTERS
We found that innovative playgrounds attracted 2.5 times more users, generated almost 3 times as much moderate-to-vigorous physical activity (MVPA), and had 31% more users per square foot than traditional playgrounds.1
The innovative playgrounds were almost twice as large as the traditional playgrounds, and nearly half were in destination locations (i.e. places that attracted tourists). After controlling for size, population density, neighborhood poverty, and destination location, innovative playgrounds still attracted 43% more visitors and had 43% more MVPA than traditional playgrounds.
This was particularly striking for playgrounds in high-poverty neighborhoods. For every 1% increase in poverty level, there were 5% fewer visitors and 4% less MVPA. This usage gap was also noted in The National Study of Neighborhood Parks. The primary reason for lower use in high poverty neighborhoods is due to safety concerns.3
However, innovative playgrounds reduced that gap in use by 60% for the number of users and 70% for MVPA. As many high-poverty areas have increased health disparities, from diabetes to hypertension to obesity, it is crucial that they have high quality, well designed and maintained public playgrounds.
Children do not get to choose where they grow up. Everyone deserves access to a great place to play, and a healthy, active childhood.
1 Playground Design and Physical Activity, American Journal of Preventive Medicine, 2022.
3 The First National Study of Neighborhood Parks: Implications for Physical Activity, American Journal of Preventive Medicine, 2016
17
MOUNTAIN LAKE PLAYGROUND SAN
FRANCISCO, CA
HALF USERS ARE OF PLAYGROUND NOT CHILDREN
19
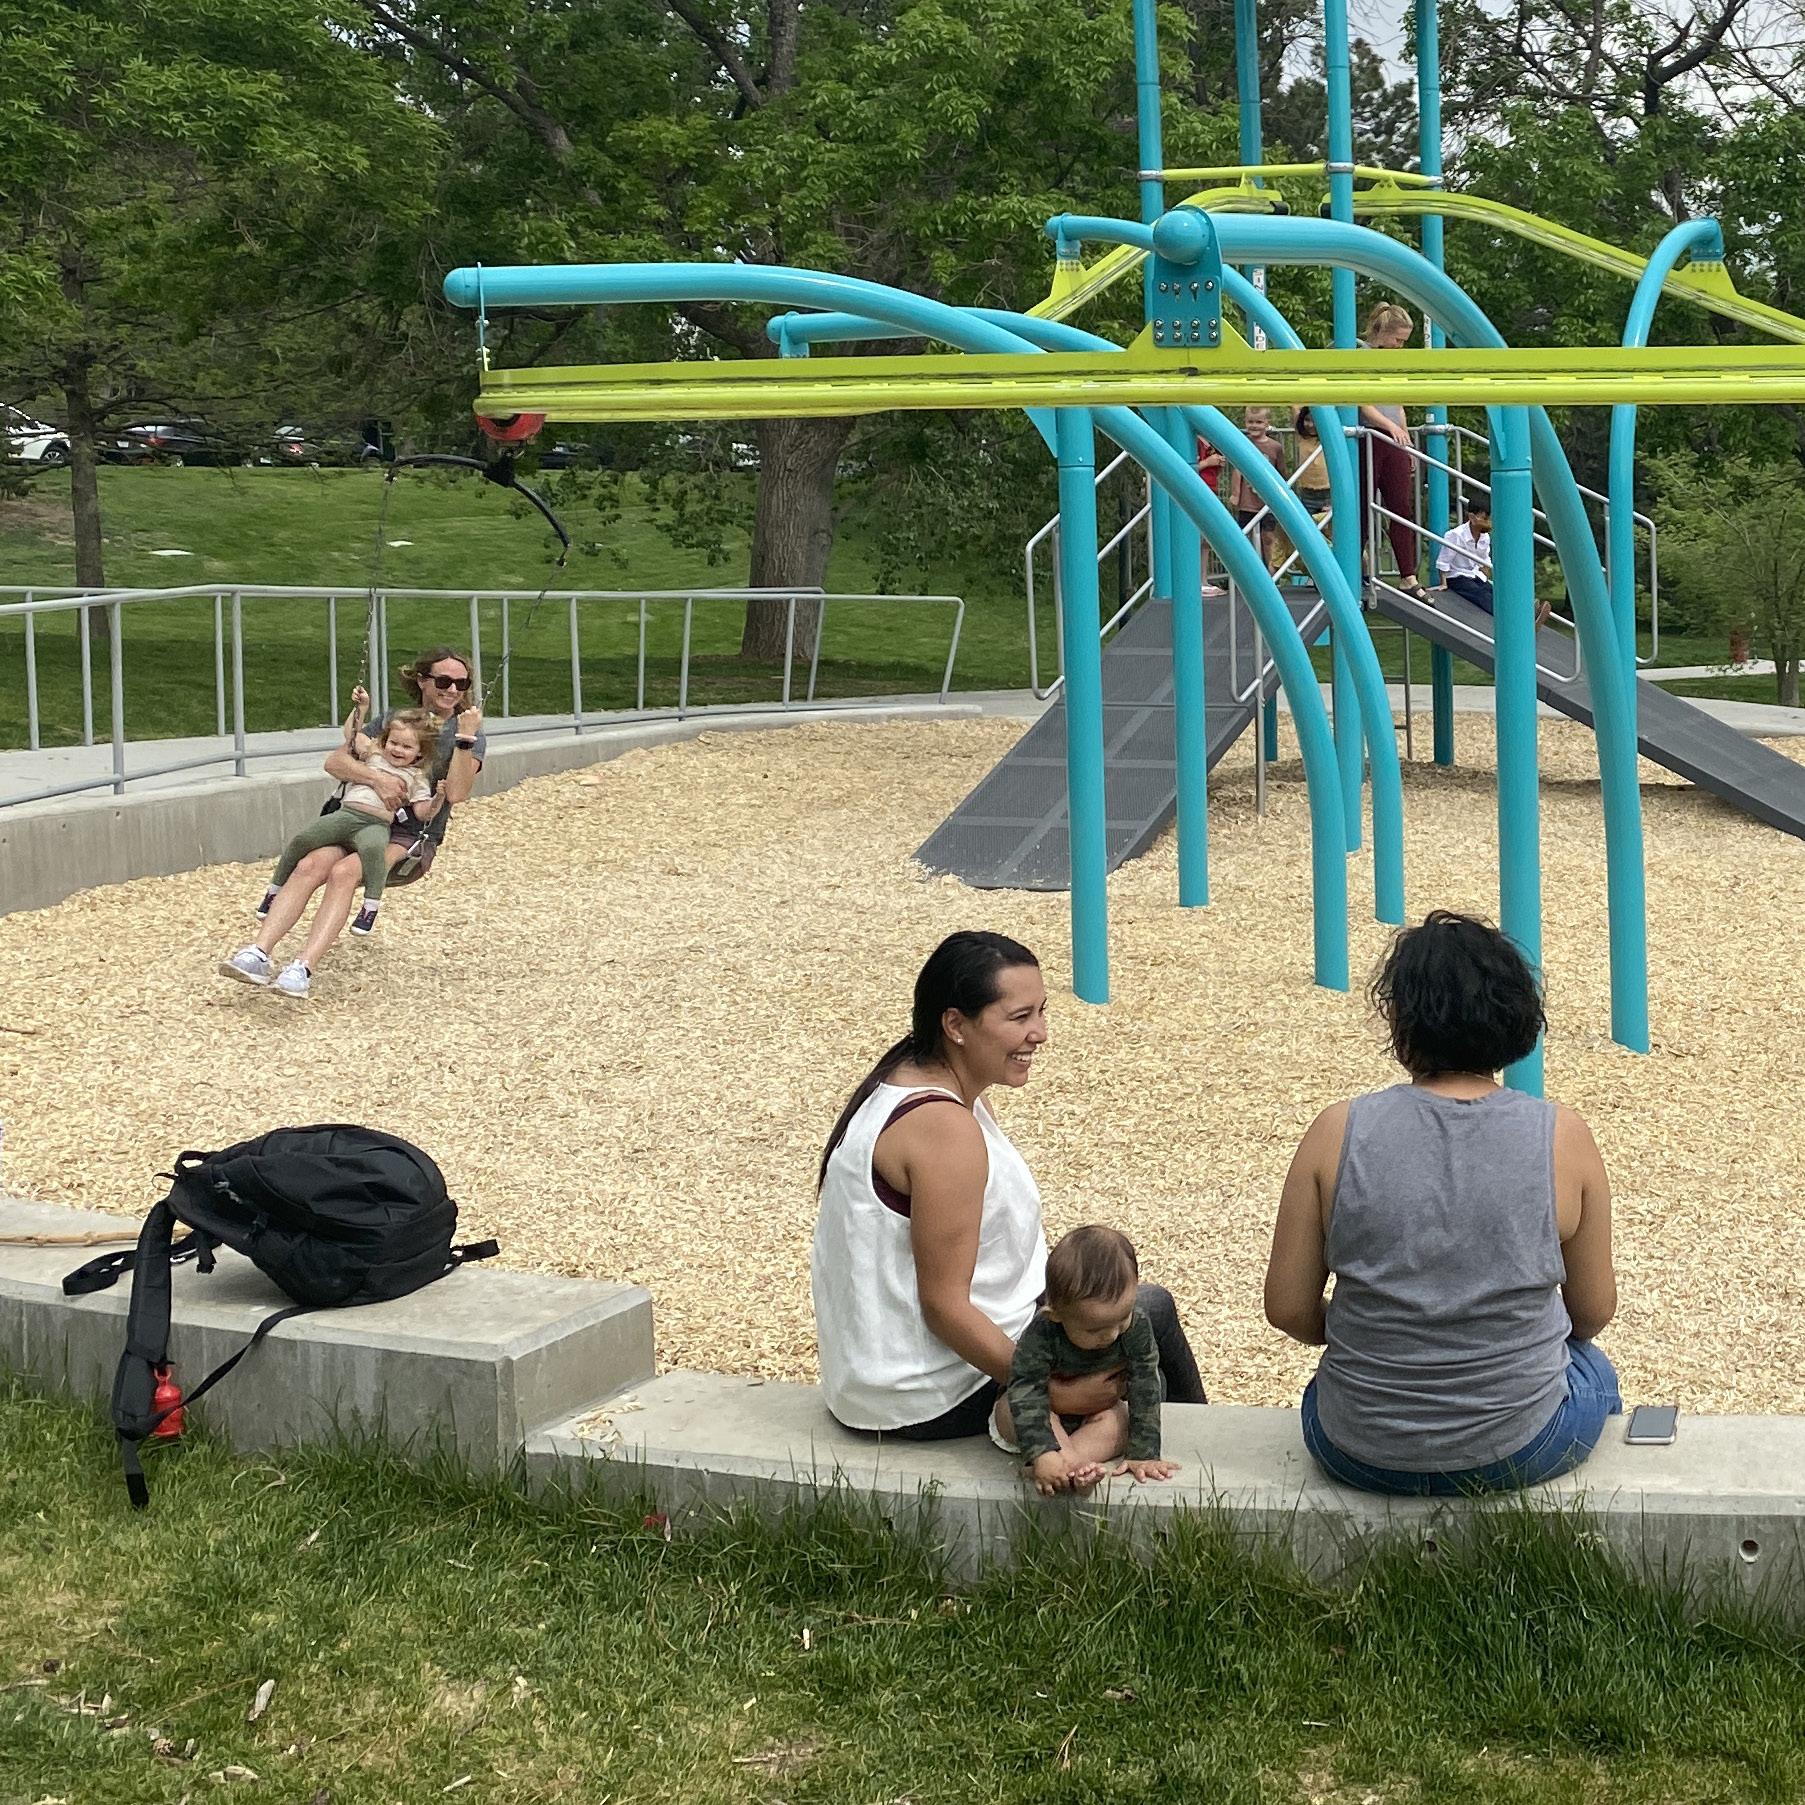
ADULTS ARE
MOST ACTIVE CHILDREN WHEN PLAYING WITH
20
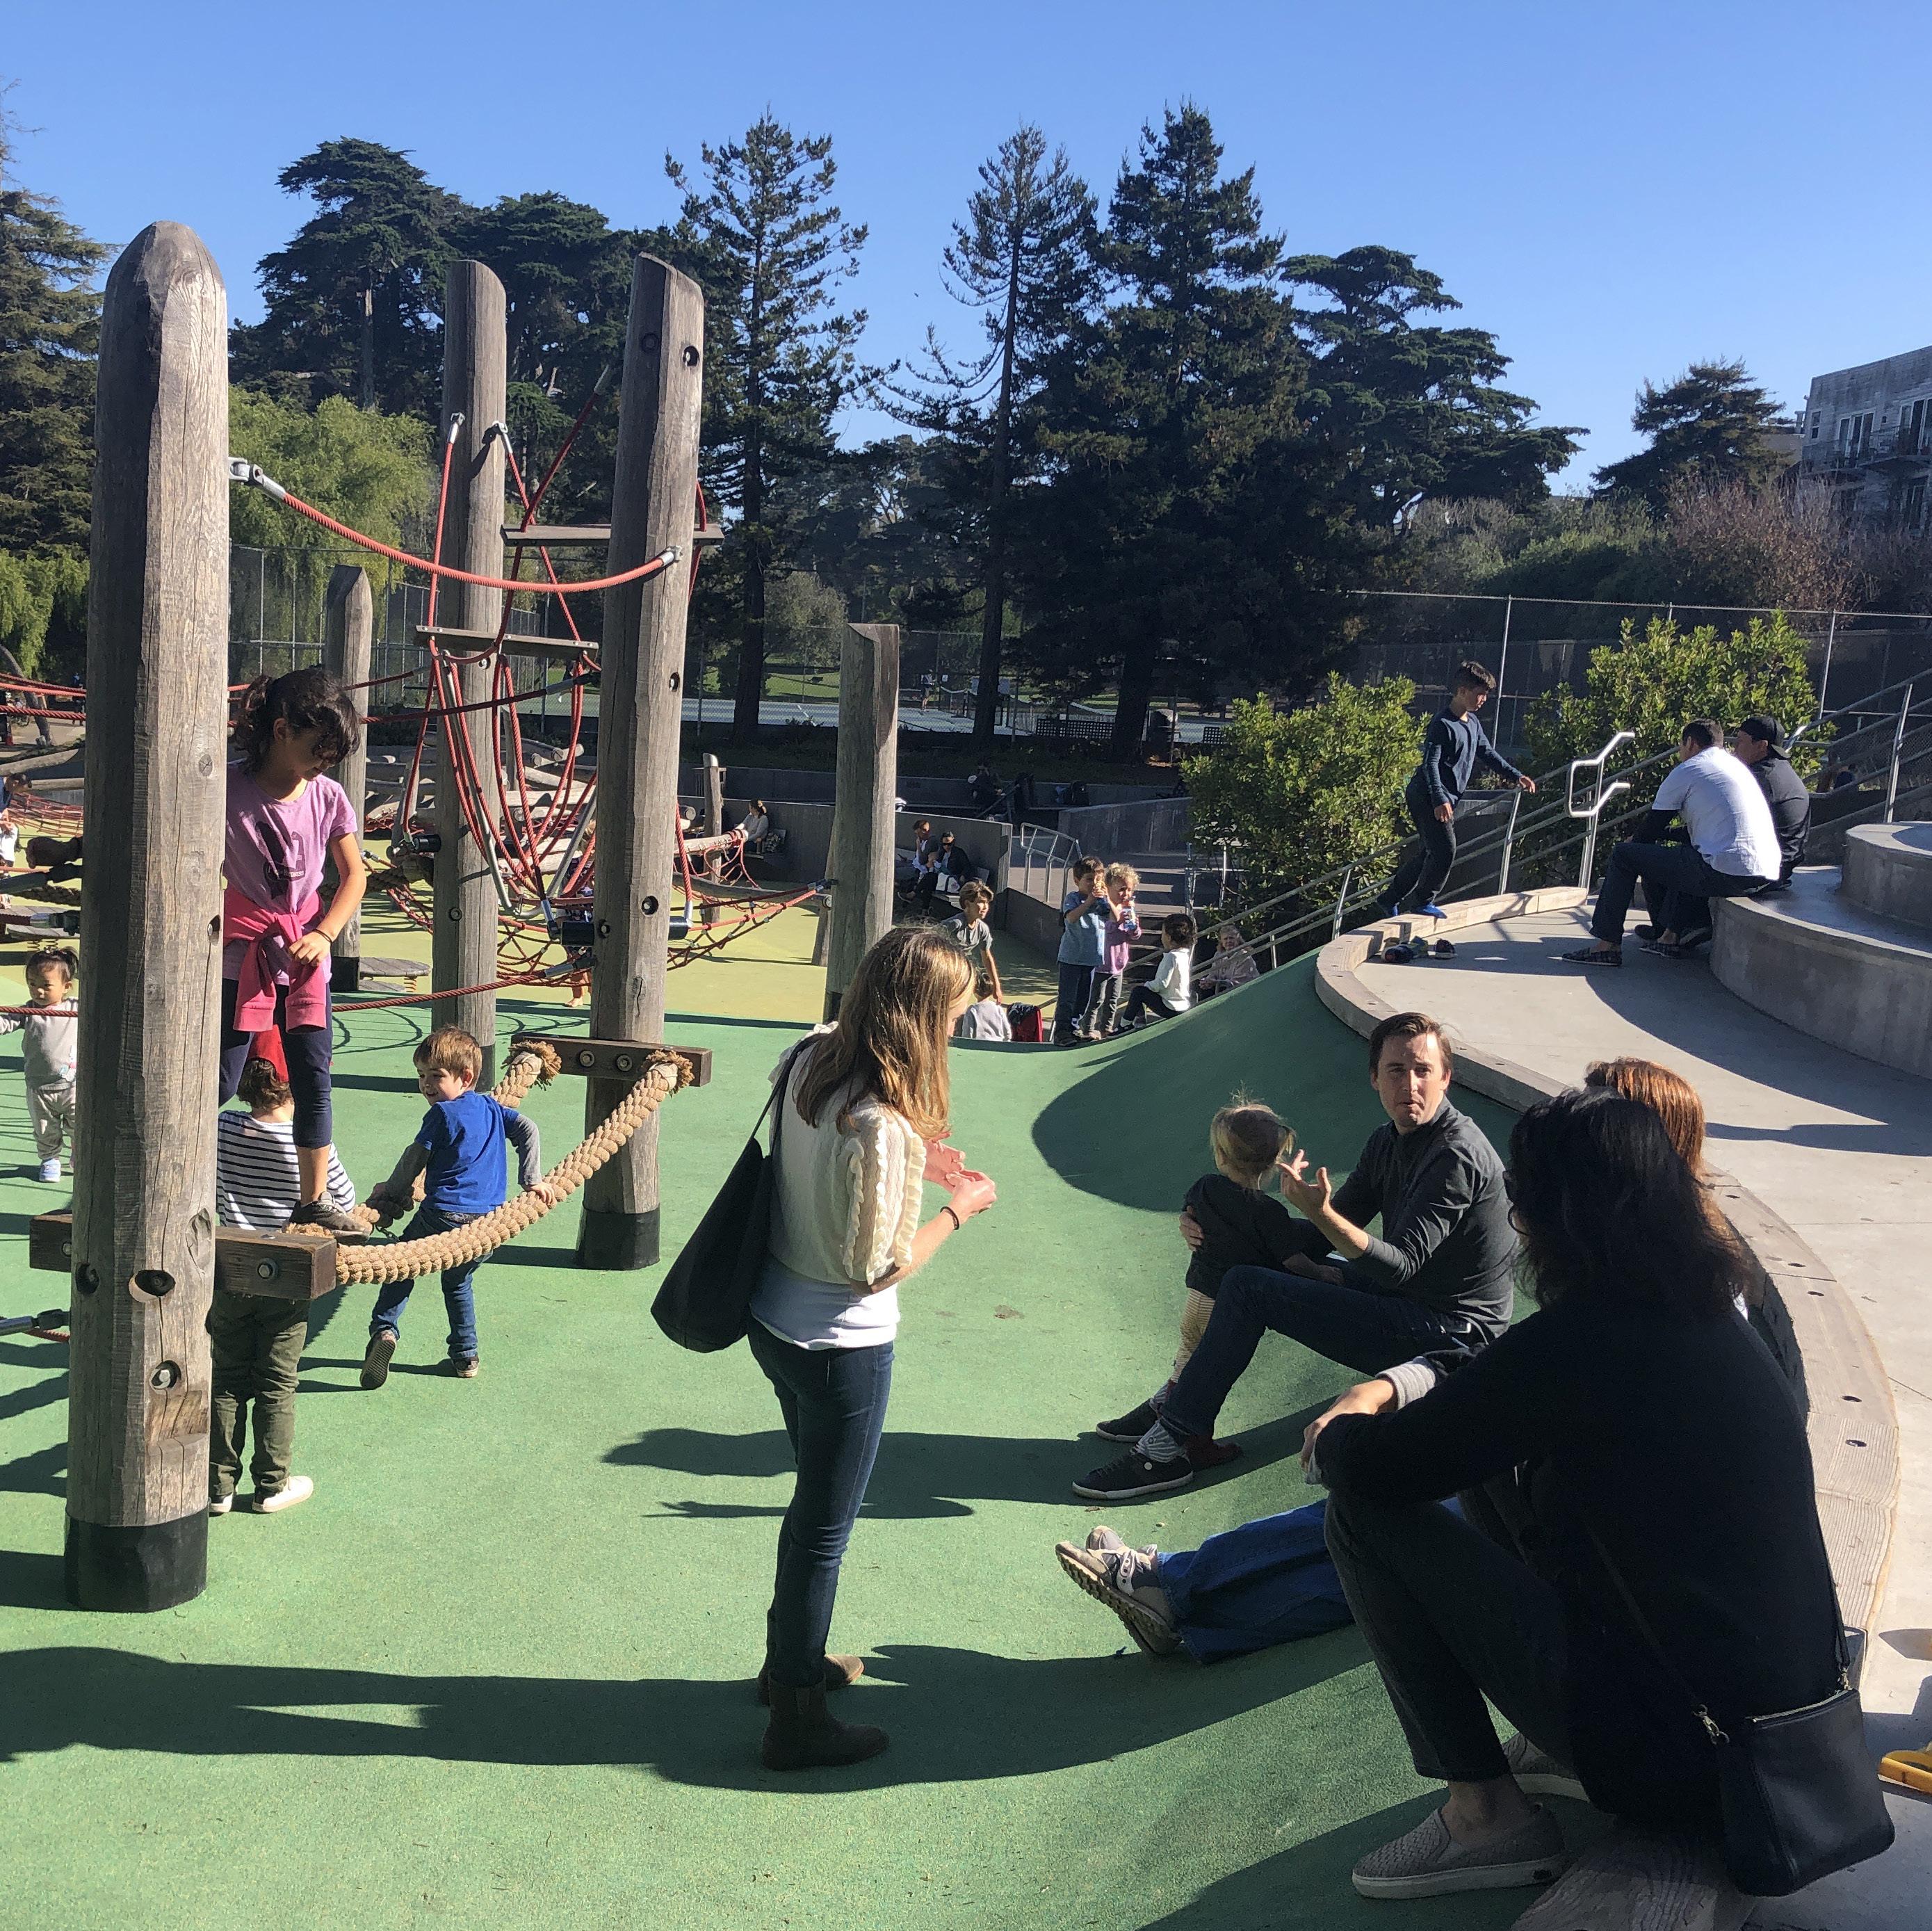
WHAT ABOUT THE TEENS & GROWN UPS?
In the London Study of Playgrounds, we found that 48.3% of users were over the age of 13.2 In the National Study of Playgrounds, it was 49%.
Despite perceptions that playgrounds are just for children, they are a public resource for all. However, they are typically not designed to support teens, adults, and seniors to be more physically active and foster social connection.
Adults and seniors were most attracted to picnic tables, benches, berms, and boulders, all places where they could sit or perch, with clear lines of sight to children playing. Teens were found most on benches and swings, spaces where they could be social and connect with friends.
An essential finding was that adults were most physically active when playing with children. The play features they used most together were swings, climbers, and spinners, particularly when these were larger scaled, open ended structures that supported adults moving and playing with their children rather than standing on the sidelines. Water play was also a favorite of all ages to engage together.
As almost half of visitors to playgrounds are over 13, getting them moving and active while in the playgrounds supports health for the whole family.
2 Innovative Playgrounds: Use, Physical Activity, and Implications for Health, Public Health, 2019
21
22
EXPLORATION PARK HOUSTON, TX
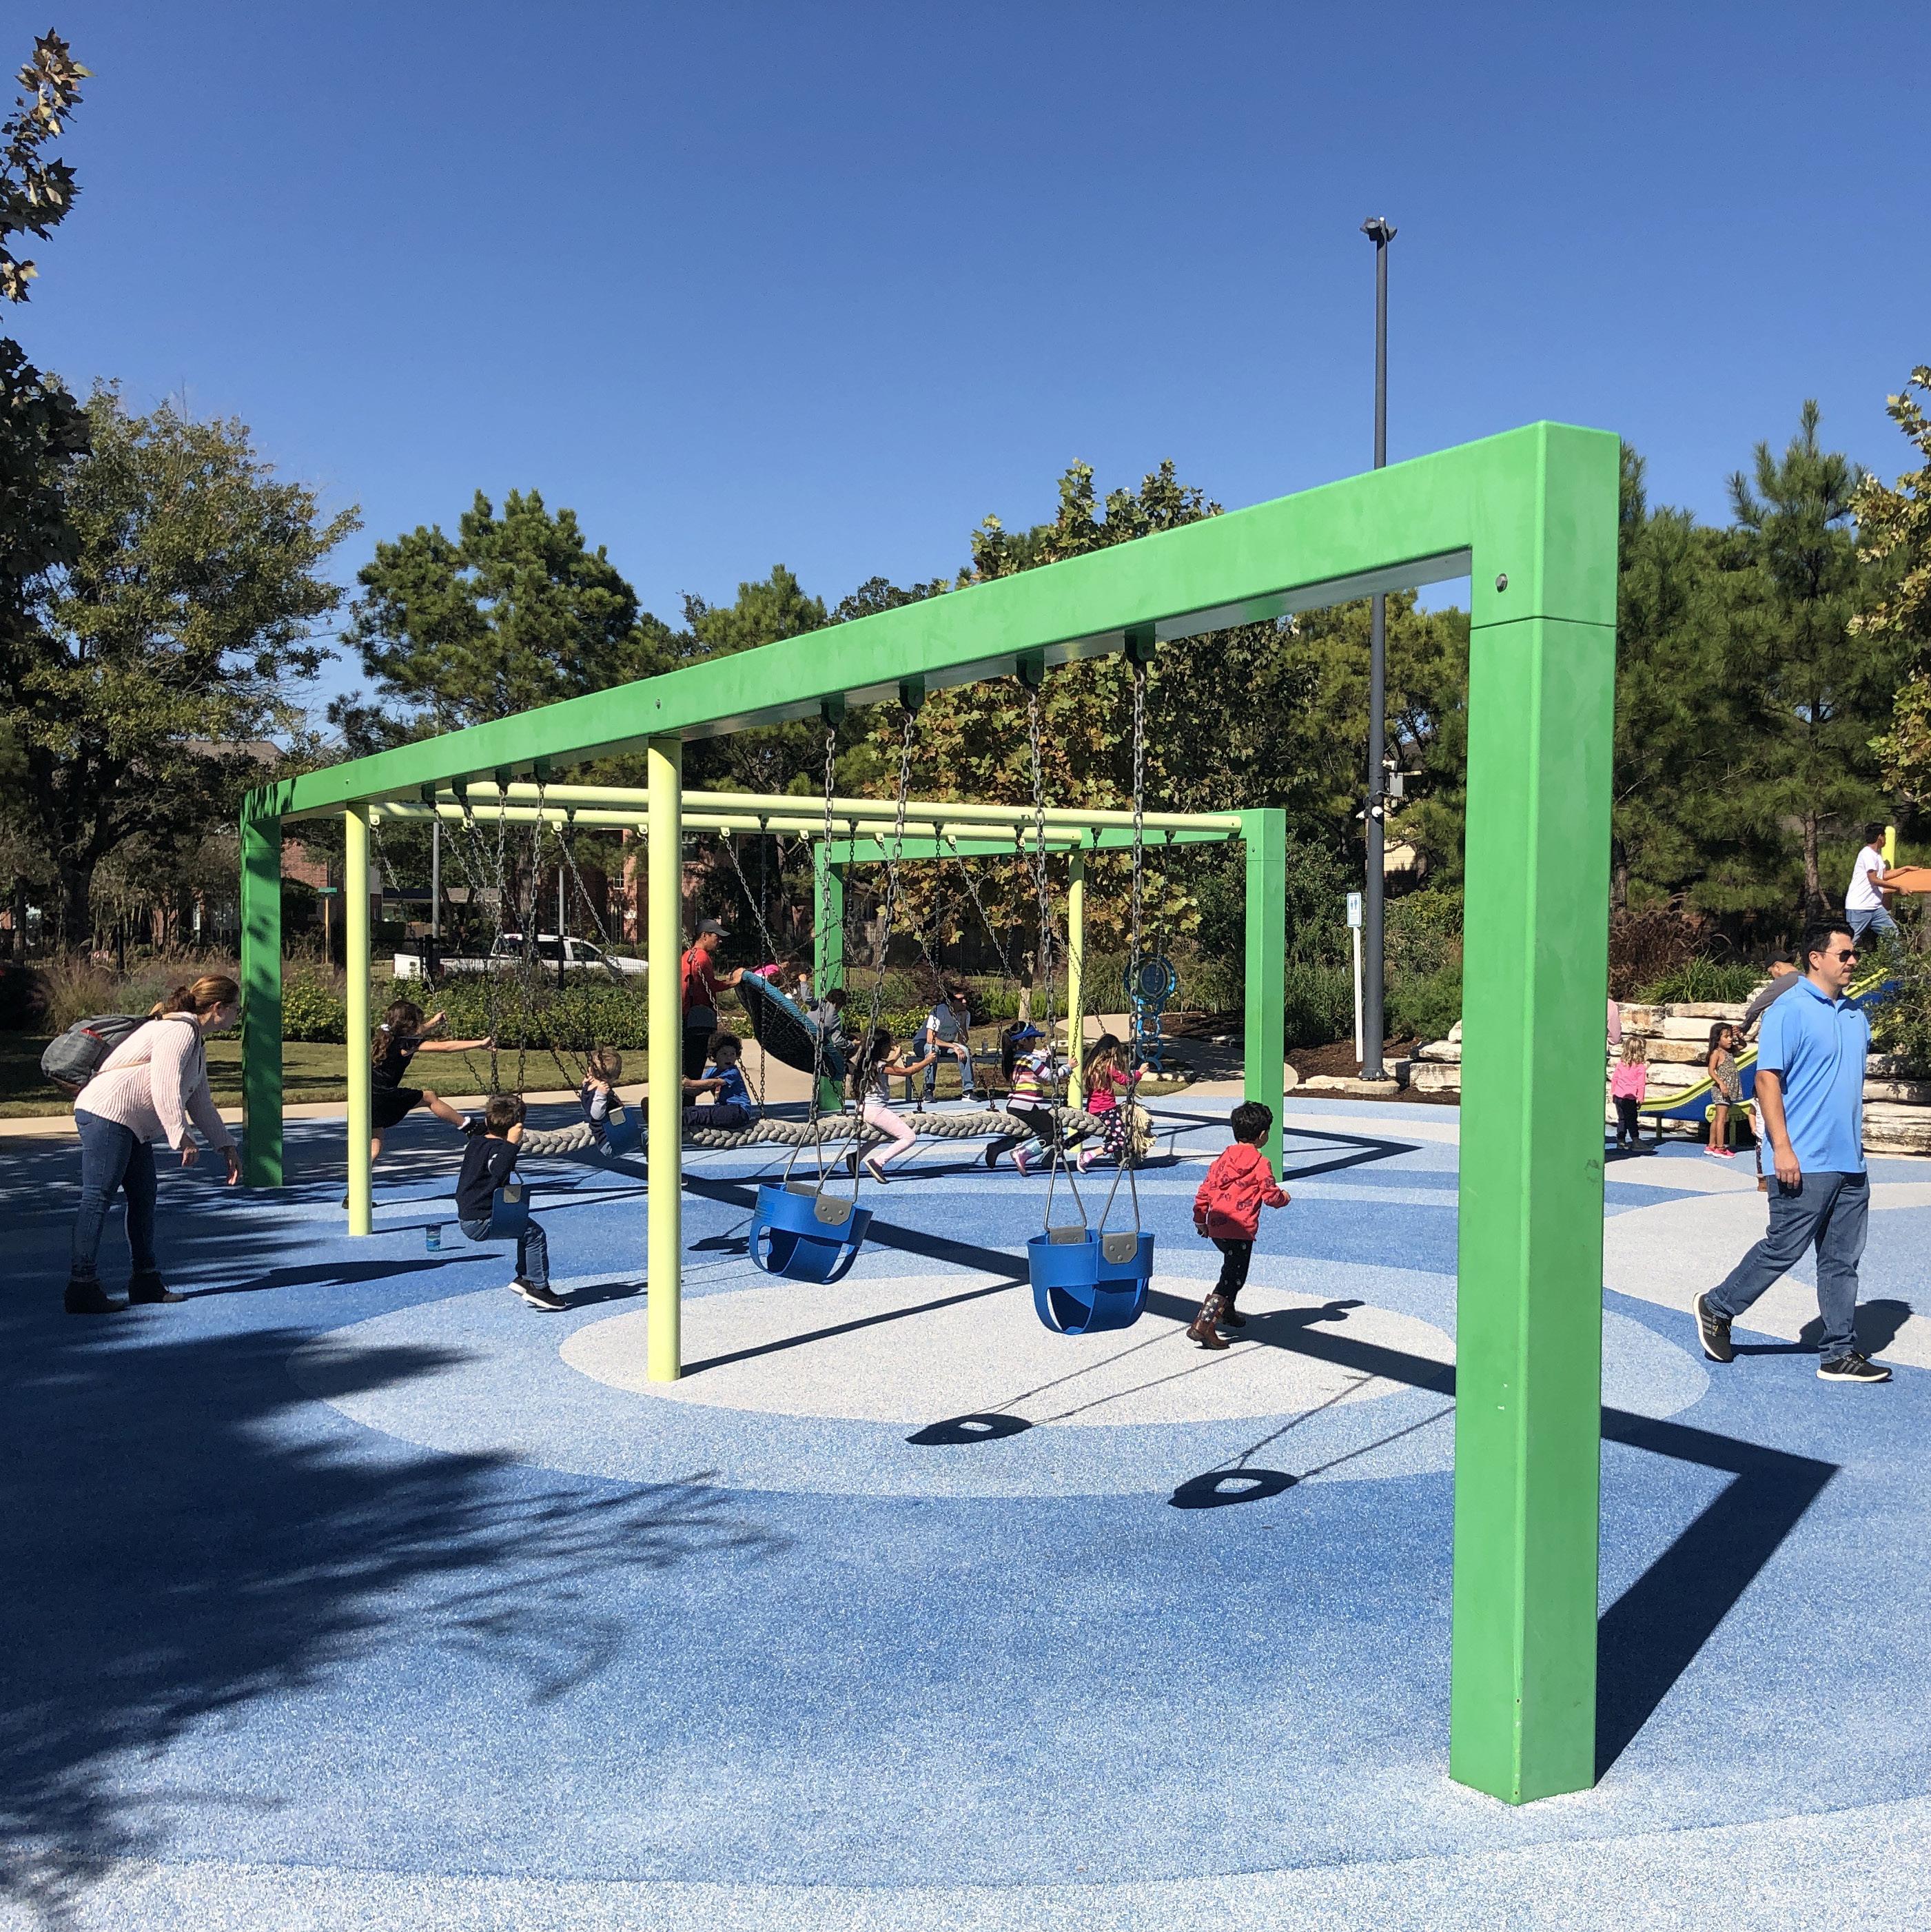
THE FOR
MOST ALL AGES IS SWINGS POPULAR PLAY EQUIPMENT
23
IS A “LIFE WITHOUT MISUNDERSTANDING.” A SWING
HUGO KÜKELHAUS
24
ACTIVATING ALL EIGHT OF OUR SENSES
We know about our five senses. But what about the three “hidden” sensesproprioception, vestibular, and interoception? Proprioception is the sense of where our body is in space. Vestibular is the spatial awareness of movement and how we balance. Interoception is a sense that helps us understand and feel what’s going on inside our bodies.
Children actively seek to stimulate and develop these senses, particularly on a playground. They are literally hard wired to swing, spin, and flip upside down. It helps develop their inner ear, sense of balance, and sense of self.
Some of us grow out of the compulsion to spin, but everyone is attracted to swinging. Linear motion is calming to the vestibular system, helping to lower stress and increase endorphins. In our study, we found that for every swing, there was 6% more use of playgrounds and an 8% increase in how long people stayed at the playground. A playground with 12 swings translates to a 72% increase in use and almost double the stay time, from 34 minutes in innovative playgrounds and 31 minutes in traditional playgrounds, to more than an hour on average.4
Swings are a wonderful way to meet recommended physical activity levels of 60 minutes per day for children and 150 minutes per week for adults.
4 Playground Design: Contribution to Duration of Stay and Implications for Physical Activity, Environmental Research and Public Health, 2023
25
26
SHELBY FARMS WOODLAND DISCOVERY PLAYGROUND MEMPHIS, TN
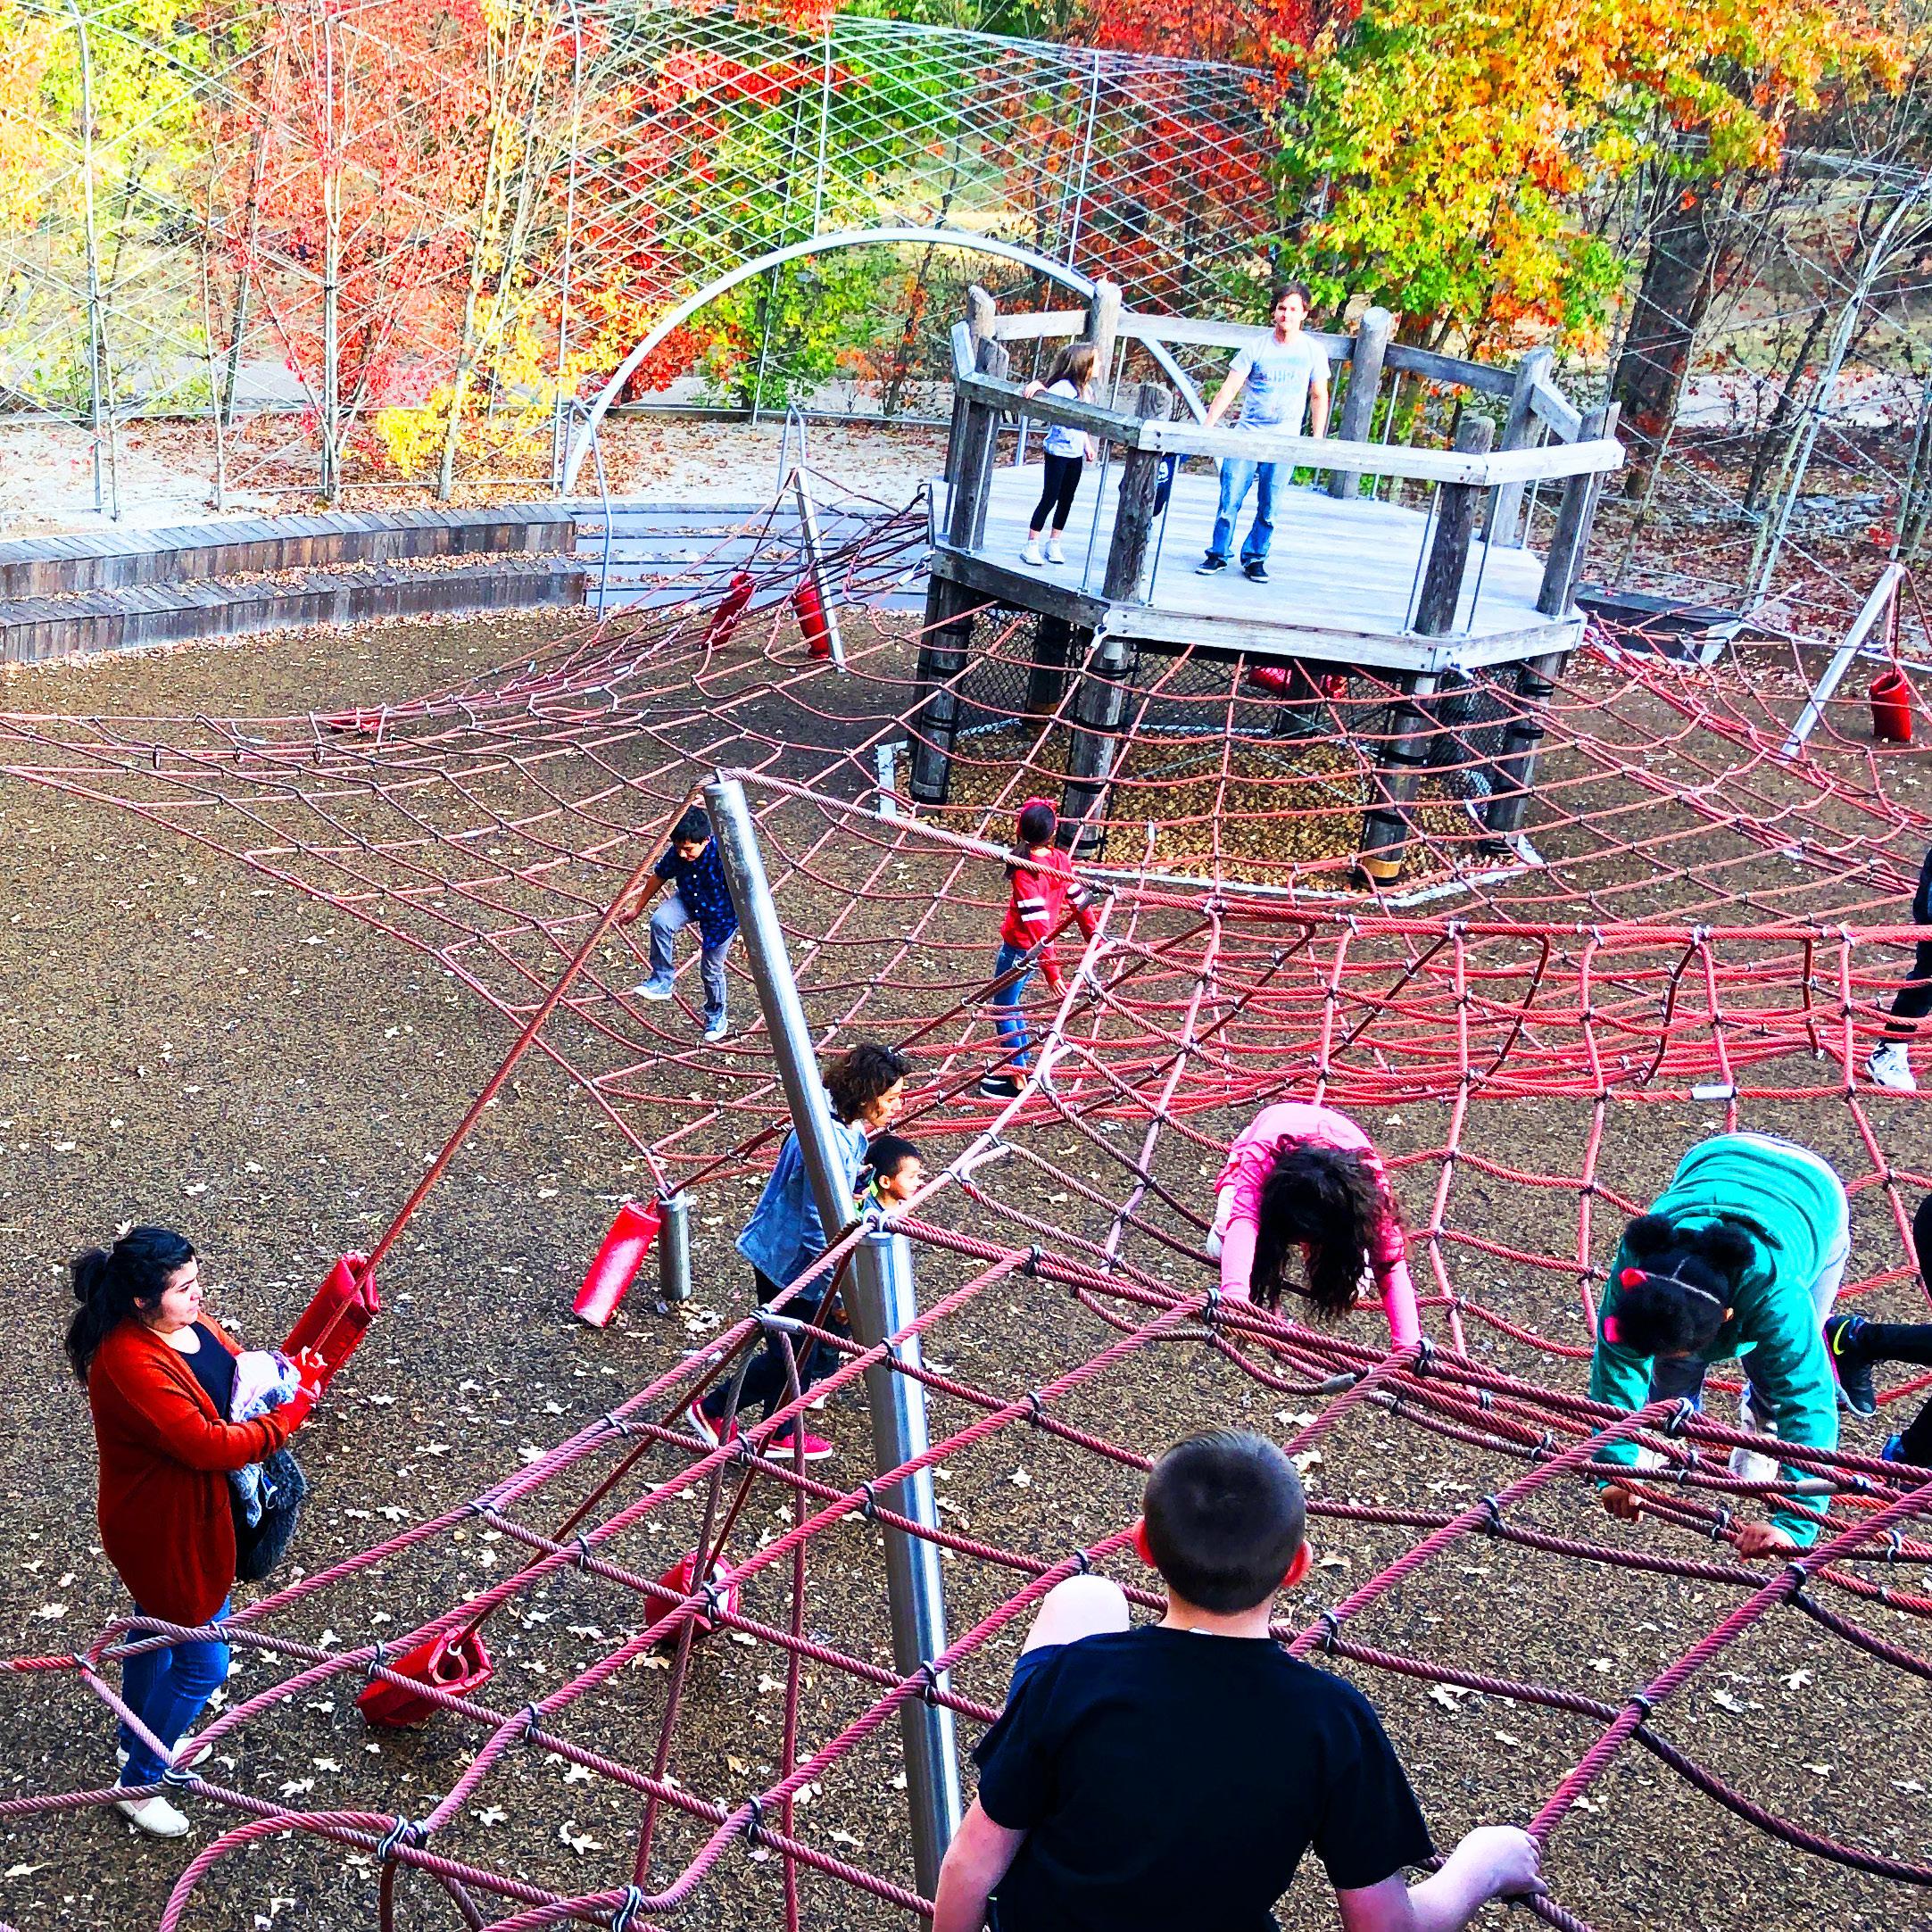
EACH CLIMBER
ADDS
4% 6% MORE LONGER USERS STAY TIME
27
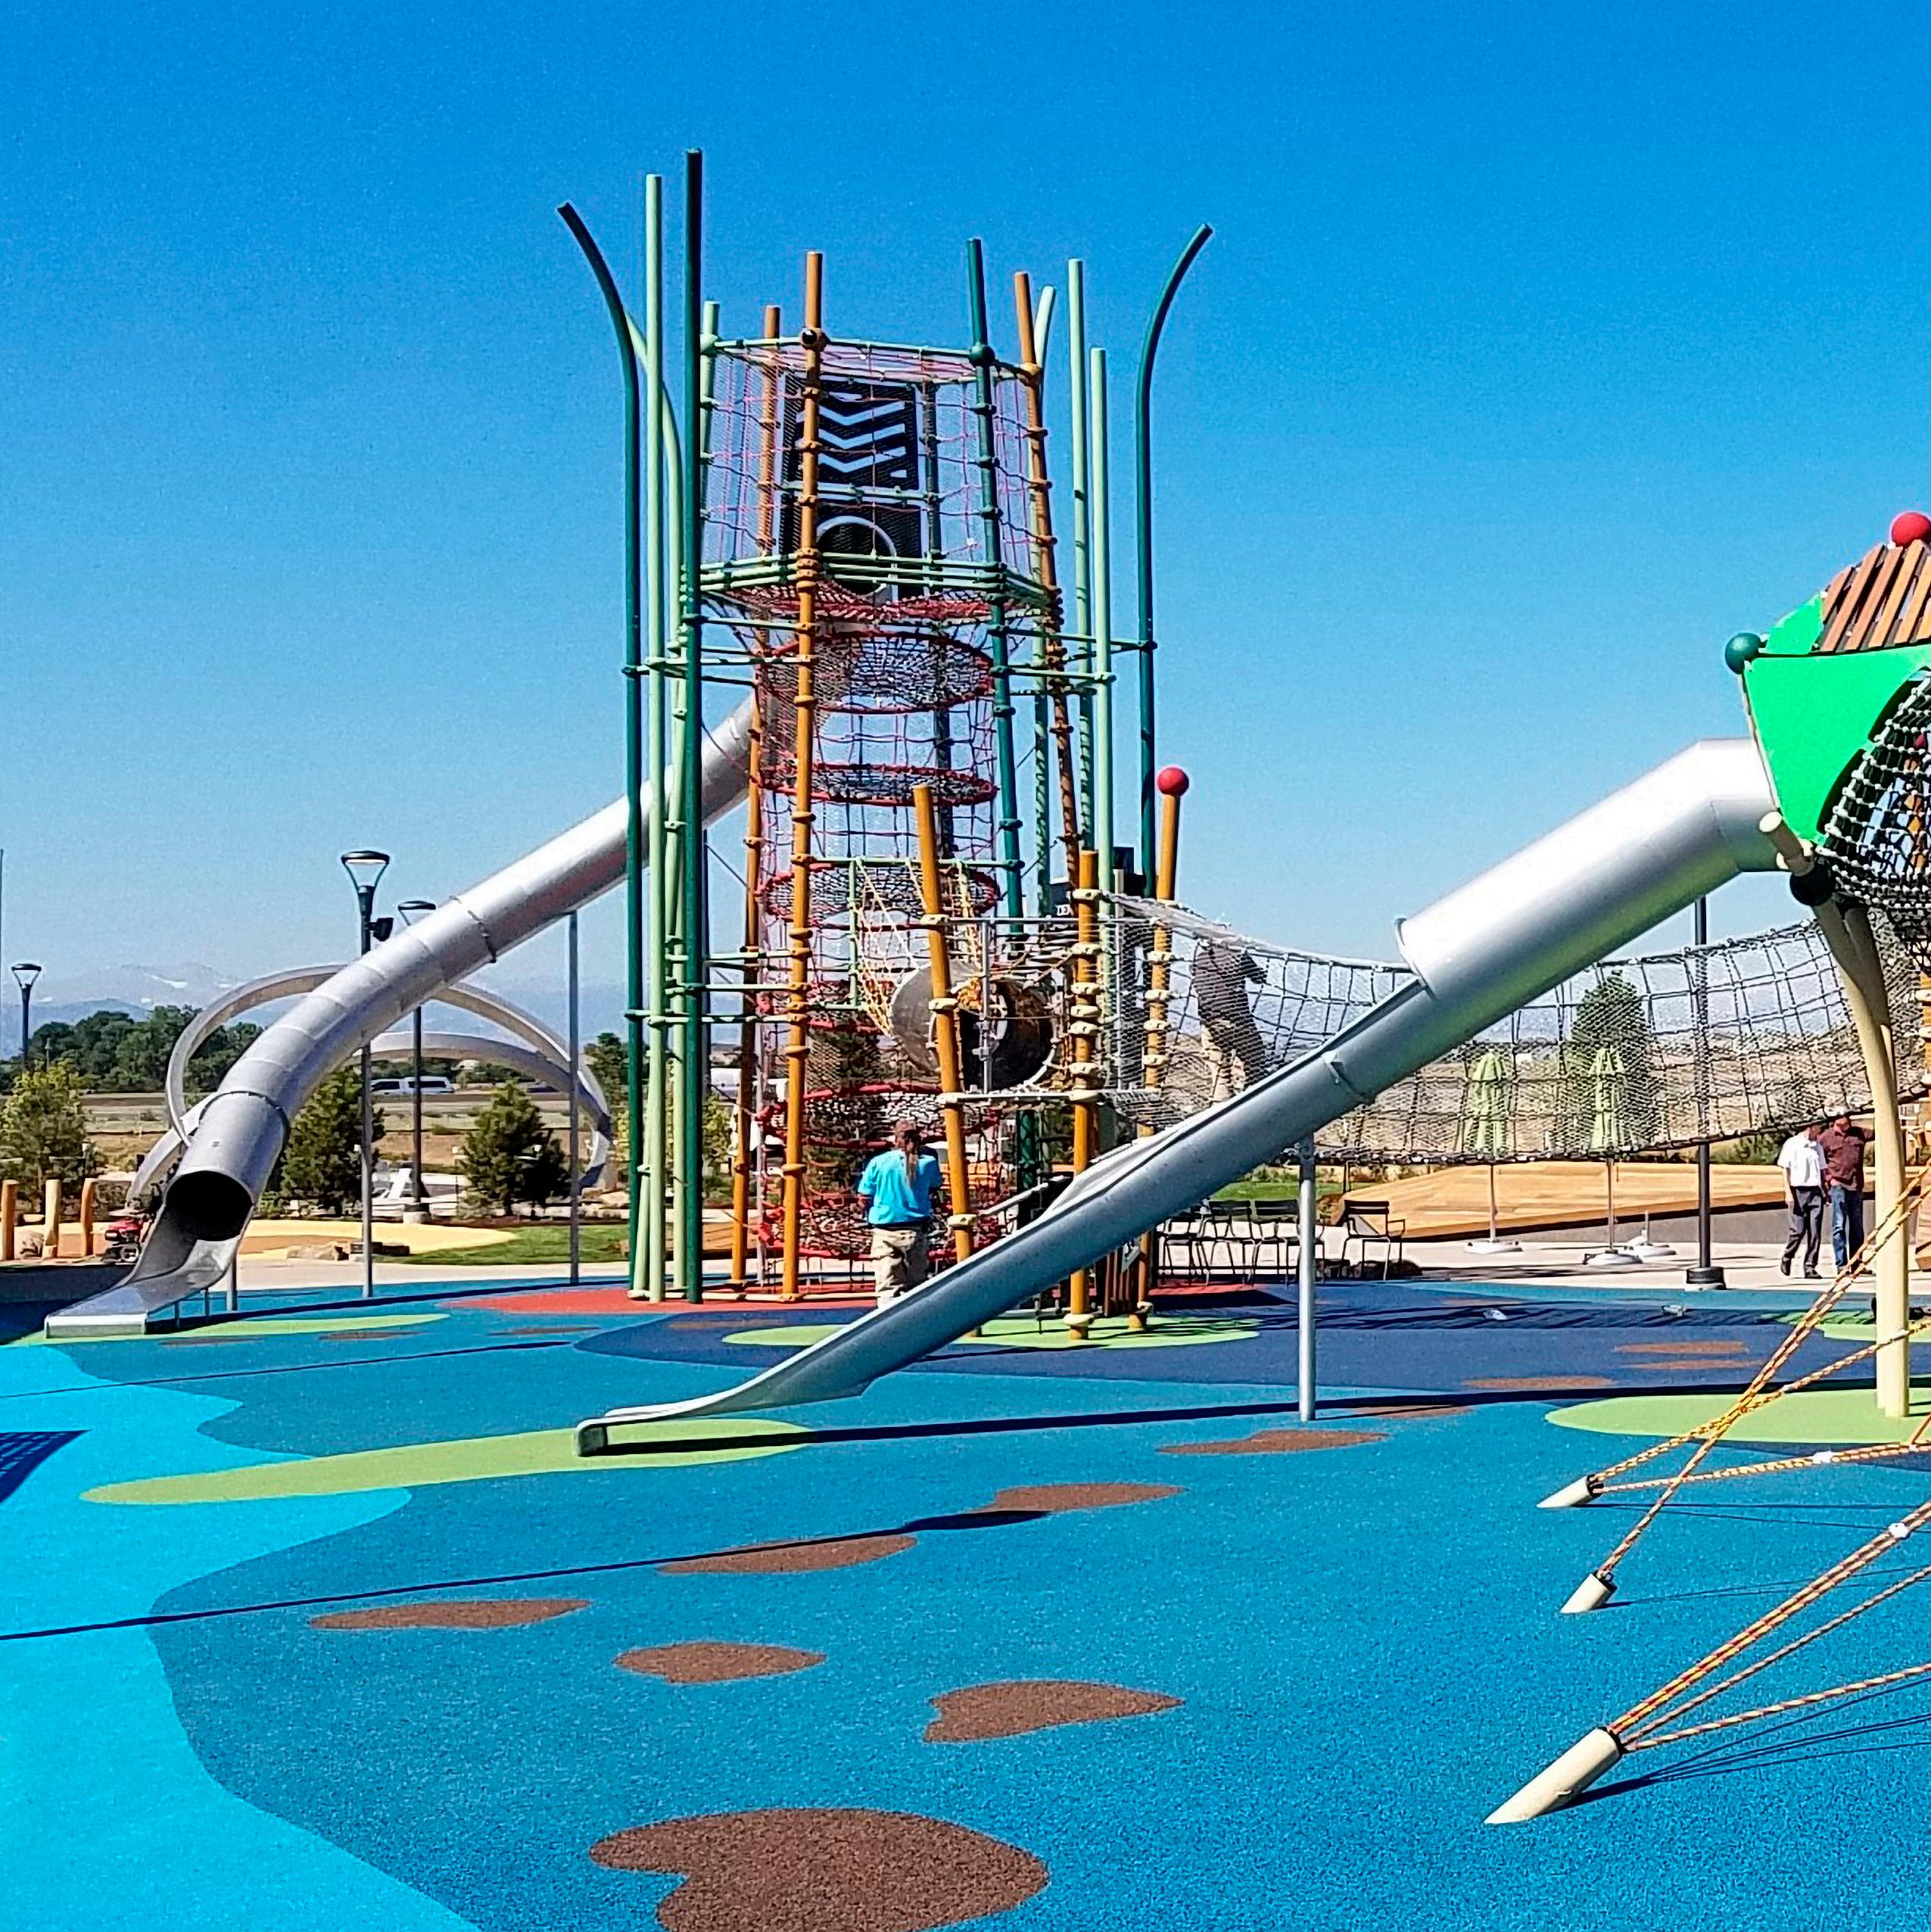
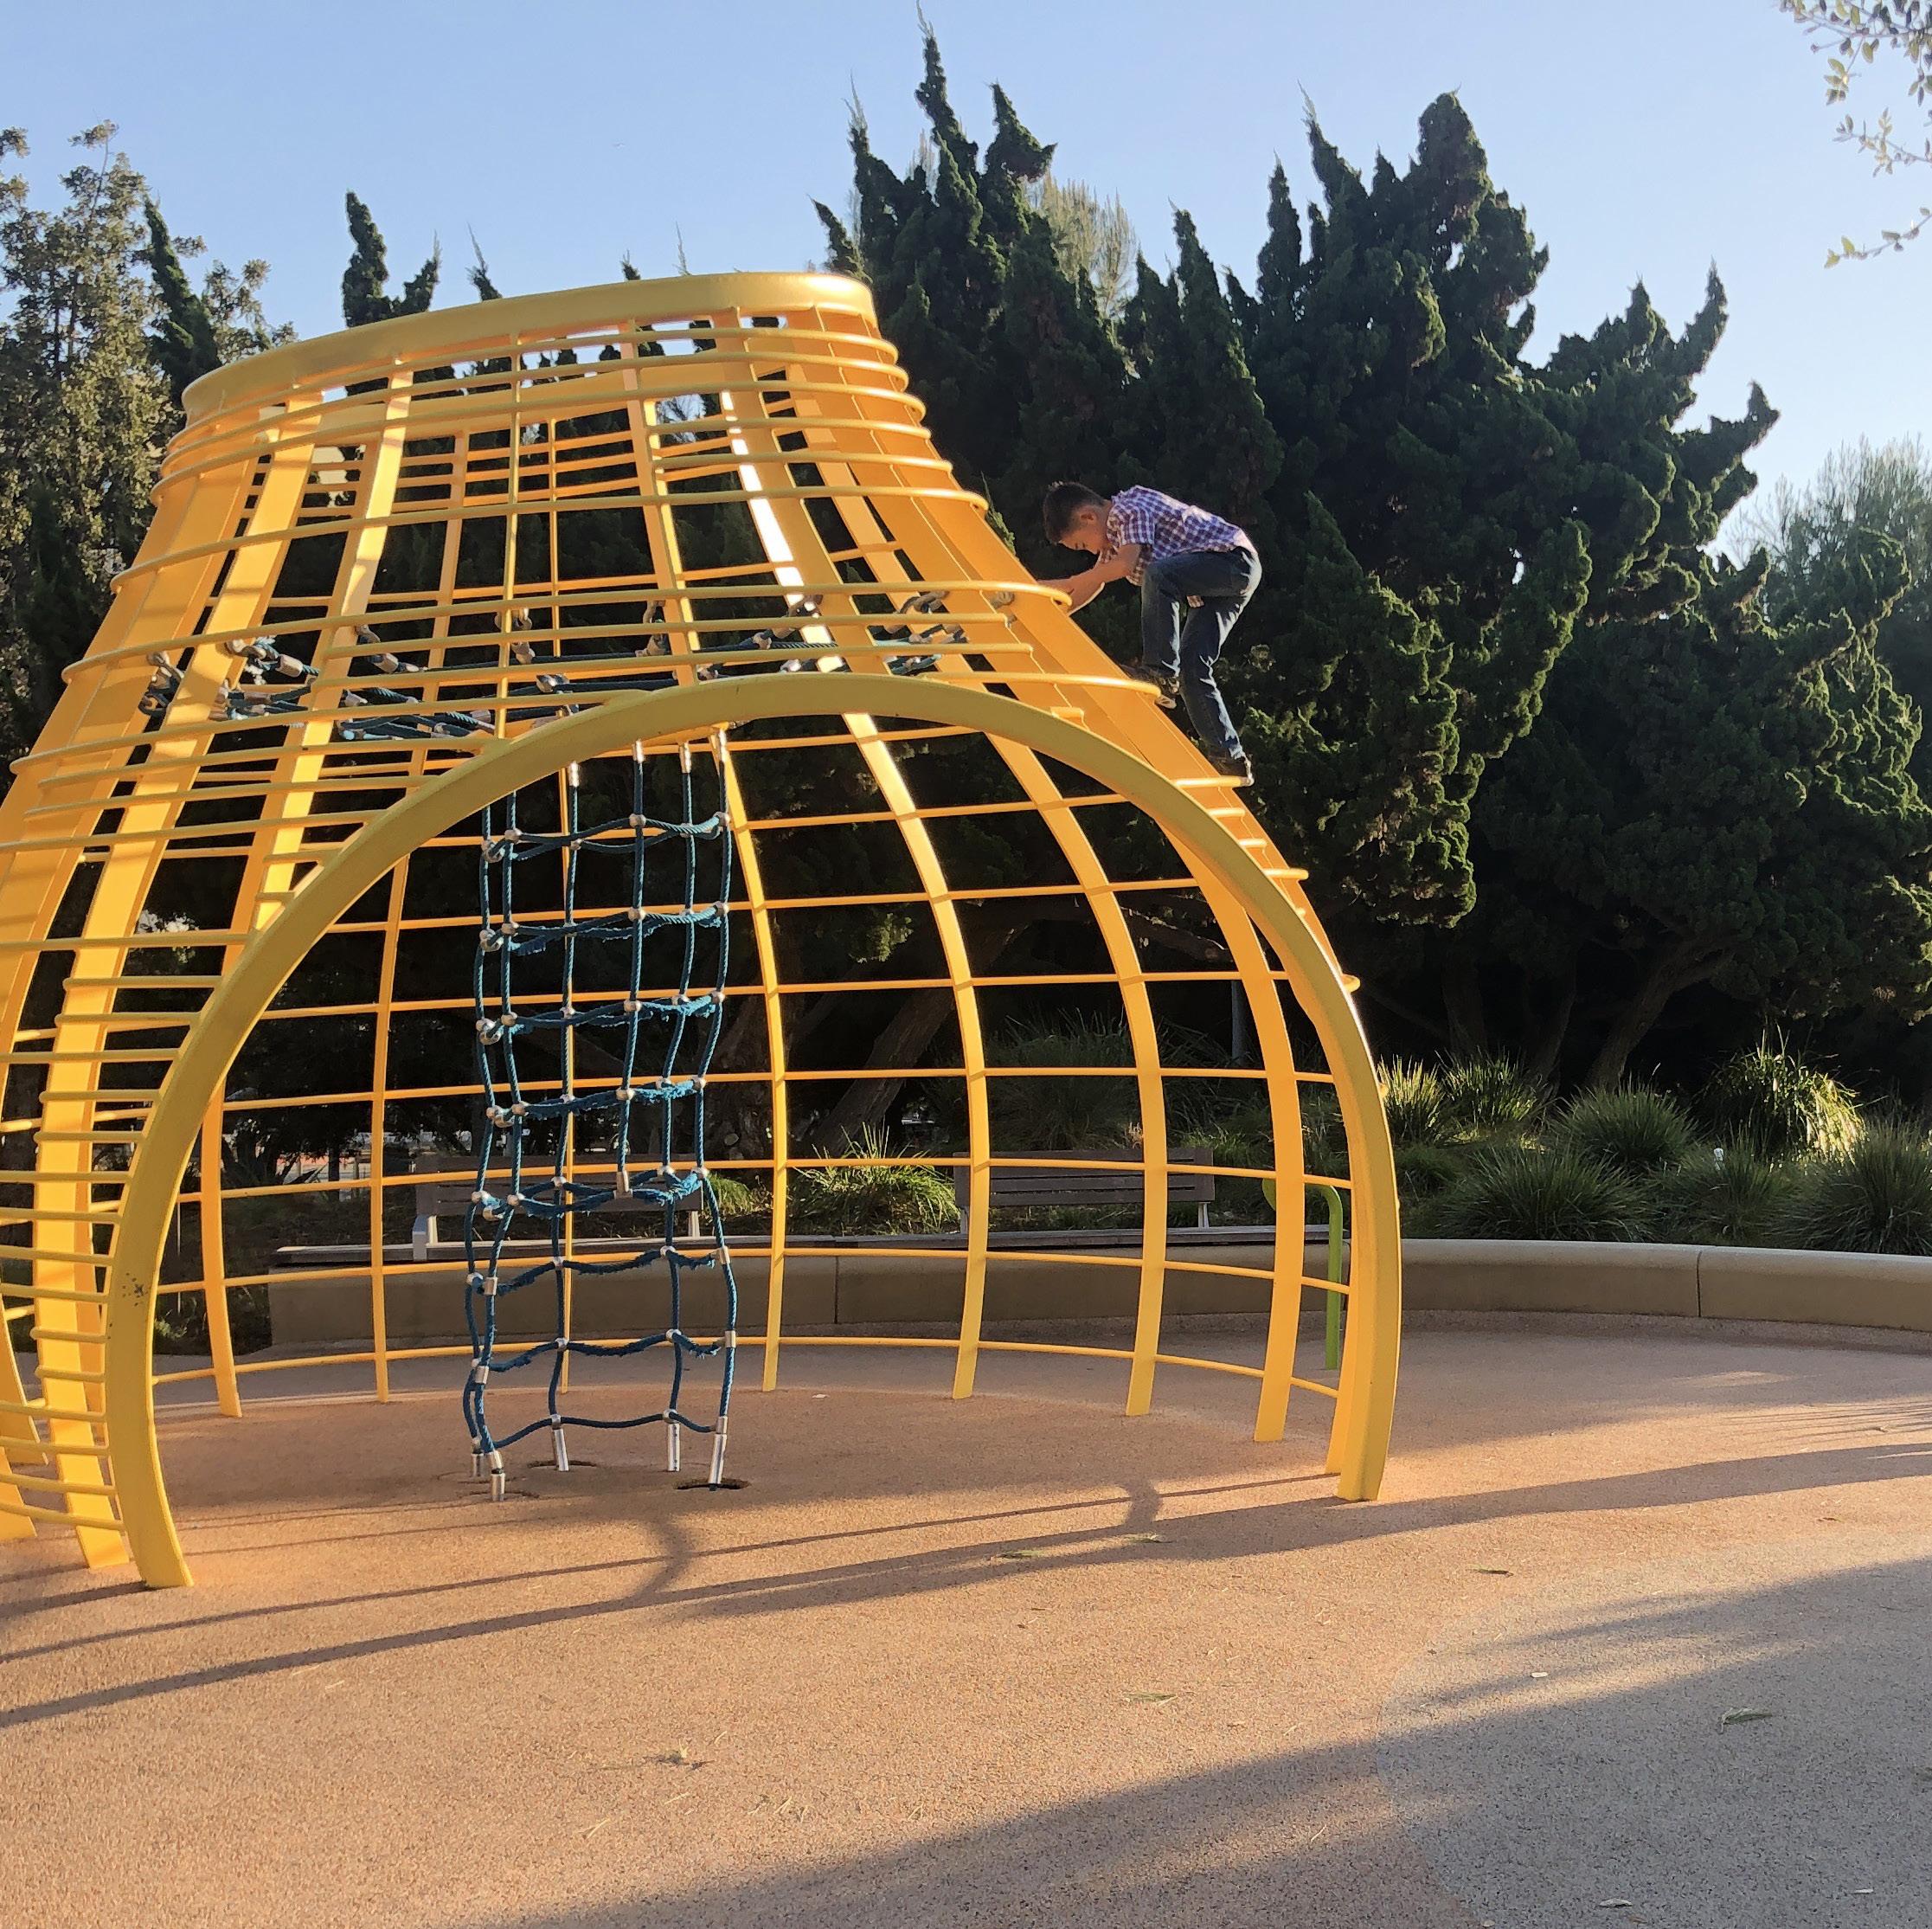
PLAYGROUNDS WITH
FEATURES HAVE 17% MORE USERS
TOWER 28
29 DENVER PREMIUM OUTLETS PLAYGROUND DENVER, CO
PACO SANCHEZ PLAYGROUND DENVER, CO
SPEED
PLAYGROUNDS WITH HIGH
FEATURES HAVE 18% MORE USERS
31
31% WITH SPINNERS HAVE PLAYGROUNDS LONGER STAY TIME
32
PLAY FOR THE WHOLE FAMILY
People, regardless of age, are attracted to similar play experiences that activate their vestibular and proprioceptive systems.
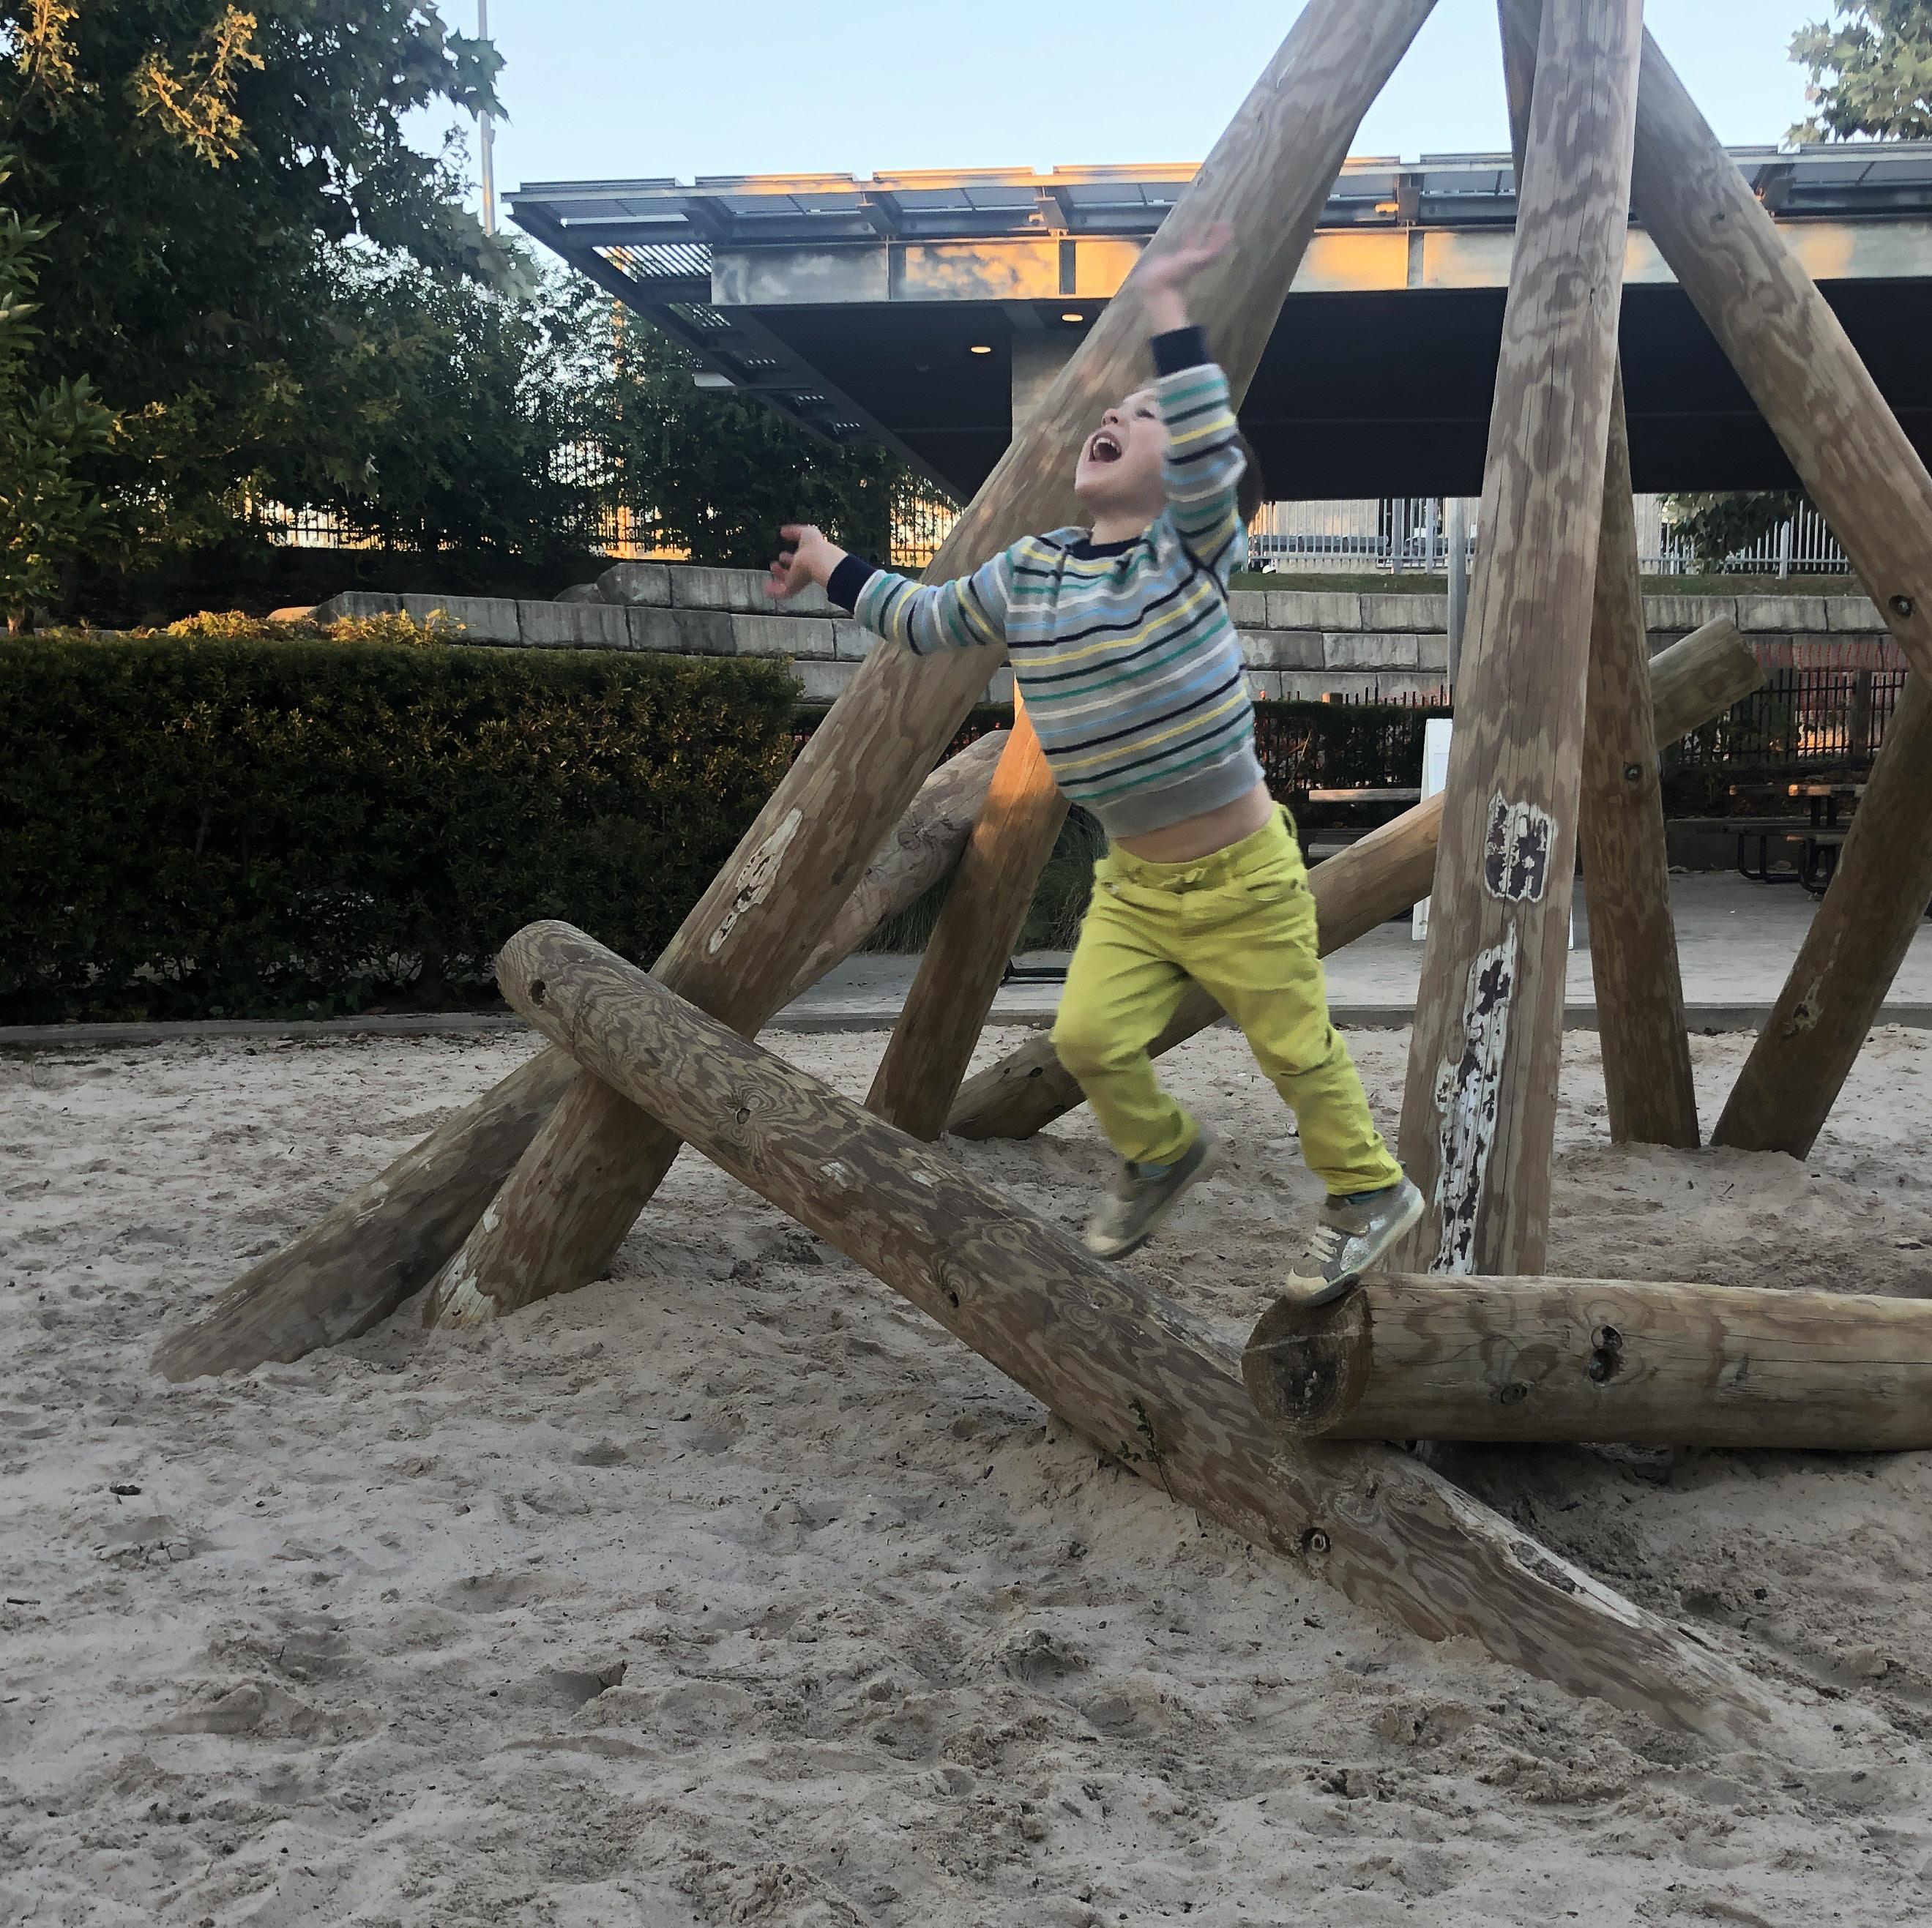
Swings are the most used play feature, but climbing, particularly on larger scaled, flexible climbers that invite older users and provide dynamic physical and social interactions with others, added 4% more visitors and 6% longer stay time for each additional climbing structure.4
Spinning was hugely popular and encouraged up to 31% longer stay time for each additional spinner. When looked at as a family of high-speed elements, spinners, zip lines, and very tall slides (greater than 6’) contributed to 18% more users for each added feature.
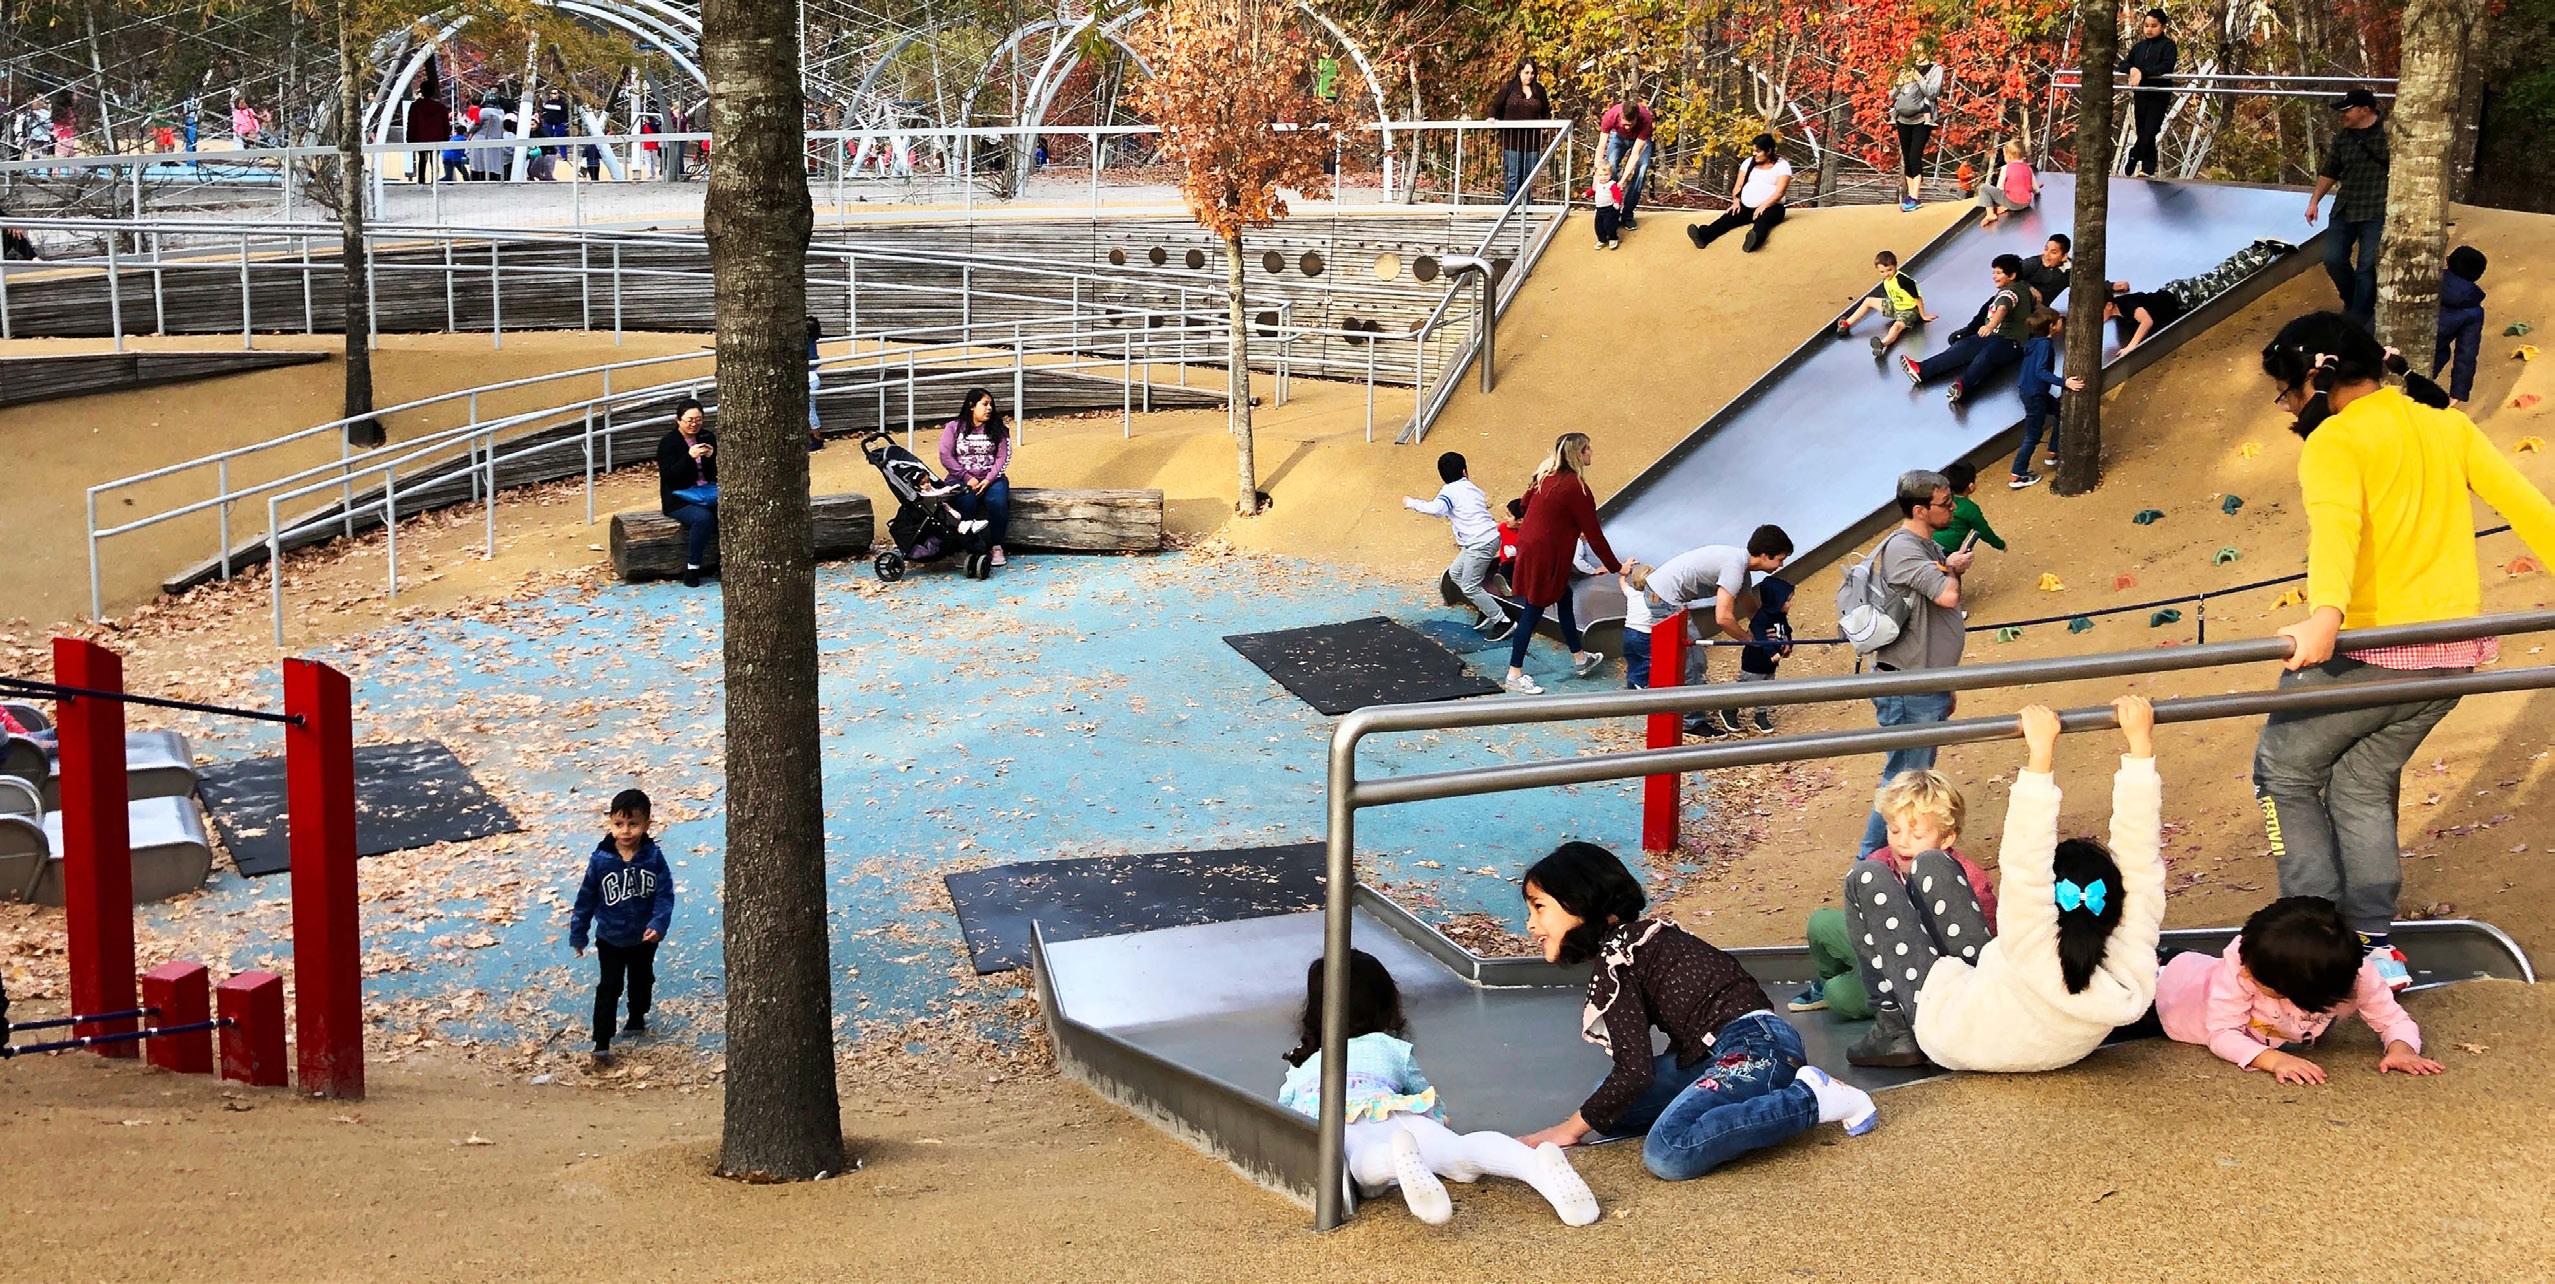
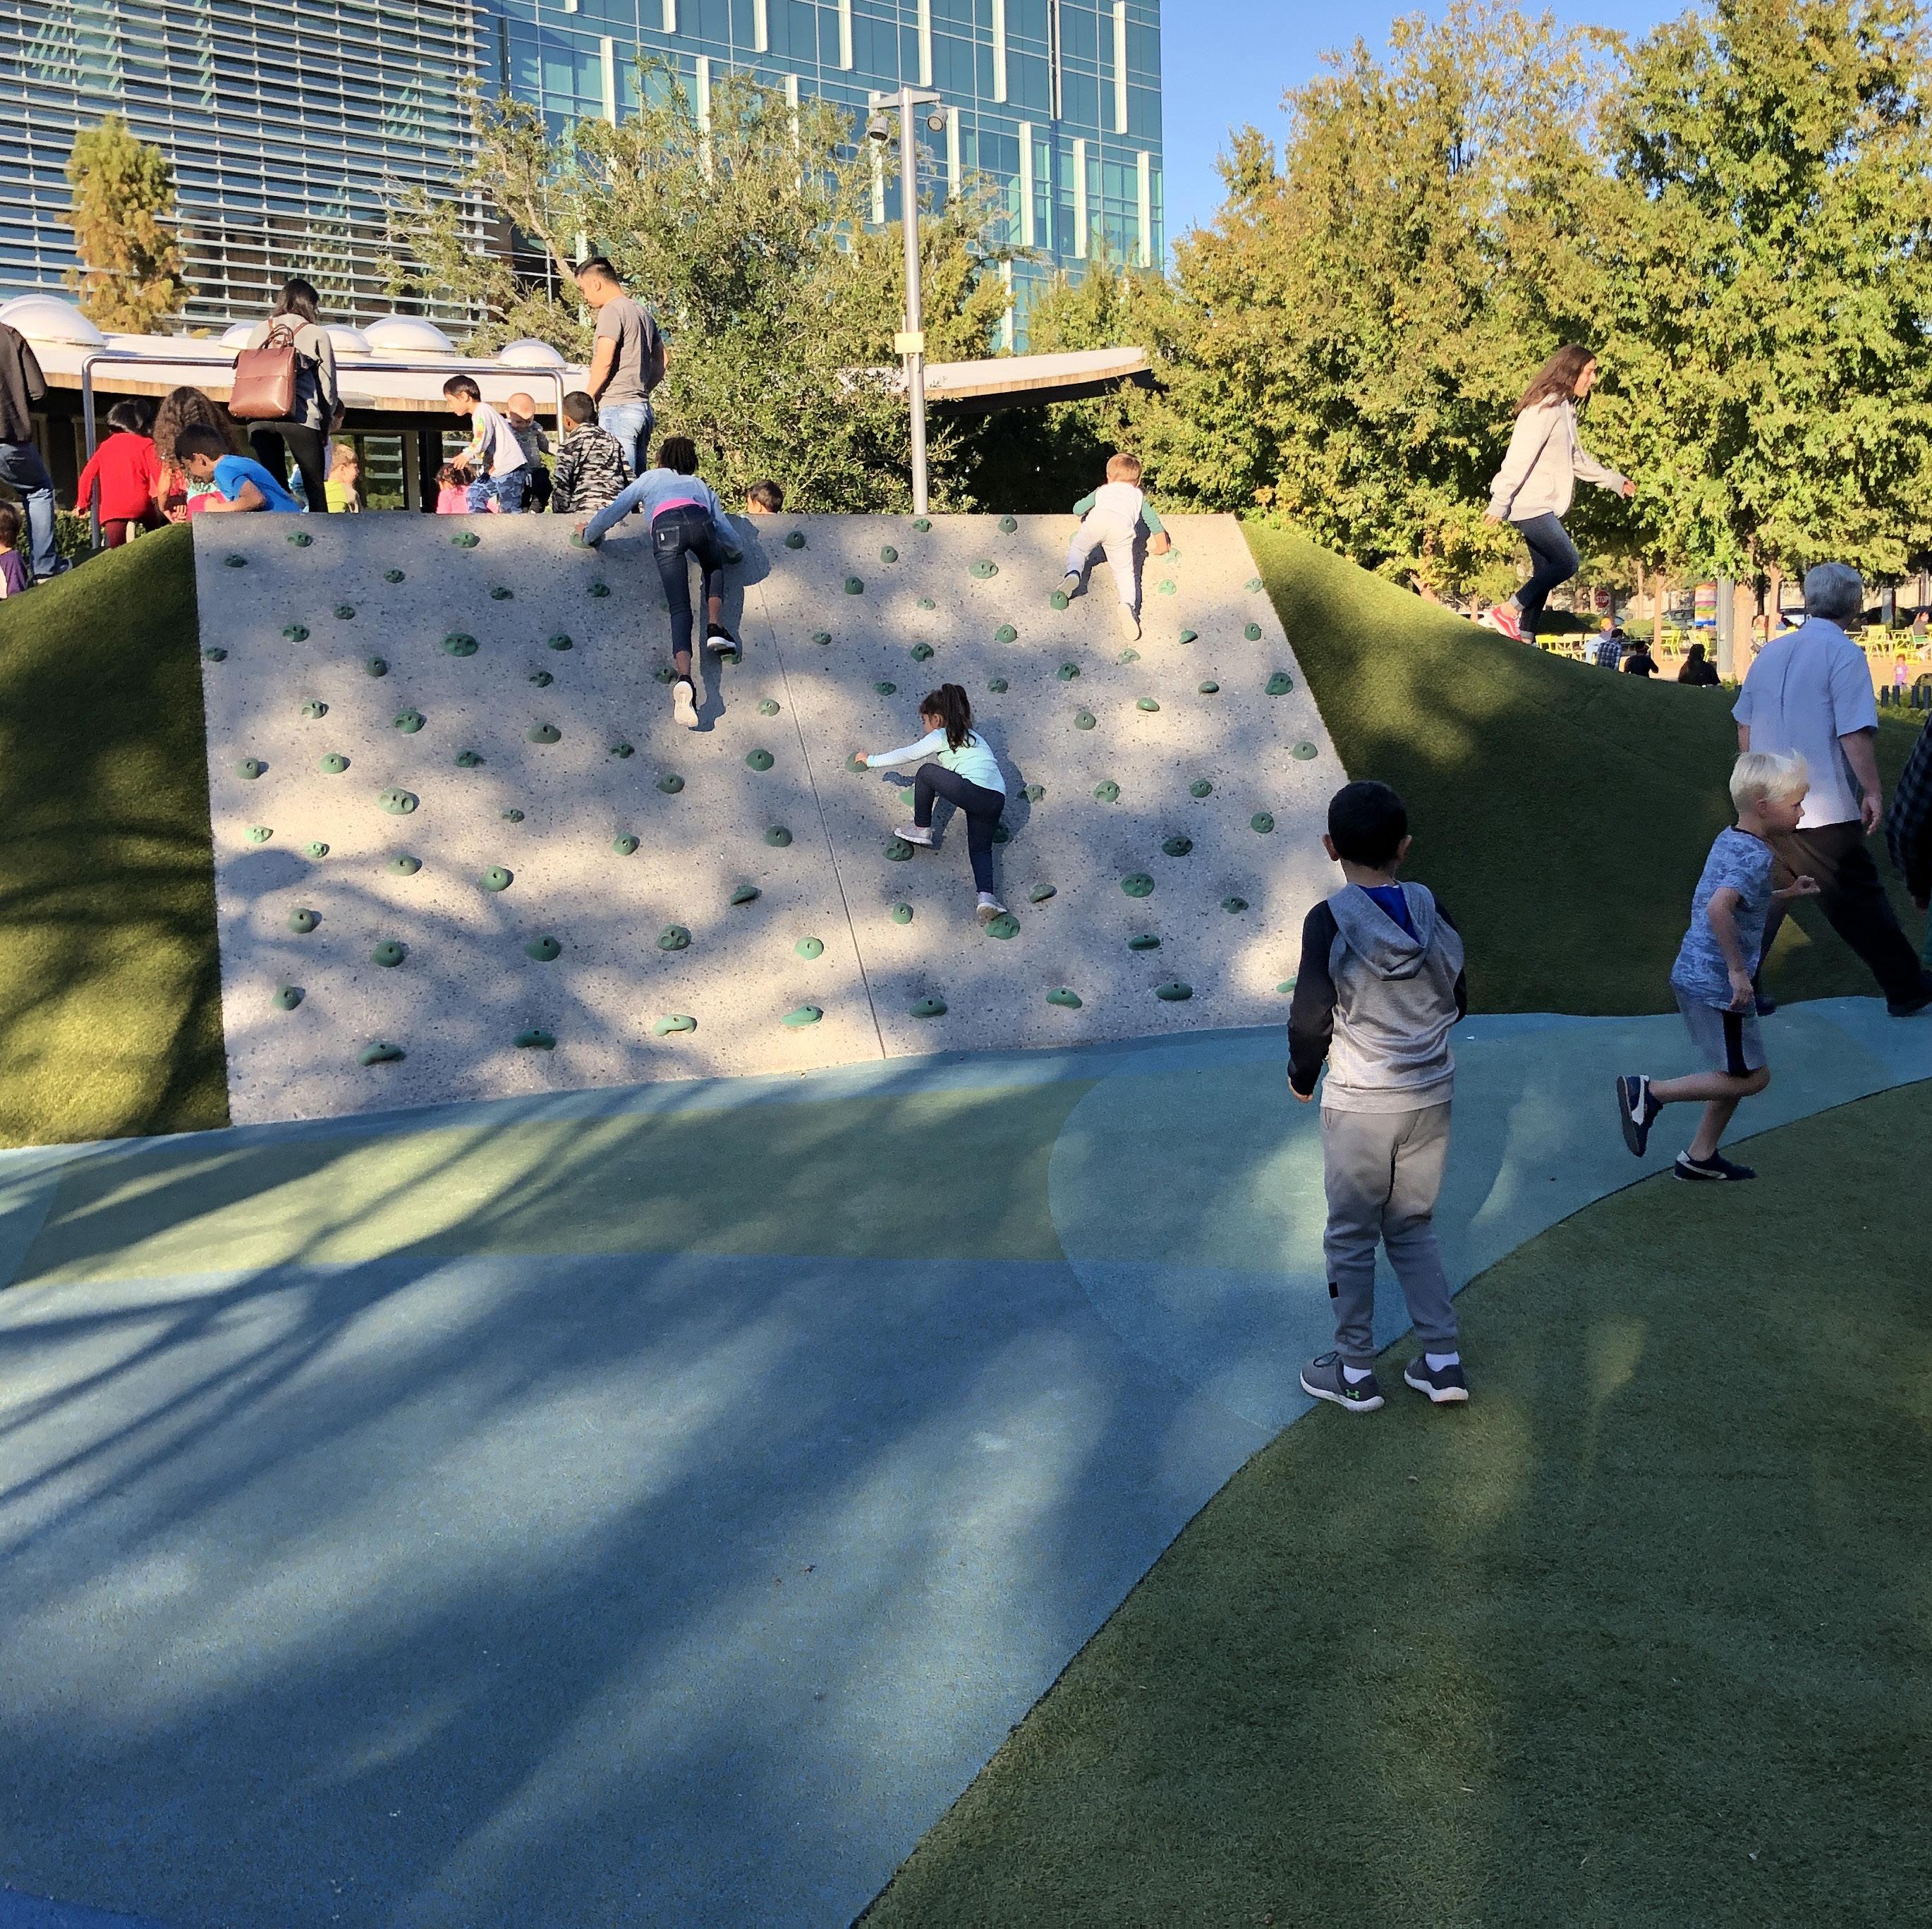
Additionally, playgrounds with tall towers (greater than 6’) have 17% more users for each additional tower. Berms, which are hills that range from small bumps to giant embankments that encourage scrambling and sliding, added 9% more users for each one added.
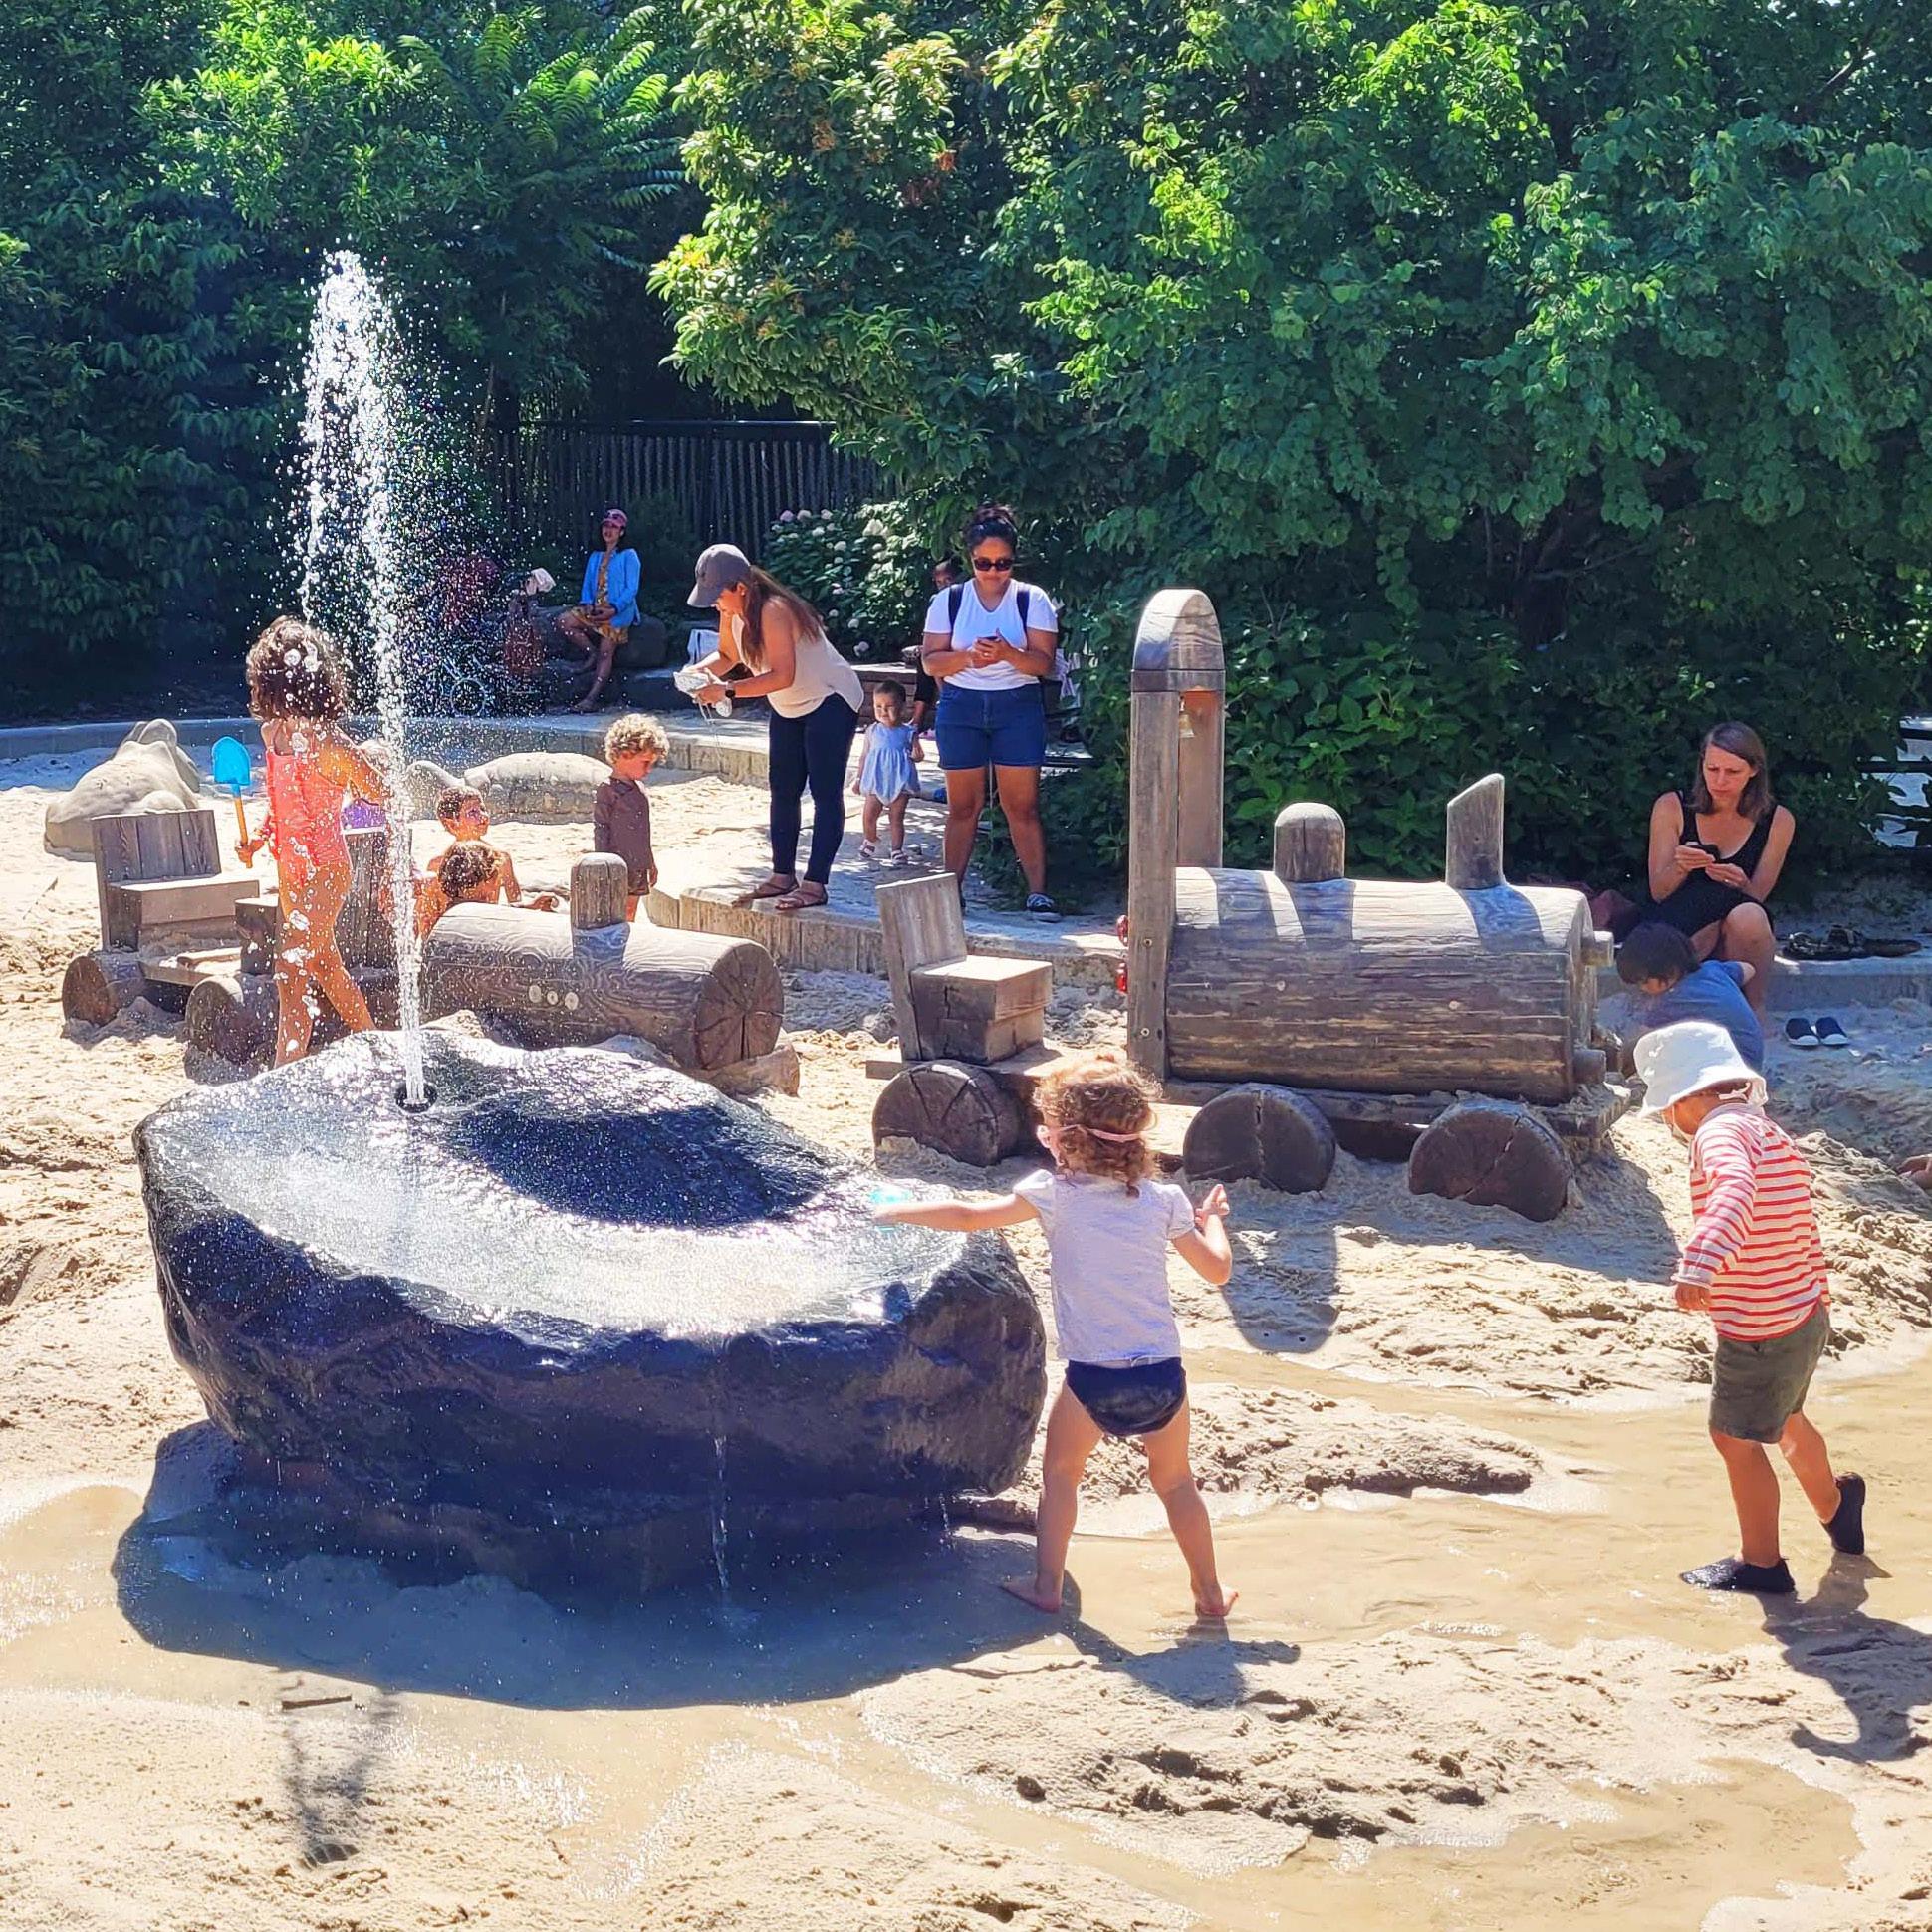
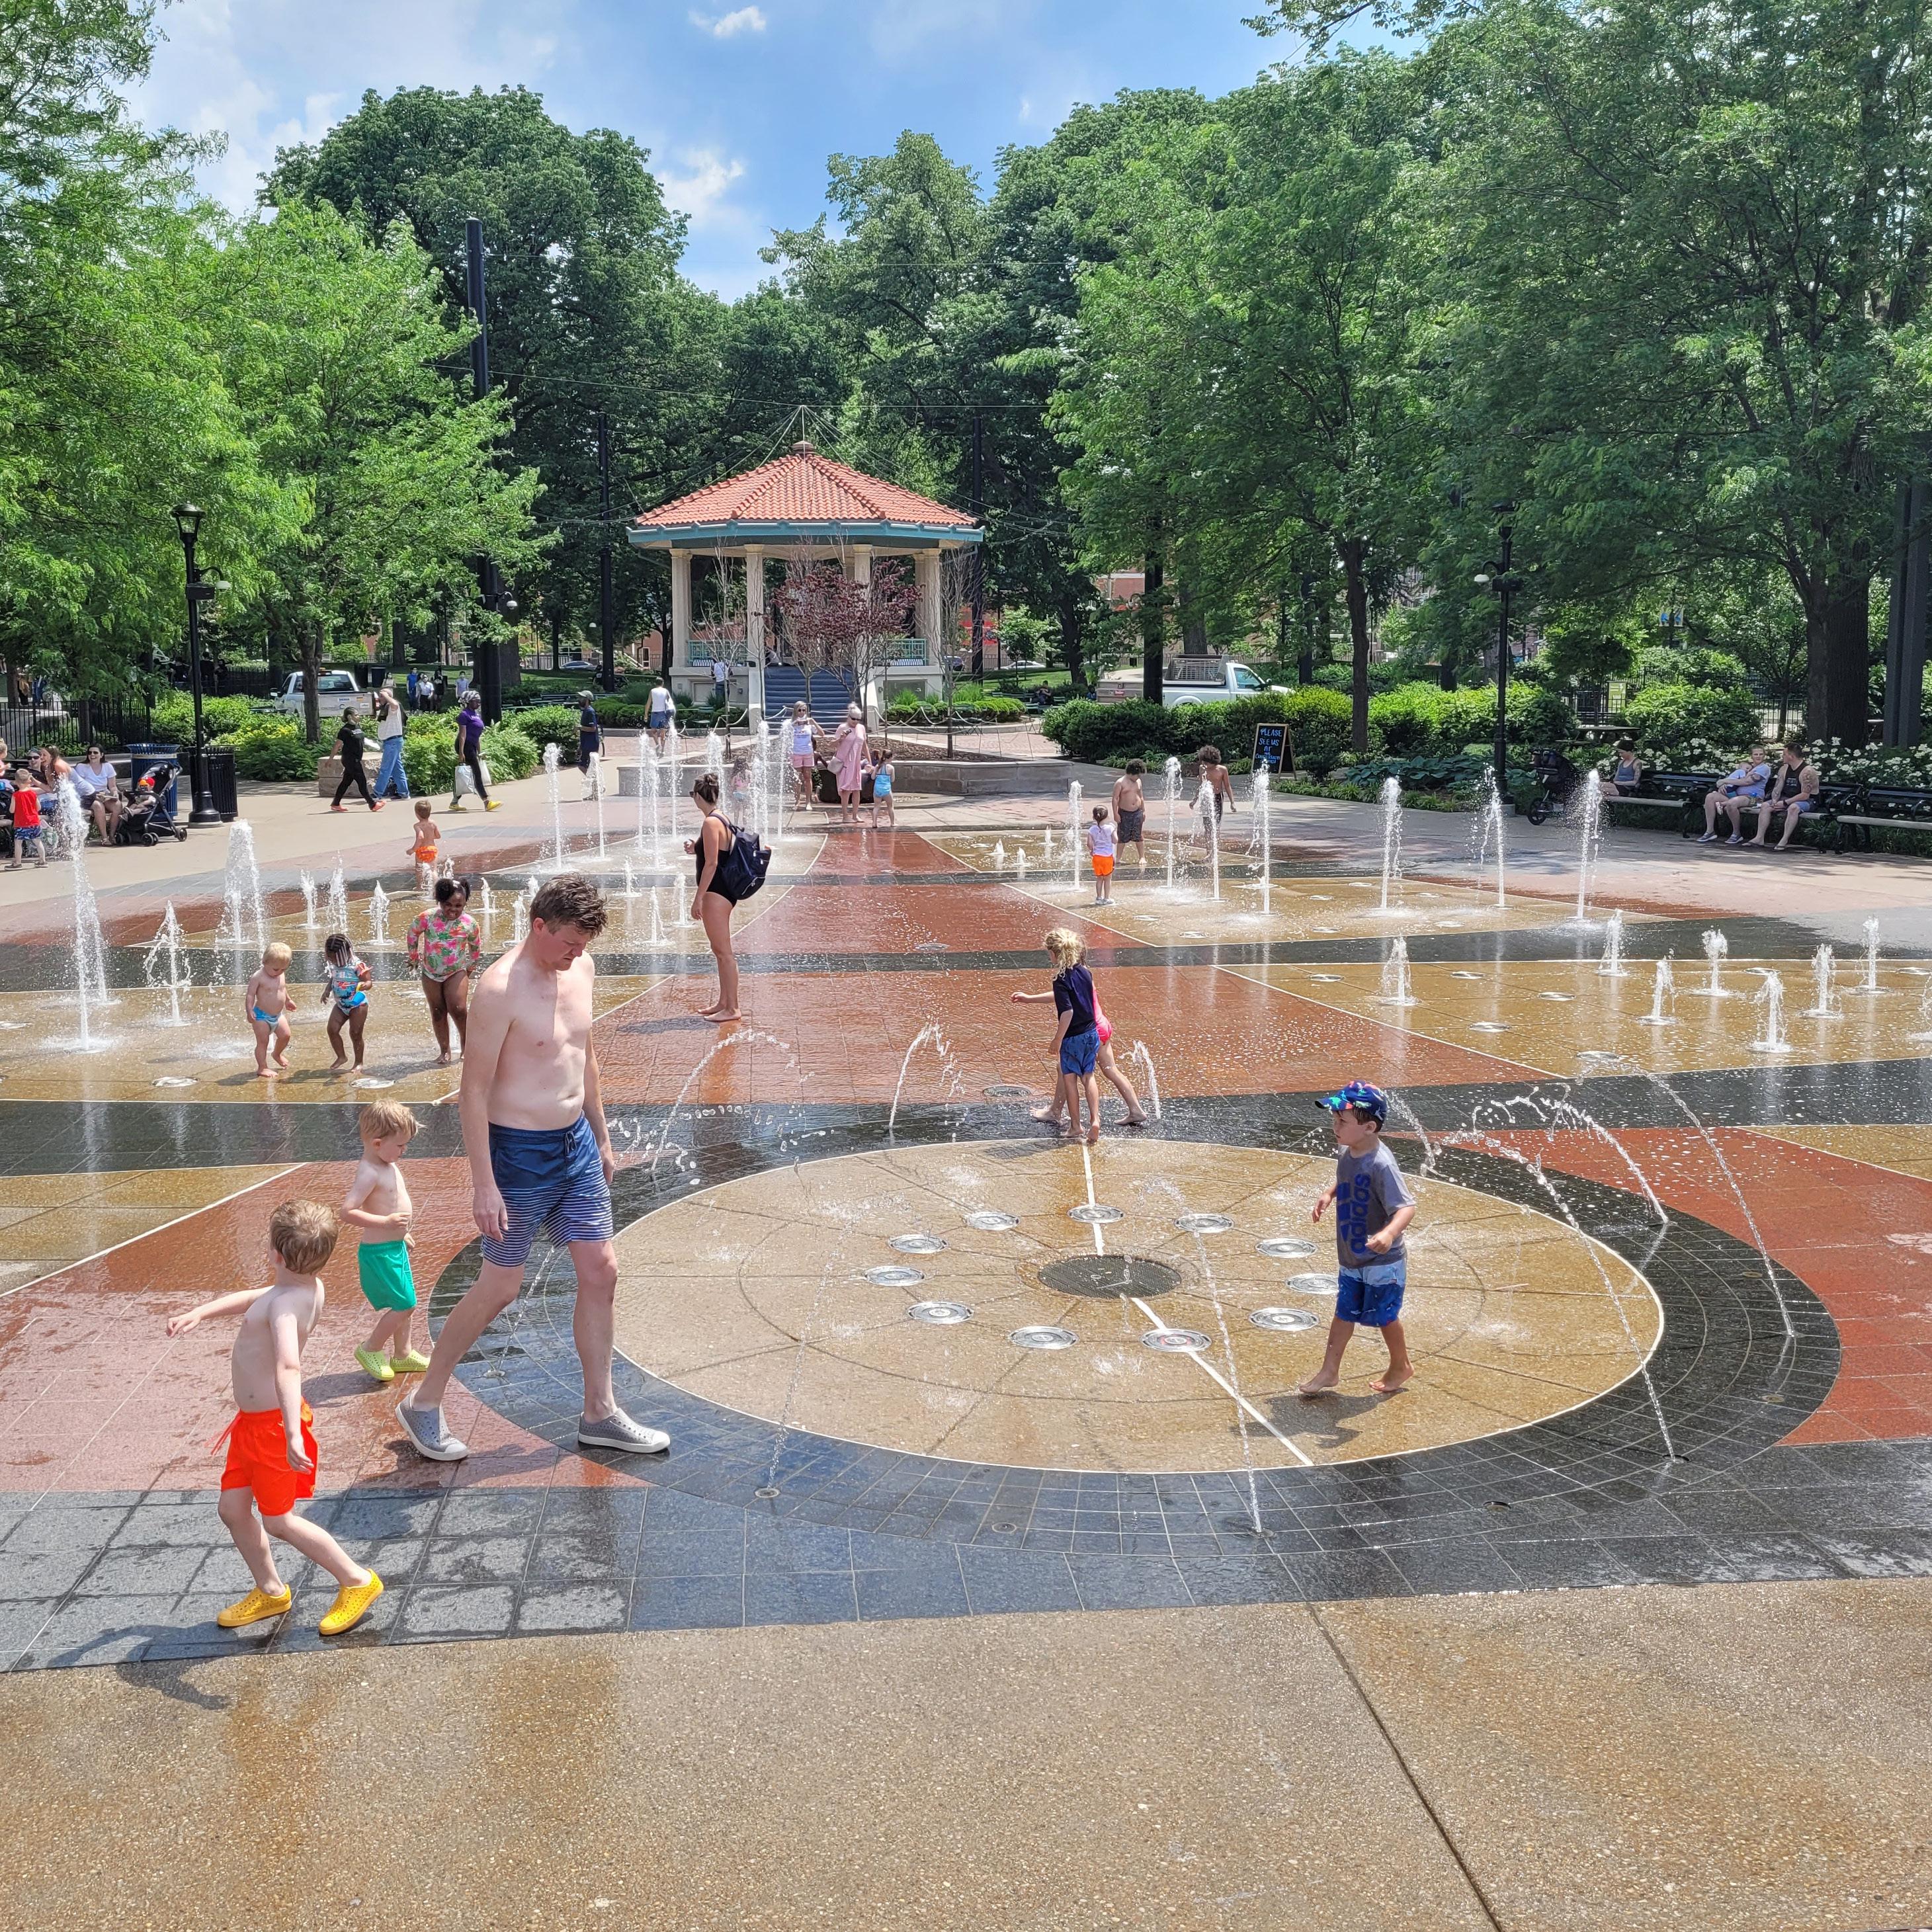
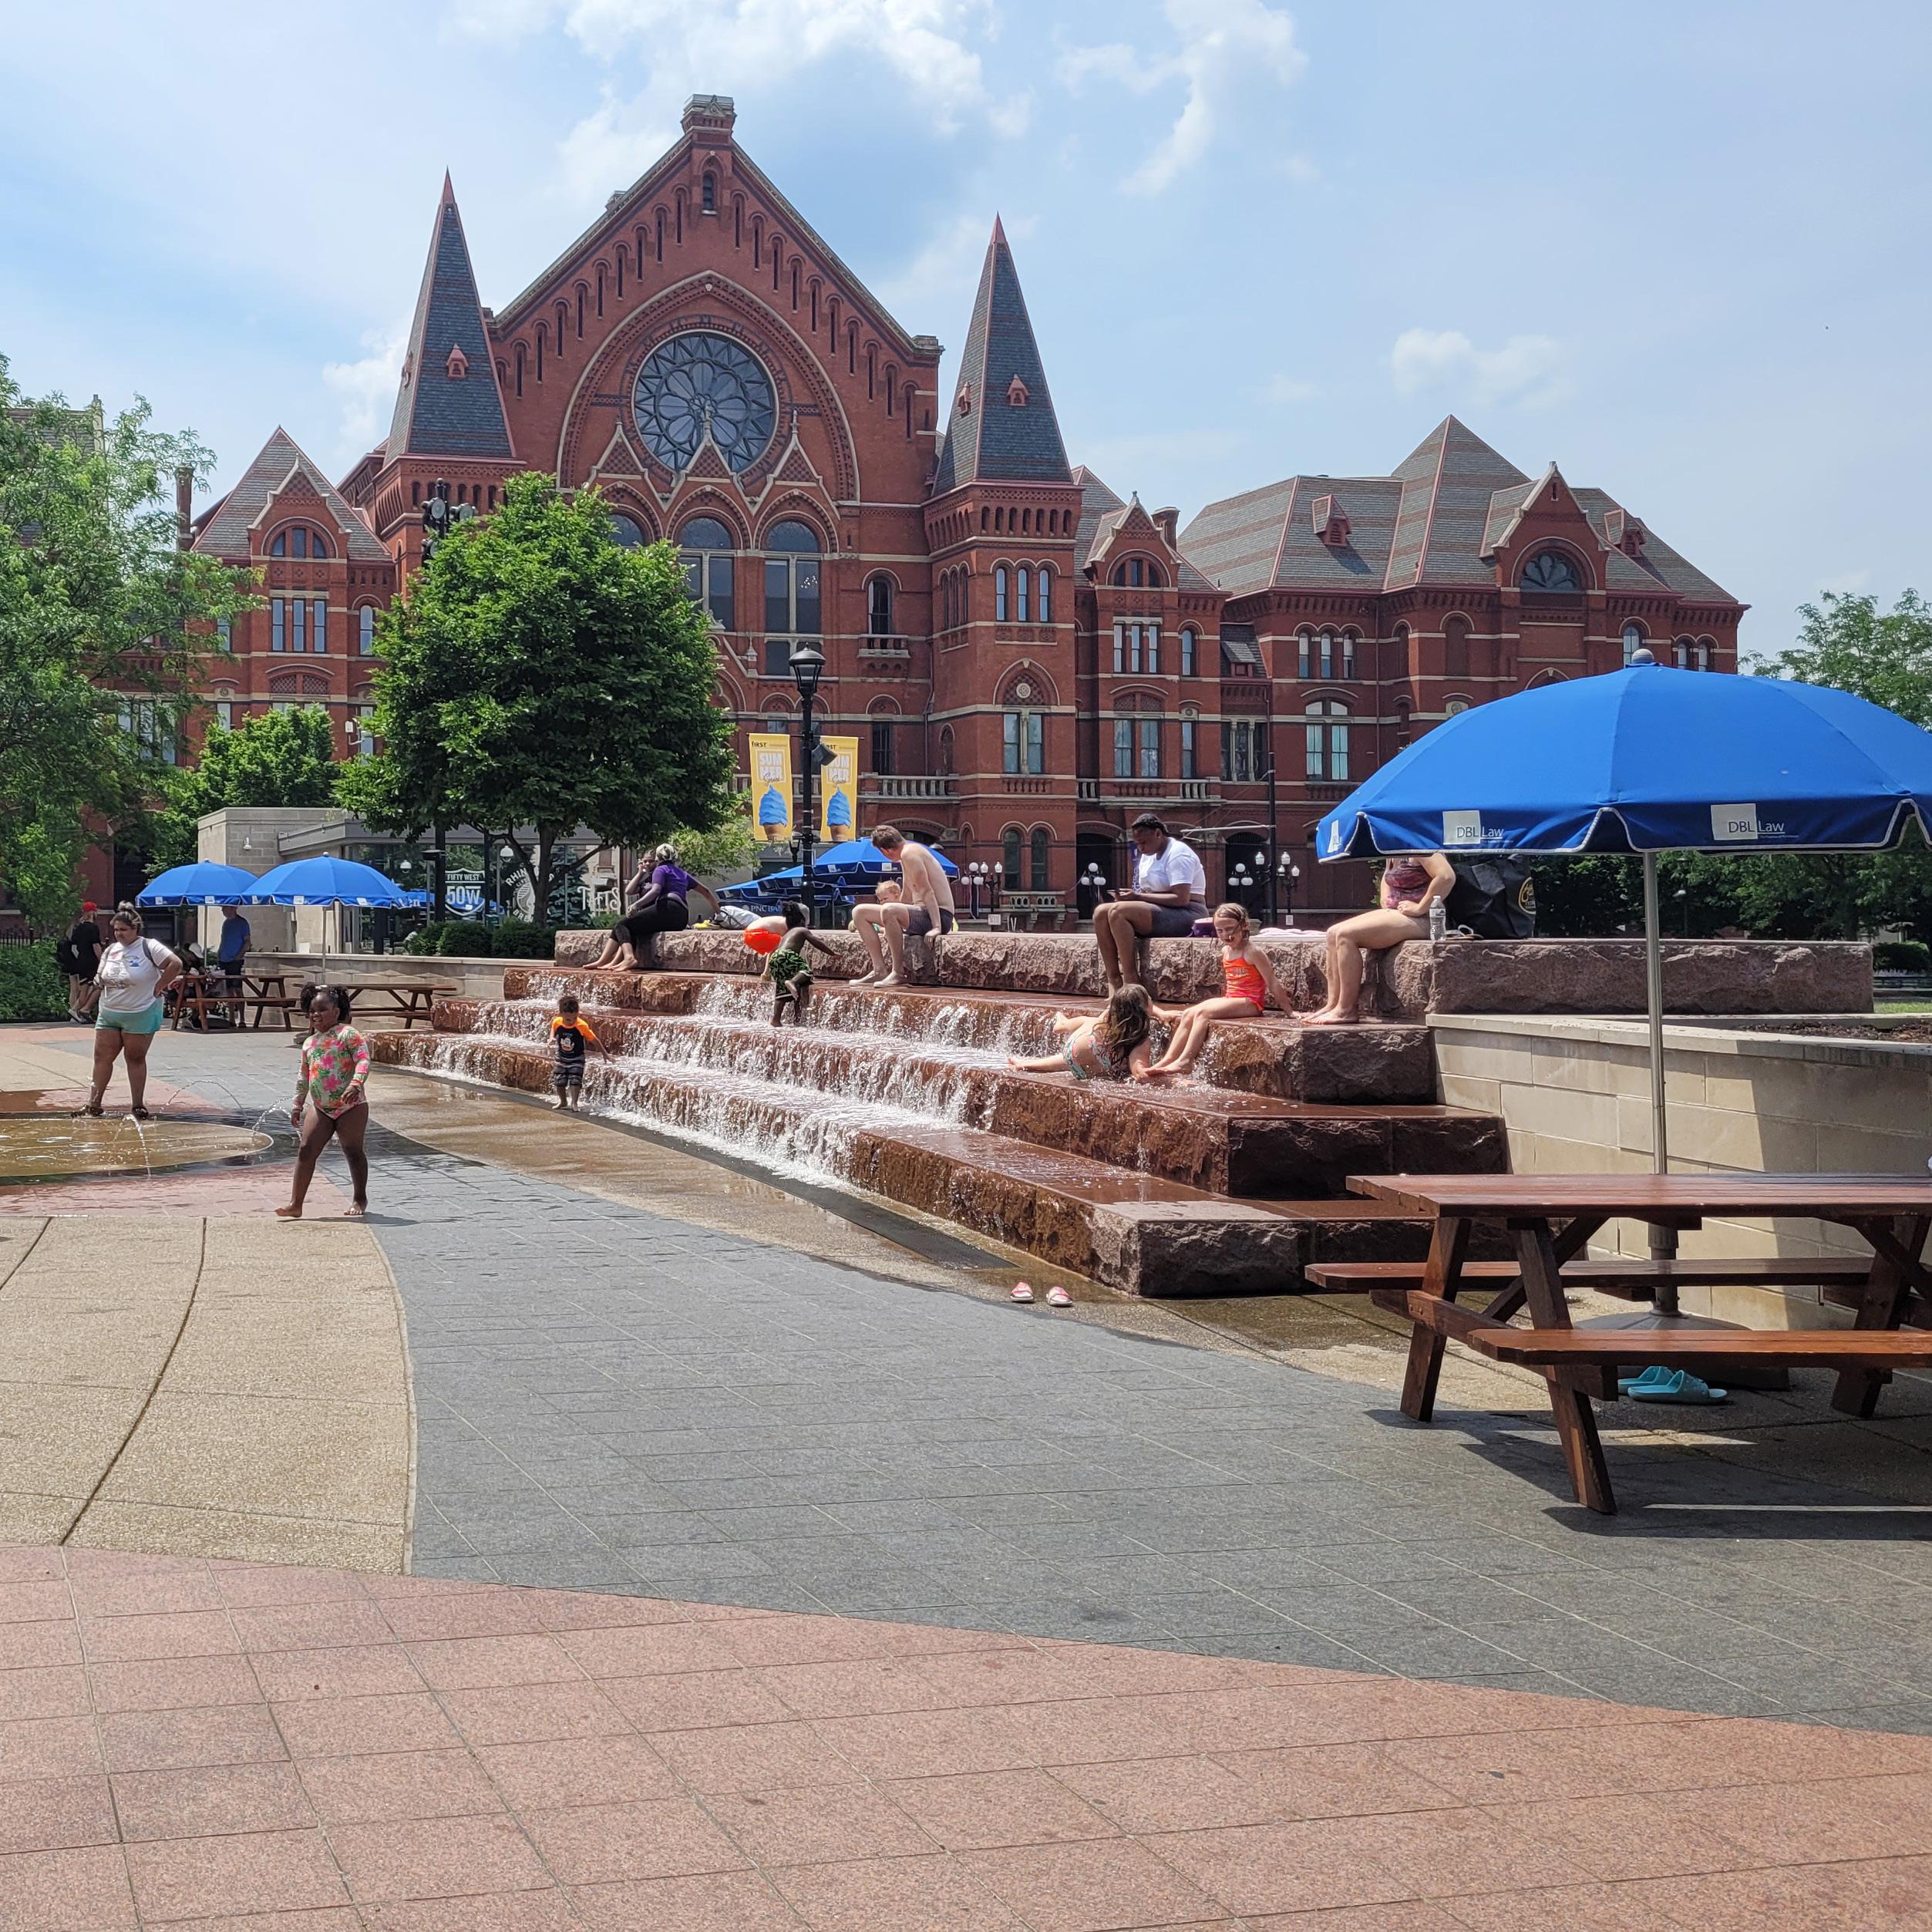
For the ultimate in full body sensory experiences, water play, including ponds, streams, splash pads, and manipulative pumps and dams, increased physical activity for children by 80%!
4 Playground Design: Contribution to Duration of Stay and Implications for Physical Activity, Environmental Research and Public Health, 2023.
33
LEVY PARK HOUSTON, TX
ADDS EACH BERM
9% MORE USERS
35
INCREASE PHYSICAL ACTIVITY FOR CHILDREN BY 80% WATER PLAY
WITH
36
WASHINGTON PARK PLAYGROUND CINCINNATI, OH 37
38 LEVY PARK PLAYGROUND HOUSTON, TX
TREES PLAYGROUNDS
WITH MATURE HAVE 2X THE USERS 39
WITH FULL OR MORE ACTIVITY ENCLOSURE PARTIAL IN PLAYGROUNDS
40
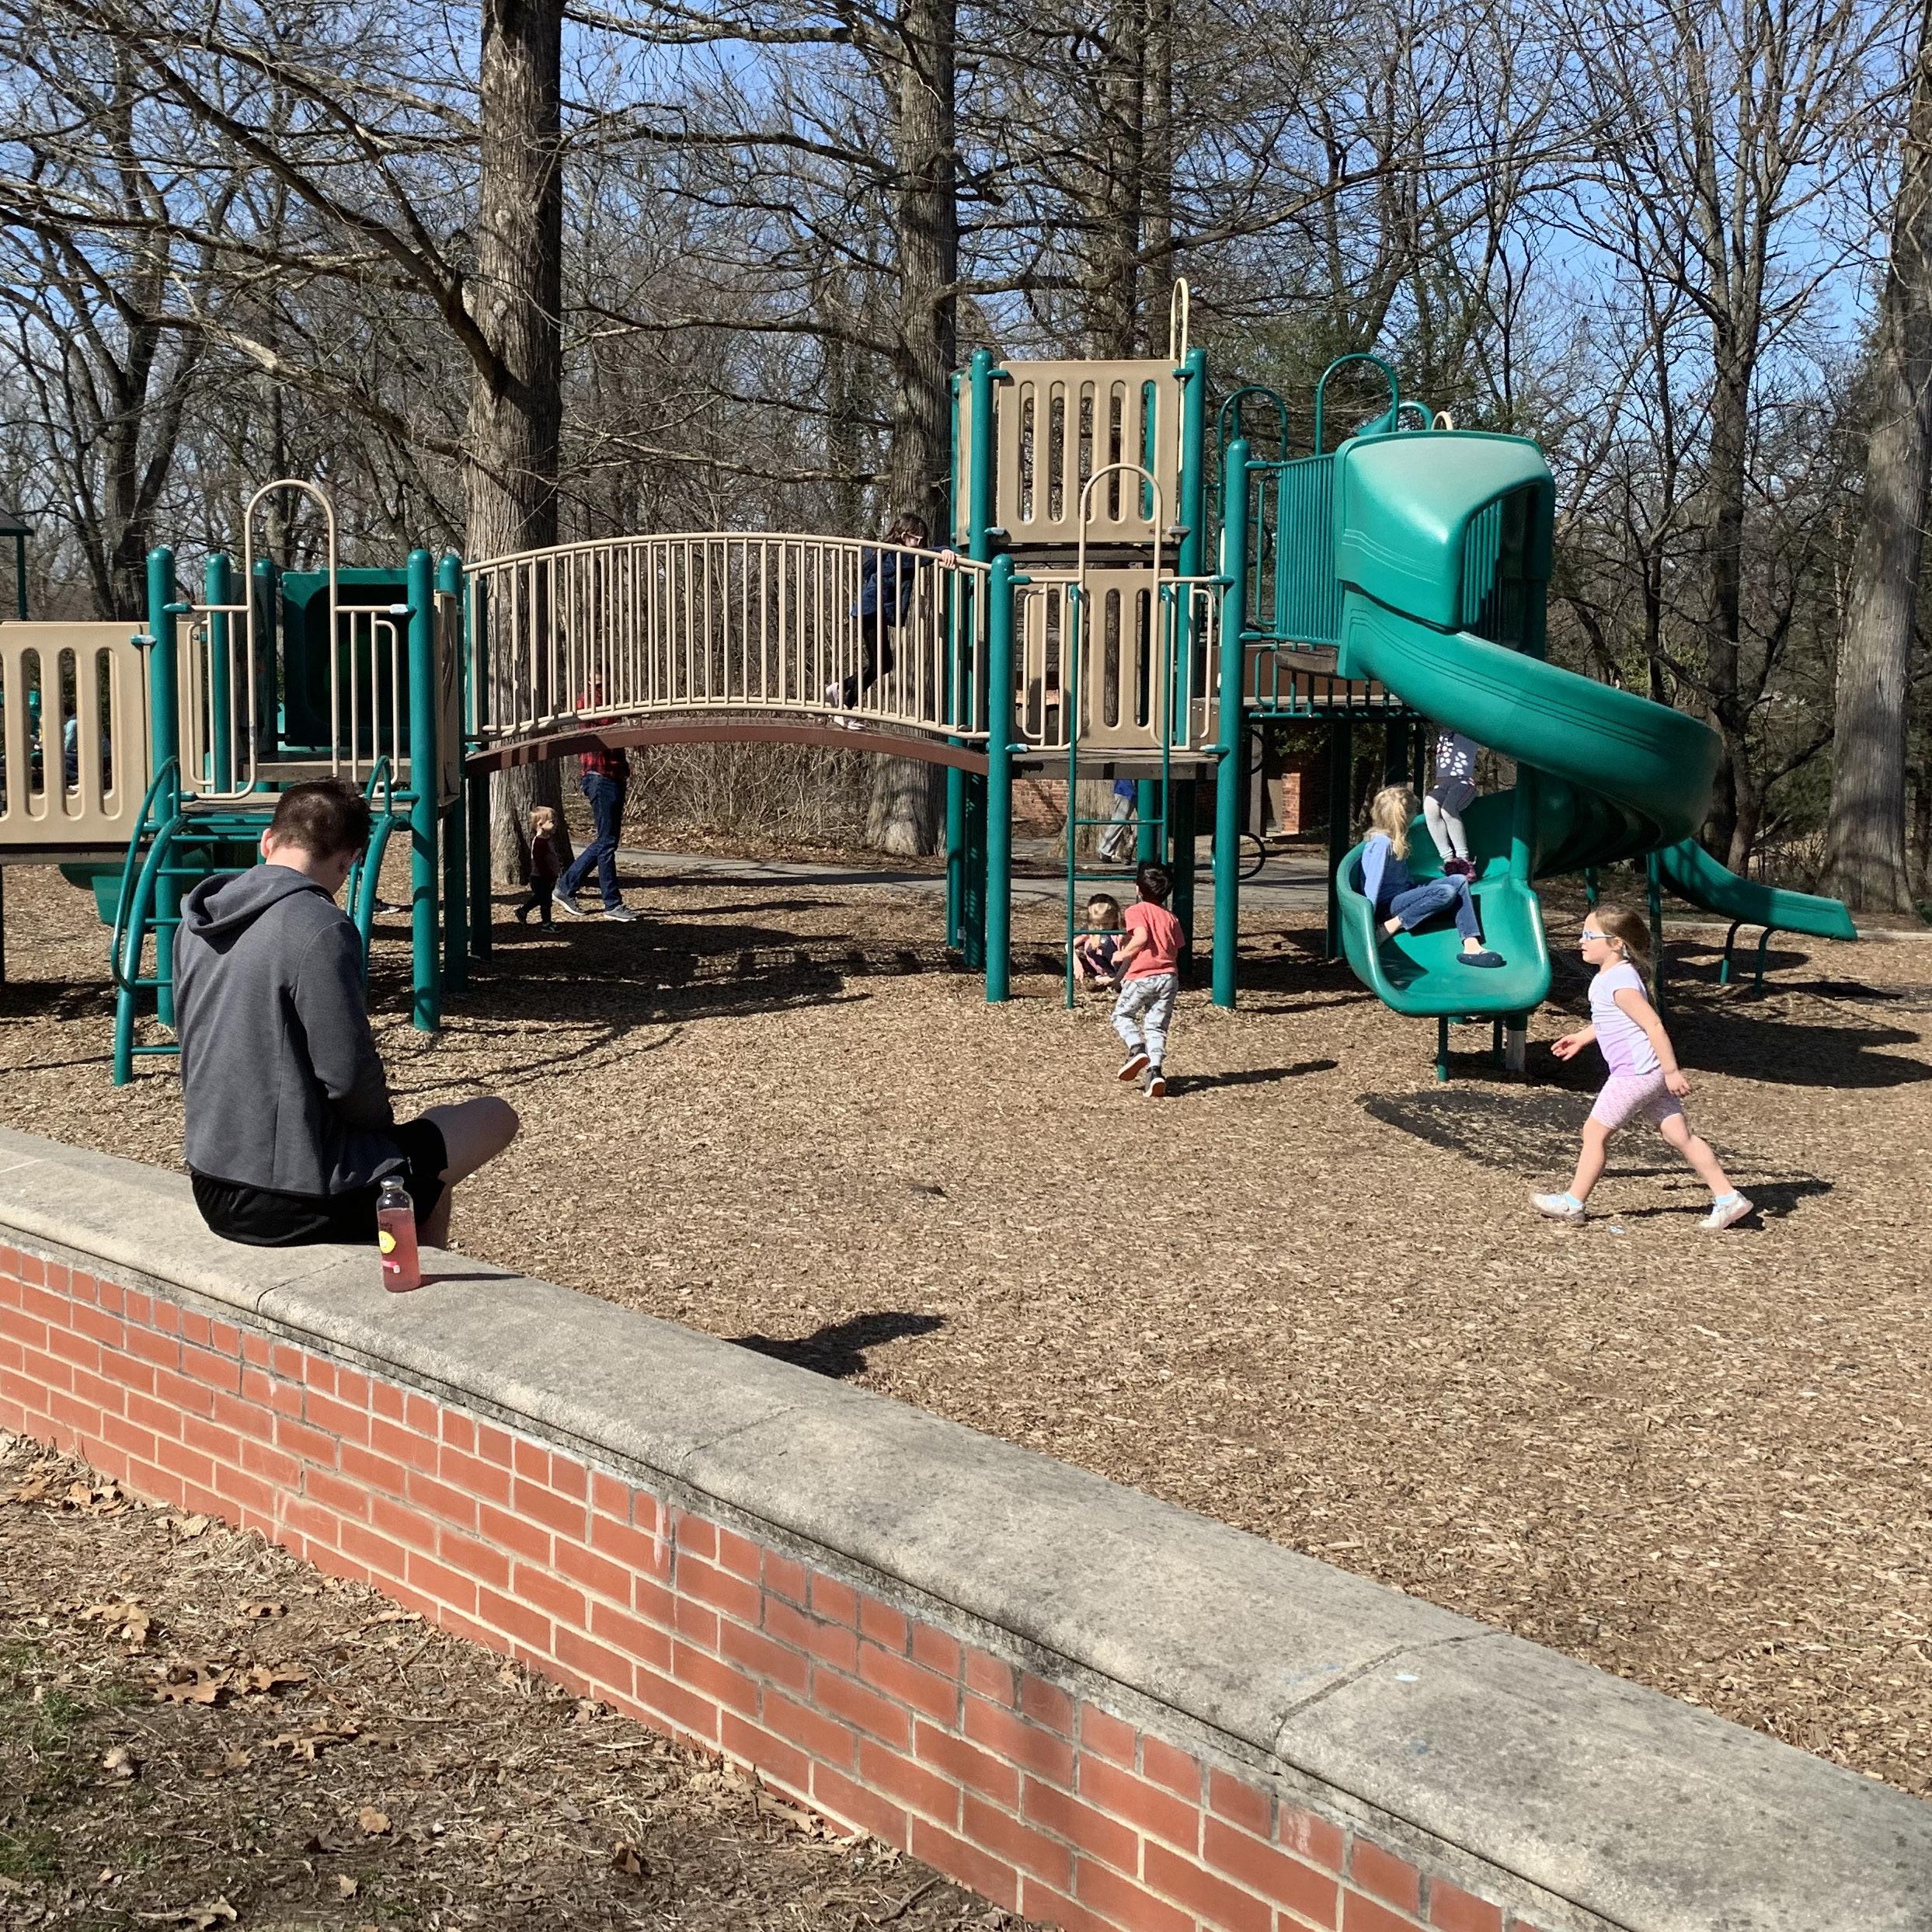
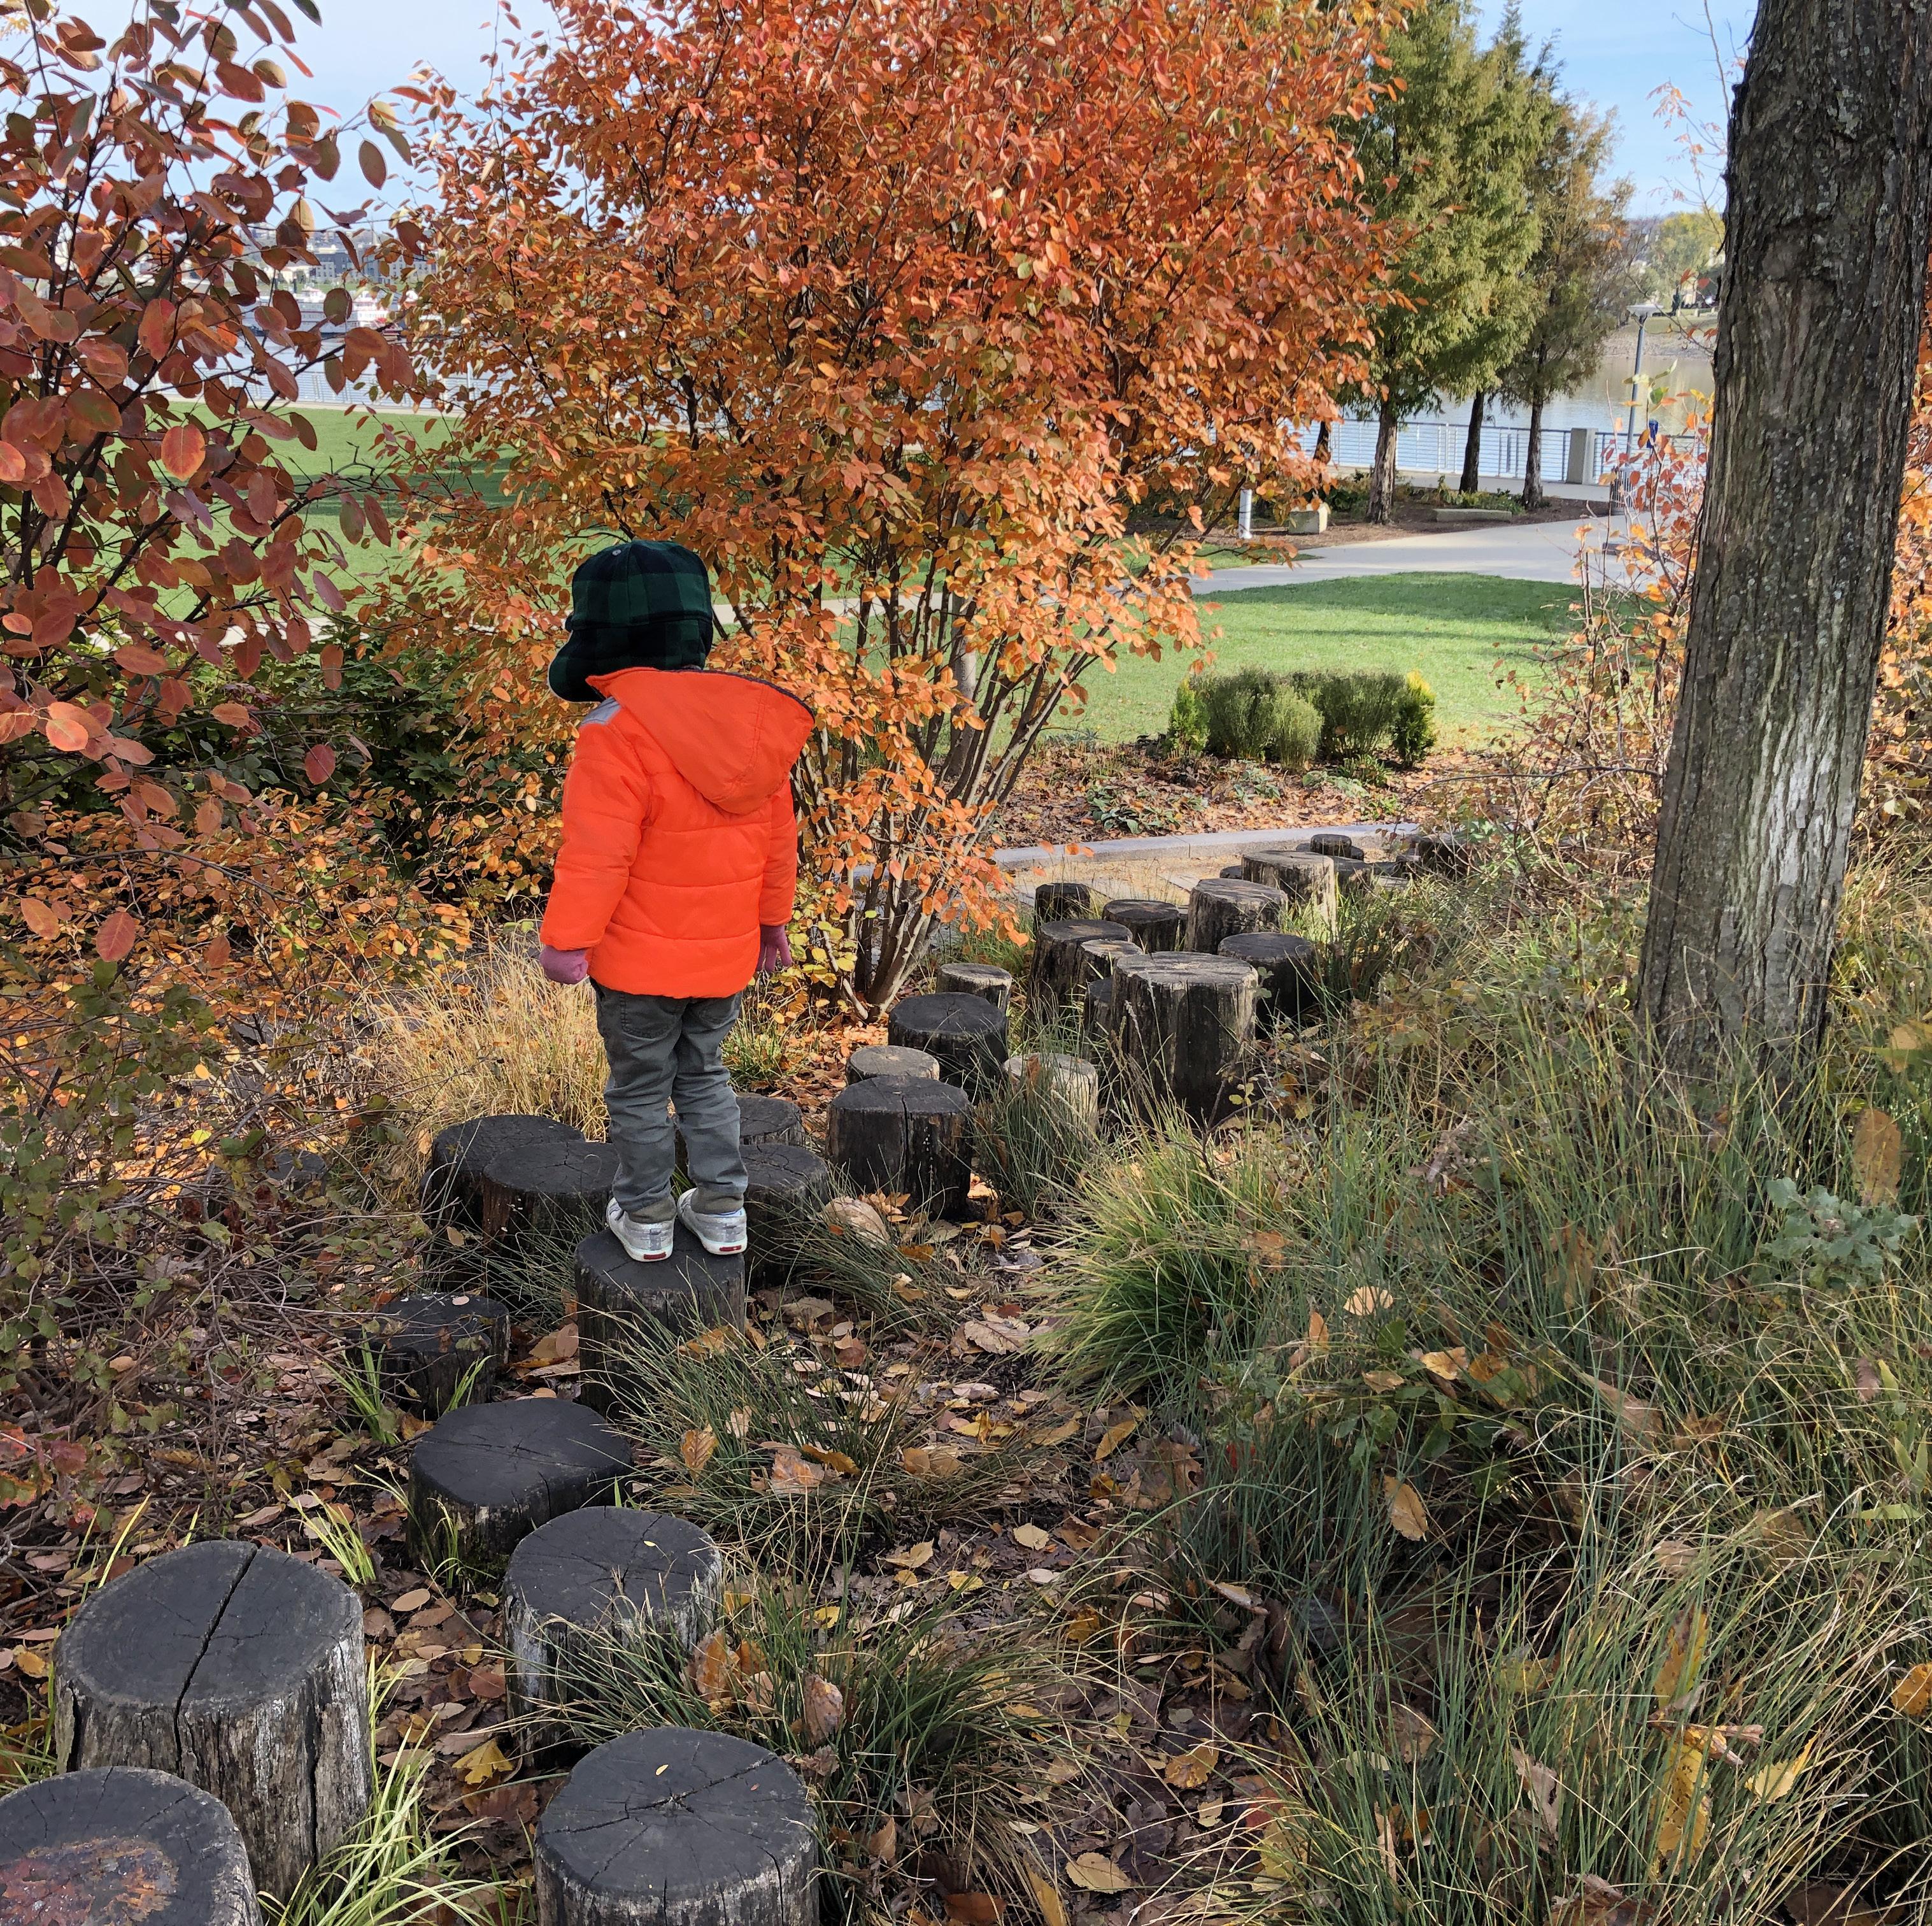
ENVIRONMENT MATTERS
The landscape of a playground has a significant influence on use.
We developed an atmosphere scale to measure the impact: 1 has new trees/ immature shrubs; 2 has mature shrubs; 3 has immature trees; 4 has mature trees outside the playground; and 5 has mature trees inside the playground.
For every scale increment, there was 26% more use, meaning that playgrounds with mature trees had twice as many users as those with no trees. Mature trees also increased the likelihood of longer playground stay time by 19%.4
We saw an increase in MVPA between 66-69% in playgrounds that were fully or partially enclosed with mature shrubs and fencing, potentially due to caregiver comfort in allowing children to roam. Enclosure needs to be balanced with visibility. Playgrounds with clear sight lines were more popular. For every 1000sf of visibility in the playground, there was an increase in use by 3%.
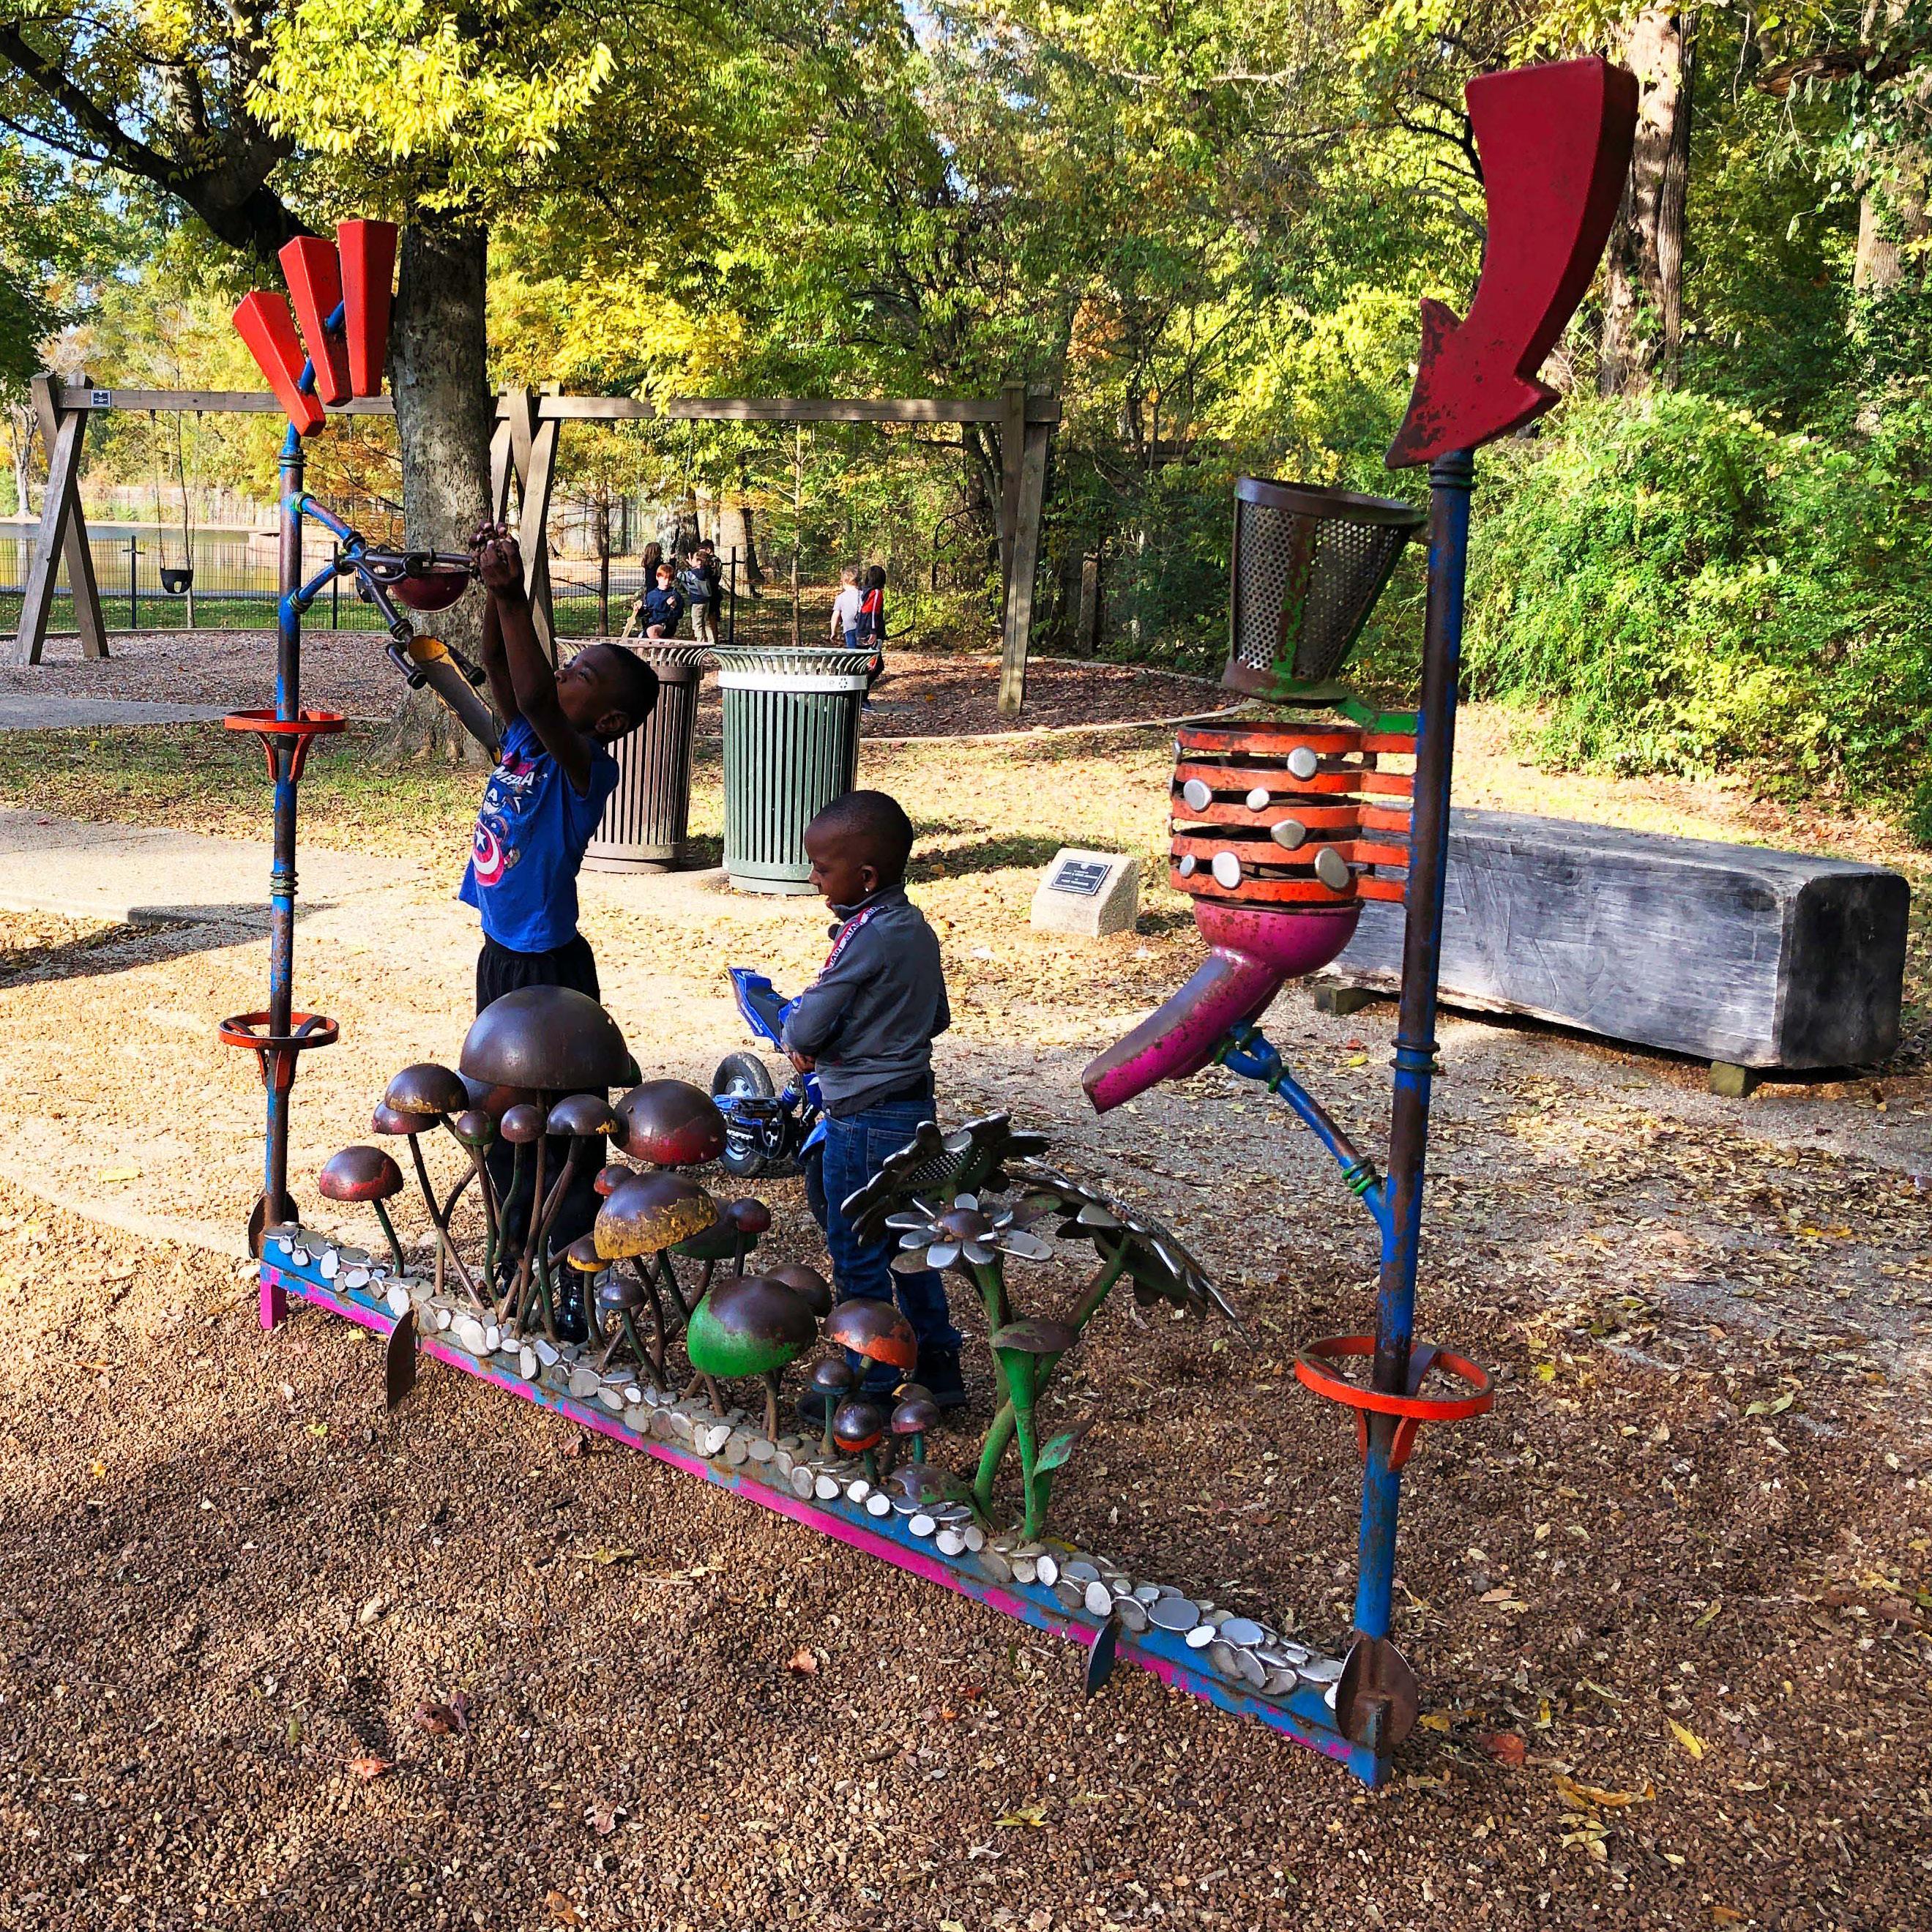
We found that getting adults moving meant encouraging them to play with their children, especially on play features they felt comfortable on, but also by having an environment with loose parts, from blocks and toys, to sticks and flowers, to site surfaces that invited interaction, like sand and wood chips.
A balanced approach to playground design that focuses on the wellbeing and comfort of all visitors will help families establish lifelong health through play.
4 Playground Design: Contribution to Duration of Stay and Implications for Physical Activity, Environmental Research and Public Health, 2023
41
42 WASHINGTON PARK PLAYGROUND CINCINNATI, OH
EACH PICNIC TABLE ADDS 9% MORE USERS
43
PLAYGROUNDS WITH
RESTROOMS HAVE 44% MORE USERS
44
IF YOU BUILD IT, THEY WILL COME
One of the worst things a grownup can hear when they enter a playground is a small voice saying “I have to pee.”
Playgrounds are designed for the play of children, but not their bladders. Or their stomachs. Or their tired feet. Playgrounds with nearby restrooms had 44% more users and increased the likelihood of staying longer by 48%. Areas that supported eating had 9% increased use for each additional picnic table.4
Caregivers need places to sit with clear lines of sight to play areas. Backs and arms are essential for those less physically able, with adjacent spaces for wheelchairs, mobility devices, and strollers. Perches such as boulders and logs help adults get closer to the play areas, encouraging social interaction.
Breastfeeding parents often prefer more secluded spaces to sit within sight of the play, and children benefit from these areas as well, during times they are overstimulated or emotionally overwhelmed.
Setting the stage for play requires more than choosing equipment. It means understanding the needs of all users. The inclusion of supportive site features ensures that people feel welcome to stay and play for as long as they want to (not for when their bladder tells them its time to go).
4 Playground Design: Contribution to Duration of Stay and Implications for Physical Activity, Environmental Research and Public Health, 2023.
45
TONGVA PARK PLAYGROUND
ANGELES, CA 46
LOS
WITHIN 1/2 MILE OF A PLAYGROUND ARE
PEOPLE LIVING TO VISIT WEEKLY
5X MORE LIKELY THAN THOSE LIVING FURTHER AWAY
47
TO A PLAYGROUND ARE 6X TO VISIT WEEKLY THAN THOSE DRIVING
PEOPLE WALKING MORE LIKELY 48
DISTANCE MATTERS
Compared to the impact of playground features and design, location of the playground is the most important determinant of use.
Playgrounds located within a half-mile of residents increased use by five times and visitors were four times more likely to visit more than once a week. Additionally, people living within a half-mile of a playground had a six fold increase in walking or cycling than those living further away.5
Destination playgrounds were more frequently visited via car, but local playgrounds were visited mostly via active transport. Those that walked or biked visited more often, although their visits were shorter than those going by car, possibly due to proximity and the frequency of repeat visits
Choosing where to build and invest in playgrounds is crucial to public health. We found that for every additional 10,000 people in the half-mile radius of a playground, there were 60% more visitors and 47.7% more MVPA. Currently only 20% of homes in the US are located within a half-mile of a park. City planners, urban designers, and parks departments should consider the importance of playground locations, as well as active transport networks, safe sidewalks, and bike lanes when creating new or reconfiguring existing neighborhoods.
Siting playgrounds within one-quarter to one-half mile of every resident should be a goal for all major cities.
5 Playground Locations and Patterns of Use, Journal of Urban Health, 2023
49
CHECKLIST FOR A GREAT SPACE TO PLAY
Location (Within 1/2 Mile of Residents)
Trees (Preferably Mature)
Enclosure (Fencing, Planting)
Supports (Restrooms, Benches, Tables)
Swings
Climbers
Great heights
High speeds
Water play
Loose parts
SENSORY
PHYSICAL
CONTEXT
PLAY
PLAY
& ENVIRONMENT
50
WASHINGTON PARK PLAYGROUND DENVER, CO
RESOURCES
1 Playground Design and Physical Activity, American Journal of Preventive Medicine, 2022. Cohen D, Talarowski M, Han B, Williamson S, Galfond E, Young D, Eng S, McKenzie T.
2 Innovative Playgrounds: Use, Physical Activity and Implications for Health, Public Health, 2019. Talarowski M, Cohen DA, Williamson S, Han B.
3 The First National Study of Neighborhood Parks: Implications for Physical Activity, American Journal of Preventive Medicine, 2016. Cohen D, Han B, Nagel C, Harnik P, McKenzie T, Evenson K, Marsh T, Williamson S, Vaughan C, Katta S.
4 Playground Design: Contribution to Duration of Stay and Implications for Physical Activity, Environmental Research and Public Health, 2023. Cohen D, Talarowski M, Han B, Williamson S, Galfond E, Young D, Eng S, McKenzie T.
5 Playground Locations and Patterns of Use, Journal of Urban Health, 2023. Young D, McKenzie T, Eng S, Talarowski M, Han B, Williamson S, Galfond E, Cohen D.
52
“WE ARE NEVER MORE
FULLY ALIVE
WHEN WE ARE
PLAYING” THAN
CHARLES SCHAEFER
53
