Q2 2022 Economic Trends Report
St. Tammany Parish Greater New
United States 3Q2 2022 EconomicTrends Report
• Historically, St. Tammany has consistently had lower unemployment rates than the state and metro. Despite of the rise in June, we see this trend continuing, as St. Tammany has lower rates than the state, region, and nation. The Greater New Orleans Area recorded a 5.1% unemployment rate for the month of June.
• Low unemployment rates could contribute to inflation and decreased productivity that produces an output gap where each new job does not create enough productivity to cover its cost. This gap and the negative outcomes associated could help explain the sharp rise we saw in June. The graph below shows the local, regional, state, and national unemployment trend from 2018 until the end of Q2 2022 Louisiana Workforce Commission 2022 Orleans Louisiana
Unemployment
• Q2 2022 saw an even lower rate than the previous record breaking rate in December of last year. The lowest rate the parish had seen was 2.6% first recorded in December 2021 and again in February and March 2022. April broke that record with 2.3% and another astounding low was recorded in May at 2.5%.
• Source:
• The Federal Reserve says that the natural rate of unemployment is between 3.5% and 4.5% for a healthy, competitive economy. In Q2 2022, St. Tammany stayed well below the natural rate until June showed a sharp increase, recording 3.5% following May’s 2.5%.
20.0%15.0%10.0%5.0%0.0% Jan-18 Apr-18 Jul-18 Oct-18 Jan-19 Apr-19 Jul-19 Oct-19 Jan-20 Apr-20 Jul-20 Oct-20 Jan-21 Apr-21 Jul-21 Oct-21 Jan-22 Apr-22 Unemployment Rates 2018
•


Unemployment • The graph below shows the historical unemployment rate in St. Tammany Parish, spanning from 2018 through 2022. The graph to the right shows unemployment rates at each metro level throughout Q1 and Q2 this year. • Following its all-time peak in April 2020, St. Tammany’s unemployment rate has seen a steady, downward trend toward pre-pandemic levels through 2021. This trend has carried into 2022 up until the increase seen in June.
Source: Louisiana Workforce Commission 6.0%5.0%4.0%3.0%2.0%1.0%0.0% April May June Unemployment Rates By Month: Q2 2022 United States Louisiana Greater New Orleans St. Tammany Parish 16.0%14.0%12.0%10.0%8.0%6.0%4.0%2.0%0.0% Jan-18 Apr-18 Jul-18 Oct-18 Jan-19 Apr-19 Jul-19 Oct-19 Jan-20 Apr-20 Jul-20 Oct-20 Jan-21 Apr-21 Jul-21 Oct-21 Jan-22 Apr-22 Unemployment Rates 2018 2022 St. Tammany Parish 4Q2 2022 EconomicTrends Report
•
• Q2 began with continued low rates, and April reported the new lowest recorded rate in St. Tammany ’s history. However, June saw the highest rate since September 2021’s 3.6%. This rise in unemployment is not a true cause for concern—it falls within the natural rate of unemployment and implies there are more people are participating in the labor force and looking for work.

Labor Force • Louisiana Workforce Commission (LWC) defines labor force as the share of the working-age population who are either employed or unemployed and actively seeking employment. • The graph below shows St. Tammany’s near full recovery to pre-pandemic levels. Q1 2020 data showed 120,426 participants in St. Tammany’s workforce, only 467 more than the workforce during Q2 2022. • The most recent jobs report from LWC showed that June 2022 saw a total of 120,790 active participants, showing a complete and full recovery to prepandemic numbers (February 2020). February 2020 recorded 119,785 participants. • According to LWC, the estimate of total jobs in the New Orleans Metropolitan Area in June 2022 is 548,200 jobs. The MSA lost 2,100 jobs over the month but added 5,600 jobs over the year. Source: Louisiana Workforce Commission 122,000120,000118,000116,000114,000112,000110,000108,000106,000104,000 Q1 Q2 Total Labor Force First and Second Quarter Comparison 2018 2019 2020 2021 2022 Jun 22, 120,790125,000120,000115,000110,000105,000100,000Jan-18Apr-18Jul-18Oct-18Jan-19Apr-19Jul-19Oct-19Jan-20Apr-20Jul-20Oct-20Jan-21Apr-21Jul-21Oct-21Jan-22Apr-22 Labor Force Monthly 5Q2 2022 EconomicTrends Report

New Business Incorporations • Available data shows there was an average of 80 new filings per week in St. Tammany during Q2 2022, compared to last year’s Q2 weekly average of 86. • The month of June saw the highest filings in the quarter at 406; however, January holds the record for most filings per month of 2022 at 430. • The spike in new business incorporation filings shown from Q1 2020 through Q2 2022 may indicate many people’s desires to work for themselves or work from home. There is usually a lag in job creation as business filings are not necessarily a direct indicator for start of business operations or hiring workers. Source: Louisiana Secretary of State 790 764 823 838 788 995 1271 1297 1225 11961400120010008006004002000 Q1 Q2 New Business Incorporations Quarterly 2018 2019 2020 2021 2022 6005004003002001000 Jan Feb Mar Apr May Jun Jul Aug Sep Oct Nov Dec New Business Incorporations by Month Monthly 2018 2019 2020 2021 2022 6Q2 2022 EconomicTrends Report
Building Permits • Tracking the values and volumes of building permits, both commercial and residential, is helpful in assessing the rate of the community ’s growth; more building permits at higher values means a more competitive market. • The table below depicts the values for residential permits within the New Orleans Metropolitan Area up until June 2022. The graph below compares 2022’s permit data to 2021’s permit data. • At the end of Q2, data for the year shows residential permits have averaged at $256,027 with a total permit value of $610,113,000. • The average value per permit is up 19.7% compared to the end of Q2 2021. Month Value Units Average Jan 22 $ 97,643,000 393 $ 248,455 Feb-22 $ 102,208,000 419 $ 243,933 Mar-22 $ 107,617,000 434 $ 247,965 Apr-22 $ 100,715,000 389 $ 258,907 May-22 $ 107,163,000 364 $ 294,403 Jun-22 $94,767,000 384 $246,789 2022 Totals $610,113,000 2383 $256,027 Source: U S Census Bureau $120,000,000$100,000,000$80,000,000$60,000,000$40,000,000$20,000,000$JanuaryFebruary March June July AugustSeptember OctoberNovemberDecember Residential Building Permit Total Value 2021 2022 7Q2 2022 EconomicTrends Report

• Tracking CPI is important because it helps measure how the economy as a whole is faring.
295285275265255245235225 Jan Feb Mar Apr May Jun Jul Aug Sep Oct Nov Dec Consumer Price Index Southern Region 2018 2019 2020 2021 2022 8Q2 2022 EconomicTrends Report
• Inflation has been rising due to multiple factors, including supply chain bottlenecks, extraordinarily high demand as the COVID 19 pandemic eases, and year over year comparisons of when the economy was struggling to reopen in the early months of the crisis. U.S. Bureau of Labor Statistics
• The South region is comprised of Alabama, Arkansas, Delaware, District of Columbia, Florida, Georgia, Kentucky, Louisiana, Maryland, Mississippi, North Carolina, Oklahoma, South Carolina, Tennessee, Texas, Virginia, and West Virginia.
Source:
• The graph below shows that year after year since 2018, prices have continued to inflate at varying rates each subsequent year is higher than the last (with the exception of the pandemic induced recession). The second quarter of 2022 showed the highest CPIs each month to date, increasing 9.8% from the previous year. which is the highest rate of inflation in more than 40 years, or since 1980.
• The Consumer Price Index (CPI) is calculated by the Bureau of Labor Statistics and measures inflation by averaging prices of a basket of consumer goods and services, such as transportation, food, and medical care.
Consumer Price Index Southern Region


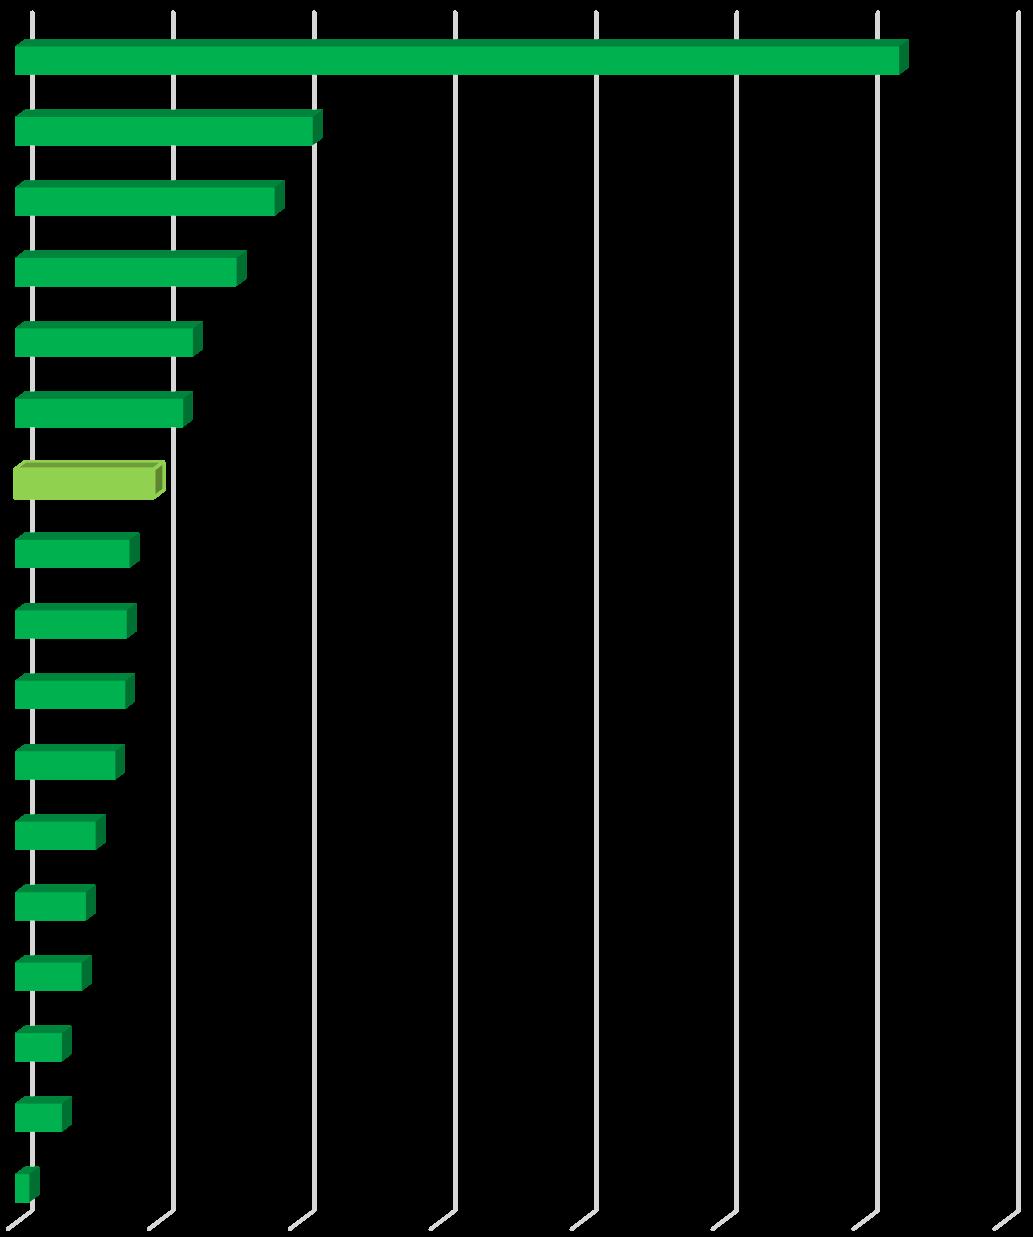
Inflation Southern Region: Percent Change 0.0% 10.0% 20.0% 30.0% 40.0% 50.0% 60.0% 70.0% UsedMedicalEducationAlcoholTuitionCareClothingRecreationVehicles Food At HouseholdOverallRestaurantsRentHousingInflationFoodAtHomeNewVehiclesElectricityEnergyTransportationGasoline 1.0%3.3%3.3%4.7%5.0%5.7%7.1%7.8%7.9%8.1%9.8%11.9%12.6%15.7%18.4%21.1% 62.7% June 12-Month Percent Change in the Price of... Southern Region • The Consumer Price Index (CPI), calculated by the Bureau of Labor Statistics, also measures inflation through price changes in expenditure categories. • The graph below provides a visual of the percent price changes from June 2021 to June 2022 in different expenditure categories. • The Bureau of Labor Statistics reported June’s rate increased by 1.5% in the Southern Region, from May’s recorded rate of 9.2% • The Southern Region has the highest 12 month increase—exceeding the national average of 9.1% as well as the Nation’s other regions. 9.1% 9.8% 9.5% 7.6% 8.8%12.0%10.0%8.0%6.0%4.0%2.0%0.0%National SouthMidwestNortheast West Percent Change by Region Source: U.S. Bureau of Labor Statistics 9Q2 2022 EconomicTrends Report

• A PMI Index score above 50 indicates overall growth of the manufacturing economy, while a score below 50 indicates a contraction in manufacturing industry activities.
• Q2’s average shows a decrease from last year ’s Q2 average, dropping from 60.8% in 2021 to 54.8% this year.
70.0%65.0%60.0%55.0%50.0%45.0%40.0% January February March April May June July AugustSeptember OctoberNovemberDecember Manufacturing
• During Q2 2022, commodities in short supply included electrical components, electronic components, hydraulic components, electric motors, semiconductors, and steel & steel products. Institute for Supply Management Purchasing Managers' Index
•
• Historically, St. Tammany Parish has shown growth in the manufacturing economy, consistently showing a PMI score above 50 from 2017 until July 2019. In August 2019, our manufacturing industries hit a decline, that worsened during the pandemic, until about June 2020, where we have been having growth again to present.
• The Institute for Supply Management (ISM) Manufacturing Purchasing Managers’ Index (PMI) measures manufacturing activity based on a monthly survey, conducted by the ISM, of purchasing managers at more than 300 manufacturing firms across the nation. Indicators factored into the index include business activity, new orders, employment, inventory and backlogs, exports and imports, and prices.
Manufacturing Industry
Source:
2019 2020 2021 2022 10Q2 2022 EconomicTrends Report

• Like the Manufacturing Index, a Services PMI score above 50 indicates overall growth of the services economy, while a score below 50 indicates a contraction in service industry activities.
• Historically, St. Tammany Parish’s service industry has shown overall growth over the years. Our score typically hovers in the 55-60 range. The only time it has ever seen a sharp decline, below a score of 50, was during the beginning of the pandemic, but 2021 showed recovery of our score in an above average range. Q2 2022’s end shows a dip right at 55.3%.
2019 2020 2021 2022 11Q2 2022 EconomicTrends Report
• Comparing Q2’s average this year to last year ’s Q2 average, we see a decrease of 6.2%. Q2 2021 recorded an average of 62.3% while Q2 2022 saw 56.1%.
Service Industry
75.0%70.0%65.0%60.0%55.0%50.0%45.0%40.0% January February March April May June July AugustSeptember OctoberNovemberDecember Services Purchasing Managers'
Source:
• The ISM also measures non manufacturing industries with the Services Industry Purchasing Managers’ Index. Nearly all industry sectors other than manufacturing are included in this index.
• During Q2 2022, commodities in short supply included appliances, baby formula, contrast media, diesel fuel, garage doors, lab supplies, labor, microchips, needles and syringes, paper products, sugar, and transformers. Stirling PropertiesSource: Institute for Supply Management Index

• The graphs to the right and below show changes in home sale volumes over time in St. Tammany. • In Q2 2022, there were 1342 homes sold compared to Q2 2021’s total of 1517 total homes sold. • Overall, there was a decrease in the number of homes sold locally during Q1 and Q2 of 2022 as compared to this time last year. • According to Realtor.com, mortgage rates have been heavily fluctuating creating a turbulent market for buyers. This uncertainty, coupled with record high home prices, may explain the decrease in sales shown this year. ResidentialHousingRealEstate Source: New Orleans Metropolitan Association of Realtors 16001400120010008006004002000 Q1 Q2 Numbers of Houses Sold Quarterly 2018 2019 2020 2021 2022 6005004003002001000 Jan Feb Mar Apr May Jun Jul Aug Sep Oct Nov Dec Number of Houses Sold Monthly 2018 2019 2020 2021 2022 12Q2 2022 EconomicTrends Report


Retail Sales Tax • The below graph shows the total amount of sales tax collected within the parish from 2017 through the end of Q2 2022. • December 2021 showed the highest sales tax collections on record, $31.8 million At the beginning of 2022, we saw a sharp decrease in collection of almost $10 million in January. Even with the decrease from December 2021, 2022’s collections have remained consistent, if not exceeding, pre pandemic levels. • The decrease in reported spending could be explained by the peaking inflation rates presumably causing consumers to withhold their spending. Source: St. Tammany Parish Sheriff’s Office Jun 22, $27,931,845.85$35,000,000$30,000,000$25,000,000$20,000,000$15,000,000$10,000,000$5,000,000$0 Jan-17 Apr-17 Jul-17 Oct-17 Jan-18 Apr-18 Jul-18 Oct-18 Jan-19 Apr-19 Jul-19 Oct-19 Jan-20 Apr-20 Jul-20 Oct-20 Jan-21 Apr-21 Jul-21 Oct-21 Jan-22 Apr-22 Total Sales Tax Collections Monthly 13Q2 2022 EconomicTrends Report

• St. Tammany Parish has consistently shown unemployment rates lower than the region, state, and nation. St. Tammany has also consistently had the lowest unemployment rate in all Greater New Orleans region. April 2022 showed the lowest unemployment rate on record for the parish at 2.3%. This could be attributed to a minor influx in St. Tammany’s job counts: June 2022 saw a 1.03% rise in total jobs compared to June 2021.
Key Takeaways
• June 2022’s 9.1% national inflation rate broke records as the highest yearly spike since 1981. AP News attributes the surge to the rising prices of gas, food and rent, tighter household budgets, and pressuring the Federal Reserve to raise interest rates aggressively all of which are trends that raise the risk of a national recession.
• St. Tammany Parish has seen a slight decrease in the number of residential real estate properties sold. In addition, data has indicated a 9.3% increase in median sales price as of June 2022 compared to June 2021. The most recent report of median listing price in St. Tammany Parish is $295,000. Currently, the low supply of homes on the market cannot keep up with the demand, causing houses to be sold quicker and at higher than average prices. The average number of days on the market for homes in St. Tammany went down 12.5% since this time last year, supporting the claims of a higher demand.
• During the second quarter of this year, St. Tammany saw a full recovery of active labor force participants to pre pandemic levels (February 2020) at the end on Q2 2022. June 2022 recorded 120,790 labor participants compared to February 2020’s 119,785 participants. St. Tammany also saw a 3.9% gain in labor force participation compared to Q2 2021.
• Due to the continuing rise of national consumers’ daily necessities, like gas, food, and shelter, retail sales tax reports show St. Tammany residents have decreased their spending indicating a rise in caution with purchasing discretionary goods. Compared to December 2021’s record breaking high of $31.8 million, June saw a 12.2% decrease in sales tax collection.
14Q2 2022 EconomicTrends Report

@StTammanyCorporation@StTammanyCorpStTammanyCorp.org Prepared by: Elizabeth Lee Research & Policy Analyst Abigail Chascin Proj. Assoc. for Strategic Initiatives Research Fellow elee@sttammanycorp.org fellow@sttammanycorp.org Q2 2022 EconomicTrends Report 15


www.sttammanystats.com

ST. TAMMANY CORPORATION 21489 KOOP DRIVE, SUITE 7 | MANDEVILLE, LOUISIANA 70471 985 809 7874 | STTAMMANYSTATS.COM | STTAMMANYCORP.ORG