
19 minute read
7 CORRELATION OF ANALYTICAL MODELS AND EXPERIMENTAL RESULTS

from Galambos and Mayes
by Straam Group

7.1 GENERAL
A mathematical model of the structure, using a state-of-the-art elastic building analysis computer program, was formulated to compare its computed dynamic characteristics with the experimental test results. The model was progressively modified within the limits of the computer program to represent the different stages of stiffness degradation which were visually apparent in the building during testing. This chapter presents a description of (1) the computer program employed in the dynamic analysis, (2) the different models, (3) the results for each analysis and (4) the comparison with experimental results.
Advertisement
Since an elaboration of this project will in the future involve a detailed and more accurate comparison of the analytical and the experimental results, the objective of the limited study presented here is to determine only what differences exist between analytical predictions and experimental performance as obtained from a commonly used building analysis computer program.
7.2 CO}WUTER PROGRAM ETABS
The computer program ETABS, developed by the Division of Structural Engineering and Structural Mechanics of the University of California, Berkeley, was used to calculate the mode-shapes and frequencies of each structural model. A detailed description of the program may be found in Ref. 7. The program ETABS is a descendant of the widely used program TABS (Ref. 8). These programs were specifically developed for the analysis of building-type structures; they significantly simplify the description of the structure. The floors are considered to be rigid in their own plane and they are assumed to possess no transverse stiffness (i.e., any contribution of the floor slab to the out-of-plane bending stiffness must be included in the floor beams), Using these assumptions the structure may be then assembled from several (or a single) frames which are connected by a rigid floor diaphragm. For the program ETABS the frames must be composed of vertical columns and horizontal beam elements, however, the column locations may be arbitrary in plan (as contrasted to TABS where the frames must also be planar). The in-plane floor displacements for each frame are transformed, using the above assumptions, into three degrees of freedom at the center of mass for each floor level (i.e., two translations and one rotation). Coupling between intersecting frames is limited to the floor in-plane degrees of freedom, and is not enforced for local deformatiolis (i.e., two rotations and one vertical displacement at each node).
The story masses and rotational inertias are obtained from the dead loads per floor and lumped at the center-of-mass.
The following analyses were performed on the CDC/6400 computer.
7.3 STRUCTURAL MODELS
The basic model of the building was formulated as a simple frame to allow for full coupling between interconnected column lines. Points where beams intersected without supporting columns required the specification of zero-property dummy columns. The effective size of all rigid joints was included by specifying column widths and beam depths. Shear areas were nominally set to 80% of the axial area for all columns.
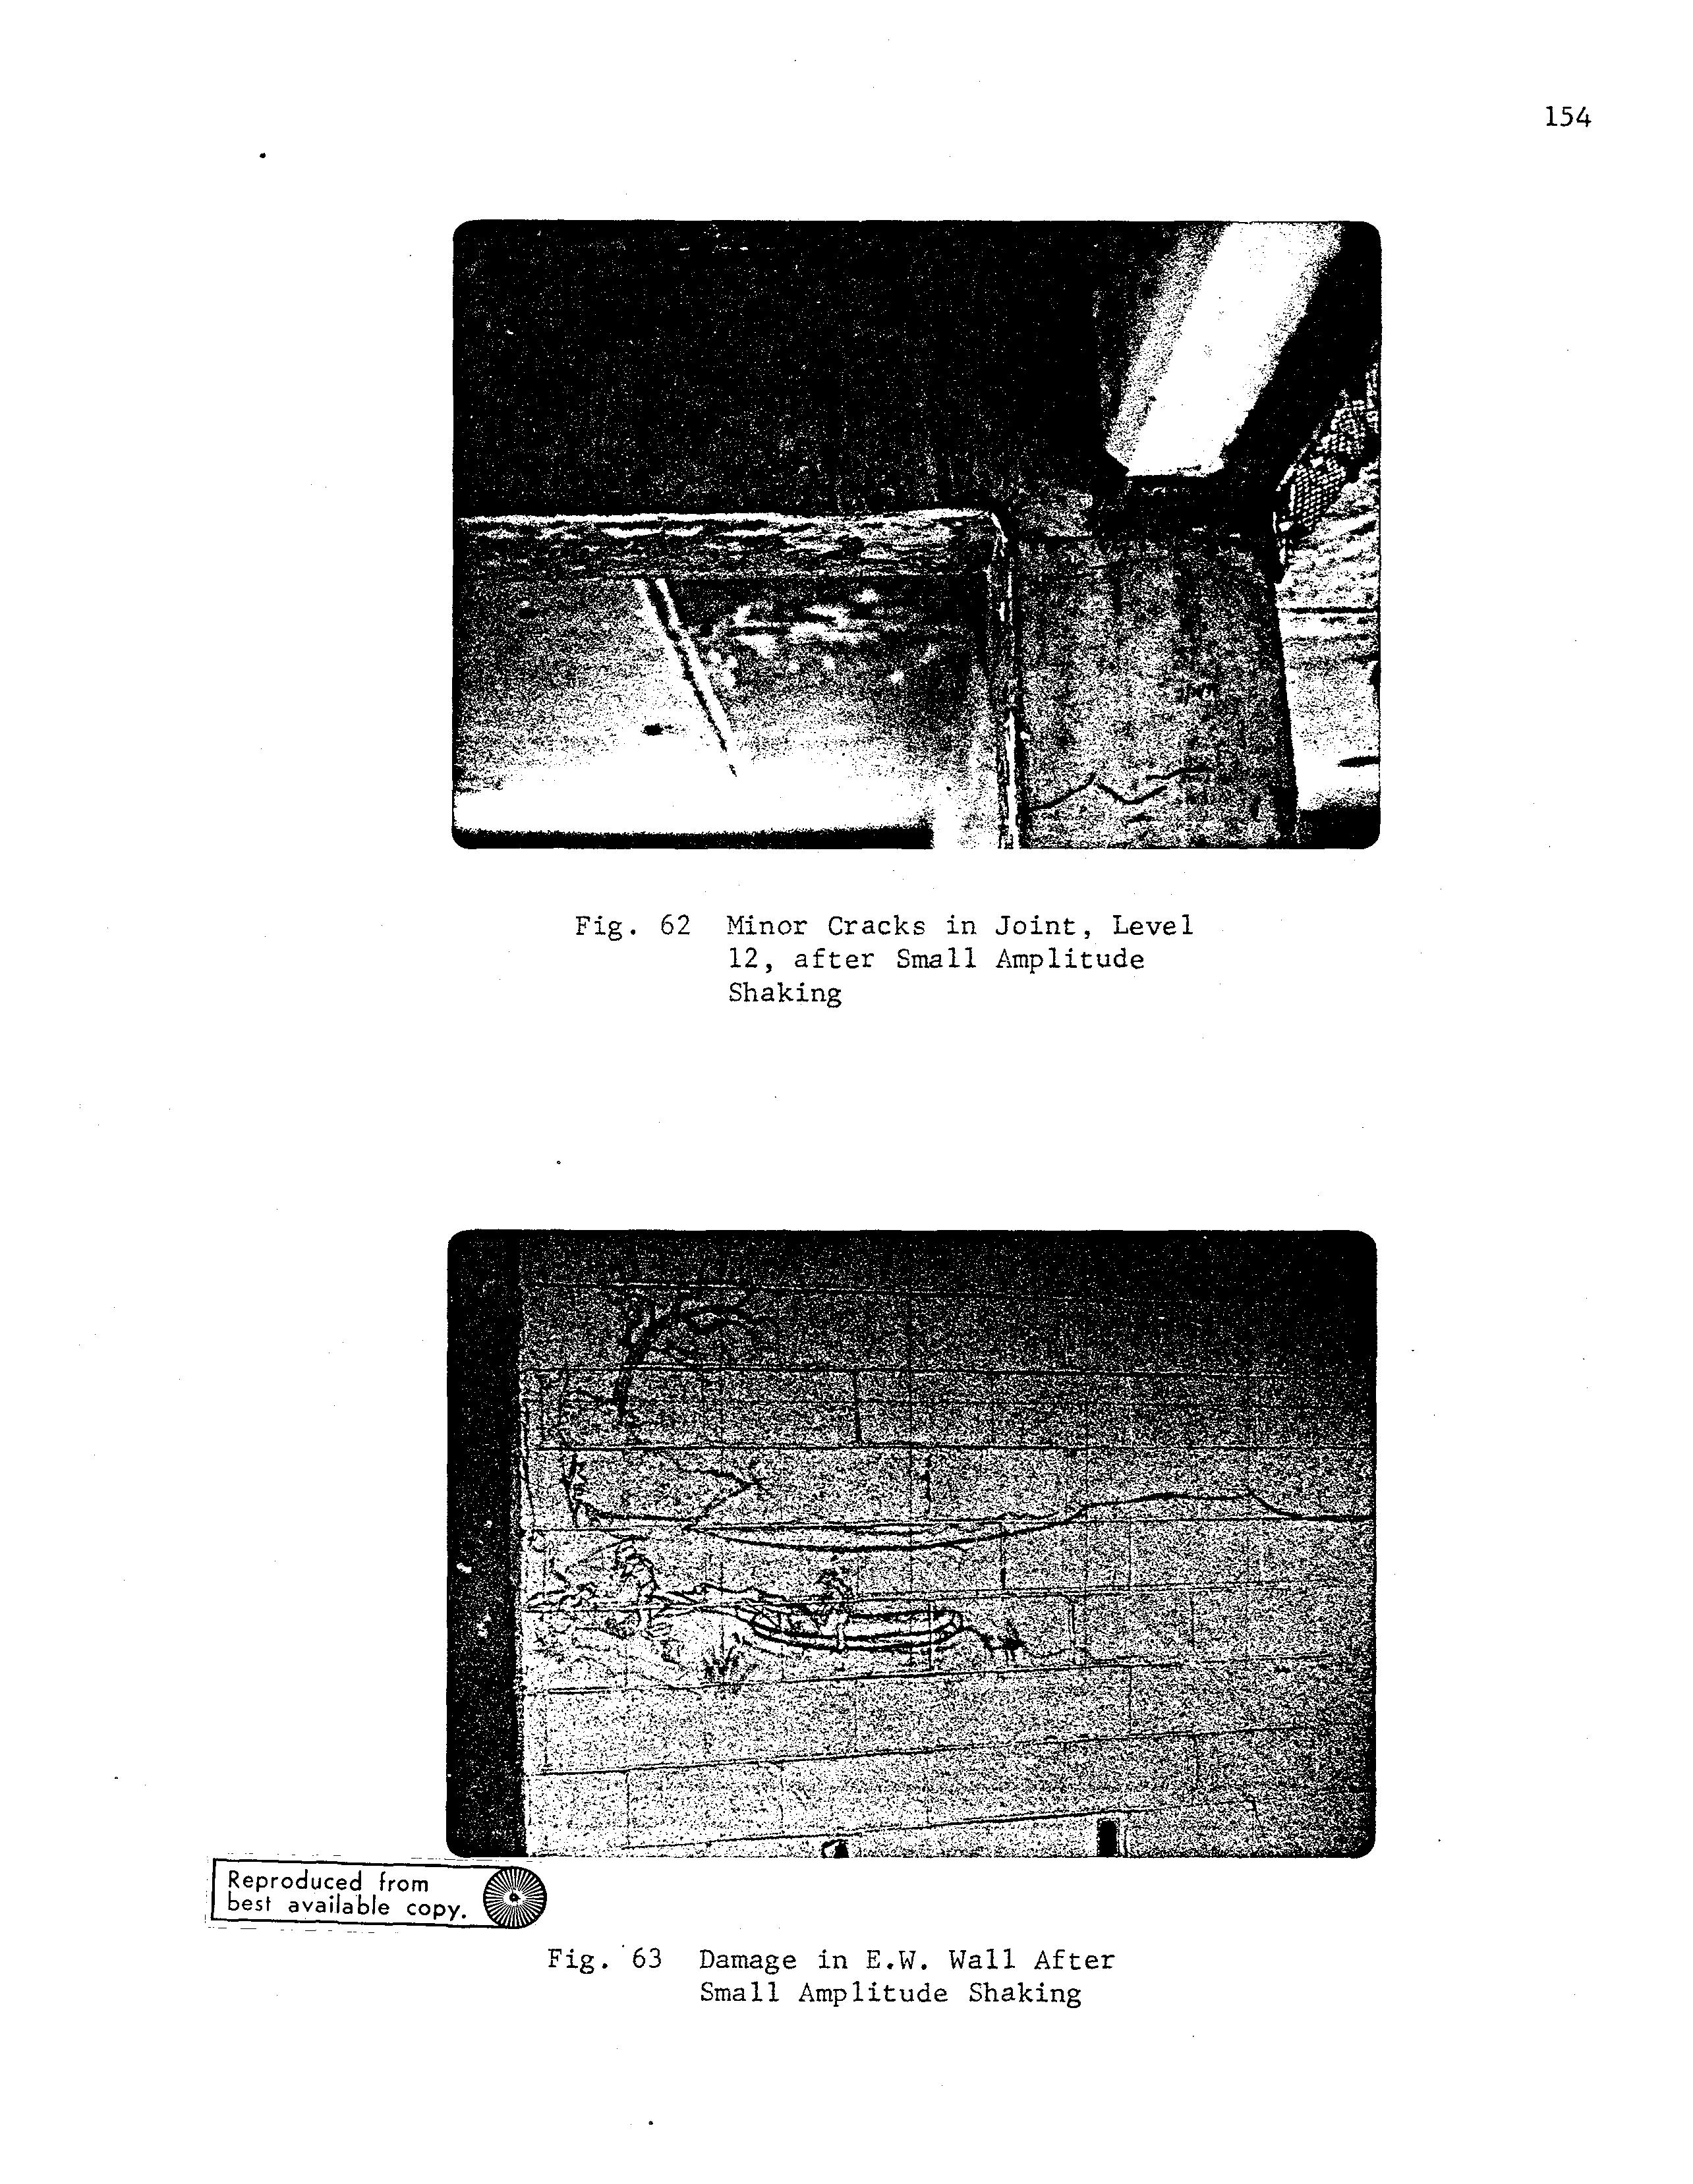
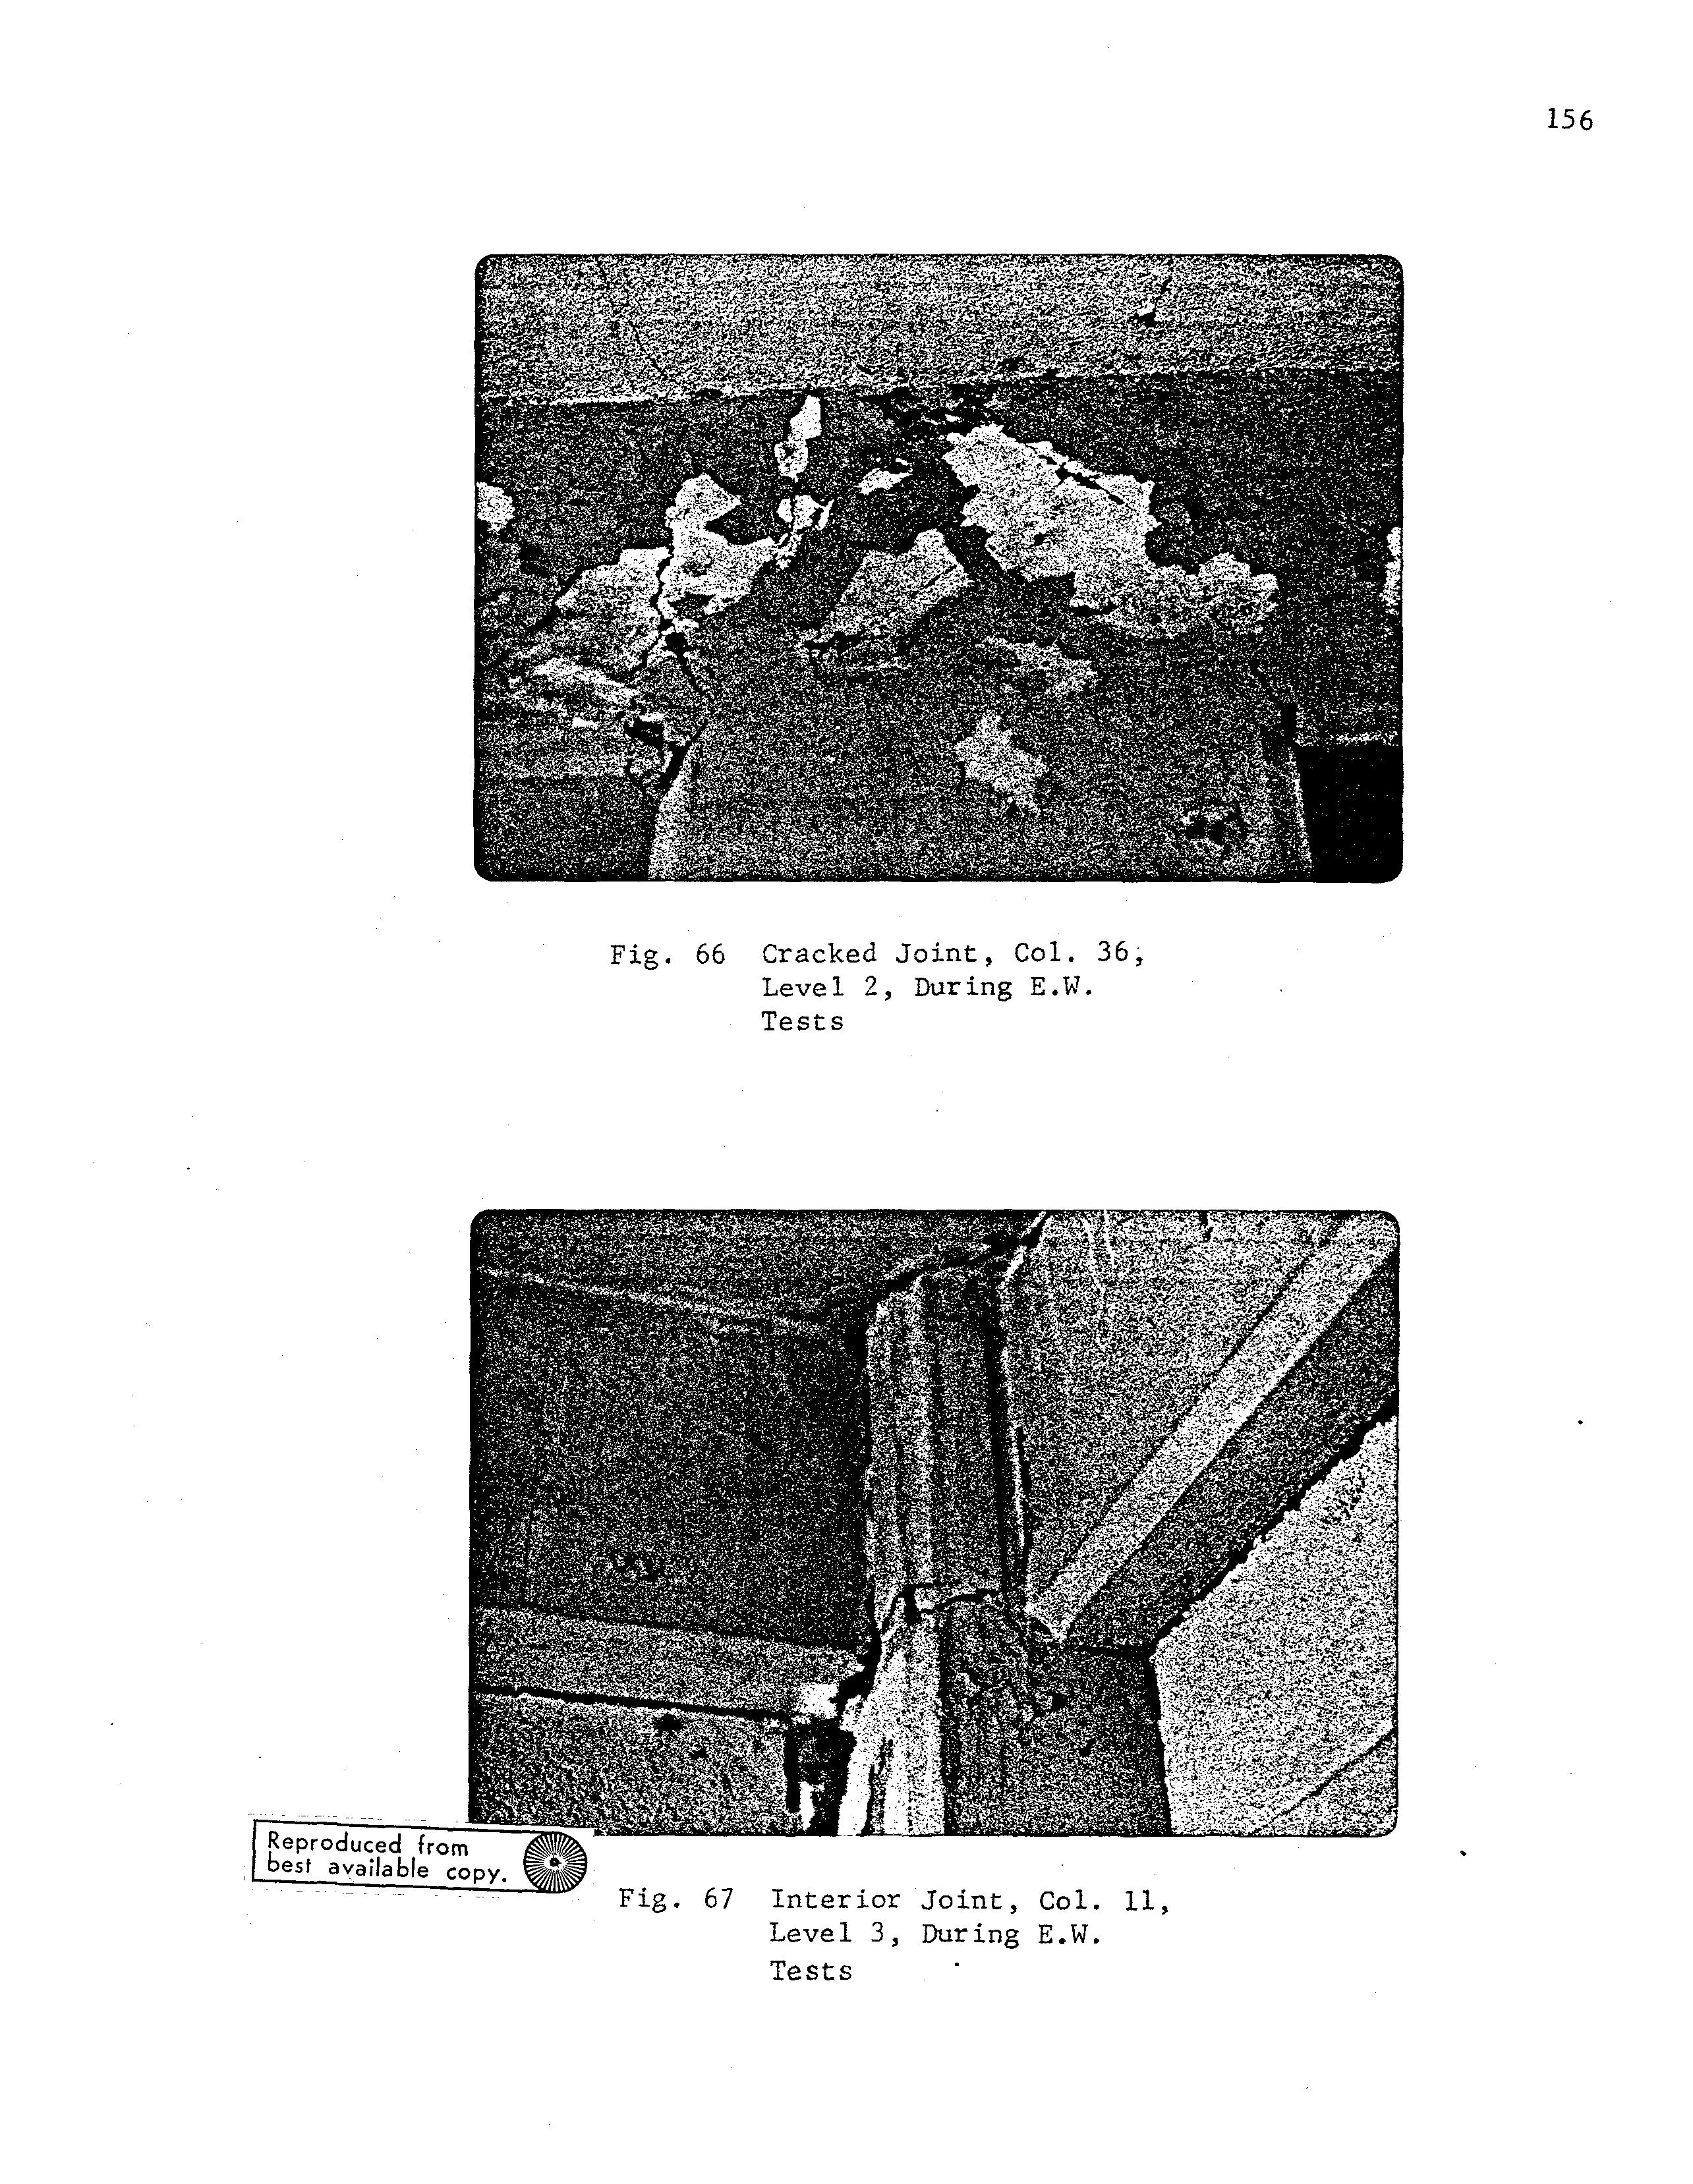
Moments of inertia for all beams included the contribution of the floor slab flanges, the width of which was determined using ACI-368-71. The stiffness properties were based on the uncracked gross section (not including the steel reinforcement). The mass of the infill walls was included in the rotational inertias of the floors where appropriate; however, the in-plane stiffness of the walls was not modeled. Furthermore, the contribution of the stiffness of the stairwell was also excluded. Three variations of the basic model were formulated to represent, within the limits of the computer program, the visually apparent changes that occurred in the actual structure during the large amplitude testing. Each of these is denoted by a sequential model number in order of increasing stiffness degradation. i) Modell: This is the basic model described above. The mass, including infill walls, is shown in Col. 2 of Table 23. This model is to represent the state of the building at the beginning of the tests. It does not include the stiffness contribution of the infill panels nor that of the stairwell. ii) Model 2: This is the same as the basic model except that hinges are inserted at the ends of each EW beam level 2 to level 5 (Fig. 57). This model is to represent the state of the building at the ends of the E"I..J tests, within the limits of the computer program. The model includes the beam hinging which was visually apparent during these tests (see Fig. 72), but it does not include the effect of the shear cracks which were visually apparent at the joints (see Fig. 66). iii) Model 3: This is the same as model 2, but with the reduced masses given in Col. 4 of Table 23, reflecting the absence of infill walls except for the top two floors (see Fig. 28). This model was formulated to represent the state of the building at the beginning of the NS tests.
7.4 RESULTS OF ANALYSES
The modal results from ETABS list two translational and one rotational component. The notation for the direction of the mode-shapes is characterized by the predominant component, i.e., an EW mode is a general threedimensional mode-shape in which the predominant movement is in the EW direction.
Pertinent periods and mode-shapes of the analytical models are shown in Figs. 122 to 127. The EW modes show little ;;,£ any rotational components. The NS modes show varying amounts of rotation with a general trend that increased from MOdell through Model 3.
7.5 COMPARISON OF EXPERIMENTAL AND ANALYTICAL RESULTS
Experimental and predicted mode-shapes and periods for the first and second translational ElY modes are shown in Figs. 122 and 123. Neither contained significant rotational components. The comparisons shown are for analytical Models 1 and 2 and Tests llE-M, l4E-M, 27E-M, and 28E-M.
Data for Tests llE-M and l4E-M were obtained before the building was subjected to any large deformations, while mode-shape Tests 27E-M and 28E-M were performed after the building was subjected to large amplitude shaking.
The first translational mode data shown in Fig. 122 indicates, as expected, that Modell (T=l.O sec) is more flexible than Test No. l4E-M (T=O.88 sec). This difference is attributable to the exclusion of the infill walls anu the stairwell in MOdell. Furthermore, the mode-shapes of the two results are significantly different.
MOdel 2, which includes the hinges at the beam ends up to levelS and excludes jOLlt shear cracking, is more rigid than Test No. 28E-M
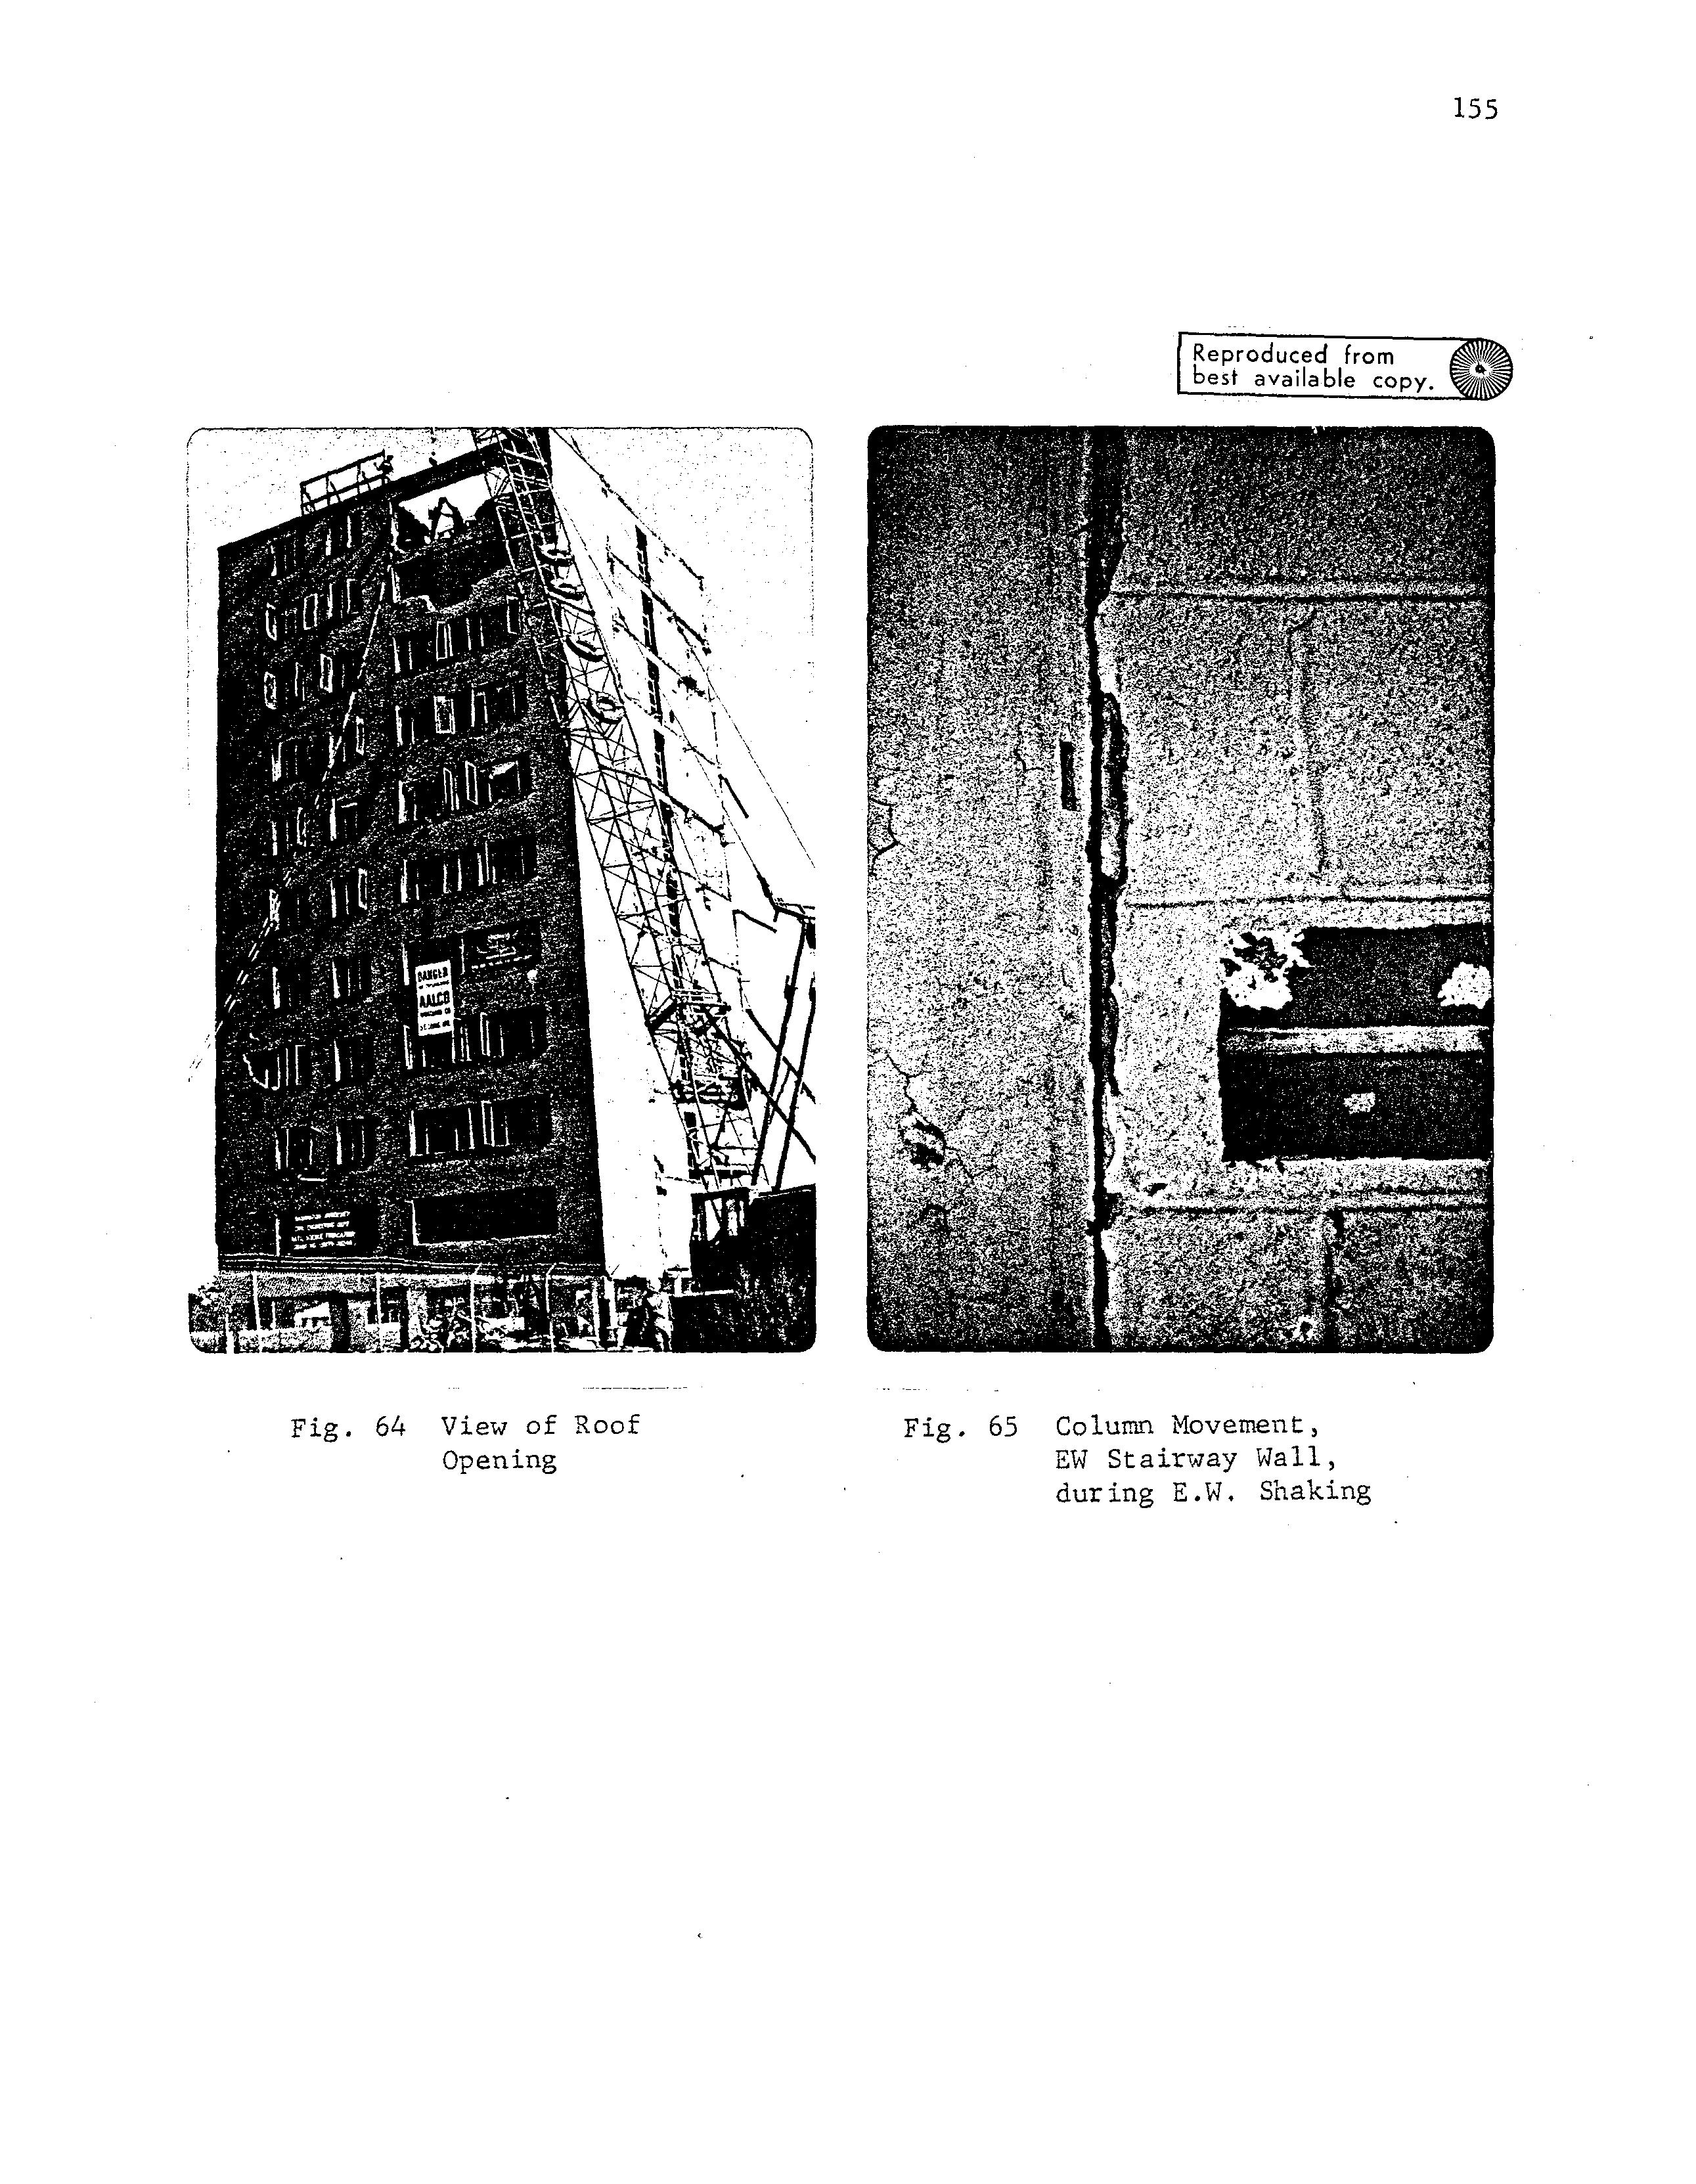
(T=1.38 sec versus T=1.85 sec). In this case the mode-shapes of the two results are in better agreement, although a significant difference exists at the lower levels where joint shear cracking was more prevalent. It should be noted that the infill panels did not appear to interact with the structural frame when the amplitudes of shaking were large, as discussed in Chap. 3 (see also Fig. 65). This effect, and the inability to include the joint shear cracks in the model are postulated as reasons for Model 2 being more rigid than the actual building.
Similar results were obtained for the second translational mode, as shown in Fig. 123. Modell (T=0.34 sec) is considerably more flexible than Test No. llE-M (T=O.33 sec), and there is a significant difference in the mode-shapes. The reasons for the discrepency are discussed above. Sinlilarly, Model 2 (T=0.39 sec) is more rigid than Test No. 2E-M (T=O.4l sec), although there is a better agreement between mode-shapes.
Experimental and analytical mode-shapes and periods the first and second translational and torsional NS modes are shown in Figs. 124 through 127. Part a) of each figure gives the floor components and Part b) gives the NS translational components of nodes 5, 12, and 21 (Fig. 56). These nodes lie in an EW plane through the center of the building. The comparisons are shown for Model 3 and Tests 5N-M to BN-M. These mode-shape tests were all performed before any large amplitude shakes in the NS direction were made. For comparative purposes all modes were normalized so that the NS translational component of Node 5 on level 12 was unity.
Model 3, which is the same as Model 2 except for the mass of the walls, is more rigid in all four modes than the actual building, as seen by comparing the periods (Figs. 124 to 127). The experimental periods are: 1.22 sec for the first translational mode, 0.94 sec for the first torsional mode, 0.32 sec for the second translational mode and 0.29 sec for the second torsional mode. The corresponding periods from Mode 3 are, respectively, 0.93 sec, 0.&8 sec, 0.29 sec, and 0.21 sec.
All four mode-shapes, including the two translational modes, contain significant rotational components. Although the agreement between experiment and prediction is not good for all four mode-shapes, it is better for the translational modes (Figs. 124 and 126) than for the torsional ones (Figs. 125 and 127). Furthermore, the comparison of the NS translational components for all modes at Node 5 (at the center of the building) is better than at Nodes 12 and 21 (at the E and W faces of the center of the building, respectively). This indicates that a greater discrepancy occurs in the analytical model for the torsional component of the modeshape than for the translational one.
In the NS direction the effect of the stairwell as a stiffening element is less significant than in the EW direction and, except for the top two floors, infill panels are not included either in the analytical model nor in the experimental building. Consequently, the difference in behavior is attributed to the effect of joint shear cracking, which was not included in Model 3. Another reason might be the significant damage to Col. 37 at level 2 (see Fig. 70).
7.6 SUMMARY OF RESULTS
The objective of the foregoing comparison the three analytical models and the test-performance was not so much to determine what degree of correlation exists, but to examine the limitations of both the models and the computer program ETABS. It is clear that better models with some non-linear capabilities are needed in further studies of the data from these tests in order to improve correlation. The following factors should be included in such studies: 1) the stiffness contribution of the infill panels with and without openings, 2) the stiffness contribution of the stair system and 3) the effect of joint shear cracking.
8.1 SUMMARY OF RESEARCH
This report summarizes an experimental research project in which a relatively new and, from the standpoint of structural testing, a rather large structure was subjected to many cycles of sinusoidal lateral loads. These cyclic loads were large enough to significantly alter the dynamic and static structural properties of the building and to induce extensive damage to the structural frame components and to the non-structural in-fill wall and stair elements.
The structure was a nearly rectangular, roughly 40 x 45 ft in plan, eleven story portion of an originally much larger reinforced concrete apartment building, one of many which were demolished in St. Louis during 1976. The structure consisted of columns (tied and spirally reinforced), beams and slabs. It also contained a stair-well and in-fill brick and/or block walls on the periphery and around the stair-wells except for the ground floor which was completely open. The structure was not designed for lateral force, in accordance with the usual design practice for such buildings in the 1950's, and the beam-to-column joints had little capacity to resist positive moment.
The walls, except for a portion of the East face, were in excellent condition before testing, as was the whole structure. made on the dimensions of the structure and on the location of the reinforcing prior to testing indicated that the structure was, within the usual tolerances, built as deSigned. Various measurements of the strength of the concrete showed that this strength twenty years after construction was roughly twice the original strength.
The research consisted of the following phases:
1) Measurement of the dimensional and structural properties of the building;
2) Small amplitude shaking on the top floor to determine the original dynamic properties of the structure;
3) Large amplitude shaking on the top floor and acquisition of the resulting dynamic data;
4) State-of-the-art analysis of the results.
The details of the methods and the results of the dimensional and material property survey are presented elsewhere (Ref. 9), as are the results of the small amplitude shaking (Ref. 4). This report is mainly concerned with the large amplitude tests.
8.2 LARGE AMPLITUDE SHAKING DEVICE
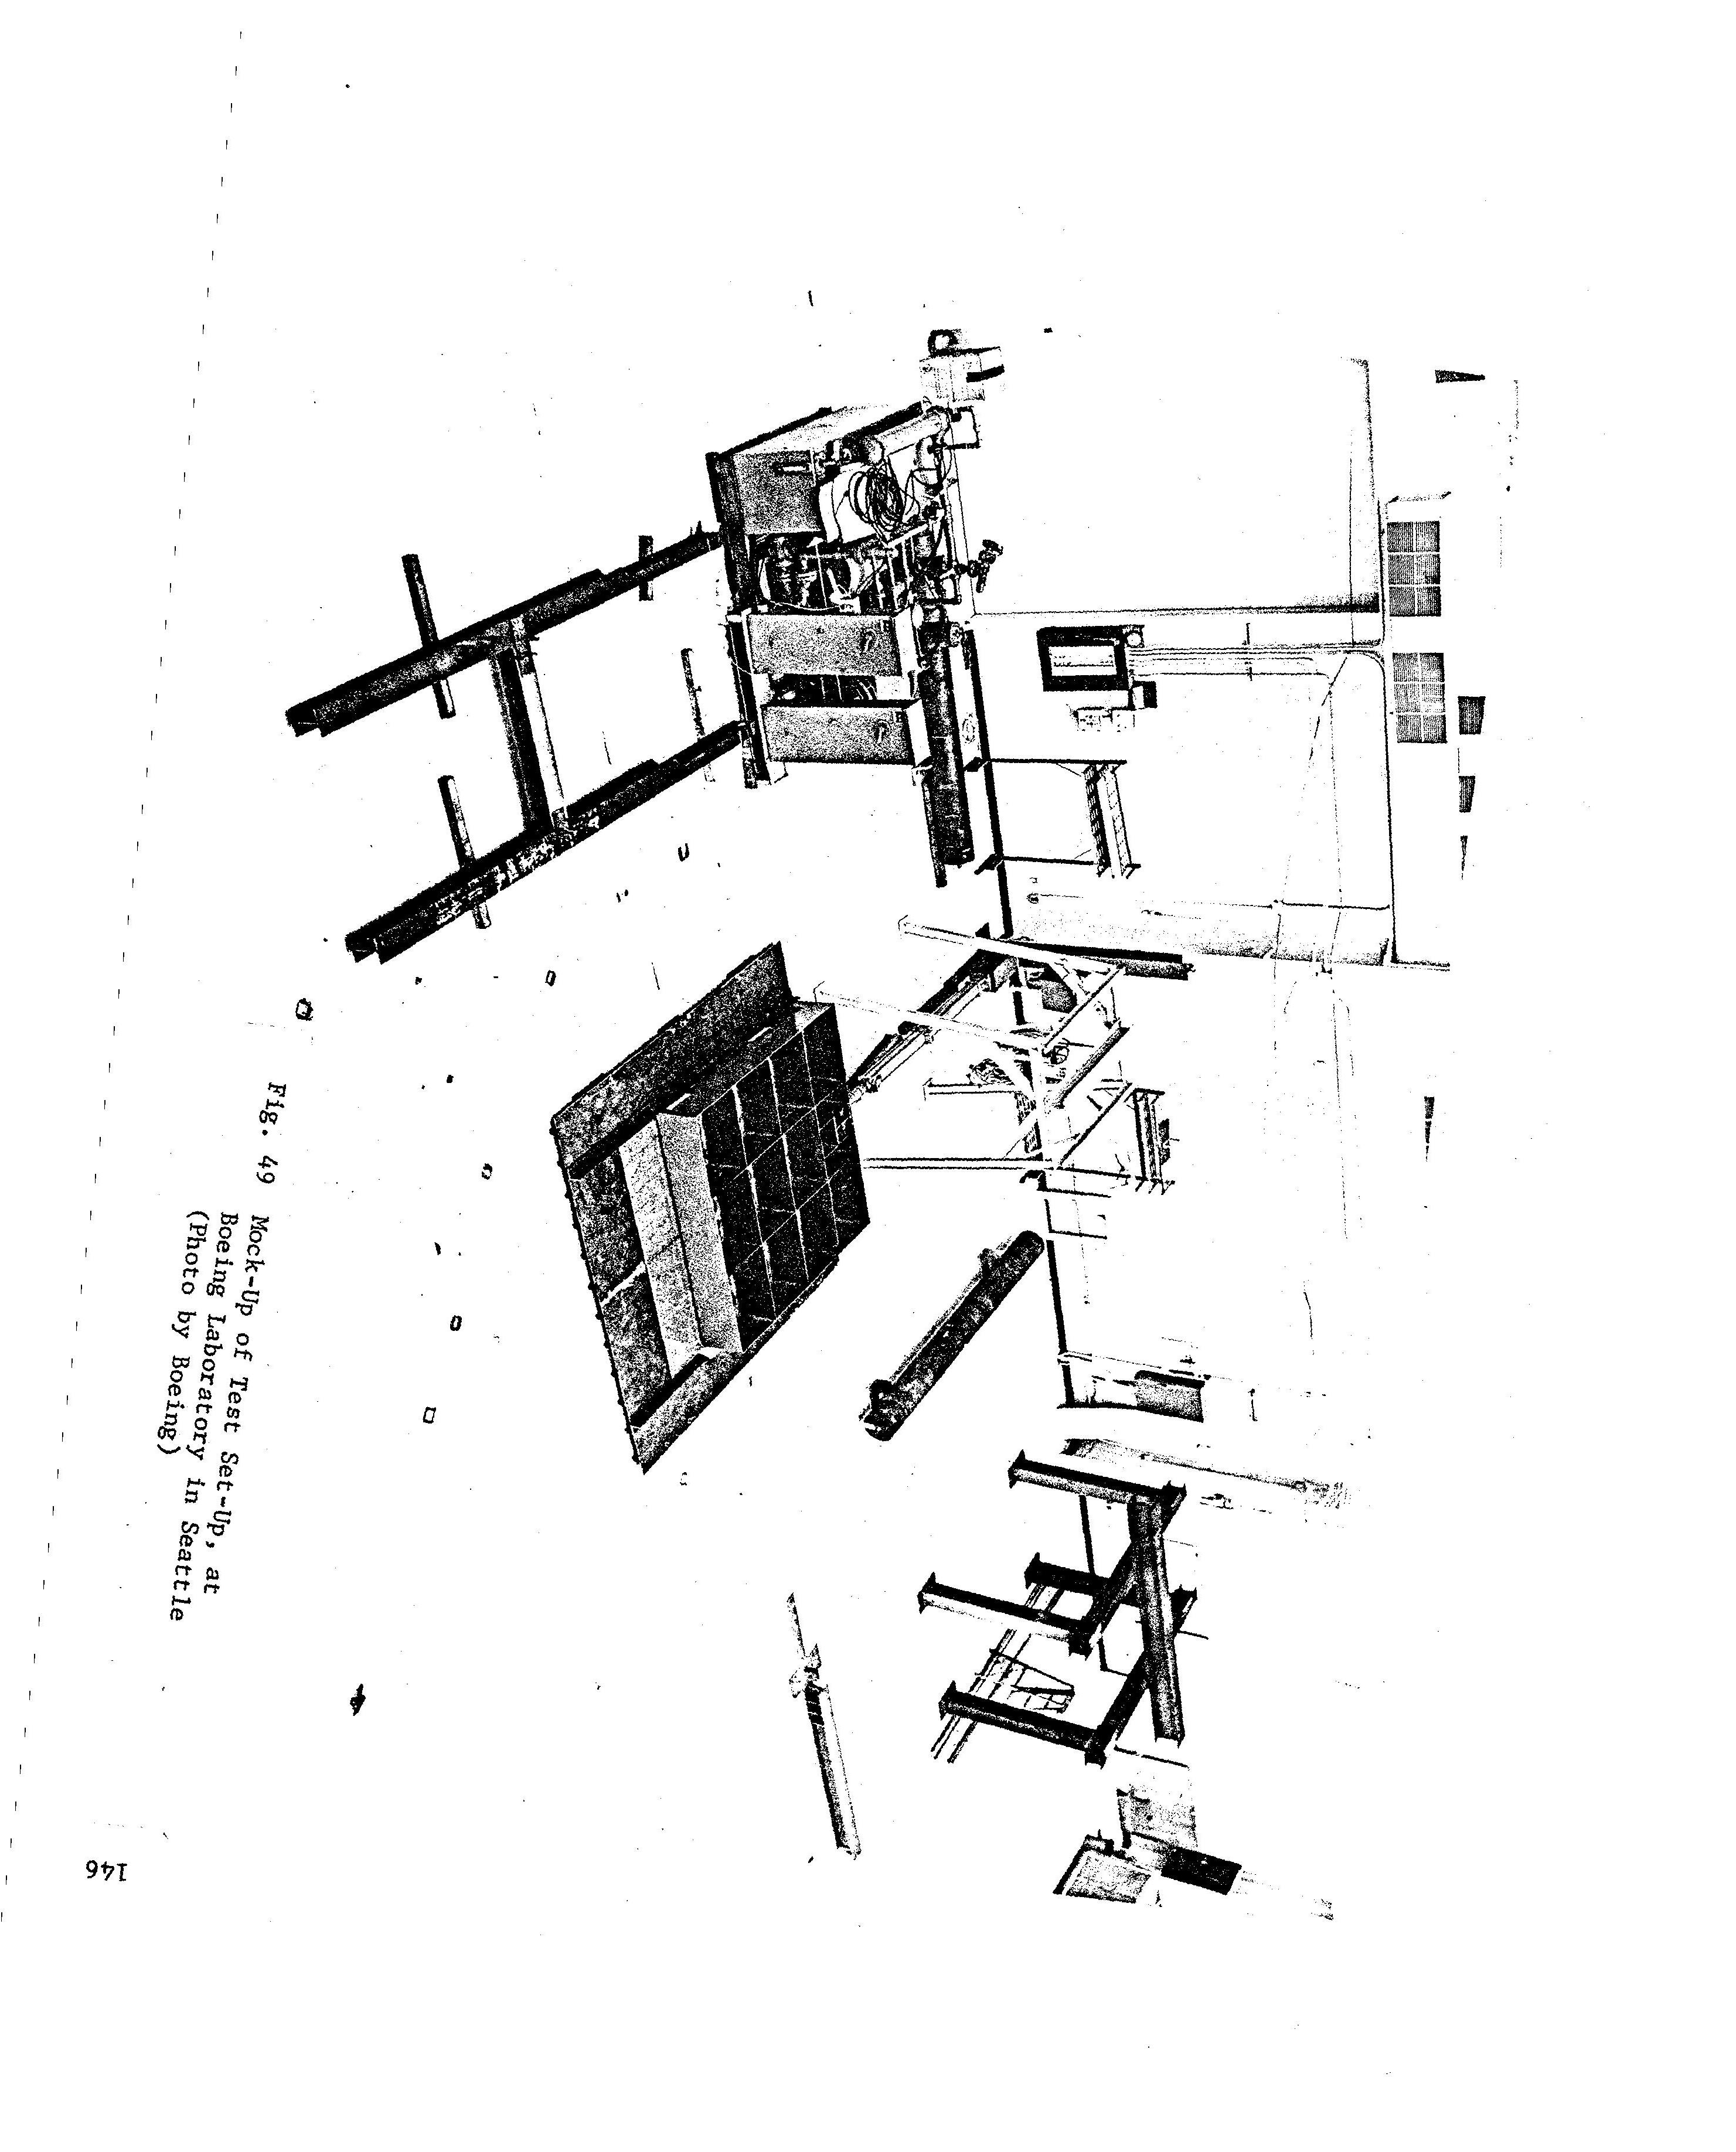
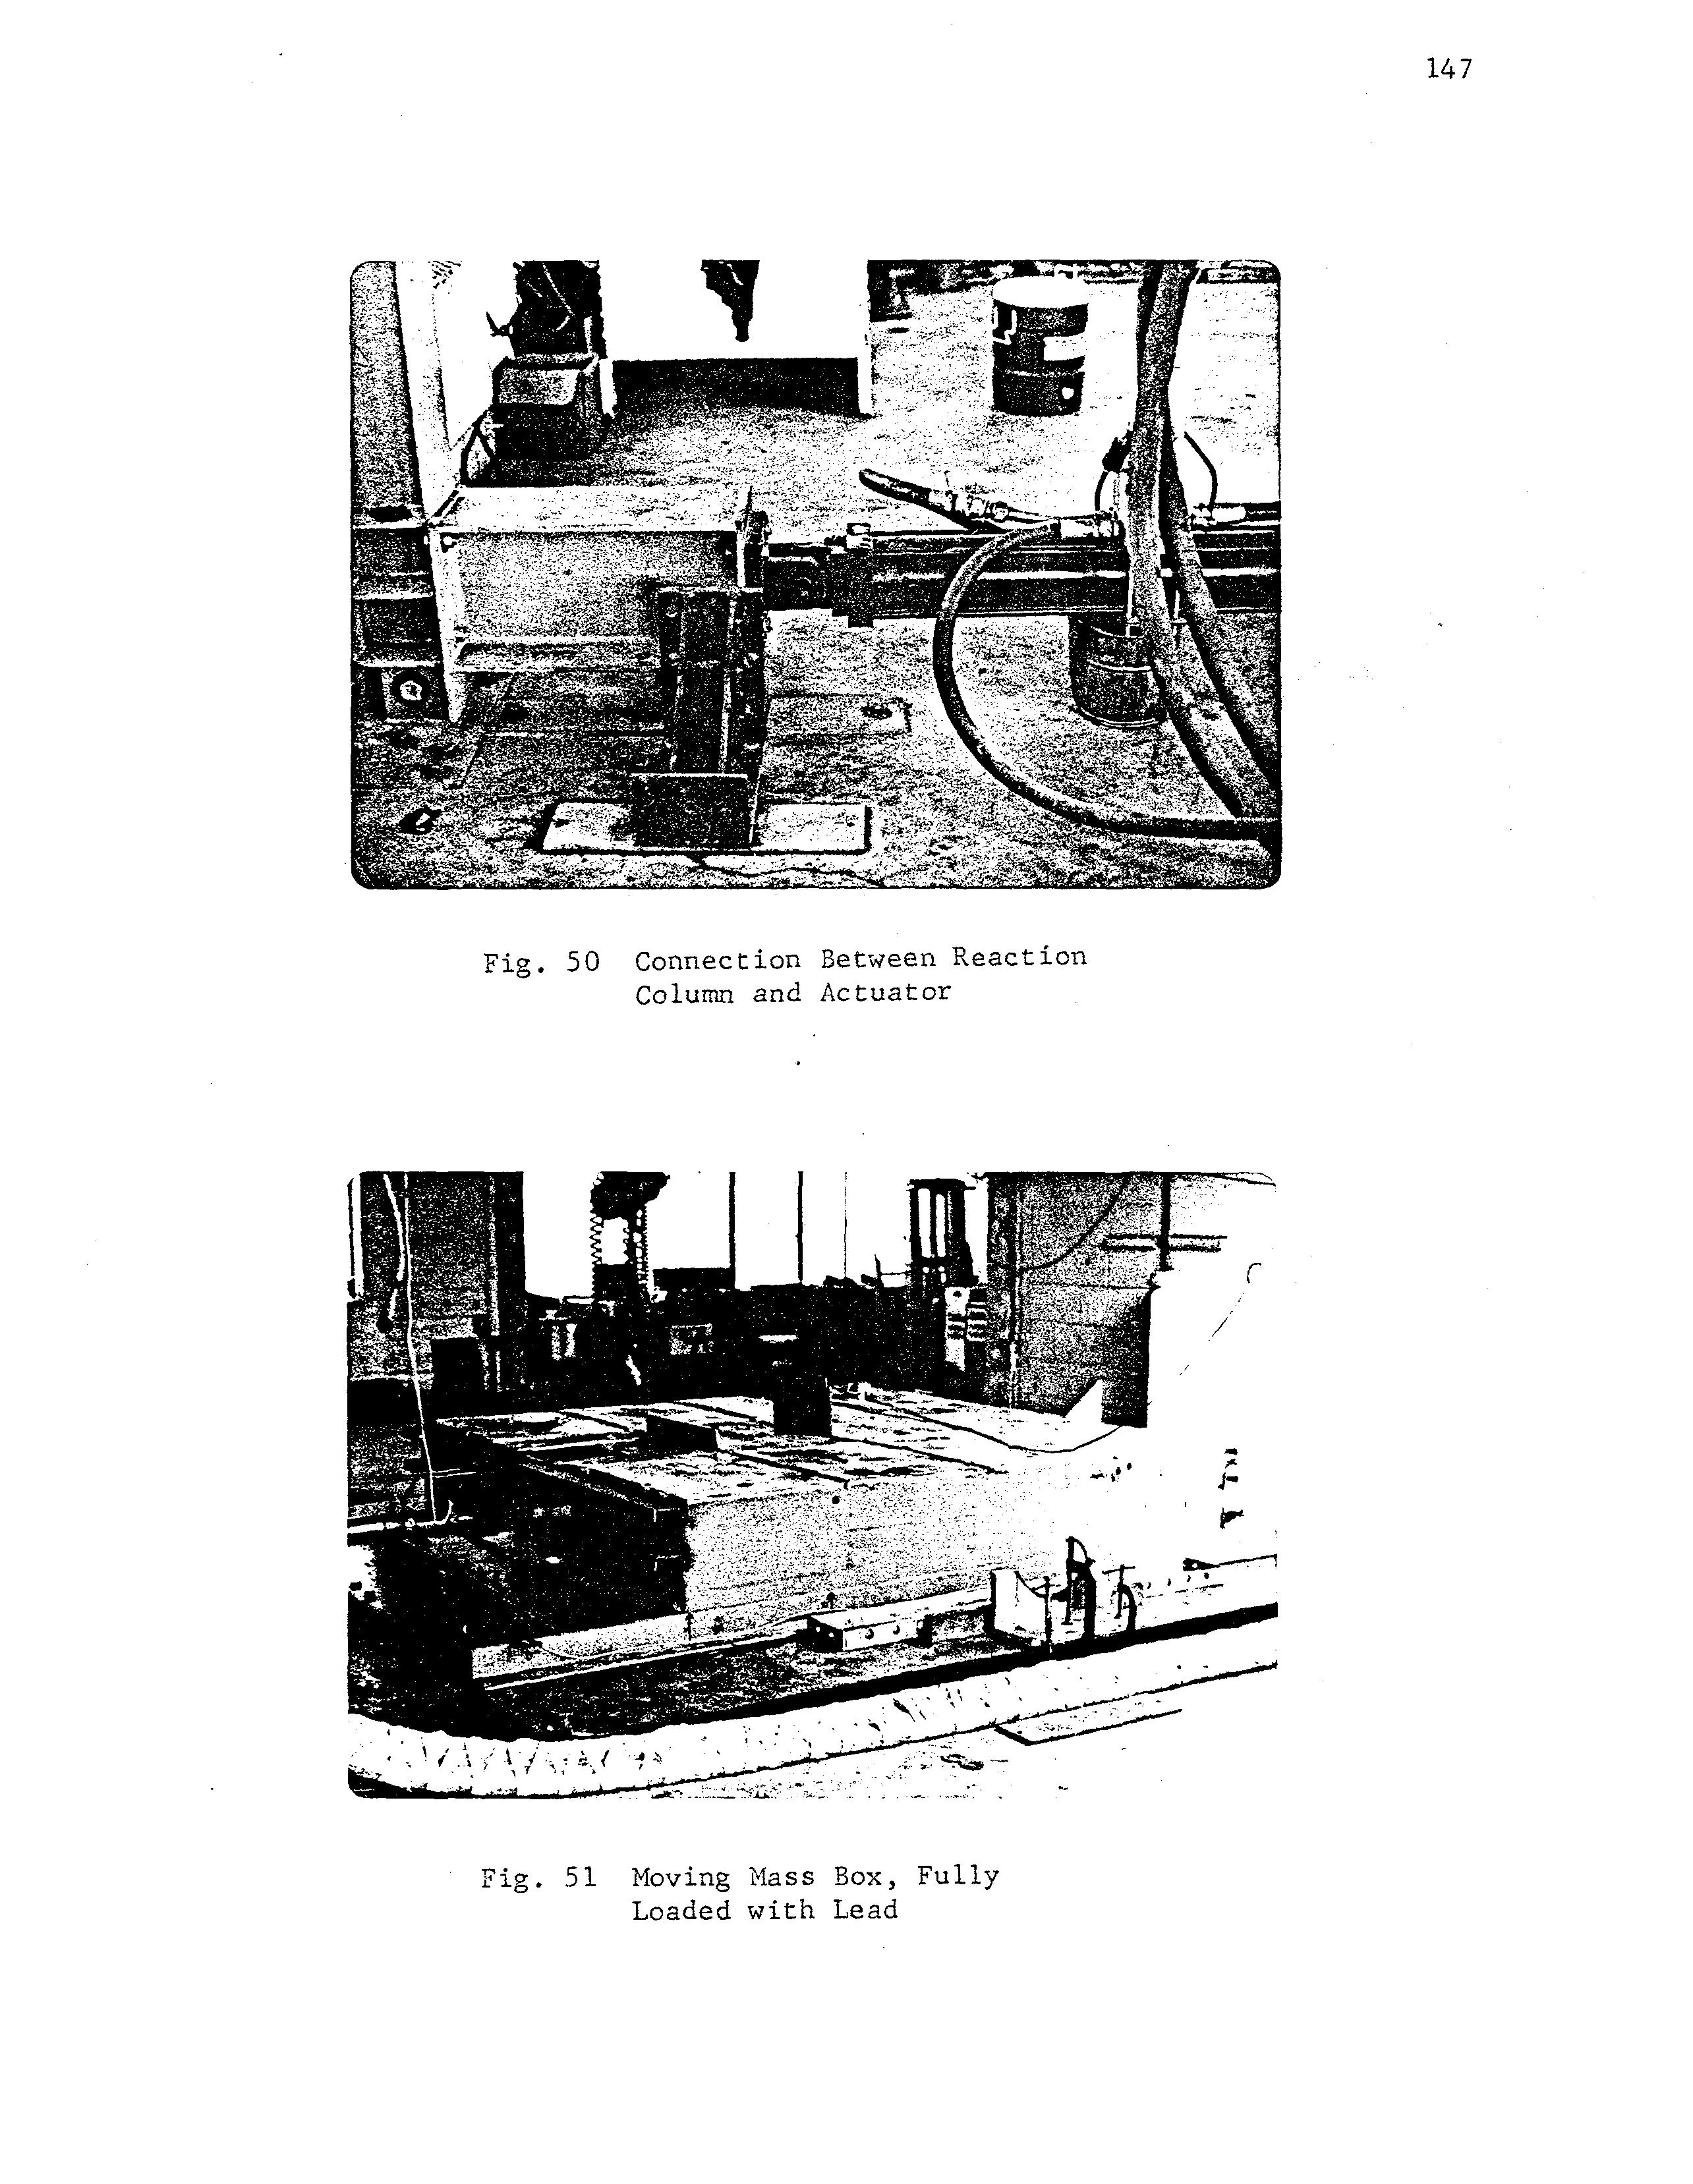
Sinusoidal forces on the eleventh floor level were induced by moving a mass of lead weighing approximately 60,000 lbs horizontally over a moreor-less frictionless surface first in the EW and then in the NS direction by a hydraulic actuator, one end of which was attached to the mass and the other to the building frame. The power for the actuator was provided by a large motor-and-pump assembly which was also located on the eleventh floor. The piston displacement was ±20 in, with a frequency capacity of approximately 5Hz, and the maximum horizontal force range was ± 30,000 lbf.
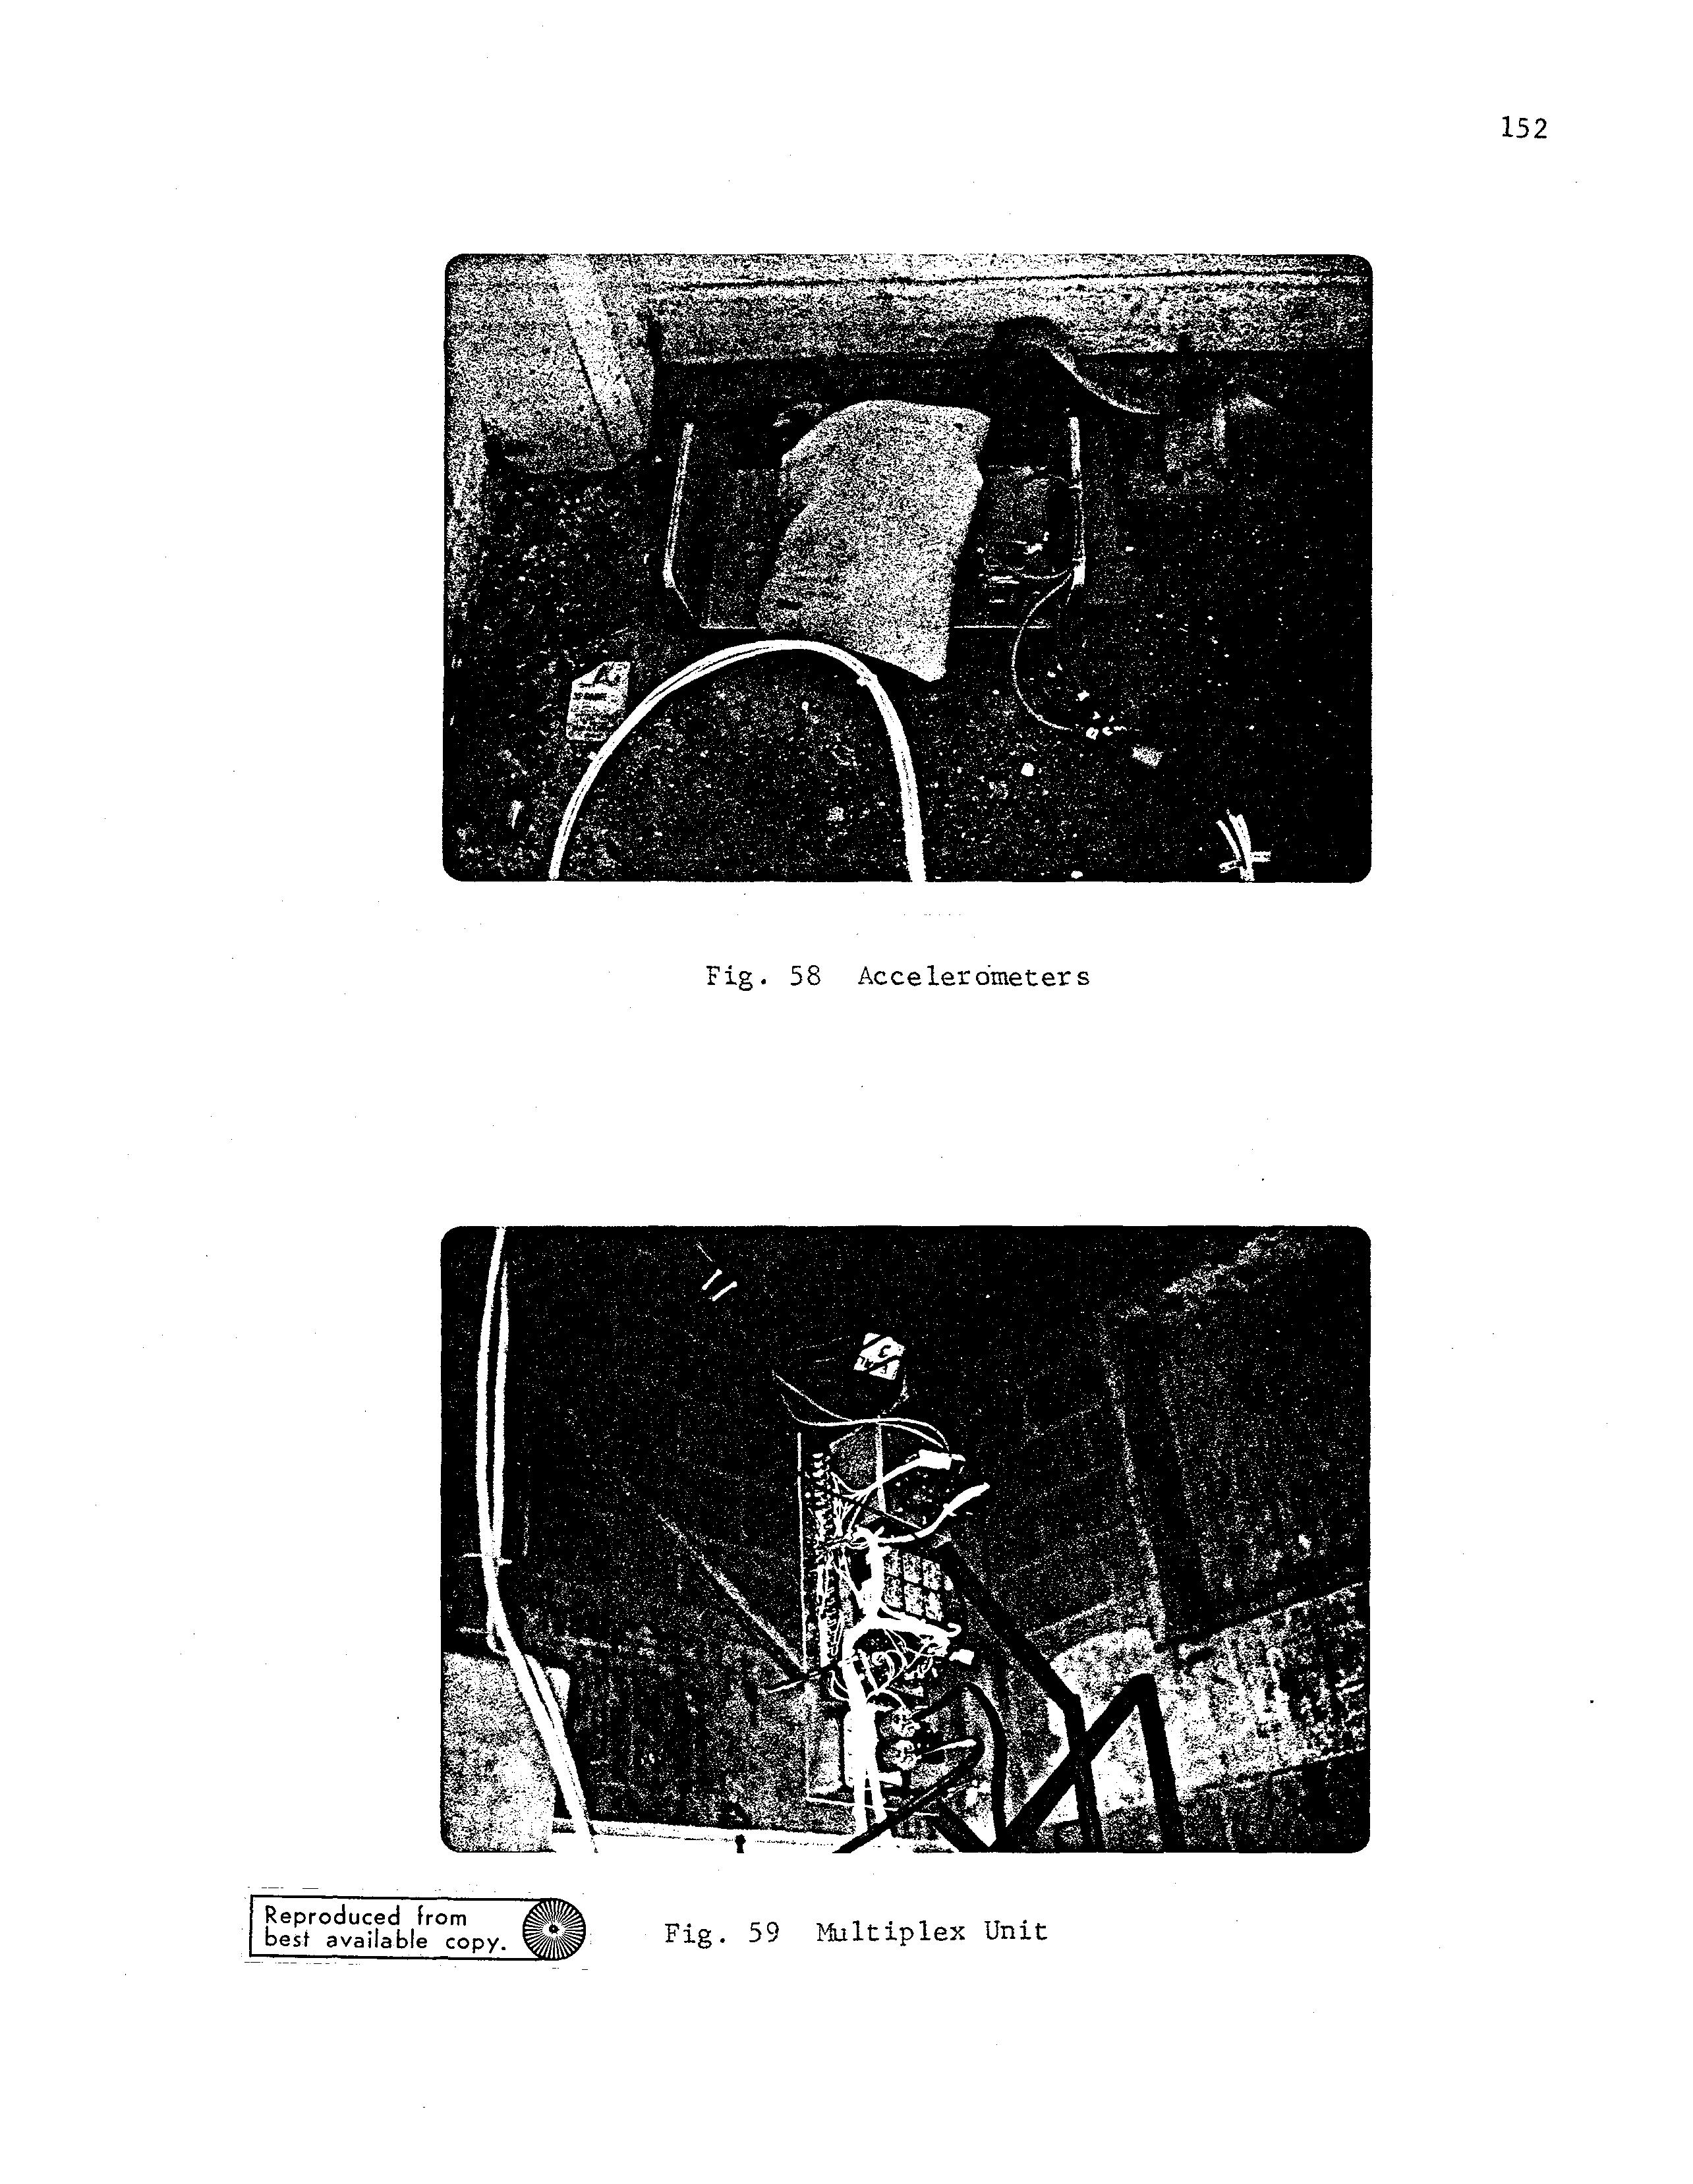
The shaking device was used for damping tests (frequency sweeps) and for low-force level mode-shape tests. Data taken during these tests consisted of accelerations in enough locations to determine the resonant frequencies of the lower two modes and the corresponding damping values, and the spatial definition of the mode shapes.
The large amplitude shaking of this building constituted a novel effort, and the device used worked fairly well, discounting the expected usual initial start-up problems and breakdowns. Time for thorough pretest planning and shake-down exercises was not available, and so the gaining of experience, taking data,and testing the structure and the equipment proceeded simultaneously.
8.3 TEST RESULTS
The small amplitude shaking tests provided resonant frequencies and damping values (using the frequency response curve method) for the first, second and third EW, NS and torsional modes (Table 8), and mode shapes for the corresponding first and second mode resonant frequencies for the original building prior to any damage. Damping values obtained from the small amplitude shaking tests were approximately 1.5, 2 and 4% for the first, second and third modes, respectively.
The large amplitude shaking tests were performed first in the EW direction with the cladding in place and then in the NS direction with the cladding removed. The runs consisted of sweeps near resonance in the first and second modes at increasingly higher force levels alternating with low force level sweeps over the whole range of frequencies and low force level mode-shape surveys at resonance. The high force level tests damaged the structure, and the standard damping and mode-shape tests measured the resulting changes in its dynamic properties. The pertinent data on the test runs are detailed in Table 9 for the EW tests and in Table 10 for the NS tests. Damping values were determined by the frequency response curve method for most tests (it was not possible to do so for all tests because of the rapid change of the resonant frequency during some of the high force level tests), and for some of the EW tests damping was also calculated by a curve fitting method in the time domain. The data from the various dynamic tests are presented in Tables 16 through 22 and Figs. 107 through 127, and the results are discussed in Chapter 6. The following brief conclusions are repeated here:
1) Major structural damage occurred during the first-mode large force level tests, resulting in major changes in the period (from approximately 0.7 sec to 1.9 sec).
2) Structural damage and period changes were relatively small during the second mode tests.
3) Mode-shapes remained relatively unaffected by major structural damage.
4) Damping values obtained by the two methods of analysis for the same test run, and damping values for different test runs, are not consistent nor do they exhibit strong tendencies. Damping, with some notable exceptions, tends to increase with damage for the same mode, and it tends to be somewhat higher for the second mode than for the first mode. However, the results are erratic, and damping is mostly less than 4%. No strong conclusions can be drawn from these results as regards damping values in a highly damaged structure until more extensive (and expensive) time-domain analyses are performed on the data.
8.4 STATE-OF-THE-ART ANALYSES
Experimental and predicted mode shapes and periods are presented in Figs. 122 through 127, and the comparisons are discussed in Chap. 7.
Three models were used in the analyses, representing extreme idealizations of the mass and the structure. These idealizations give but qualitative descriptions of behavior, and future studies should be made with analyses which can account for the stiffness contributions of the in-fill panels and the non-linearities of the damaged structure. Basically, the state-of-the-art dynamic programs are at best crude approximations.
8.5 CONCLUSIONS AND RECOMMENDATIONS
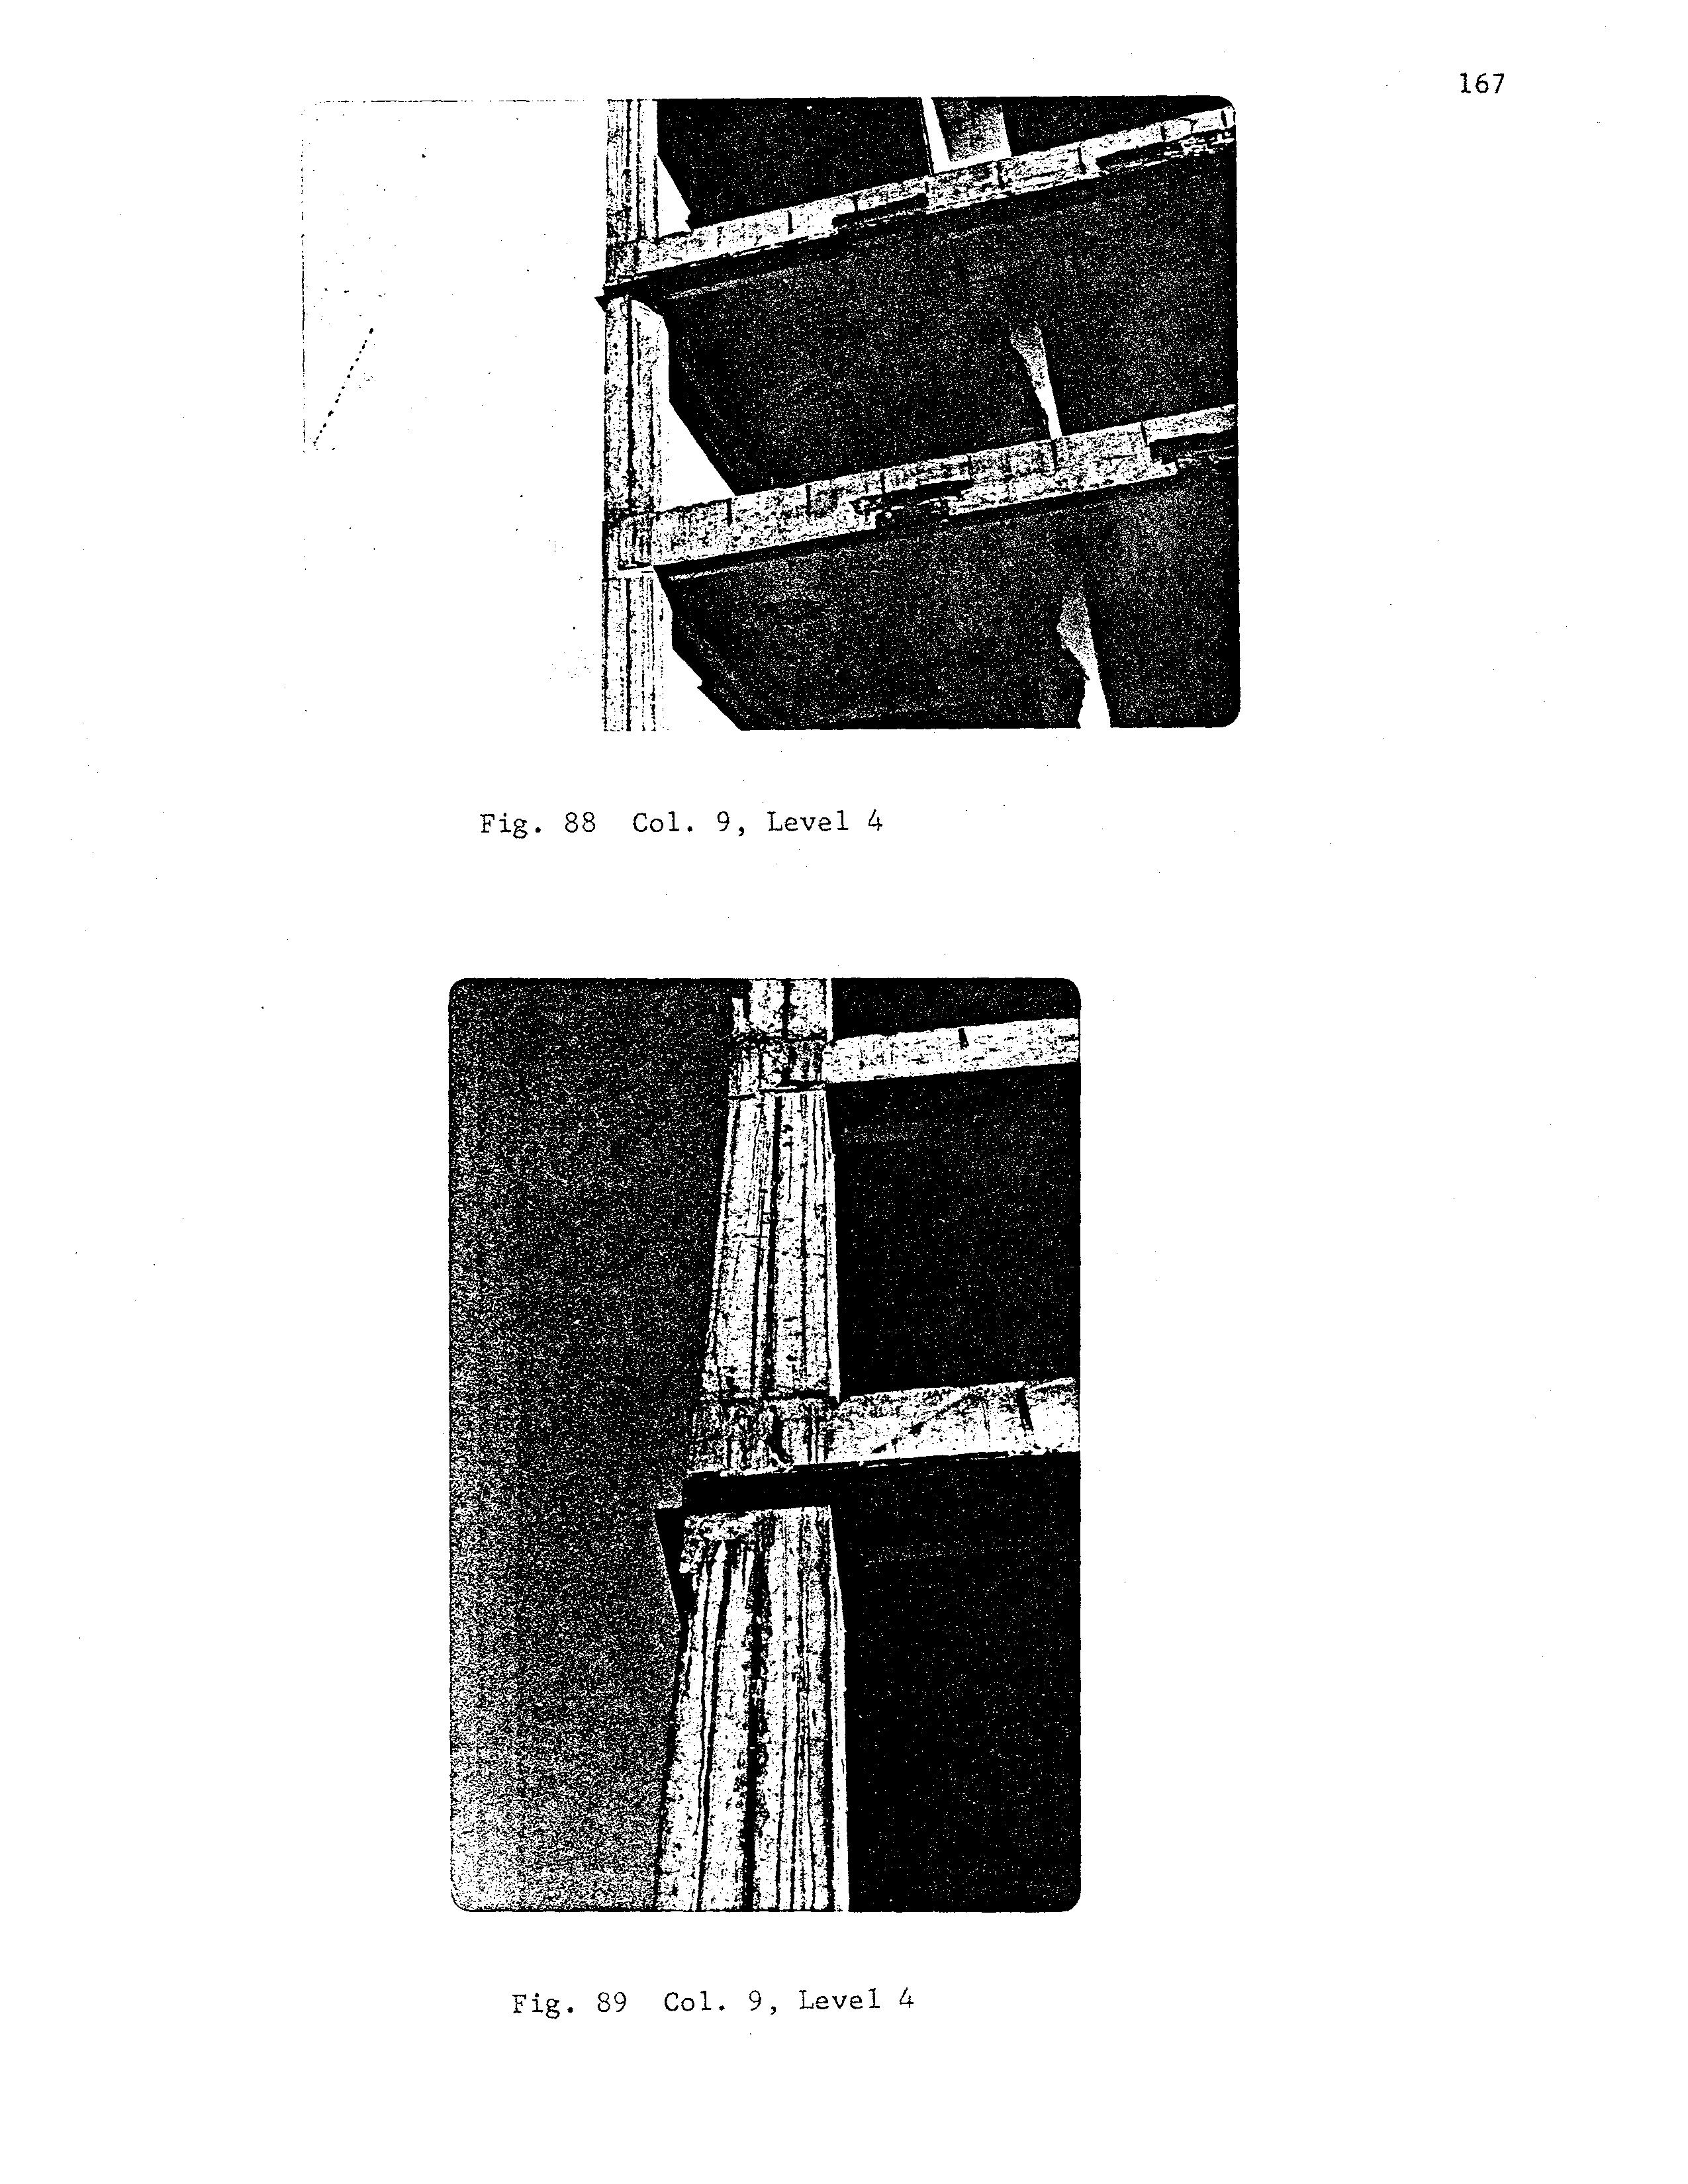
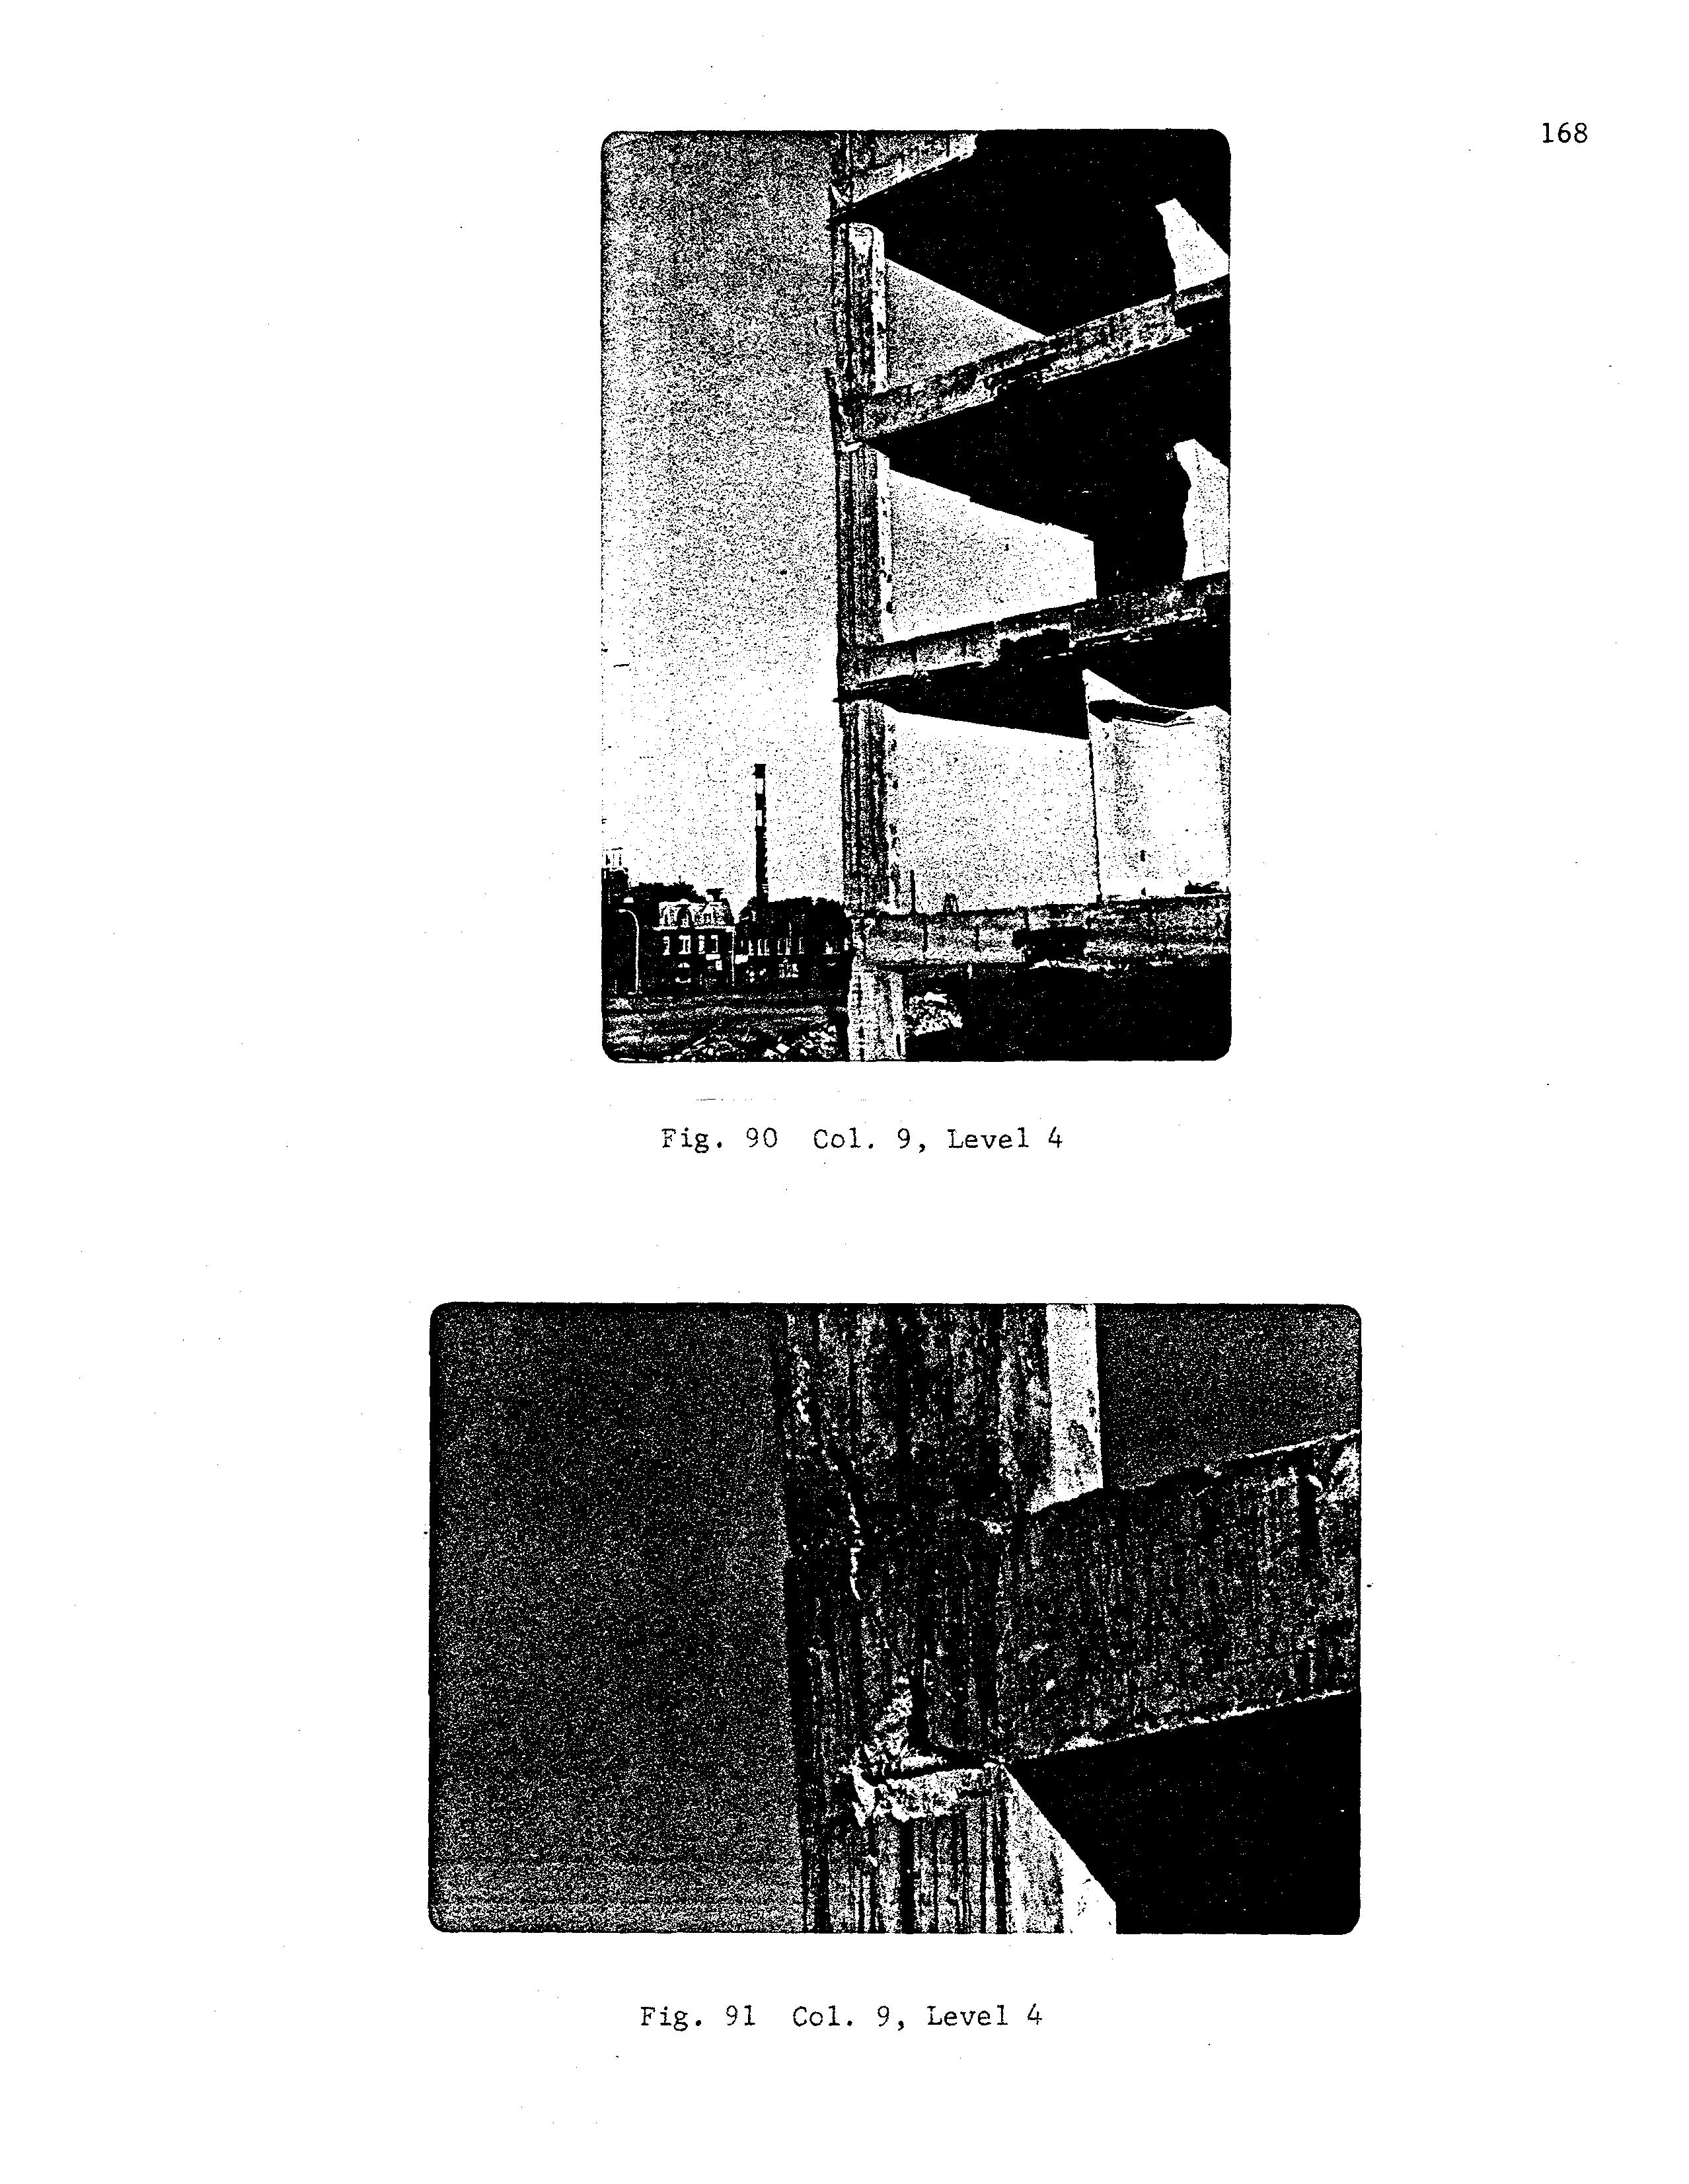
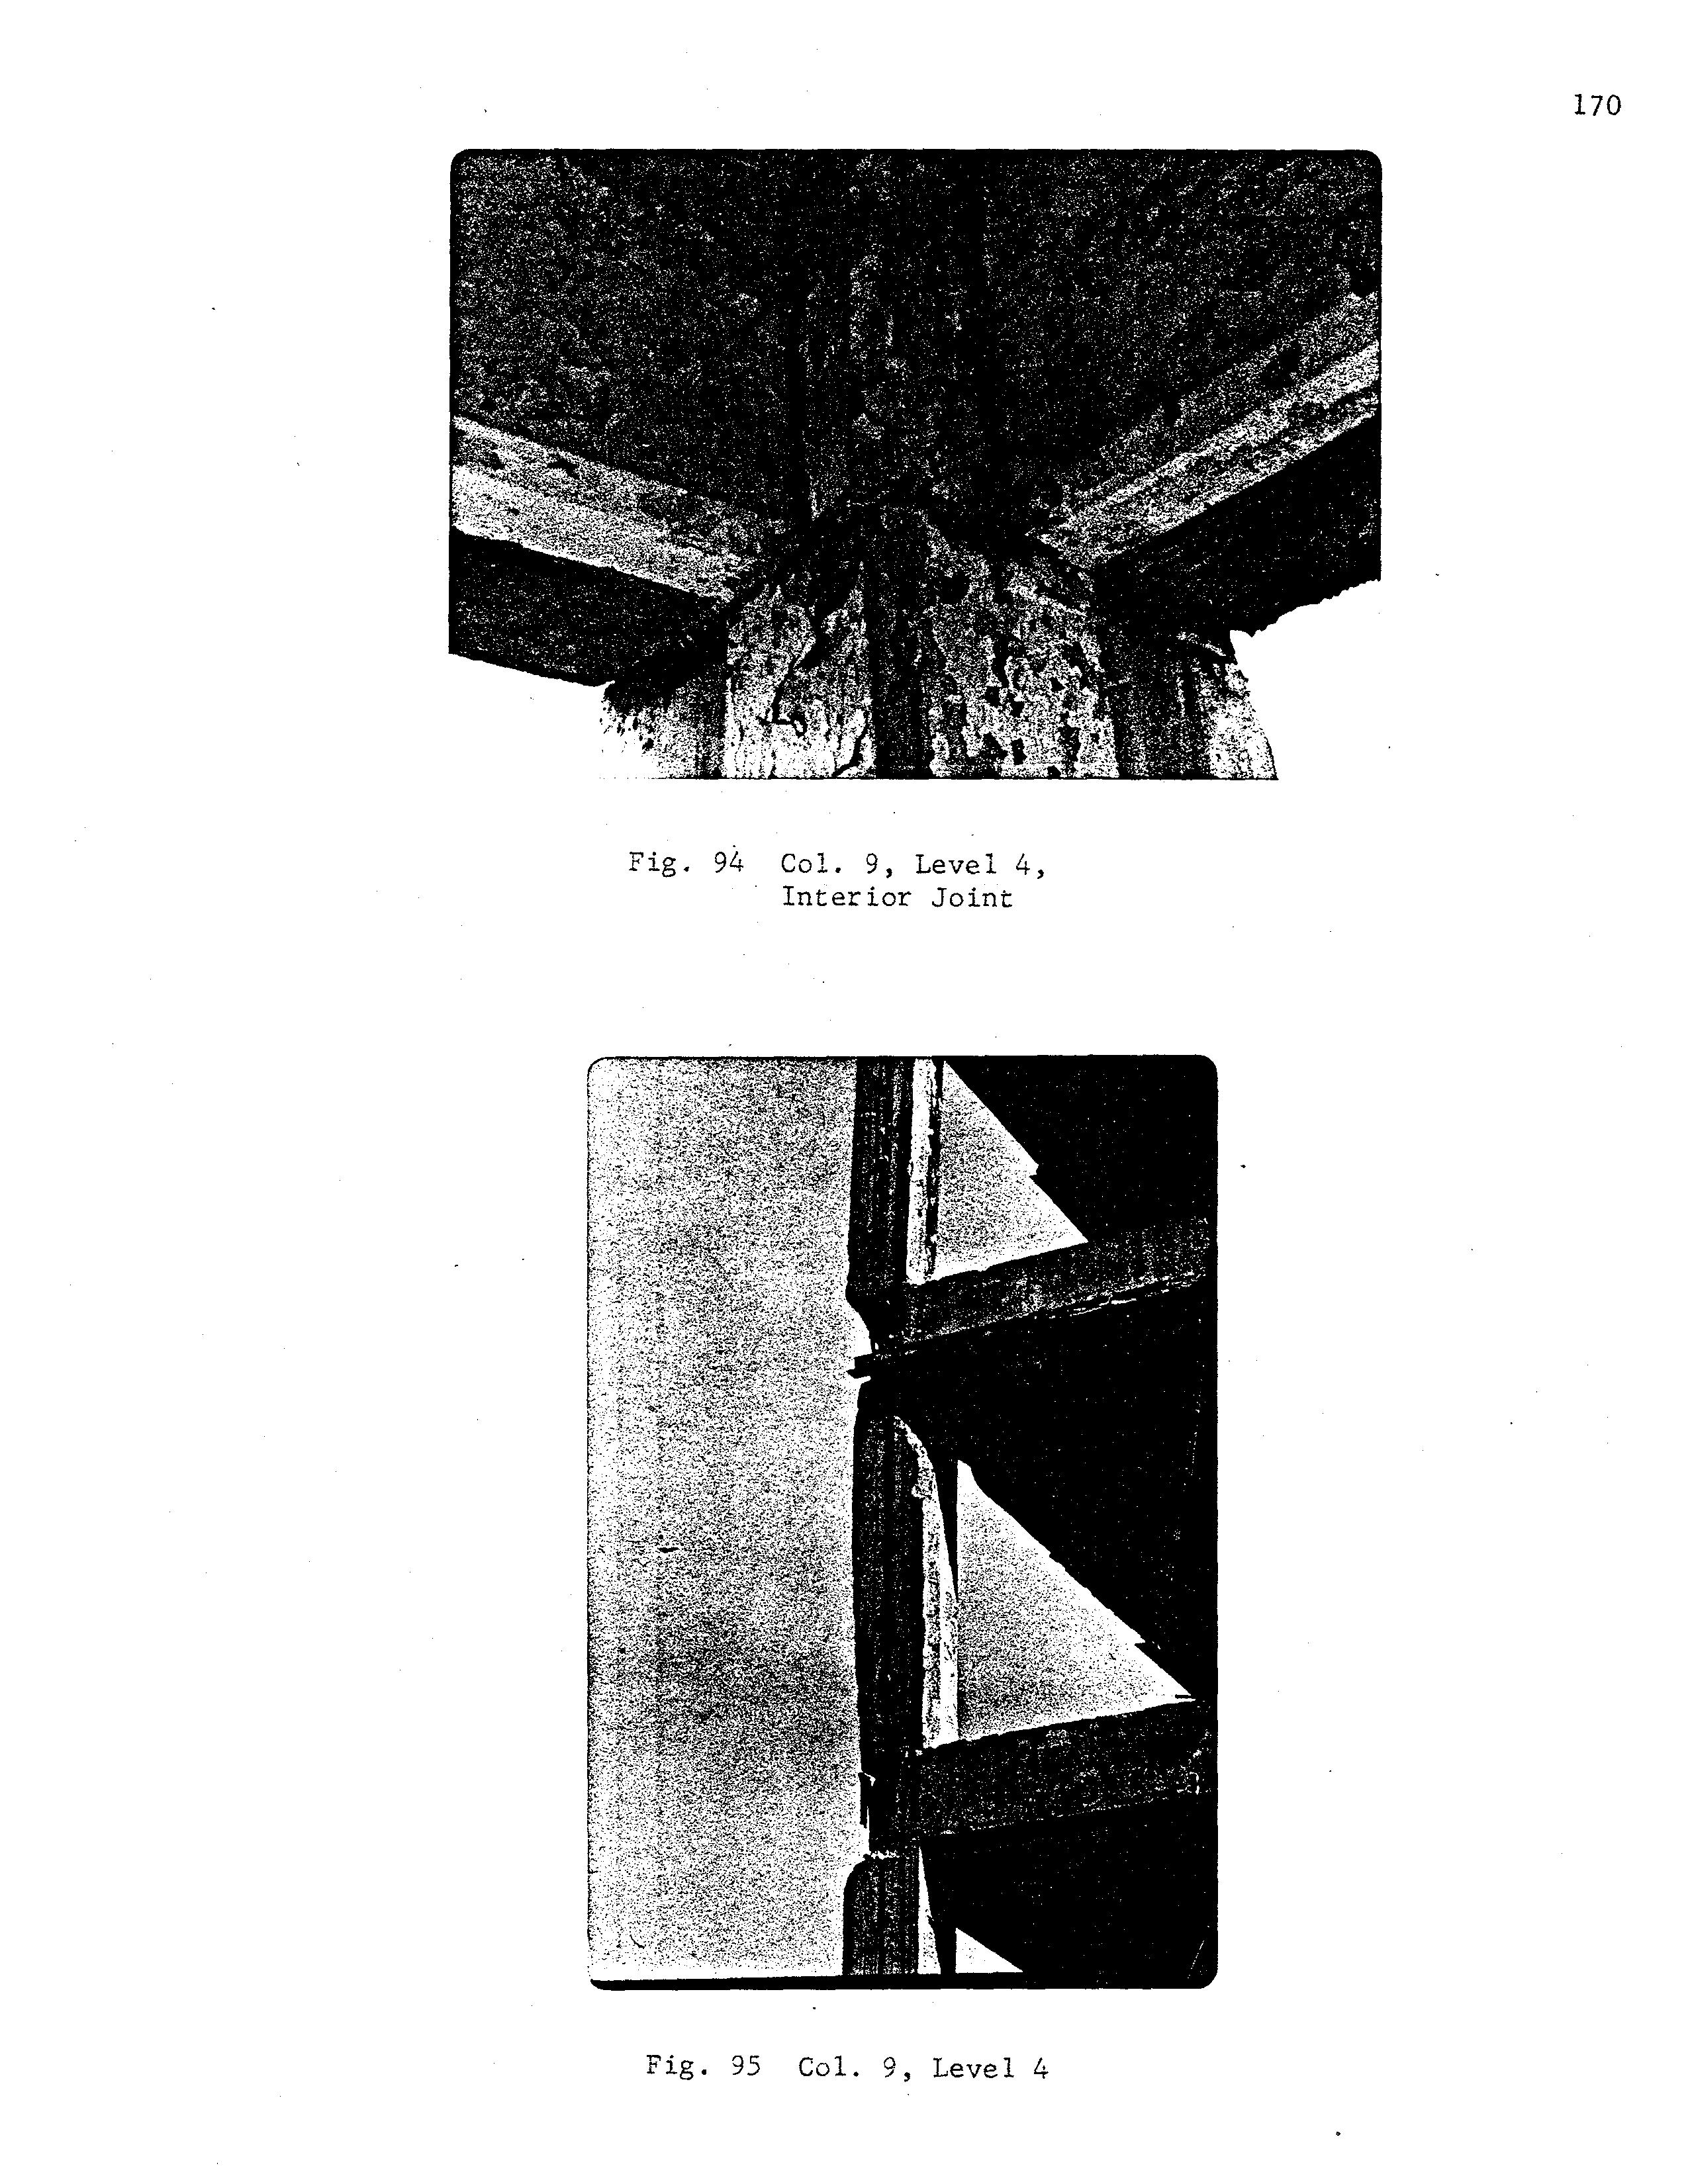
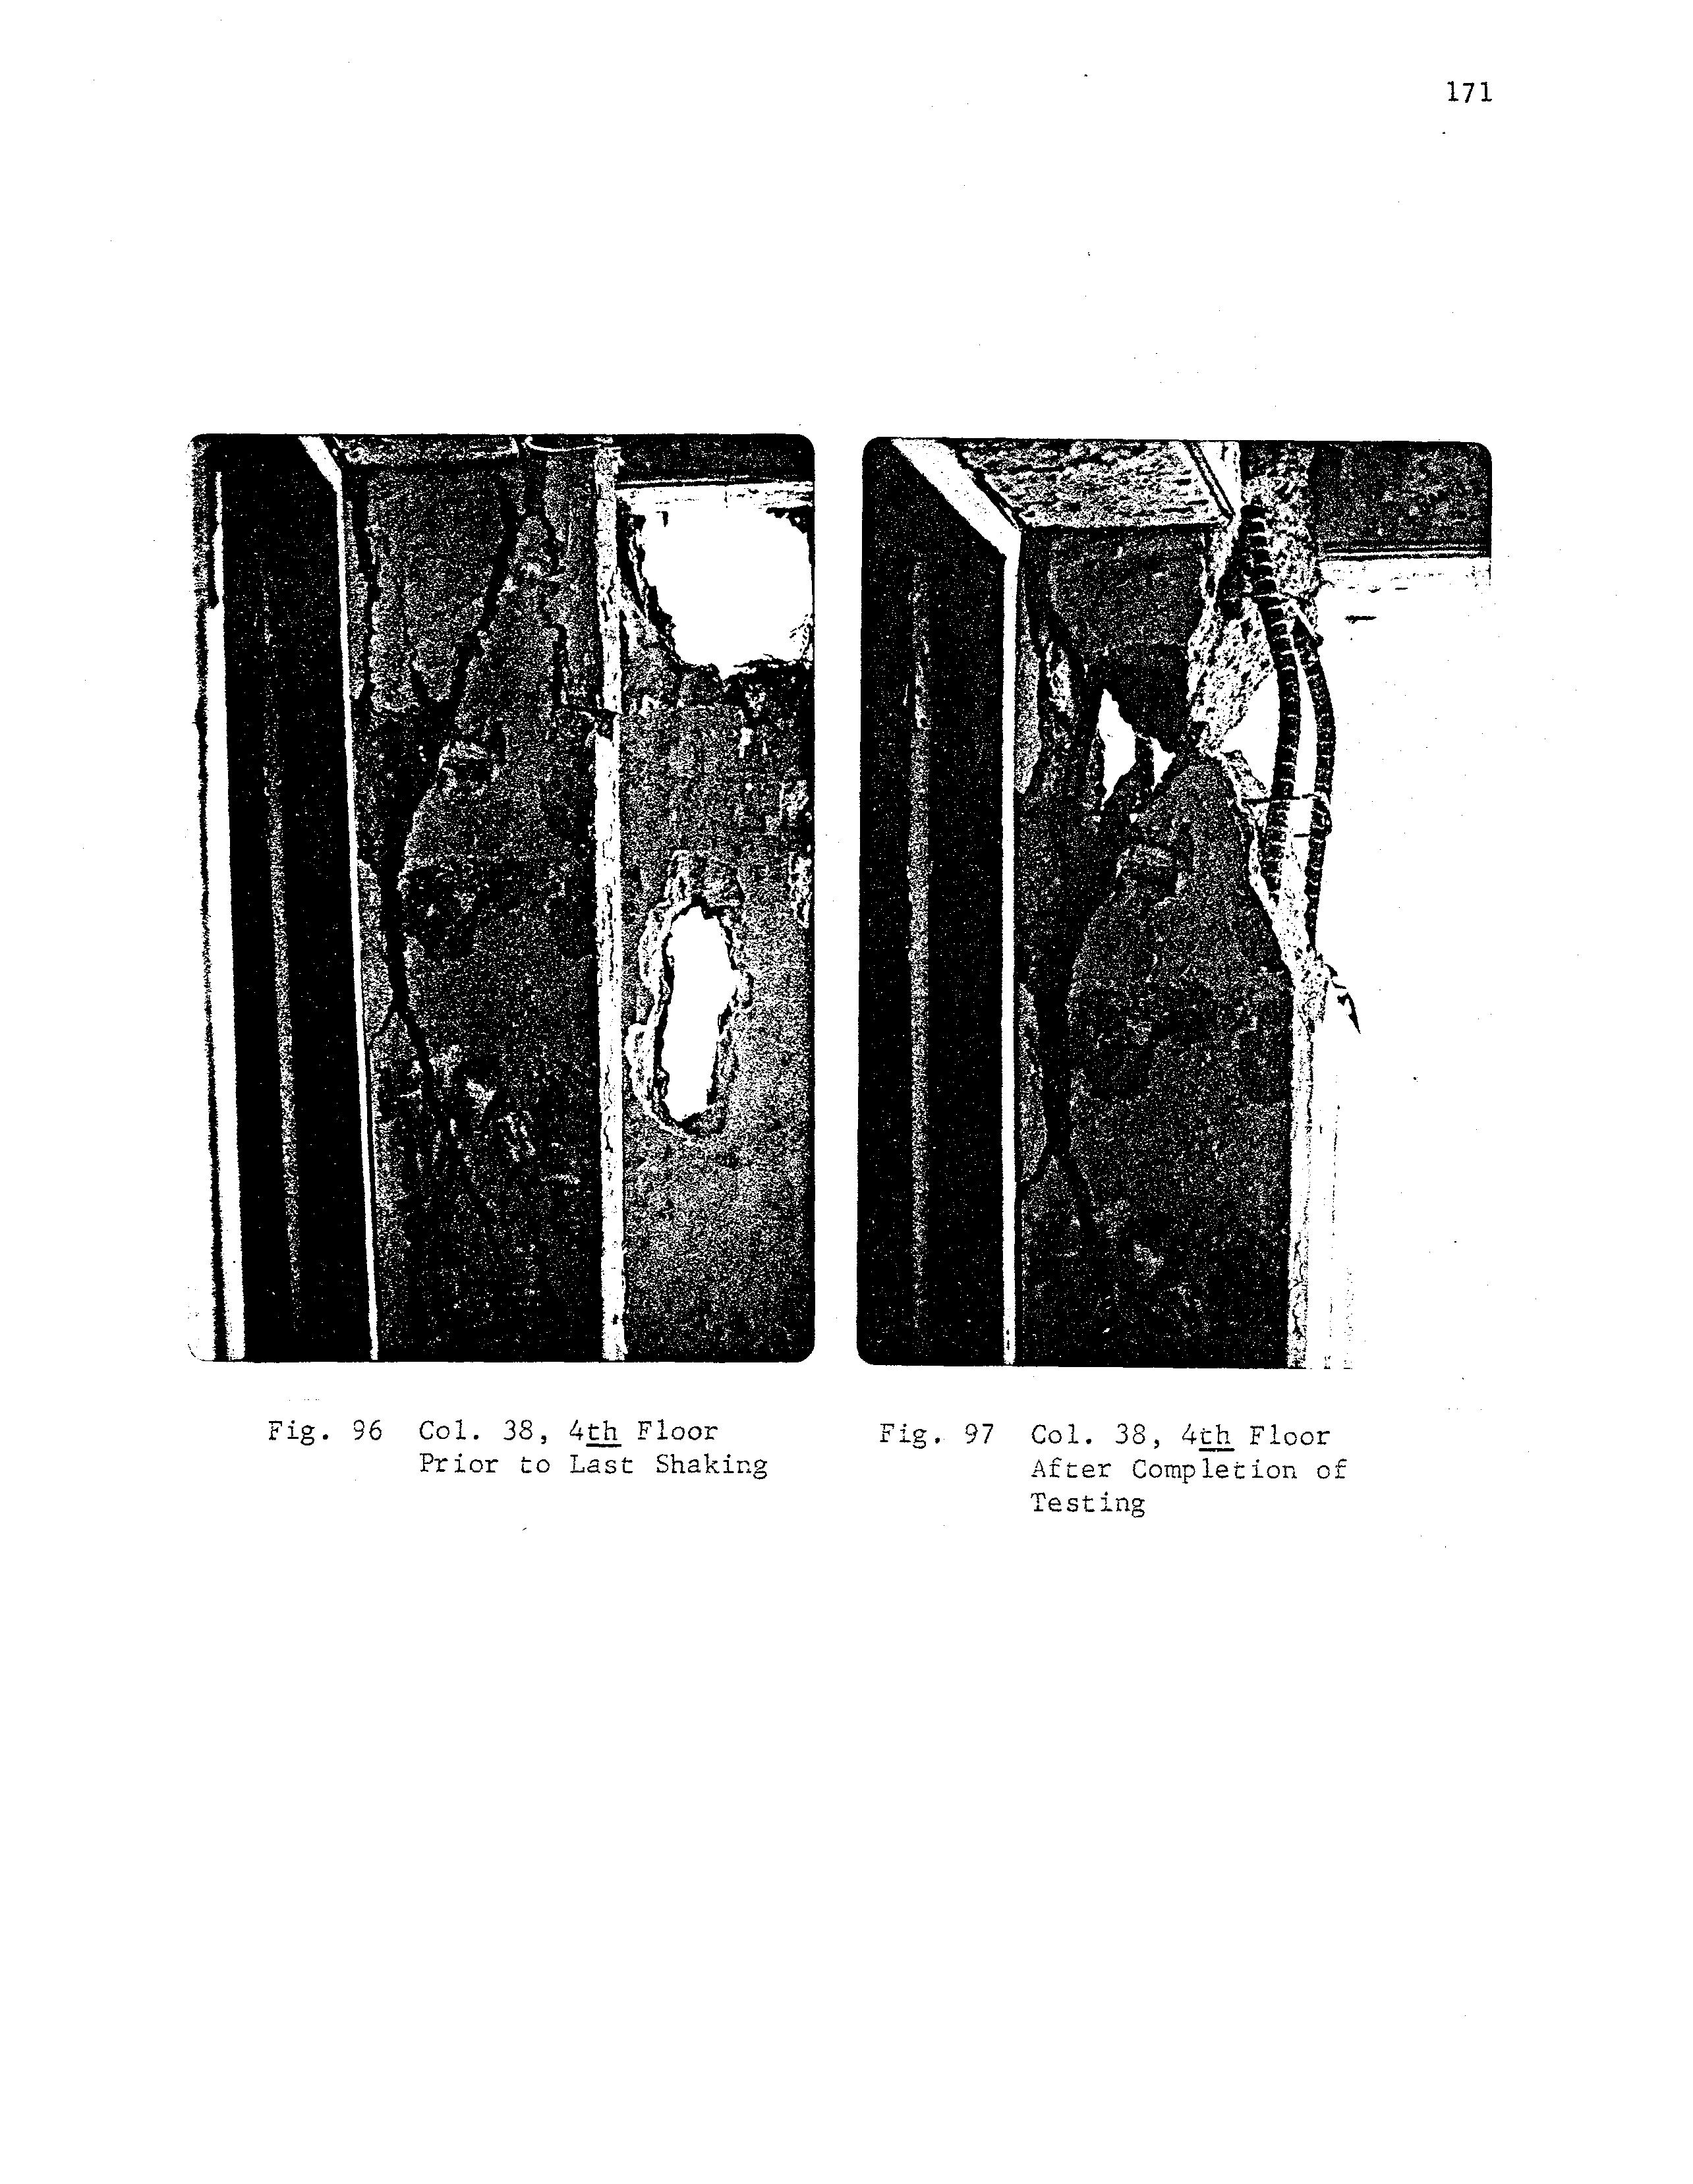
The tests performed in this project have demonstrated that it is feasible to take a relatively massive structure and to excite this structure by mechanical means to large enough displacements such that major structural damage occurs. Roughly one fourth of the joints were so severly damaged that the rotational stiffness became almost zero. Some of the columns were several inches out of alignment at the termination of the tests, and one column was completely crushed. From on-site experience during the final large force-level test runs it may be postulated that it would have been possible to drive the structure to the extent that total collapse could have been achieved. This was not done because of safety requirements and in order not to lose part or all of the equipment. While the structure was not designed for reversing lateral loads and thus was not particularly suited to resist earthquakes, it was interesting to visualize in the progressing damage patterns the transfer of the forces from the members which were no longer capable of resisting them to the relatively undamaged members. Thus the structure did essentially what is expected of proper structures: through the multiple redundancies present force redistribution took place such that the frame finally did not collapse although it had conceptually failed. It would have been very instructive of the forces and end-rotations of the beams and columns of at least the first through the fourth level could have been measured. However, this was prohibitive in cost and time, and so only qualitative observations were possible.
From these qualitative observations it is evident that the joints in the bottom three levels transformed into hinges in the EW direction during the EW tests, with relatively little or no damage above the fifth level. During the NS tests almost all of the joints on the NS face became hinges. That many jOints in the structure transformed into hinges is, of course, an extreme idealization, as the analytical studies showed (Chapt. 6). There was certainly some moment capacity due to the interaction with the slab, and partially cracked joints still could absorb considerable moment. Given the structural and dimensional details, as well as the many force and response histories available from this project, future work should concentrate on more accurate modeling, including nonlinear behavior of the elements, especially the joints with shear cracks. Such future research could also develop the history of the progression of damage, based on more realistic models of behavior, and comparisons could be made with the qualitative progression of damage recorded in Chap. 3.
The role played by the in-fill walls and the stair-well could not, by the idealized analytical tools used, be clearly isolated. During the initial small amplitude shaking the stiffness of these non-structural elements definitely played a role. However, with larger amplitude shaking these elements sustained the first damage; the stairs buckled, and the walls first cracked and then were battered to pieces by the repetitive lateral deflections of the columns. These elements contributed mass but little lateral stiffness.
The dynamic data provided ample proof of the changes in period with increased damage. Furthermore, these changes were permanent, as evidenced by subsequent small amplitude tests. Major changes in period, and also major damage which caused these changes, occurred during the first mode resonance, with small effects noted from even the high force level second mode tests. Future analytical work should be performed to predict the structural and dynamic changes by refined analytical models. This need for future more sophisticated studies is especially true for the determination of damping. The damping was relatively small according to the methods used to determine it, even for the damage-producing high level first-mode loading cycles.
In addition to many qualitative results and observations, this project produced a wealth of data (force level, period, duration) on the lateral force applied to the structure and the resulting accelerations in numerous locations of the building. This data, as well as the data on the geometry and material, are available for further research and analysis to permit the checking of advanced conceptual models of structural behavior under repetitive cyclic forces. The verification of such models will provide researchers then with more confidence to use them in earthquake and/or blast analyses of structures of this type.
A final word about earthquakes. The testing did not intend to simulate earthquake loading at all, and any direct conclusions from this work are not valid. One cannot help, however, to contemplate at least some qualitative conclusions. Table 11 provides ratios of the computed baseshear from the test data to the code-specified base-shears in the 1974 and 1976 Uniform Building Code. From this table it is evident that the structure under the most severe shaking did support base shear forces in excess of the required base shear for the highest seismic areas. One could argue, on the one hand, that structures of this type, though not designed for earthquakes, have a very good chance of surviving base shear forces of this magnitude. On the other hand, one could argue that intense short duration excitations from an earthquake have really nothing in common with the long sequences of regular sinusoidal forces applied in these tests, and that any conclusion as regards earthquakes is meaningless. The actual performance of the damaged test-structure would have to be examined by analyzing the structure, having the experimentally recorded dynamic properties for a basis, under an earthquake record. This was not done, and much future work is left.
However, it might well be that a severe earthquake in St. Louis, such as the New Madrid earthquakes of Dec. 1812 through Feb. 1813. could have relatively regular periods. What is evident is that the New Madrid shakes were repetitive, reocurring many times during a two month period, and so the excitation and the response of the test building could be representative of local situations. The exploration of this idea, too, is left for future research. It appears, nevertheless, that the very pronounced load sharing and force distribution from damaged to undamaged parts of the building can have but beneficial effects on the resistance of a New Madrid type earthquake. While the structure may possibly survive without collapse, this cannot be said for the cladding. The walls would probably distintegrate rapidly since there is not much beyond gravity to hold them in place.
In conclusion, the most significant results of this research are the data gathered and available for future analytical modeling.
Many people have made this project possible, and these are acknowledged in Appendix A. We wish to express our most sincere thanks again to all of them. This project was a great experience to us, and we are especially grateful to the National Science Foundation for the financial support which made it possible.
10. REFERENCES
1. Chen, C. K., Czarnecki, R. M., Scholl, R. E. "Destructive Vibration Test of a Concrete Structure" in "Advances in Civil Engineering Through Engineering Mechanics," Proceedings of ASCE Specialty Conference, May 23-25, 1977, Raleigh, N. C.
2. Chen, C. K., Czarnecki, R. M., Scholl, R. S. "Vibration Tests of a 4-Story Reinforced Concrete Test Structure," JAB-99-119, URS/John A. Blume Assoc., San Francisco, Calif., Jan. 1976.
3. Smallwood, D.O., Hunter, N. F. "A Transportable 56-KN, 200 rom Displacement Hydraulic Shaker for Seismic Simulation," Proceedings, Environmental Science, 1975.
4. Applied Nucleonics Company "Moderate Level Vibration Tests on an Eleven Story Reinforced Concrete Building", Report No. 1158-1, Sept. 1976.
5. Beck, J. L. lIStructural Identification Using Earthquake Records," Earthquake Engineering Research Laboratory (EERL) Report to be published, 1978, California Institute of Technology.
6. Raggett, J. D., "Time Domain Analysis of Structure Motions," JAB-99-l03, John A. Blume & Associates Research Division, April, 1973.
7. Wilson, E. L., Hollings, J. P., Dovey, H. H., "Three Dimensional Analysis of Building Systems (Extended Version)," Earthquake Engineering Research Center, Report No. EERC 75-B, 1975.
8. Wilson, E. L., Dovey, H. H., "Static and Earthquake Analysis of Three Dimensional Frame and Shear Wall Buildings," Earthquake Engineering Research Center, Report No. EERC 72-1, May 1972.
9. Gardiner, R. A. "Material and Dimensional Properties of an Eleven Story Reinforced Concrete Building." M.S. Thesis, Washington University, Aug. 1978.
Table 3 Slab Details
Table 4 Footing Dimensions
* See Fig. 57 for identification on the vertical coordinates. ** See Fig. 56 for identification on the planar coordinates. *** Reference
North-West Corner
South-East Corner
South-East Corner
Near Stairwell
Near Stairwell
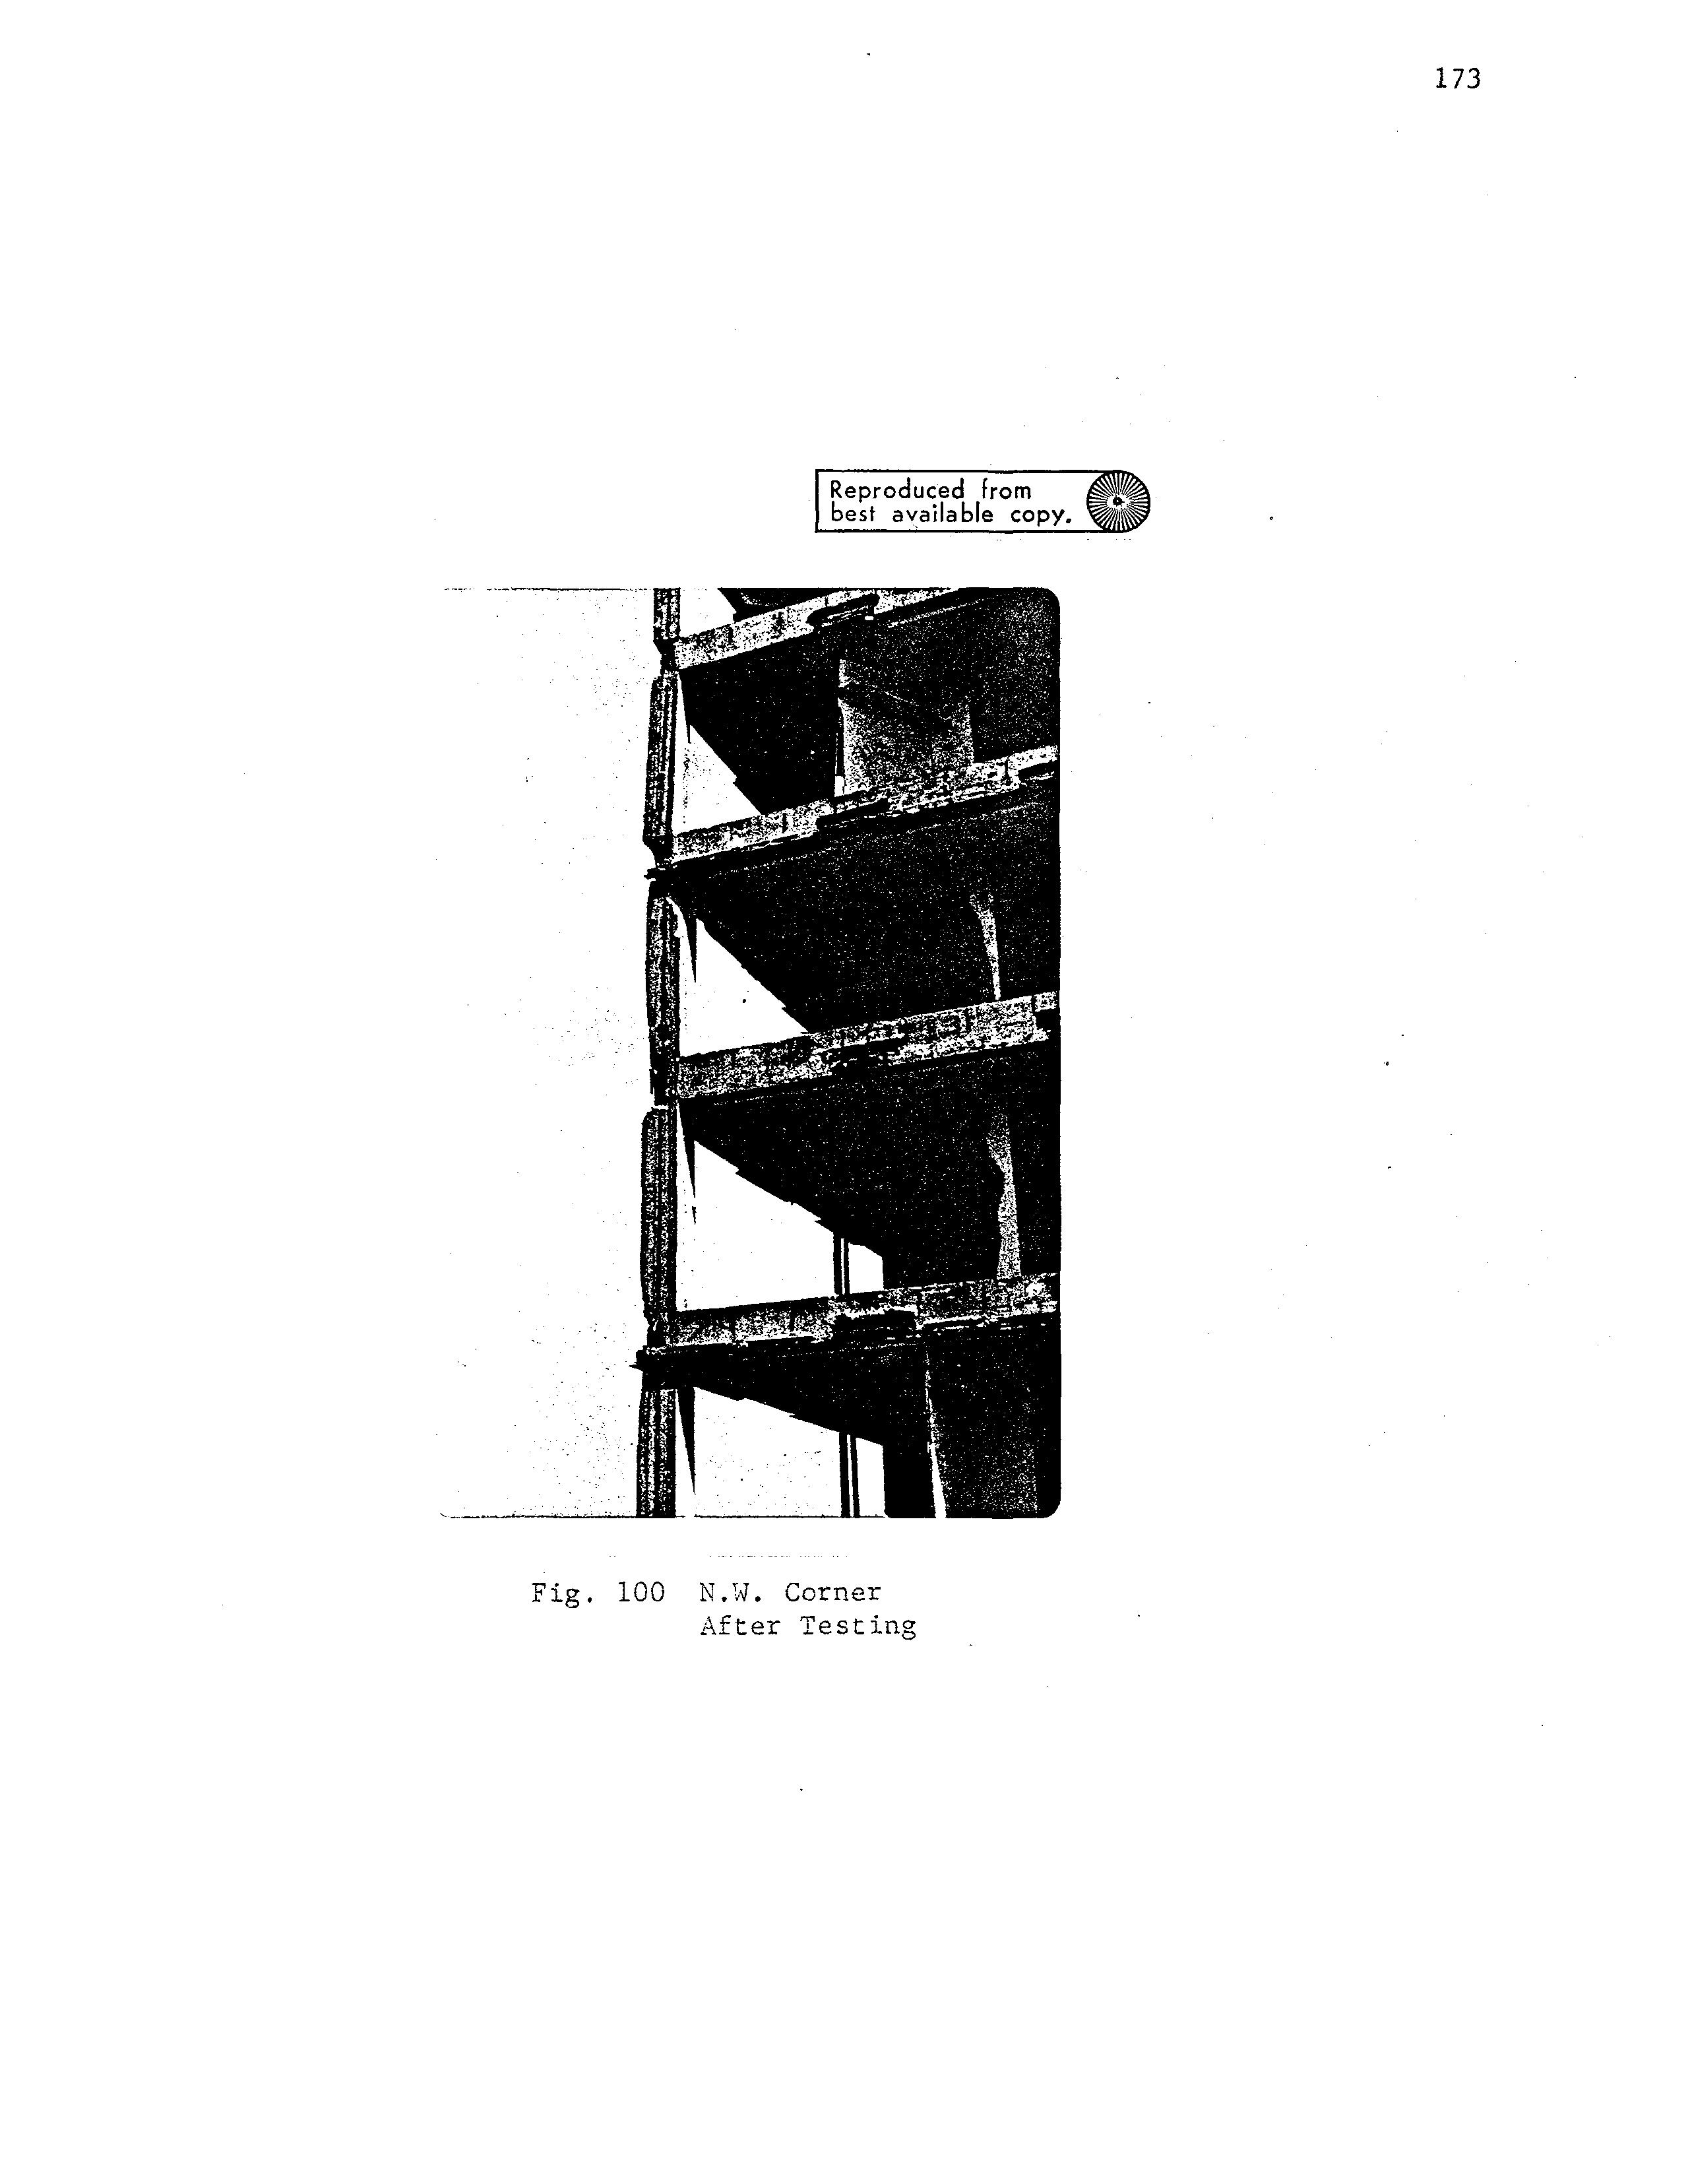
North-West Corner
South-East Corner x
*The direction of sweep for this sweep was up, i.e., .from a lower to higher frequency.
**The first damping value was obtained from the frequency response curve. The value in parentheses was determined by the time domain method.

*The direction of the stepwise sweep was up, i.e., from a lower to higher frequency. For all other tests the direction of sweep was down, i.e., from a higher to lower frequency.


*
First Translational Mode Damping Tests Without External Cladding, NS Tests th Accelerometer (II level) th Accelerolerometer (5 level) th Shaker (II level)
*In all tests except 19N-D the direction of sweep was down, i.e., from a higher to lower frequency. In 19N-D the direction of the sweep was the reverse.

*In all tests except 20N-D the direction of sweep was down, i.e., from a higher to lower frequency. In 20N-D the direction of the sweep was the reverse.


Triaxial Accelerometer th (II level)
A Union Electric power terminal and transformer
B Sachs Electric switch boxes and support on ground level
C Instrumentation trailer
D llQ/220V lines to trailer
E 440V line to 11th floor, outside of building
F llO/220V lines building, running up stair-well
G Telephone terminal
I, H Control, communication and accelerometer connections to building
A Column
B Wall
C Stored lead ingots
D Tool storage
E Hydraulic actuator attachment to Building
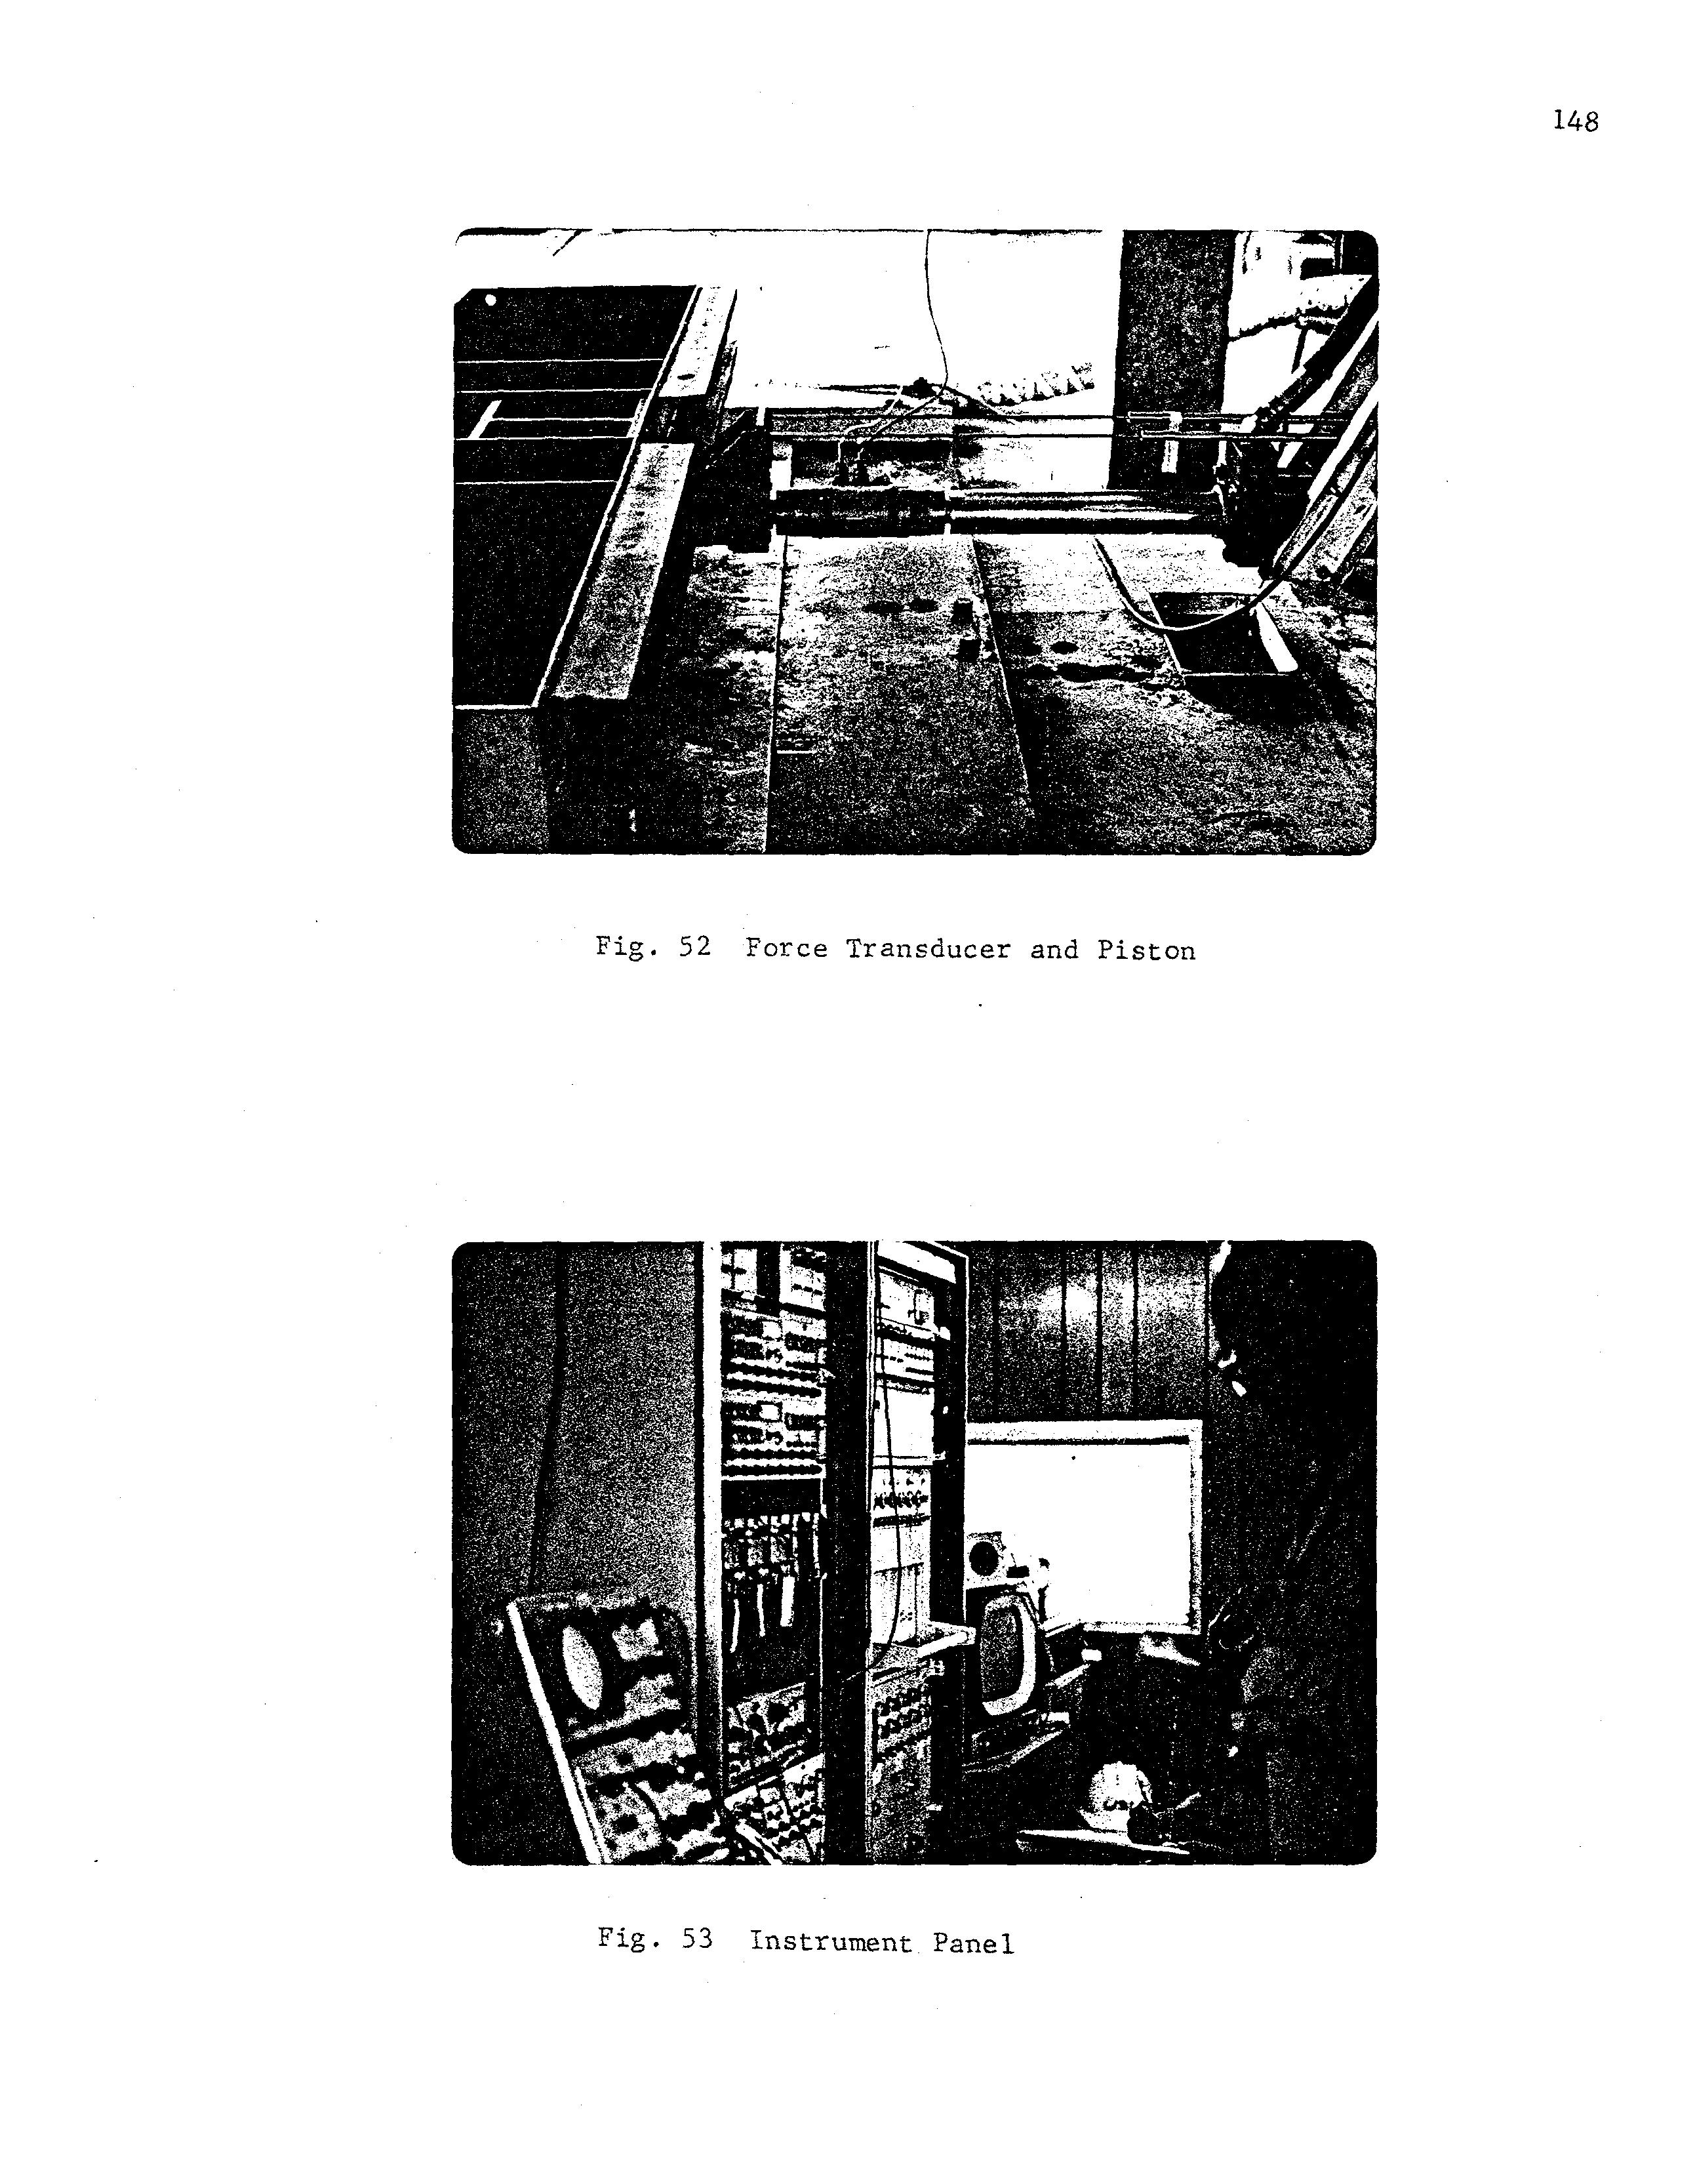
F Hydraulic actuator
G Accumulator
H Hydraulic lines
I Pump-motor assembly
J TV Camera
K Piston
L Stiffened base plate
M Moving mass box


Ground Basement


Testing
Experimental, T=O.23, Test No. 11 E-M
Experimental, T=O.4l, Test No. 27 E-M
Test 8N-M; 1=0.29 sec
Test 34N-M; T=0.34 sec a) Test lE-SD, Bucket Weight 5800 Ib (2631 Kg), Actuator Force 5,000 Ibf (22,240 N). b) Test 4E-S, Bucket Weight 19,000 lb (8620 Kg) Actuator Force 10,000 Ibf (44,480 N). c) Test SE-SD, Bucket 57,700 lb (26,170 Kg), Actuator Force 5,000 Ibf (22,2L:,O N)
Reference Accelerometer on 10th Floor
Actuator Force .
Test 30N-D, Actuator Force 15,000 Ib (66,720 N) at a Frequency of 0.68 Hz.
Test 2l .E-D, Actuator Force 25,000 Ib (111,210 N) at a Frequency of 0.52 Hz.
Modell; T=l.OO sec
Model 2; T=1.38 sec
Experimental T=O.88 sec
Experimental T=1.85 sec l4E-M 28E-M
Model 1 T=o.34 sec
Model 2 T=o.386 sec
Experimental T=o.23 sec llE-M
Experimental T=o.41 sec 27E-M


