85 minute read
DYNAMIC TESTS OF A REINFORCED CONCRETE BUILDING

from Galambos and Mayes
by Straam Group

An eleven-story reinforced concrete building was subjected to a variety of dynamic tests during the period July through November 1976. This report presents the description of these tests, it sums up the data, and it evaluates the results. The research was conducted under the management of Washington University in St. Louis, and it was sponsored by the National Science Foundation (NSF Grant ENV 76-08244).
1.1 THE PRUITT-IGOE HOUSING COMPLEX OF ST. LOUIS
Advertisement
The building structure which was subjected to the dynamic tests described in this report was part of a building from the St. Louis Housing Authority's Pruitt-Igoe Complex which was demolished in the period between February and December of 1976.
The reason for the demolition of this series of apartments, and thus the availability of this building for testing, is a long, complex and sad story of urban decay. The history of the rise and fall of this experiment to house the poor, the expectations, the disappointments, the attempts at complete or partial remedy, and the final decisions to raze the area is beyond the scope of this report, and its description is well beyond the competence of the authors. Contemporary newspaper and magazine articles (1950-1976), the Congressional record, as well as numerous general and specific studies can be consulted for details. It is the opinion of the authors that the ultimate causes of failure are not fully understood, that they are complex, and that a good explanation will have to await the cooler perspective of time.
This report will thus restrict itself to a few factual statements of the background necessary to understand this research report.
The Pruitt-Igoe apartments were located about two miles NW from the Arch in St. Louis. The housing complex was one of several low-rent projects in St. Louis, and it was opened for occupancy in 1955-1956. The owner of the project was the St. Louis Housing Authority. The overall and architectural design was performed by the St. Louis firm Hellmuth, Yamasaki and Leinweber, Architects; the structural design was made by the firm W. C. E. Becker, Consulting Engineers, and the buildings were
* constructed by the I. E. Millstone Construction Company •
The apartment complex had 2800 units in 33 eleven-story buildings
2 on a 57 acre (23,lOOm ) tract bounded by Jefferson Avenue in the West,
Cass Avenue in the North, 20th Street in the East and Carr Street in the South (Fig. 1). This area also contains a library, a community center and several churches and elementary schools. Upwards of 10,000 residents occupied these apartments at one time, but the project's high vacancy rate, vandalism and other problems created a constant drain on the St. Louis Housing Authority's finances. The last families moved out in August 1973, and the buildings stood empty until demolition in 1976. Various plans were examined to rehabilitate the buildings, but by January 1975 it was decided to raze the area completely. What happened was that these buildings were effectively occupied from 15 to 18 years, after which they were abandoned and subsequently demolished. From a structural engineering viewpoint these buildings were relatively modern, built and designed according to contempory standards. Structurally, then, these buildings were new and undamaged prior to demolition.
Prior to the final razing of the buildings in 1976 two structures were subjected to experimental demolition by explosives: one complete A-type building, and the central narrow 360 ft x 29 ft (110m x 8.8m) section of Building C-3 (Fig. 2). The wider 45 ft x 40 ft (13.7m x l2.2m) end portions of this building were left undamaged by the explosions, the connecting beams and slabs having been separated by pneumatic hammer and torch before the explosion. One of the remaining "towers" from Building C-3 was the building used for the dynamic tests. The explosive demolition method received wide publicity in the news media when it was performed in 1972, but this method was not used when the remaining buildings were demolished during 1976. These structures were razed instead by conventional methods, using a "headache ball" of lead. This method of demolition permitted the eventual recovery of the reinforcing steel for sale as scrap, and the remaining rubble, consisting of bricks, concrete block and chunks of concrete, was easily loaded and hauled away.
*These organizations are still active in St. Louis, and excellent cooperation was rendered by each during the dynamic test project. The firm names are the ones in effect when the project was built, and some of the organizations have since changed their names.
The demolition of the Pruitt-Igoe buildings was planned and supervised by the Sverdrup and Parcel consulting firm of St. Louis, and the actual work was performed under contract by the Cleveland Wrecking Company of Cincinnati, Ohio, and the AALCO Wrecking Company of St. Louis.
The buildings in this project were all of similar construction: they were all eleven stories tall from the ground up, and they had a short sub--basement used as pipe galleries. Columns had each a spread footing, and the structure consisted of square columns, beams and slabs. Three types of buildings were constructed, Types A, Band C (Fig. 2), the only difference being the length of the central narrow portion. All buildings had their longest dimensions in the East-West direction.
The outside faces of the buildings were brick facade, backed up between the structural frame with concrete blocks. Concrete block walls existed also around the stair-wells and elevator shafts. All other interior partitions were plasterboard walls with metal lath. The structural elements, such as the beams, slabs and columns, were clear concrete on the surface except for some interior columns which were faced with plaster.
The structure was designed according to the 1953 ACI Code for gravity load only. The frame was of continuous construction.
The situation, then, in 1974 and 1975 was that there existed a great number of structurally sound contemporary buildings which were slated for demolition. This presented a unique opportunity to perform tests on one or more of these buildings without regard to possible damage from the experiments in. an area of the city remote from inhabitants. The photographs of Figs. 3 through 10 depict various details of construction and of the demolition operation. Structural details of the test-building are presented in later parts of this report.
1.2 HISTORY OF THE PRUITT-IGOE SHAKING TESTS Background
Attention was drawn in a very dramatic way to the social problems of the Pruitt-Igoe Housing Project in St. Louis when one entire building and a part of another building was demolished by explosives in 1972. The explosive experiments were conducted to demonstrate the feasibility of this method of removing abandoned buildings from an urban area, but they went far beyond that in their significance. They forcefully illustrated to the city, the nation, and the world that Pruitt-Igoe as originally planned had failed as a social experiment and that something had to be done about it. Whatever was to be done in terms of social and physical renovation would take a great deal of time and money, and it appeared at that time that if some or all of these structurally sound buildings were to stand empty for a long time then they might just as well be used for some structural engineering experiments.
The desirability of different types of tests was discussed during 1973 and 1974 with various professional friends who were interested in the full scale performance of structures, most notably with members of the Research Council on Performance of Structures (RCPS) of the American Society of Civil Engineers (ASCE). The object of RCPS, as stated in its Rules of Procedures is "to advance engineering knowledge and practice on the subject of actual performance of full scale structures". A variety of possible test schemes were explored such as static tests under gravity and lateral loads, survey of actual physical properties and their comparison with design properties, progressive collapse tests by explosive to damage parts of a structure, small-scale and large scale dynamic tests, the study of the propagation of fire from one building to another, etc. It appeared that one could have transformed the whole complex into a laboratory for building research in which valuable experimental studies could have been performed for a decade or more.
The realities of politics and finance do not generally consider the desires of the researcher of the art and science of building engineering, and by 1974 it became apparent from newspaper articles that serious consideration was being given to the complete demolition of the project. Thus it seemed that if there was to be any testing at all, it would have to be of limited scope and it would have to be done quickly. The professional opinion of the members of RCPS was that the greatest need existed for information of the behavior of structures which were subjected to large amplitude dynamic motion which produced damage to some structural components. Such information was thought to be valuable as input to the dynamic analysis of non-linear structures.
The principal investigator, in connection with an NSF site visit in September 1974 at Berkeley, met Dr. Ronald Mayes, who subsequently became the co-principal investigator of the project, and explored the feasibility of large-amplitude tests on large concrete buildings. Dr. Mayes seemed to feel that such tests were within the realm of technological possibility. The outcome of the discussion was that the principal investigator contacted the National Science Foundation, and this agency indicated that they might be interested in funding a feasibility study of performing large amplitude tests on one of the Pruitt-Igoe buildings.
Consequently a proposal was prepared and submitted to NSF on February 24, 1975, and this proposal was funded on April 4, 1975 for the period April 1, 1975 through December 31, 1975. The amount of the contract was $20,000. The proposed work had two objectives:
1) It was desired to find out if large-amplitude dynamic tests were technically feasible for such buildings.
2) In case that it was judged possible to perform the tests, then these experiments were to be planned and a new proposal was to be prepared to perform this work.
During the initial phases of this feasibility study, which was performed with the aid of Dr. Mayes and Dr. Hatcher (of Washington University) it seemed that it was indeed possible to generate enough force to excite part of a building but that it would take several large shakers to produce significant motion in a whole building. Since only one large dynamic shaker was available, and since the coordination of the motion of several shakers was believed to represent formidable control problems, it was decided that tests should be performed only on an isolated part of a building. Isolation of the end or the center of a building was considered, using jack-hammer and torch, but the cost of this separation was found to be very high. Attention was drawn at this time to the two remaining end towers of building C-3 which were left standing after the center part of this building was blown out. One of the towers, the one at the West end of the building, is shown in Fig. 10. The central portion of C-3, 270 ft long by 29 ft wide C82.3m x 8.84m) was blasted away in 1972, and the rubble was removed, leaving two 40 ft x 45 ft C12.l9m x l3.72m) towers separated by a 270 ft (82.3m) space. Prior to blasting the connecting beams and slabs were completely separated by jack-hammer and torch between the part to be blasted and the part which was to remain intact. Furthermore, the blasting operation was carefully planned not to damage the separated end parts of this building. This was a successful operation, and a careful inspection of the two end towers of Building C-3 in the summer of 1975 revealed that visually these structures were whole and completely intact. This was further borne out in the subsequently performed dynamic tests on this building.
It appeared then that two ready-made structurally sound test-buildings existed which could actually be tested such that significant deformations could be induced with equipment then available. Furthermore, it was probably possible to perform these tests at a reasonable cost.
During the performance of the feasibility study in the summer months of 1975 the St. Louis Housing Authority completed plans for the total demolition of all the remaining buildings in the Pruitt-Igoe complex. The demolition operation was probably to commence early in 1976, and it was to move quickly, with a planned completion in a period of about 18 months. This placed several obstacles into the research plan: We would be pressed for time, since the contractor would want to finish with the job as quickly as possible, and would have to test while demolition work, rubble removal, and possibly also blasting, was taking place. We felt that if the contractor was cooperative and if the test site was separated by a fenced-off region, then the testing work could proceed independently of the other operations on the site.
Considerable thought was given during the feasibility study to perform tests on both of the end towers of Building C-3. Unfortunately this would have cost a great deal more money (about one-and-a-half to one-and-two-thirds of the expense for testing only one tower) and time. As it turned out, there was barely enough time to test one building without causing delays to the demolition contractor.
Another subject under consideration was the selection of the equipment for the large amplitude tests. Dr. Mayes examined in detail all the available systems of dynamic shakers. It was felt that we wanted to use an available system rather than to plan, design and build a new system from the ground up. Perhaps with more time and considerably more money it would have been advantageous to build such a for this and future uses. Maybe this would have been a good thing to do. Subsequent experience in the actual testing has shown, however, that it was possible to assemble a system from available components for this particular site. Other sites would most likely be considerably different, and future tests could again be designed on the basis of the particular site conditions.
The final selection of the Boeing Company's system was an easy choice for this project because their equipment was the only one judged to be able to produce the required forces and it was the only one available in the final time schedule.
It turned out that the feasibility study examined most of the relevant aspects of the work, and finally, a proposal was completed and submitted to the National Science Foundation. This proposal was subsequently funded in full.
The Proposal for the Project
Upon completion of the feasibility study a proposal entitled "Full Scale Tests on Eleven Story Building in the Pruitt-Igoe Housing Project of St. Louis" was submitted to NSF on October 23, 1975. The planned starting date was January 1, 1976, and the period of the project was for one year. The budget called for an expenditure of $365,101. However, due to changes in the rates charged by the sub-contractors a request for an increase was submitted on January 30, 1976, and the final proposed budget was $370,459.
Approval of the proposal did not proceed as rapidly as expected. Several review comments were received on February 25, 1976. The replies to the comments were sent to NSF on March 16, 1976. By late May it was apparent that NSF would fund the project, and final approval was received on June 11, 1976, permitting to start the work. Initial funding was for the amount of $219,000, and the remaining $151,500 was transmitted by NSF to Washington University on December 13, 1976, giving a total $370,500. As it turned out, this money was just sufficient to perform all of the work planned in the proposal.
The period of the project is from June 1, 1976 through November 30, 1977, a period of 18 months, including an unfunded six-month flexibility period. The project termination was extended in October 1977 to May 31,
1978.
During the period between the end of October 1975, when the proposal was submitted, and the beginning of June, 1976, several things happened which were of significance to the project. After several failed attempts by a North St. Louis citizens' group to rehabilitate at least some of the buildings for occupancy, a contract was let to demolish the- entire project.
*The termination date was extended to August 30, 1978.
This contract was awarded to the Cleveland Wrecking Company of Cincinnati, Ohio, and to the AALCO Wrecking Company of St. Louis.
The whole area was fenced in and demolition work proceeded in January 1976. In February of 1976, assurance was obtained from Mr. Crane, the supervising engineer for the Cleveland Wrecking Company, that the remaining West tower of building C-3 would not be demolished or damaged unless word was received that the proposal was turned down. Mr. Crane also promised that the adjacent building (Bldg. A-2, Fig. 1) would be removed sooner so that our testing operatLons would not be hampered. These promises were kept, and when we were finally ready to start, only the test building stood in the area, clear of all obstruction and separated from all the demolition operations.
We did experience some anxious moments in the period between the submittal and the approval of the proposal. Because of security, safety, and insurance requirements, it was not possible to visit the test-building to make preliminary measurements and to study the site. This was a handicap because a lot of time was spent later which should have been spent on other matters. Another cause for anxiety was that the legal, security and insurance obstacles would be so severe that we might not, after all, be able to get on the site. A great deal of this anxiety was removed when Mr. Marvin Rose, Chairman of the Board of the Cleveland Wrecking Company, reviewed the proposal and pledged his full support and cooperation. This pledge was crucial to the subsequent success of the project, and it marked a turning point in the prospects of the undertaking.
The proposal to NSF-RANN outlined the following work to be done:
1) Survey of dimensional and material properties
2) Small amplitude shaking tests
3) Large amplitude shaking tests.
Phase 1. Survey of dimensional and material properties.
The rationale for this survey was two-fold: (1) to provide the necessary data for interpreting the results from the dynamic tests and
(2) to determine the correlation between properties and dimensions in the original plans and specifications with the actual structure as it existed 20 years later. This latter purpose would shed some light on the more general question in structural design methodology of the correlation between the plans and the executed construction.
The proposed work was planned to involve the measurement of the relevant structural dimensions (story heights, plan dimensions, beam and column cross-sectional dimensions, slab thicknesses), the determination of the location, size and the yield strength of the reinforcing bars, and the evaluation of the strength and the modulus of elasticity of the concrete by direct (coring) and indirect (sonic) means at enough positions in the building so as to obtain statistically significant results.
Phase 2. Small amplitude shaking tests.
The reason for these tests was a) To determine the dynamic characteristics of the structure by methods that have been extensively used over the past decade. b) To compare the results obtained in a) with those obtained from the large amplitude forced vibration tests. c) To use the information obtained in a) to plan the large amplitude forced vibration tests.
Phase 3. Large amplitude shaking tests.
The proposed large amplitude shaking tests represented something beyond anything which had been previously attempted as far as the intended shaking device and the size of the structure was concerned.
The testing was planned
a) To determine changes in mode shapes, frequencies, and damping values as the force level of excitation increased.
b) To determine the capability of the non-seismically designed building as the force level of excitation increased.
Performance of the planned research.
Actual work on the project site started on June 25, 1976, and the final day of our presence on the Pruitt-Igoe Housing Complex was November 10, 1976, a total of 138 days. During this period many people and organizations helped to make the research possible. A list of these, as well as their functions and contributions, are presented in Appendix A.
The major dates and events are as follows:
1. Proposal for Feasibility Study:
Submittal to NSF, February 24, 1975
Funding: April 4, 1975
2. Proposal for Testing Program:
* Submittal to NSF, October 23, 1975
Comments from reviewers, February 25, 1976
Reply to reviewer's comments, March 16, 1976
Funding approved and start of project: June 11, 1976
3. Contract dates with subcontractors:
Night-Hawk Security Agency, June 22, 1976
Applied Nucleonics Co., July 7, 1976
McDonnell-Douglas, July 20, 1976, September 13, 1976
Sachs Electric Co., June 18, 1976, August 13, 1976
This proposal was also the final report for the feasibility study.
The Wightman Agency, Insurance, June 23, 1976
Boeing Engineering and Construction, September 29, 1976, October 19, 1976.
4. Site work:
Clean-up of test building, June 25 - June 30:
Measuring dimensional and material properties; planning large amplitude tests, July 1 - September 3:
Small amplitude shaking tests, July 9 - July 12:
Installation and trial of large amplitude shaking equipment, September 6 - October 2:
Large amplitude tests in E-W direction, October 4October 15:
Removal of walls and realignment and repair of shaking equipment, October 16 - October 26:
Large amplitude tests in N-S direction, October 27November 4:
Removal of equipment from the site, November 5 - November 7:
Demolition of the building and removal of debris, November 8November 10:
The various activities which took place are given in greater detail in Appendix B.
2. DESCRIPTION OF TEST STRUCTURE AND TEST EQUIPMENT
2.1 TEST STRUCTURE
2.1.1 General Description of Test Site
The test structure is located in a now (1978) empty tract of land, located in the area bounded by Cass Avenue on the North, Twentieth Street on the East, Carr Street on the South, and Jefferson Avenue on the West. The general area is situated about 20 blocks West and 10 blocks North of the Gateway Arch on the Mississippi Riverfront in St. Louis.
The test structure is part of a building originally designated as Building C-3; its North face is located about 300 ft (91 m) South of Cass Avenue, and its West face is about 800 ft (244 m) East of Jefferson Avenue. (Fig. 29).
Building C-3, like every other apartment building in the Pruitt-Igoe Housing Complex, was eleven stories tall above the ground level and its long dimension was in the EW direction. This building had an overall length of 360 ft (109.7 m), with a narrower 29 ft (8.8 m) wide and 270 ft (82.3 m) long center portion flanked at the East and West ends by a 45 ft x 41 ft (13.7 x 12.5 m) "end tower" (see Fig. 29). Adjacent to Building C3 were Buildings A2 and A4, offset to the South but touching at the SW and the SE corner (Fig. 29).
Building C3 was constructed in the period March 1, 1954 through March 29, 1955.
The sequence of demolition of the group of buildings near C3 is shown in Fig. 30. The original cluster of structures, i.e., A2, C3, A4, is shown in Fig. 30a. During 1972 the narrower center portion of C3 was removed to the ground level by blasting (Fig. 30b), leaving the two end- towers standing by themselves. Great care was taken to properly separate the portions of C3 which were to remain by cutting the connecting beams and slabs with jack-hammer and torch. The East face of the remaining W-tower of C3 (the test structure) is seen in Fig. 16 with the severed beams and slabs. Subsequent inspection showed that the blast did not result in structural damage. Only the connecting block wall was damaged (Fig. 16). During the Spring of 1976, prior to May, the E-tower of C3, as well as all of Buildings A2 and A4, were removed by conventional demolition techniques, using a lead ball suspended from a crane boom, leaving the test structure completely isolated (Fig. 30c). The demolition operations in the adjacent A2 building were performed carefully, resulting in slight damage to the wall of C3, but no structural damage.
2.1.2 The Test Structure
The test building was the W-tower of Building C3, left completely isolated, structurally essentially undamaged and with superficial damage to the outside walls only. Clearly, the test structure was not new, and it had sustained a) a nearby blast strong enough to demolish a separated part of the building and b) several accidental impacts with a heavy lead sphere. Careful visual inspection, as well as the record of elastic dynamic performance, indicated that overall the structure was not damaged to any noticeable degree prior to the sequence of tests performed as part of this project.
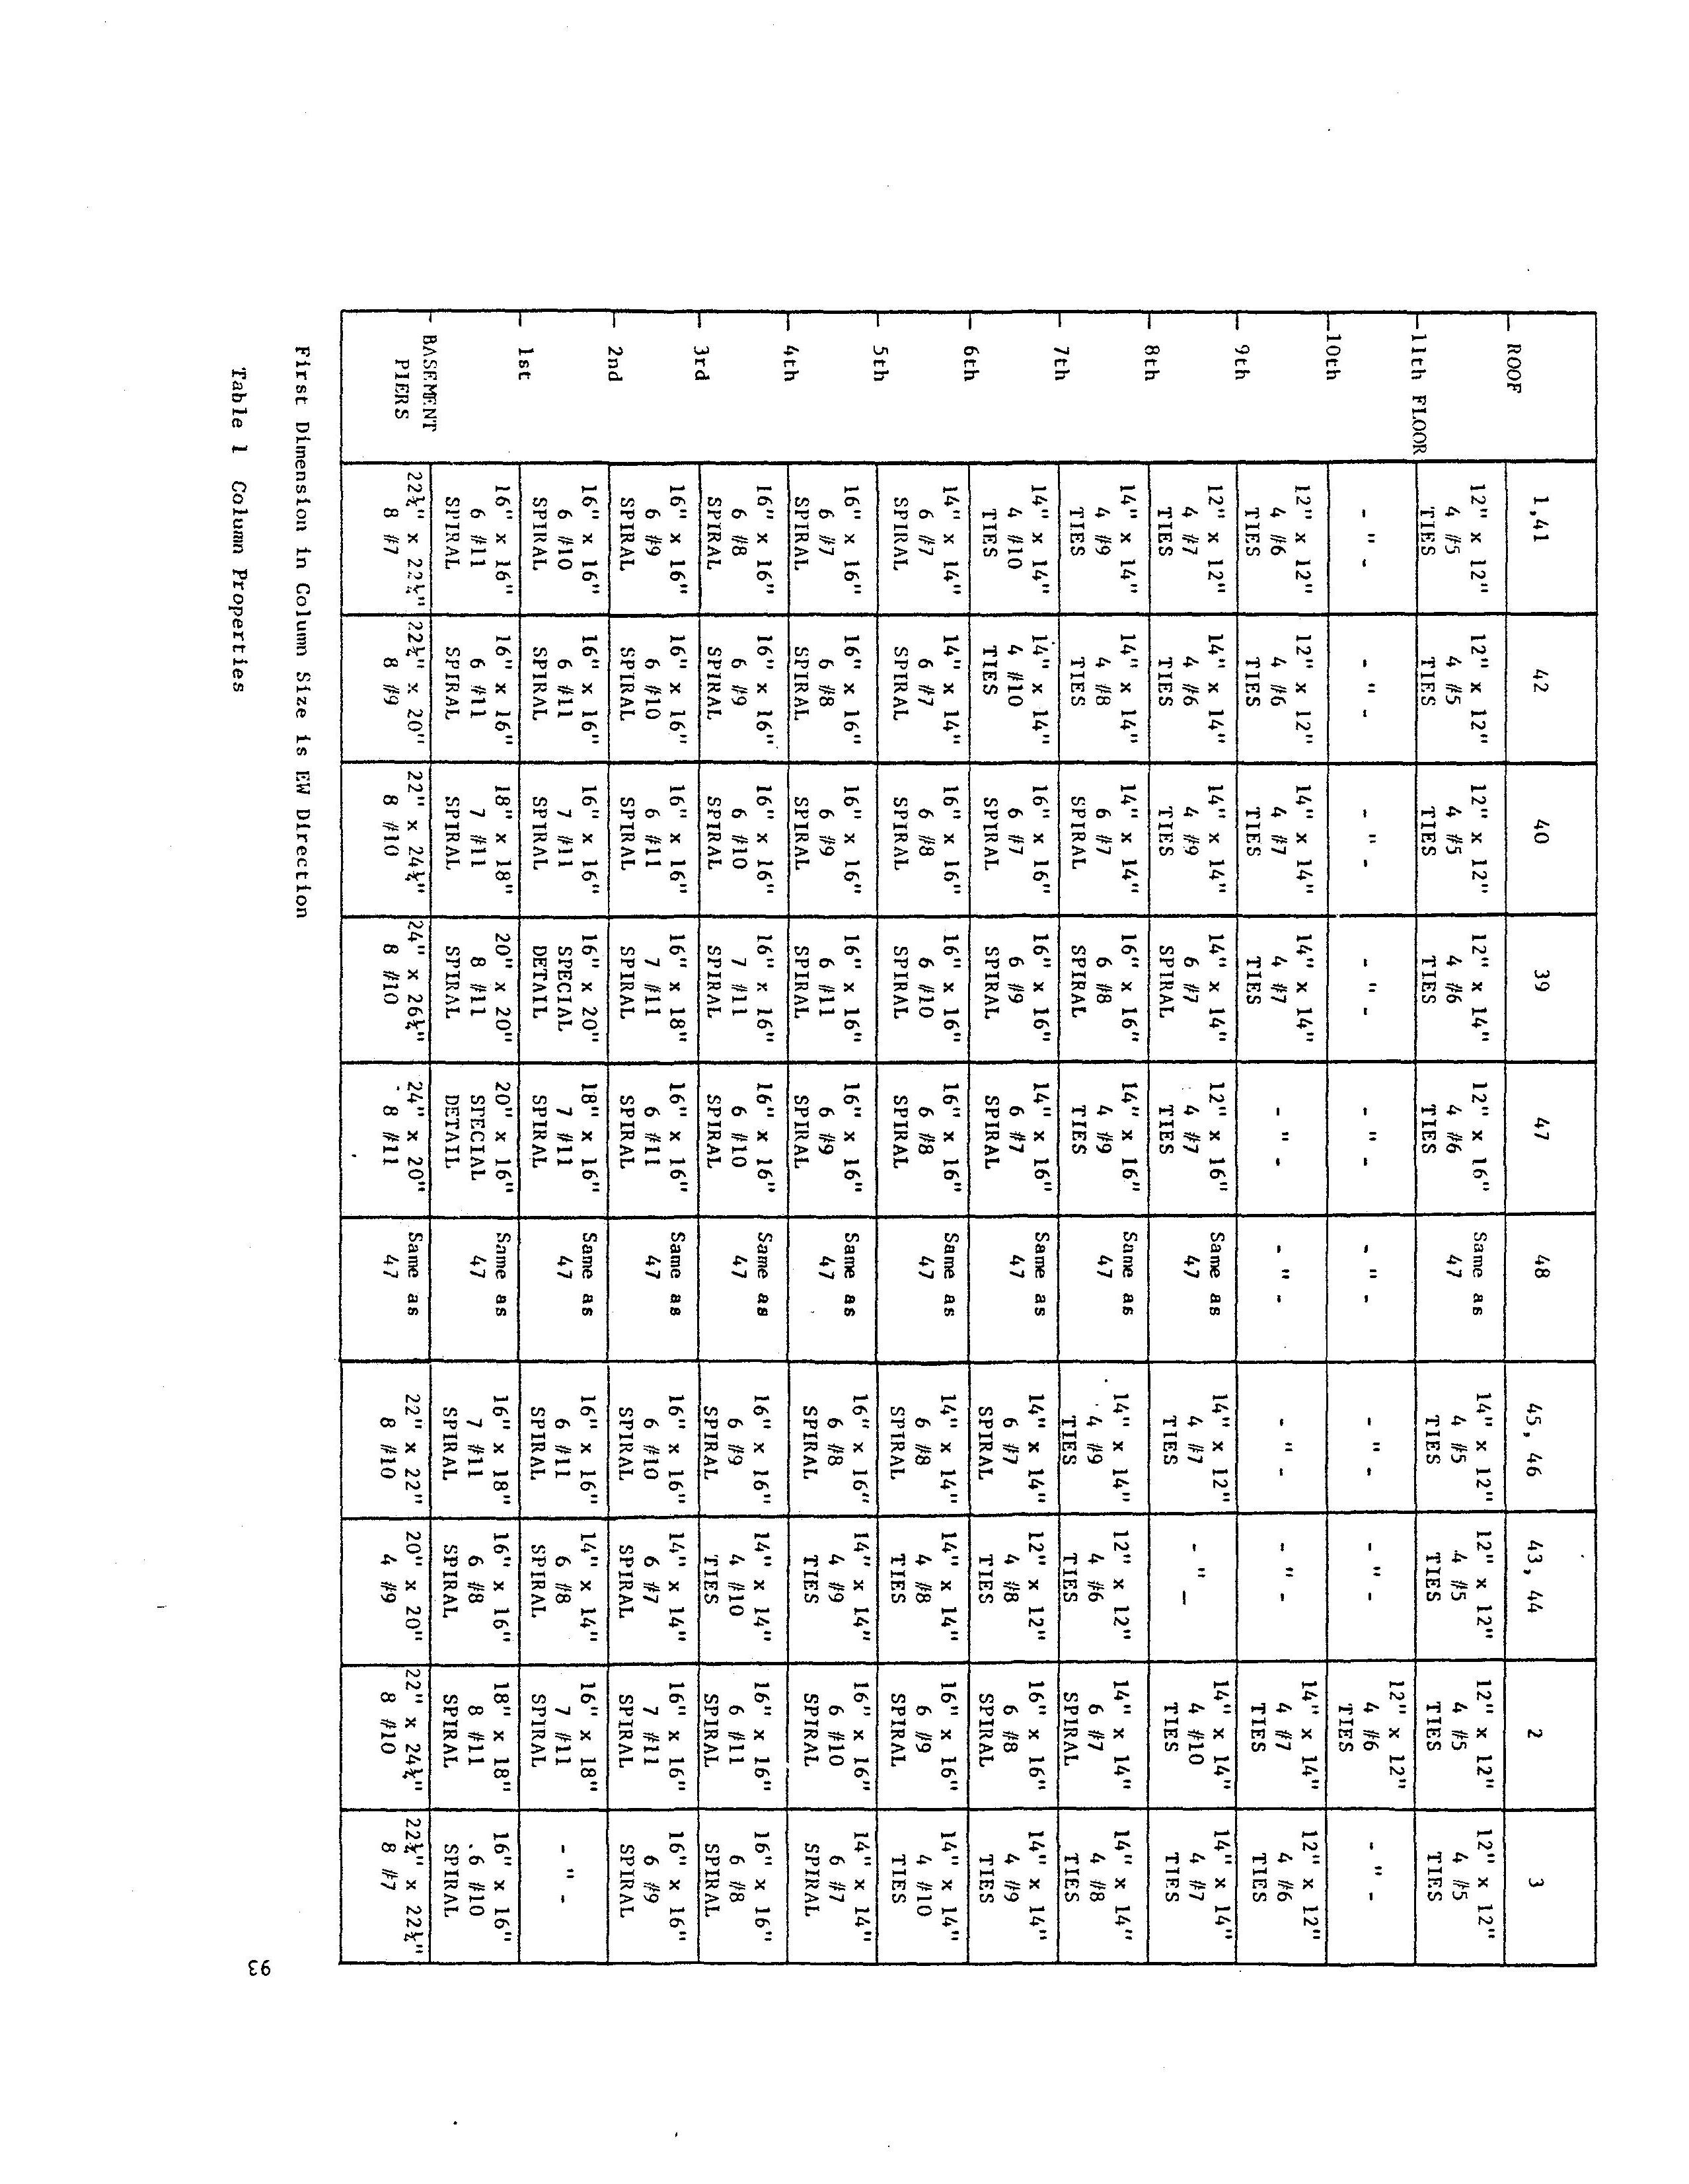
The plan of the test structure was identical on every floor above ground level. A plan view showing the column and beam locations (square symbols are the columns and the solid lines are the beams) is given in Fig. 31. The is rectangular, with nine peripheral columns and four interior ones. The columns are mainly square in cross-section, although some are rectangular. The column dimensions are listed in Table 1. The upper columns are tied columns and the lower columns are spirally reinforced. The spiral reinforcement terminated above and below a joint, leaving each beam-column joint without confining reinforcement. The joint details are illustrated in Fig. 32. Typical column cross-sections and spiral reinforcement data are presented in Fig. 33. Footing, pier and basement column details are given in Fig. * 34. A clear view of a joint is shown in the photograph of Fig. 35, taken on another building during demolition.
Two sets of identifying numbers are given in Fig. 31 for the columns: one set corresponds to the identification in the original plans, and the other set was used during the testing to identify photographs
The locations of the column centers are dimensioned in Fig. 36.
Beams are identified in Fig. 37, and beam dimensions and beam reinforcements are listed in Table 2. Slab designations and dimensions are given in Fig. 38 and Table 3, respectively.
The building elevation in Fig. 39 shows eleven floors of 8.5 ft (2.59 m) height each above ground level, a crawl-space (basement), the piers (i.e., the columns below the crawl-space floor) and the footings. The pier lengths, and thus the footing elevations, are variable, ranging from 1 ft to 7 ft (0.3 to 2.1 m). The footings are individual spread footings for each column, except that columns 45 and 46, and 47 and 48 have a shared pedestal (Fig. 40 and Table 4). Each footing is a two-level pedestal of reinforced concrete.
* ** Figs. 32, 33 and 34 were reproduced from the construction drawings. Care will be taken in the following portions of this report to precisely define a particular column using both sets of identification.
In summary, the test-structure is a rectangular building, approximately 40 ft x 45 ft (12.2 x 13.7 m) in plan and approximately 94 ft (29 m) in height above the ground. The height-to-width ratio is thus about 2:1. The structure has eleven stories of equal height above the ground, and a low crawl-space below the ground. The structure consists of columns, beams, slabs, piers and footings. In addition, the crawl-space periphery consists of a 12 in. (0.30 m) thick reinforced wall which is monolithic with the columns. The slabs are 5 in. (0.127 m) thick except in the West end of the floor (Fig. 38) where there is a 4 in. (0.102 m) slab. The slabs were designed as one-way slabs. The structure was designed according to the 1953 ACI Code for a concrete strength of 3000 psi (20.5 MPa).
Several features of the structure are of relevance to the subsequently observed behavior under shaking:
1) A substantial portion of the mass of the concrete was below ground level (see Table 5 for the concrete volume at each level). The volume of the concrete above the ground level is about 13,700 cu. ft (389 m 3 ) out of 3 a total of 19,100 cu. ft (540 m ); thus about 30% of the mass was below the ground, concentrated mainly in the massive footings and the basement walls. This explains the lack of any significant response to the dynamic excitation in the bottom of the crawl-space and in the ground near the building. In addition, the sensitive seismographs at St. Louis University, about 2 km from the test site, did not pick up any vibrations from the test. It must then be concluded that for all practical purposes the dynamic forces did not penetrate into the soil around the test-structure and that the test frame was essentially fixed at the ground level.
2) The beam-to-column joints were without any confining reinforcement, and this permitted the occurrence of the characteristic joint failure observed especially in the NS shaking where the concrete eventually spalled out completely, leaving only the exposed main reinforcement.
3) The bottom reinforcing bars at the beam ends were generally not anchored into the joint, thus permitting an easy pull-out of the bottom bar under positive joint moment. This resulted in the characteristic hinging observed especially during the EW shaking.
The nominal design strength of the concrete used was 3000 psi (20.7 MFa). The cylinder strengths of the concrete, taken during construction, ranged from 2830 psi (19.5 MFa) to 5130 psi (35.4 MPa) with an average of 3800 psi (26.2 MPa). Core samples taken as part of this research project gave an average of 5,600 psi (38.6 MFa), and results of a Schmidt hammer investigation showed an average of 8020 psi (55.3 MFa). The steel reinforcing had a nominal yield stress of 50 ksi (345 MPa). The actual yield stress of the in-situ reinforcing bars was determined by laboratory samples taken from demolished adjacent buildings, giving a range of yield stress values of 55 to 62.5 ksi (379 to 431 MFa).
The slabs, while designed as one-way slabs, were reinforced enough
* transversely so that they acted essentially as two-way slabs. During the erection of the large amplitude shaker on the eleventh floor portions of the slab in the SE corner were inadvertently loaded to 700 or so psf (34 kPa), i.e., to an order of magnitude larger than the design live load of 70 psf (3.35 kPa) and no undue distress was observed.
The dimensions of the beams and columns were essentially the design values.
The structure was thus for all practical purposes built according to the plans, except that the concrete strength was considerably higher than the design value.
*Further details of the in-situ material strengths and dimensions is presented in a separate report.
The footings sat on silty brown clay which extended some 10 to 20 ft (3 to 6 m) below the footings to broken limestone.
The original structural design considered only gravity loads. Beams were designed with moment coefficients and columns were designed for axial load only.
2.1.3 The Cladding
Prior to testing the whole building was clad in walls from the second story up, leaving the space between the ground (level 1 in Fig. 39) and the second floor (level 2) free of any walls. This fact of an open first floor may have contributed to the experimentally observed spread of the structural damage from level 2 upward. The first structural distress, in the form of cracks at the beam ends, was observed in the EW beams of level 2.
Above level 2 the whole building was encased in a wall extending around the whole periphery. In the NE portion of the E wall, where the test-building joined the previously demolished central portion of C3, the wall consisted of one thickness of 8 in (0.203 m) thick concrete block (Fig. 41). This wall was interrupted by a door between the two central columns, and it was loose on the top on each floor. There were also Some holes in the wall (Fig. 16). This wall was damaged from the blast. The remaining portion of the E wall (SE corner) was in excellent condition and it was not interrupted by windows. This wall, as well as the remaining walls on the S, Wand N periphery, consisted of one thickness of 8 in (0.203 m) concrete block between the columns and one thickness 4 in (0.102m) brick extending beyond the column faces. The brick was supported by a angle at every second floor level, and, in addition, every second brick in every sixth course was turned at right angles to dovetail into the block wall behind it. The quality of workmanship of the wall construction was of a high grade. The Nand S walls were interrupted in each floor by three windows, one extending almost from co1umn-to-column (Fig. 41), and there were four smaller windows in the Wwall. There were almost no window panes left but the window frames were in place.
The stair-well (landings and stairs) was enclosed by concrete block walls which were interrupted by one door on the N and the S wall (Fig. 41).
The walls were 8 in. (0.203 m) blocks on the Nand S side, and 12 in. (0.305 m) blocks on the W side.
The inside of the space was subdivided into rooms by means of plasterboard partitions. Most of these were damaged prior to the dynamic tests, and during the shaking they produced an eerie scraping, groaning noise. These partitions were easily removed manually, first in the top floor to make room for the test equipment, and then later 0.n the other floors.
The structural components and walls were not plastered and there was no insulation. Therefore, it was easy to gain access to the structure in order to make observations and to take measurements.
The stair-system (Figs. 39, 41 and 42) consisted of reinforced concrete stairs between landings. These stairs provided the only access to the top floor where the test equipment was located.
2.2 SMALL AMPLITUDE SHAKING TESTS
The first experiments on the test-structure were a series of smallamplitude shaking tests to determine the dynamic properties of the undamaged structure as it existed at the beginning of the project. These tests were performed under a subcontract by a team from the Applied Nucleonics Company of Los Angeles, California.
The small-amplitude shaking tests were made in the three days from July 10 to July 12, 1976. The details of the test equipment, the test data and the test results are described in the report IlModerate Level Vibration Tests on an Eleven Story Reinforced Concrete Building" prepared by the technical staff of the Applied Nucleonics Company (dated September 1976). Only a brief description of the test apparatus will be given here, and the results are further discussed in a later portion of this report.
Two types of eccentric mass vibrators were used in the experiments: one type, a rotating eccentric arm shaker (Fig. 18, Applied Nucleonics designation MK-14) and a shaker with two rotating baskets (Fig. 19, ANC designation MK-13). The vibrator was attached by bolts to the floor of level 11, near the S.W. corner of the building (Fig. 43). The rotating eccentric arm shaker (MK-14) supplied an omnidirectional horizontal force and the other shaker (MK-13) gave a unidirectional (EW and NS) horizontal force. The vibrators were driven by a motor-control system (2 hp motor), with the control capable of maintaining the vibrator frequency within 0.1% of the de,sired value.
Data were taken over the range of 0 to 18 Hz to determine structural response, to estimate modal damping ratios, and to determine the response shape at resonance. Data were taken and recorded by coupling eight accelerometers (six strain-gage type and two force-balance types) to a Hewlett-Packard Model 74l8A 8-channel strip-chart recorder and a Spectral Dynamics Model SD-330 real time analyzer. The ANC MK-14 omnidirectional eccentric mass shaker was used over the frequency ranges of 0-2 Hz and 0-4 Hz at eccentricities of 140 Kg-m (12,110 lb-in) and 51.0 Kg-m (4,440 lb-in), respectively. The ANC MK-13 unidirectional shaker was used over the frequency ranges of 0-6 Hz, 0-13.5 Hz and 0-18.5 Hz at eccentricities of 27.8 Kg-m (2415 lb-in), 5.81 Kg-m (505 lb-in) and
2.86 Kg-m (249 1b-in), respectively, with both NS and EW forcing applied. Two triaxial arrays of accelerometers (NS, EW, vertical) were located in the NW and the SE corner of the 11££ level, and one biaxial accelerometer (NS, EW) was located near the stairwell on the 5th level for the sweep and damping runs. The biaxial array was kept permanently in the NE corner of the 11th level, while the two triaxial accelerometers were moved about the building during the response mapping operation while the building was kept in resonance. Five points (the four corners and the center of the floor) were mapped on each the 3rd, 5th, 7th, 9th and 11th level, and three points were mapped on the ground outside the building.
A total of 17 frequency sweep tests were recorded and mode shape surveys were made at 8 resonant frequencies. A total of 9 resonant frequencies (EW, NS and torsional first, second and third modes) were identified.
The results of the small-amplitude shaking tests were extremely valuable for the planning of the large amplitude tests. The results and their significance is further discussed in a later portion of this report. While this was not intentional, the small amplitude shaking did induce some non-structural and perhaps slight structural damage, as described later. The testing operation was very efficient, and the shaking and data,-taking was performed without delays or difficulties.
2.3 LARGE AMPLITUDE SHAKING TESTS
2.3.1 General Considerations
The large amplitude shaking tests were the novel feature of this project: never before had a relatively new structure of such a size been subjected to so many cycles of large damage-producing cycles of lateral load. The eventual deflections (approximately -r16 in, or + 0.41 m, or
1.4% of the height of the building above ground level), the dramatic sway, and the spectacular damage, far exceeded the initial expectations
* of the researchers and the experts. In some respects this initial innocence of the eventual behavior was good, because it was difficult enough to persuade the city and the insurance authorities to permit the tests in the first place. As it turned out, fortunately, no one was hurt and complete collapse and loss of equipment was avoided.
The shaking equipment used to produce such dramatic effects was a relatively simple system: a moving mass on rollers was pushed back and forth on the top floor, and the inertial forces from this mass, reacting against the building at resonance, provided the forces which produced the response.
The idea for the unidirectional horizontal moving mass exciter came from a similar but smaller system employed by John A. Blume and Associates in a test on a 4-story full scale concrete frame in Nevada (Refs. 1, 2, 3).
A system of this type was preferred over the more frequently used rotating mass shaker because of the high force and power requirements. Based on preliminary calculations during the proposal development phase, and on more solid estimates based on the results of the small amplitude tests, it was specified that the large amplitude shaker should have the following capabilities: maximum force level of 30 Kip (133.5 KN) over the range of 0.5 to 10 Hz and a maximum piston displacement of +20 in (0.28 m). A careful search of available equipment revealed that the Boeing Company alone had equipment which a) was able to fulfill the requirements, b) was portable, c) was available on short notice and d) was able to be accompanied by experienced engineers and technicians.
* Quoting one reviewer of the proposal " the equipment ••. will not be capable to damage the building."
The heart of the system was a pump-motor assembly, able to deliver 140 gpm hydraulic power, run by two electric motors (200 HP and 125 HP), weighing about 10,000 Ibs (4500 Kg) and taking up a volume of about 12 x 12 ft in area x 6 ft in height (4 x 4 x 2 m). Adequate power having been assured by this system, the rest of the shaking machine could be designed around it.
Other fortuitous facets of the project were that 1) the building was isolated by at least 400 ft (120 m) from the nearest buildings which were, anyway, almost in ruins and which appeared to be only intermittently occupied, and 2) there was adequate room and strength in the structure to accommodate the equipment.
2.3.2 Site Preparation
During July and August 1976, after the Applied Nucleonics small amplitude tests and prior to the installation of the large amplitude shaker in September, the following activities took place: 1) Dr. R. L. Mayes planned the details of the large amplitude tests on the basis of the dynamic properties obtained from the small-amplitude tests; 2) the teams at Boeing and at McDonnell-Douglas designed, purchased, manufactured, assembled and tested out the shaking system (Boeing) and the data taking system (MCDonnell-Douglas), respectively; 3) on the site work continued * on the survey of the dimensional and material properties. Site and building preparation during this period consisted of further clean-up of the building near areas where accelerometers were to be located. Power, water, telephone and toilet service was arranged for and installed. The area was fenced and guard service was instituted (nights and weekends).
* While the results of the survey have some bearing on the dynamic test interpretation, the work is of sufficient independence to be presented in a separate report.
Finally a portion of the roof slab was removed in the SE corner of the building to facilitate installation of the shaking equipment (Fig. 44). Electric power supply was required for the pump-motor assembly (440V 3-phase), for the water pump needed to lift cooling water from a city hydrant to the 11th floor (220V 3-phase), and for the instrumentation (llOV). The switch boxes were located on the ground about 20 ft (6 m) S of the building (Fig. 45). The high-voltage cable ran diagonally from the switch-box to the opening in the S wall of the 11th floor external to the building. The water hose and the cables for the control, communication and low-voltage electricity were run up through the stairwell.
In retrospect it is evident that the pole for the power terminal, the switch boxes, the instrumentation and the fence should all have been further away from the test-building. Power cables and water hoses were severed several times by flying debris, thus causing delay.
2.3.3 The Shaker
The moving mass shaker consisted of a compartmentalized steel box, 8 x 8 ft square and 1'-4" high (2.44 x 2.44 x 0.41 m) with 16 2 x 2 ft (0.61 x 0.61 m) compartments. These compartments could be empty or they could fully or partially be filled with lead ingots. The box was completely filled up with 72 700 or 350 lb lead ingots (320 Kg or 160 Kg), totaling about 58,000 lb (26,300 Kg) of lead. When fully loaded the total mass of steel box and lead was 60,000 lb (27,200 Kg). In the beginning of testing the lead in the box was varied to achieve the desired horizontal force, but as testing continued it was found more convenient to keep the total amount of lead in the box and to vary the force solely through the stroke of the hydraulic piston.
The moving mass box was positioned on a stiffened steel plate; 12 x 12 ft (3.66 x 3.66 m) square which was fastened to the floor-slab of the 11th floor by bolts. This stiffened plate was located in the center of the space between columns 43-44-45-46 (Fig. 31) in the middle of the building (Fig. 46). Hardened 1 in. (25.4 mm) diameter balls, held in place by a perforated 1/4 in. (6.4 mm) thick aluminum plate on a 6 x 6 in (152 x 152 mm) grid were placed between the stiffened steel plate and the bottom of the moving mass box. This provided a relatively frictionless surface. The side of the moving mass was attached to the horizontal piston of the hydraulic activator. The non-moving housing of the actuator was bolted to the floor. The end of the actuator situated away from the moving mass was attached to the building (Fig. 46). The inertia force reaction to the building was made through a steel wideflange column spanning from the roof slab to the slab of the floor, and attached to the concrete slabs by bolts bearing on steel plates on both sides of the slab. The base of the steel column was pinned but the top was welded fixed. Approximately 12 in (305 rom) from the floor a steel stub beam was welded to the column to provide the reaction attachment to the actuator. The actuator was driven by the pump-motor assembly which was also bolted to the floor. A large oil accumulator was also fixed to the floor (Fig. 46).
The initial testing was in an EW direction, and the set-up is as shown in Fig. 46. The final shaking was in the NS direction, and the reaction column and the actuator was rotated 90 0 to bear against the S edge of the slab. The shaker was a closed-loop servo-controlled inertial force generator. It consisted of a 42-inch hydraulic actuator connected to a steel box filled with lead. The box was supported on a steel plate by several hundred I-inch steel ball bearings. This allowed the box and weight to be freely accelerated and input the resultant force into the building back through the actuator which was attached to the building.
The hydraulic supply was a dual motor pump of 325 HP capacity at 3000 PSI and 150 gallons per minute flow. The 10 square inch actuator area allowed a 30,000 pound force to be generated. Hydraulic fluid .to the actuator was controlled with a Moog series 79 3-stage servo valve.
Figure
A sinusoidal signal from a variable frequency function generator was used as a command signal to the controller. The position of the mass was controlled and a force transducer interposed between the actuator rod and the mass was used to determine the required test levels.
The force, position, and command signals were displayed on a strip chart recorder for use in adjusting and monitoring the test parameters. Force, position, and control error were put into a detector device to shut down the hydraulic pump in the event that any of the signals went over predetermined safe levels.
The test levels were obtained by manually adjusting the signal generator and visually observing the force level displayed on the recorder. Increased amplitude or increased frequency caused increased force.
The empty steel box, the steel balls and the stiffened panel are shown in the photo taken during a mock-up exercise in Boeing's laboratory in Seattle (Fig. 48). The whole set-up, including the box, the plate, the actuator, the reaction column, the accumulator and the pump motor assembly are shown in Fig. 49 (mock-up photo). The details of the connection between the reaction column and the actuator are seen in Fig. 50.
The fully loaded box is shown in Fig. 51, and the piston, with its connection to the moving box, is seen in Fig. 52. Coupled to the piston is the force transducer, and above the piston is the LVDT controlling piston displacement. The control panel in the instrument van is seen in Fig. 53, while Figs. 54 and 55 show, respectively, the cribbing on the 10th floor and an overall view of the test site.
2.3.4 Instrumentation and Data Acquisition
The instrumentation and data acquisition system was provided under subcontract by the MCDonnell-Douglas Company of St. Louis. The system was designed to measure and record accelerations in various parts of the building during the shaking tests. Details of the tests are described later in this report, but they will be also discussed here in sufficient detail to explain the functioning of the data system.
Two types of tests were performed: (1) damping tests to determine resonant frequencies and damping values of modes of interest at various input force levels, and (2) mode-shape tests to determine the mode shapes at various resonant frequencies.
During the damping tests the approximate resonant frequency at a required force level was determined by a slow continuous sweep beginning at approximately one Hz above the estimated resonant frequency, and sweeping down to below the actual resonant frequency.
During this sweep, two recordings were made: First, the signal of the reference accelerometer on the eleventh floor (Fig. 56 and Table 6) was analyzed by a spectrum analyzer. The peak of the resulting curve was used to identify the resonant frequency. Second, the force signal from the moving-mass vibrator was plotted against the signal from the reference accelerometer on a two-channel oscilloscope. Theoretically for an elastic system at resonance the two signals are 90 out-of-phase and the resulting plot traces a perfect circle on the oscilloscope screen. Both the spectrum analyzer and the oscilloscope were used to identify the resonant frequency during the sweep.
Once the resonant frequency was analyzed, a stepped sweep was performed at appropriate frequency intervals to determine the damping and resonant frequency at that particular force input level. At each frequency step the structure was vibrated until steady-state was achieved and the data was recorded.
Mode shape tests at resonance were made to record the detailed response of the building. Acceleration data were obtained from each of 25 locations in turn (see Fig. 56) from levels 12, 10, 8, 6, 4 and 2.
After it was discovered that the response of the basement floor was below the sensitivity of the available accelerometers, no mode-shape measurements were made on level 1. Mode shape data were taken on level 3 during some of the NS mode shape tests (See Fig. 57 for the identification of the story levels in the structure).
The primary source of data from the instrumentation was produced by the accelerometers. Three accelerometers each were assembled into a triaxial mount (Fig. 58). All of the accelerometers used on the test structure were strain-gage type accelerometers. Servo-accelerometers were used on the ground stations outside of the building. The accelerations on the ground were, however, too weak tq give meaningful data within the sensitivity range of these instruments and thus few recordings of ground acceleration were made. The strain-gage type accelerometers on the teststructure were sensitized in the range of 1.0 g. These instruments were calibrated using a 30/60 degree fixture in a static calibration at the start of testing and at intervals during the tests.
The accelerometers were used to drive constant band-width voltage controlled oscillators (VeO's). Six of these veo's each were combined into one multiplex which thus served six accelerometers, i.e., two floors (Fig. 59). The signals from the mUltiplexes were transmitted by wires to the instrumentation trailer where they were recorded on a standard 14 track instrumentation recorder. The four multiplexes were placed on the following locations: levels 11 (serving the two accelerometers on levels 12 and 10), 7 (serving 8 and 6), 3 (serving 4 and 2) and 1 (serving the ground stations and level 1). The 14 tracks on the recorder were assigned as follows: 4 tracks for the acceleration from the four multiplexes, 1 track for the reference accelerometer, 1 track for the force level, 1 track for the IRIG (Inter-Range Instrumentation Group) time code, 1 track. for location identification, 1 track for frequency identification, 1 track for voice and 2 tracks for control.
On-site data collection consisted of the following items:
1) The accelerations from the multiplexes recorded on tape (as described above);
2) twelve channels of discriminators to permit real time observation of any two multiplex data (six accelerations), the load and the reference acceleration on an 8 channel strip chart recorder.
3) frequency of the moving mass actuator and real time strip chart records of the displacement and the force produced by the moving mass (Fig. 60)
4) two-axis oscilloscope display
5) spectrum analyzer display (Fig. 61).
2.4 DISCUSSION
At this place in the report it is instructive to provide a brief critique of the activities performed in this project. In retrospect it must be clearly stated that, given the constraints that existed on the site, the operation was very successful. Furthermore, the delays were minimal, the weather was mostly favorable and we were spared accidents which could have harmed people. The testing project was not without dangers from the political side (insurance, legal, crime, and labor problems), from injuries due to flying debris and the possibility of people falling off the building, and from the total collapse of the structure which could have resulted in the loss of some or all of the equipment. For all the experience which any of the participants had previously, the whole large-amplitude shaking could well have not worked at all.
The main constraint was lack of time on the site during the preliminary planning. A one-month lead-time prior to the small amplitude tests, and a period of three months between the completion of these tests and the start of installation of the large amplitude shaking equipment would have been very desirable. The various components of the large amplitude shaking system could then have been more thoroughly tested out in the laboratory and the delays due to the inappropriate packing of the hydraulic actuator could have been avoided. As it turned out, the problems with the shaking equipment were expeditiously. solved in the field.
A more serious problem was with the data taken in the field. We should have installed an array of accelerometers on the ground near the building. This was not done because MCDonnell-Douglas could not furnish enough accelerometers of sufficient sensitivity to do the job.
this is only one side of the story. For a proper pick-up of the ground accelerations it would have been necessary to prepare each position beforehand, excavating the overlaying debris to undisturbed soil, and rendering the point waterproof. For this there was neither time or space available. Due to inadequate time, planning, space and equipment then valuable data was not recovered.
Visual and photographic data taking was not nearly as complete as it should have been, and so the sequence of damage at critical locations was not systematically recorded. The reasons for this were lack of prior experience regarding what should be expected, lack of time, and the danger to an observer in the building. Particularly valuable would have been close-up moving pictures of critical joints as they deteriorated under large amplitude shaking. Perhaps one or two remotely operated. cameras should have been installed.
Whatever the reasons, the visual recording of the damage should have received a great deal of attention during the planning stage, and during critical stages of the testing remote photographic recording close up to several key locations should have been made.
All of this, however, is hind-sight, useful for planning the next tests. In further parts of this report we will concentrate on presenting the data and the results we did manage to obtain.
3. DISCUSSION OF DAMAGE
3.1 GENERAL COMMENTS
The novel feature of this project is in the fact that an actual full-scale, relatively new and originally structurally sound reinforced concrete frame building, which was designed and built according to the current state of the art in the 1950's, was subjected to many repetitive damage-producing cycles of lateral load. The significant data from the tests are the accelerations and displacements measured in various parts of the structure and the dynamic properties which were computed from them. These results are treated in a later portion of this report. This part of the report will present a qualitative description of the observed damage during the progress of the test program.
Damage observation was made continuously, as far as that was possible, during the whole testing period. Unfortunately the observations were not made as thoroughly as they should have been made because (1) we did not know, prior.to the tests, just what to expect, (2) we did not know for sure until the tests commenced whether or not the equipment could indeed induce large amplitude deformations, (3) time for proper prior preparations was inadequate, and (4) it was not safe to be in the building to make close observations during crucial points of the testing program. The following discussion is based on observed damage after the completion of major phases of the testing.
3.2 STATUS BEFORE LARGE AMPLITUDE TESTS
At the beginning of October, prior to the commencement of the large amplitude shaking the building was essentially undamaged from the structural point of view (Fig. 15). There were a few hairline cracks in the
* beams and the columns of the top floor (at level 12) which were induced by the small amplitude shaking performed in July by the Applied Nucleonics Company (Fig. 62), and there were some diagonal cracks in the EW filler walls around the stairwell (Fig. 63) on the 4th, 5th and 11th story. The outside E-wall (Fig. 16) was already damaged by the blast when the center portion of the building was removed in 1972, and the small amplitude shaking loosened some of the blocks on the top layers further. The stairs were completely whole, and the outside brick facade was essentially intact except for a small part of the SW corner (Fig. 12) which was inadvertently hit by a headache ball when the adjacent building was demolished. The only modification to the structure consisted in removing a portion of the roof slab at the end of August to facilitate placing the equipment (Fig. 64).
3.3 DAMAGE AFTER MODERATE E-W SHAKING
After the fully clad structure was subjected to a series of test-runs (October 8, Test Run l2E-D) with 5 and 10 Kip force levels damage to the slab and structural frame was slight, consisting mainly of hairline cracks
* at the column tops (notably in Col. 33, 1st story) and at the ends of some EW beams (notably in Beams B4 at levels 2 and 3). Some blocks fell off the E block wall in the 2nd story, and cracks developed all across the joints between the stairs and the stairway landing at the 1st story and the 1 level landings. Those cracks became quite large later and subsequent photos will show them in a more developed stage. The most interesting feature of these moderate level shake tests was the behavior of the E\.] block infill wall around the stairway. These wall panels moved with the frame above level 4, but in stories 2 and 3 the panels remained essentially stationary while the frame moved back and forth, leaving a gap of up to lis inch between wall and column at maximum amplitude, and knocking against the wall on the opposite side (Fig. 65). There was noise due to friction as the beams rubbed against the top face of these walls.
* See Fig. 57 for the convention used to define vertical locations in the building.
** See Fig. 31 for column locations. Column 33 is No. 48 in the original plans.
3.4 DAMAGE AFTER COMPLETION OF E-W TESTS
The major amount of testing in the EW direction on the fully clad structure was performed during the period October 9 through October 13. Some 10K force-level tests were performed on October 15, and finally the most severe EW shaking (cca 25 kip force level; 8 inch sway on top, Test No. 24E-D) took place in the evening of October 15 just before this phase of testing was discontinued.
All of the damage to the structure above level 9 was restricted to hairline cracks at some column tops and beam ends, and no new cracks were discovered between levels 6 and 9. It can be stated that no substantial structural damage was discernible above level 6. Major structural damage occurred at level 2, with damage dimishing with height. All of the EW beams on levels 2 and 3 had cracks at their ends, and most of the beams on levels 4 and 5 had hairline cracks at their ends. Typically the most severe cracking and spalling took place on level 2, and the following photos illustrate this:
Typical interior joint X-cracks are seen in Fig. 66, which show the * ** joint of Col. 36 at the top of story 1. The top of Col. 11 (SW corner) in story 2 is shown in Fig. 67. This same column, at one level below, exhibits a crack through the beam and into part of the column (Fig. 68).
A typical level 2 beam end (SE corner) shown in Fig. 69 illustrates the
* Col. 45 in original plans. (Fig. 31)
** Col. 1 in original plans. (Fig. 31) crack at the column face. This crack opened and closed during the motion of the building. The most severe column damage occurred at the top of * column 37 in the 2nd story (Fig. 70). The most severe beam cracking occurred at the E end of beams B4 in level 2, and Figs. 71 through 73 illustrate the progression of damage, including the fracture of the reinforcing steel. During the final severe EW cycling it appeared from the observed motion of the structure that the EW beams connected to the exterior columns on levels 2 and 3 acted essentially as hinges when the bottom beam steel was in tension (Fig. 74). The slab on levels 2 and 3 cracked through from N to S across the building.
The stairway up to the fourth level was severely cracked at each joint between the stairs and the landing. This joint heaved up and down during each cycle of loading. The lowest joint (between levels land 2) is shown during the early tests (cca Oct. 9) and after the EW tests in Figs 75 through 77, respectively. Top and bottom stairway joints are shown in Figs. 78 and 79.
A considerable portion of the E block wall fell out during the tests (Fig. 80; compare with Fig. 16 to see the extent of wall damage), and some of the outside brick walls fell off also (Figs. 81 and 82; compare with Fig. 15 to see the damage on the N brick wall). A portion of the lower part of the S wall, shown in Fig. 83, demonstrates the horizontal fracture lines at the top of the window. The adjacent parts of the wall rubbed against each other during load cycling.
On levels 2 and 3 at the end of the EW tests the EW beam ends were cracked through, some columns were cracked and one was moderately damaged, the slab was cracked across the building, the stairway was behaving as a mechanism with hinges at the stair-landing joints, the E block wall had fallen out, the EW brick faces were severely damaged or had fallen out, and the EW block infill walls next to the stairway had lost their capacity to act as infill walls. The NS beams and the N wall were essentially undamaged. Damage to columns, beams, stairs and walls diminished progressively from the third to the fifth story, with the structure-stair-wall system intact and acting as a unit above level 6. Below that level the walls and the stairway system were broken up and the beams were hinging. As testing continued damage seemed to be confined to the lower three to four floors, the top riding along as the softening and damaged lower floors swayed back and forth. Little damage was observed on the eleventh floor where the heavy moving machinery subjected the frame and the slab to continued severe impacts. It appears that once softening started on level 2 the damage became isolated on the lower part of the building.
* Col. 44 in original plans (Fig. 31).
3.5 DAMAGE DURING THE N-S TESTS
During the period between October 15 and October 27 the cladding was removed from all but the upper two floors of the building (Fig. 28) and the shaking apparatus on the 11th floor was rotated 90 degrees to produce forces in the NS direction. The removal of all of the brick and block cladding did not result in any additional damage to the structure.
The NS testing commenced on October 27 and continued through November 4 when the experiment was terminated. During October 27, 28, 29 and 30 the tests were performed at mainly low force levels (5 to 10 Kips, Tests up to l6N-D) and only one 15 Kip level test of the second mode was perfnrmpn The new damage due to this shaking was slight, consisting of the development of flexural cracks between the column faces and the NS beam ends.
The motion of the building during the first mode NS tests consisted of
NS translation of the whole building and of torsion centered toward the E of the building. This torsional motion at the first translational mode tended to wrack the W face considerably more than the E face, and damage was mainly confined to the beams and columns on the W face.
The'shaking tests on November 1 through November 4 consisted of the larger input-force level tests (Tests l7N-D to 41N-D), and severe damage was inflicted on the W portion of the structure. This damage occurred in essentially two ways: (1) with continued shaking more and more joints * ** in the NW (Col. 9) and SW (Col. 11) column failed, and (2) columns 37 *** and 38 crushed in compression. There was also damage in the joints of + the center columns on the W-£ace (Col. 13). A typical damaged joint of this center column tier (Col. 13, level 5) is shown in Figs. 84 and 85, where the damage prior to Test No. 25N-D (Fig. 84) consists of spalling and after Test No. 3lN-D part of the lower beam reinforcing bar is exposed.
The extent of damage to this jOint did not increase with later tests.
The other joints of this column experienced similar damage, with all joints losing some concrete from level 2 through level 9. The corner columns (Cols. 9 and 11) were damaged rather more severely, all joints from level 2 through level 9 losing almost all the concrete from the joints, leaving the beam flexural reinforcing fully exposed.
The photo in Fig. 86 shows a portion of the NW corner, illustrating the severe damage at the end of the tests at the joint. All columns appeared to be a series of hinged elements between stories, with the reinforcing holding them in place. Progression of damage from Test No. 2IN-D
* Col. 41 in original plans (Fig. 31)
** Col. 1 in original plans (Fig. 31)
*** Col's. 44 and 43 in original plans (Fig. 31)
+ Col. 42 in original plans (Fig. 31) through Test No. 4lN-D for one typical joint (Col. 9, level 4) is shown in the sequence of pictures given in Figs. 87 through 95. All but one of these figures show the outside of this joint, and Fig. 94 shows the inside of the corner, from below.
* The deterioration of the interior column (Col. 38 ,4th story) is seen in Figs. 96 (after Test No. 28N-D) and 97 after all the tests, and a close-up of the crushing failure is seen in Fig. 98.
During the last test on the evening of November 4 (Test 4lN-D) the following damage was evident: All the joints below the 10th level in the two W corner columns (C 9 and C 11) had lost almost all of the concrete from the joints (see Fig. 99), and the column in the NW corner of the 6th story was visibily pushed out (Fig. 100). The joints in the center columns of the W-face (Col. 10) were also damaged up to level 9, but not as severe** ly. Interior columns 37 and 38 were severely crushed on the 2nd, 3rd and 4th floor, with Col. 38 completely crushed in the 4th floor. The other columns showed little additional damage, except that during the last run X cracks began to develop in the joints of level 6 in the two E central *** columns (Cols. 33 and 34)
During the last test there was very large deformation of the top of the W-face inch), the W-face appeared to be just flopping back and forth, there was a lot of noise (groaning, cracking) and damage progressed apparently toward the columns which appeared to be holding up the structure. For the sake of safety and equipment recovery it was decided to stop the testing. When all motion stopped the structure was to all appearances
* Col. 43 in the original plans (Fig. 31)
** Col. 44 in the original plans (Fig. 31)
*** Col's. 48 and 47 in the original plans (Fig. 31) straight. No additional structural or cladding damage occurred in the enclosed top two stories.
4. DESCRIPTION OF TESTS PERFORMED
4.1 INTRODUCTION
The dynamic testing of the building consisted of both small and large amplitude tests. The small amplitude tests performed by ANC with the equipment described in Chapter 2 had the following objectives: a) To determine the dynamic characteristics of the structure by methods that have been extensively used over the past decade. b) To compare the results obtained in a) with those obtained from the large amplitude forced vibration tests. c) To use the information obtained in a) to plan the large amplitude forced vibration tests.
The large amplitude tests performed with the equipment described in Chapter 2 had two main objectives: a) To determine changes in-mode shapes, frequencies, and damping values as the force level of excitation increased. b) To determine the resistance capability of the nonseismically designed building as the force level of excitation increased.
4.2 SMALL AMPLITUDE TESTS
4.2.1 Description of the Tests
The eccentric mass vibrators used in these tests were located in the sw corner of the 11th floor (Fig. 43). All tests were performed with the cladding in place. Two different types of tests were performed: The first, a frequency sweep test, was performed to determine resonant frequencies and damping values. The second, a response shape test was performed to determine the response of the building at various resonant frequencies.
For the frequency sweep tests two triaxial arrays and one biaxial array of accelerometers were located within the building (as shown in Table 7). Locations for these arrays were chosen so that anticipated structural response would be adequate to identify resonant frequencies and to identify the type of building response, that is translation vs. torsion.
For a given test number and run number, with the shaker set to a fixed eccentricity, identification of resonant frequencies and damping values took place in two phases over the frequency range of interest.
Phase one consisted of a slow frequency sweep up to the maximum established by safe operating procedures during which system gains were adjusted and the frequency content of the response was observed using a spectrum analyzer. The principal purpose of this slow sweep was to determine the frequency ranges over which detailed data would be taken.
Phase two of a given test number and run number consisted of an extremely slow frequency sweep to establish an upper bound during which bursts of data were taken at small enough incremental increases in frequency to allow the sufficient resolution of resonant peaks and to adequately define modal damping ratios and phase relationships. This detailed data was then returned to Los Angeles, digitized, and digital methods applied to define resonant frequencies and damping values in finer than available using the techniques of phase one.
Response of the building in each of the first eight modes was mapped. Two triaxial arrays and one biaxial array of accelerometers were assembled and system gains adjusted so that each instrument indicated the same signal amplitude in a 1.0 g field. The biaxial set was then permanently located at node four (refer to Fig. 101) to serve as reference. The structure was then brought to resonance using either the MK-13 or MK-14 vibrator and held at constant frequency while bursts of data were taken at each of the 33 nodes indicated on Fig. 101. In this way each of the records from the-roving triaxial accelerometer sets could be compared with the reference set to determine phase relationship. Magnitude of the signal was fixed by instrument calibration.
4.2.2 Tests Performed
A summary of all frequency sweep tests perform2d and their respective results is presented in Table 8. Results of some of the frequency sweep tests are presented in Figures 102-104. The remainder of the plots at the frequency sweep tests can be found in reference 4.
As seen shown in Table 8 frequency sweeps were performed at four different force levels in the lowest two translational modes. It should be noted that these force levels were considerably lower than those used in the large amplitude tests. Response shape tests were performed for eight of the nine resonant frequencies given in Table 8. A response shape was not determined for the third torsional mode. Details of the response shapes are presented in Ref. 4. The EW first and second modes are presented in Figs. 105 and 106, respectively, and a comparison with those obtained in the large amplitude tests is presented in Figs. 107 and 108.
4.3 LARGE AMPLITUDE TESTS
4.3.1 Description of the Tests
The large amplitude tests were performed with the moving mass vibrator described in Ch. 2 and mounted on the eleventh floor.
Large amplitude testing was performed in the direction with the external cladding (infill walls) in place and in the N-S direction with the external cladding removed. Two different types of tests were performed. Damping tests were performed to determine resonant frequencies and damping values of modes of interest at various input force levels. Mode shape tests were performed to determine the mode shapes at various resonant frequencies.
a) Damping Tests
The damping tests were performed such that the force level during a given test varied approximately as a function of the frequency squared. The theoretical force level generated by the moving mass vibrator is given by: where M is the mass of the bucket weight, ttl is the frequency of excitation, and X is the single amplitude of motion of the moving mass. The purpose of using this forcing function was to enable the data, whenever possible, to be analyzed by techniques normally used for eccentric mass forced vibration tests. The required input force level, F , from the r moving mass vibrator was determined from the relationship where ttl is the resonant frequency of interest.
The approximate resonant frequency at a required force level was determined by a slow continuous sweep beginning at approximately 1.0 cps. above the estimated resonant frequency and sweeping down below the actual resonant frequency.
During this sweep, two recordings were made. First, the signal of the reference accelerometer on the eleventh floor was analyzed by a spectrum analyzer. The peak of the resulting curve was used to identify the resonant frequency. Second, the force signal from the moving mass vibrator was plotted against the signal from the reference accelerometer on a two channel oscilloscope. Theoretically for an elastic system at resonance the two signals are 90 0 out of phase and the resulting plot traces a circle on the oscilloscope. Both methods were used to identify the resonant frequency during the sweep.
In addition to identifying the resonant frequency, the continuous sweep enabled the structure in most cases to achieve a stable structural condition at a particular force. level. This was helpful, because as the input force level increased in increments of 5,000 lbs. the structural system changed. An example of this was hinging that occurred in the beams and stairwell of the lower levels. At higher force levels in the first modes, the continuous sweep was not performed because the structural changes were more significant and consequently, data was required as these changes occurred.
Once the resonant frequency was identified, a step-wise sweep was performed at appropriate frequency intervals to determine the damping and resonant frequency at the particular input force level. At each frequency step the structure was vibrated until steady state was achieved and the data was recorded. In all except two tests, the step-wise sweep was performed by sweeping from a frequency above the resonant frequency and sweeping down below the resonant frequency.
At various stages throughout the large amplitude test program a standard damping test was performed. The standard damping test consisted of the damping test described above at a nominal input force level of 5,000 lbs. The objective of the standard damping test was twofold.
First, it provided the means of comparing changes that occurred in the damping and resonant frequencies of the building during various stages of the test sequence. Second, it provided the means of determining whether or not changes that occurred in the damping and resonant frequencies at larger input force levels remained the same at lower force levels.
The location of accelerometers during the damping tests is given in Table 6. During all EW tests and up to and including Test No. 4N-SD a triaxial set of accelerometers was located at the 12th, 10th, 8th, 6th, 4th and 2nd floor levels. For tests 9N-SD to 41N-D a set of biaxial accelerometers in the NS and EW direction were located at the 12th, 10th, 8th, 6th, 4th and 2nd levels. Uniaxial accelerometers in the NS direction were located at the same levels. During all tests a reference accelerometer was located on the 10th floor level in the NE corner.
During the EW tests it was oriented in the EW direction and during the NS tests it was oriented in the NS direction.
b) Mode Shape Tests
Mode shape tests were performed at various phases of the test program to determine in detail the response of the building at resonance. Prior to each mode shape test a continuous frequency sweep, described above, was performed to determine the resonant frequency. The building was then vibrated at the resonant frequency and data was recorded. The response of the structure was measured at the 12th, 10th, 8th, 6th, 4th, 2nd and basement levels. At each level the response at 25 grid points shown in Fig. 56 was recorded. At each point a triaxial accelerometer was used enabling the three-dimensional response to be obtained.
4.3.2 TESTS
The sequence of tests performed in the EW direction with the cladding in place is listed in Table 9. Standard damping tests were performed throughout the test sequence to provide a method of comparing changes that occurred in the building and to determine whether or not the changes that occurred at larger input force levels remained the same at lower force levels. The damping tests in both the NS and EW directions were planned so that the nominal force level at resonance increased in increments at 5,000 lbf. Mode shape tests were performed in both the EW and NS directions both before and after the large amplitude tests.
After the first series of standard damping tests in the EW direction (Test Nos. lE-SD to 3E-SD) the mass of the bucket of the moving mass vibrator was increased from 5,800 lbs. to 19,000 lbs. to improve the performance of the vibrator. Following this increase in bucket weight, a first mode frequency sweep was performed at a force level of 10,QOO lbs. No damping data was recorded during this sweep although it was observed from the oscilloscope that the resonant frequency dropped from 1.36 cps. to approximately 1.15 cps. Following this 10,000 lb. sweep test, two standard damping tests were repeated (Test Nos. SE and 6E-SD). After these two tests, the bucket weight was increased to 57,700 lbs. again to increase the performance at the moving mass vibrator. From this point on the bucket weight remained at 57,700 lbs.
The sequence of tests performed in the N-S direction with the cladding removed is listed in Table 10. Also listed in the table are the resonant frequencies and damping values obtained from the frequency response curves. Damping values from the time domain analysis will be obtained in the next phase of analysis of test results.
In addition to the tabulated values of resonant frequencies and damping values mode shapes measured during the tests are presented in Figures 109 to 114 and a comparison of the El'] mode shapes with those obtained from the small amplitude tests are presented in Figures 107 and 108. Force levels generated in the larger amplitude first mode tests in both the EW and NS directions are obtained by the method described in Chapter 5 and presented in Table 11.
4.4 OF THE VIBRATION GENERATOR DURING THE TESTS.
A detailed description of the specifications of the vibration generator are given in Section 2.3.3. The purpose of this section is to describe our experience on the performance of the vibration generator during the tests. The experience and hind-sight that follows will be useful for any future tests of this kind.
During the initial design of the vibration generator the objective was to design a machine capable of providing a sinusoidal forcing function with force magnitudes varying between 2,500 lbf (ll,120N) and 30,000 lbf (133,500N) over a frequency range at 0.4 Hz to 5 Hz. The theoretical force generated by the moving mass vibrator is given by
2
F = M (J) X Sin wt where M is the mass of the bucket and weights, w is the excitation frequency and X is the amplitude of motion of the moving mass or the stroke of the actuator. The initial design was such that the mass could vary between 5,000 lb (2300 Kg) and 58,000 lb (26,000 Kg) and the stroke of the actuator was + 20 in. (: 500 rnrn). With these ranges of the two variables it was possible to obtain the desired force levels over the required frequency range with the minimum stroke of the actuator being 1 in. (25 mm). The I in. minimum was assumed in the design to be a reasonable value in view of the unforseen effects of friction forces.
Control of the actuator was governed by a + 20 in. Linear Voltage Displacement Transducer (LVDT) and the provision of adequate stiffness for this proved to be difficult. This caused problems with respect to the shape of the forcing function when larger strokes of the actuator were required. We had assumed that the performance of the vibration generator would have been at its best when a reasonable stroke (greater than 1 in.) of the actuator was used to obtain the desired force level. This assumption proved to be incorrect. The first three tests lE-SD to 3E-SD were performed with a bucket mass of 5,800 lbs. (2600 Kg) and the shape of the forcing function is shown in Fig. 115 (a). In test 4E-S the moving mass was increased to 19,000 lbs. (8600 Kg) and the shape of the forcing function improved as seen in Fig. lIS (b). In the next test SE-SD the moving mass was increased to its maximum value of 57,700 lbs (26,200 Kg). and the shape of the forcing function dramatically improved as seen in Fig. l15(c). This series of tests indicated that the vibration generator was capable of providing the desired force level at small actuator strokes and as a result the moving mass remained at its maximum value of 57,700 lbs. throughout the remainder of the tests. The shape of the forcing function for higher frequency tests (2nd mode) was very close to a sinusoid as seen in Fig. 116 a and b.
For the higher force level tests at the lower frequencies the stroke of the actuator had to increase above 2 in. (76 rom) to obtain the required force levels. During these tests the inadequate lateral stiffness of the LVDT caused a very slight flat peak on the displacement trace of the LVDT. This in turn resulted in a very sharp drop in the force causing a deviation from the desired sinusoidal forcing function. This is graphically illustrated in Fig. 117 a, band c where the force of the actuator and the acceleration measured at the 10th floor are given for three tests. The three tests show the effect at increasing actuator stroke on the forcing function. Figure l17a is for a single amplitude stroke of approximately 6 in. (152 mm), while Figs. 117 band c are for single amplitUde strokes of 15 in. (380 mm) and 17 in. (430 mm) respectively.
Two other problems, unrelated to the mechanical performance of the vibration generator, caused delays in the test program. The first was the connection between the actuator and the bucket carrying the weights. This suffered a fatigue failure in the bolts twice during the test program. It is suggested that in future tests this be well overdesigned to avoid the problem. The second problem was one of sloshing. During the large amplitude low frequency tests sloshing of the stored oil that drove the hydraulic actuator caused a drop in hydraulic pressure. This shut the system down. The problem was overcome by topping up the storage tank and could have been avoided if a good baffle system had been used.
Adknowledging the problems discussed above we believe that the overall performance of the vibration generator was good especially in view of the fact that this was the first time a test of this order and magnitude had been performed.
4.5 DATA COLLECTED, STORED AND DIGITIZED
During all stages of testing a considerable amount of data was collected and stored with the instrumentation described in Sec. 2.3.4. Storing and analyzing the data proved to be a major effort of data management and without the use of the computer this task would have been almost unmanageable.
For all first mode damping and mode shape tests approximately 10-12 seconds of data was collected at each frequency step and grid point of interest. For second mode tests approximately 6 seconds of data was collected.
Strip chart recordings of accelerometers taken during the tests showed varying amounts of noise on the accelerometer traces (Fig. 117). Consequently before the data was analyzed each record was passed through a low-band analog filter before it was digitized. The filter used was approximately 1.5 to 2.0 cps above the frequency of interest. Following this filtering all the data was digitized and then analyzed. It should be noted that both the filtered and unfiltered data is available to other investigators who wish to use it.
Methods of analyzing the data are described in Chapter 5. For the frequency response curves and the mode shapes described therein McDonnellDouglas provided a computer program that was capable of computing the maximum and minimum points of a digitized record and then averaged these values. This provided the unscaled data for all the frequency response curves and mode shapes. This computerized method of analyzing the data for these tests was expensive but essential.
5. METHODS OF DATA ANALYSIS
The analysis of the structural response data recorded and digitized by the instruments and methods described in Sections 2.3.4 and 4.5 is the subject of this chapter. The structural parameters of interest are the mode shapes, resonant frequencies and damping values at the first and second modes of the structure in both the EW and NS directions. Also the base shears generated in the first mode tests are calculated. The mode were easily determined from the data recorded. The damping values were more difficult to obtain and two different methods were used. The first was the commonly used frequency response curve (half-power point) method and the second is based on a curve fitting method in the time domain. Because of budget constraints the second method was only applied to the data recorded in the EW direction.
5 . 1 MODE SHAPES
Data typical of that obtained from McDonnell-Douglas on the mode shapes is shown in Table 12. The data consists of the three-dimensional response at each grid point given in Fig. 56 at the 12th, 10th, 8th, 6th, 4th and 2nd floor levels. Because the excitation force level varied slightly throughout the tests the data at each grid point was scaled. The scale factor was based on the acceleration obtained from the reference accelerometer which was recorded each time the data of a particular grid point was recorded. Mode shapes sho-;vu in Figs. 109 to 114 were plotted from the scaled tabulated values.
5.2 DAMPING AND FREQUENCIES
The resonant frequencies and damping values in the EW direction were calculated by two different methods. These were the frequency response curve (half-power point) method and a curve-fitting method in the time domain. For the NS direction only the frequency response curve method was used, and as a consequence data from the large amplitude first mode tests have not yet been reduced. Both methods will be described but before this is done some general comments on the two methods follows. Both methods are based on the assumption that the structure is elastic; however the curve-fitting method is capable of analyzing a reasonably short record of data, say 10 cycles, at a particular frequency of excitation. The values of interest are determined from this recorded information, assuming the structure is elastic. For the frequency response curve method the structure is assumed to be elastic over the complete sweep of frequencies.
Figure 118 shows the accelerations measured on the strip chart recorder for two of the larger amplitude tests (Test 24 E-D and 41 N-D) on the 10th floor. It can be observed that as the frequency of excitation changes 0.01 cps in test 24 E-D and 0.005 cps in Test 41 N-D the response of the building builds up and then settles into a new steady state condition. This build-up in response causes structural changes to occur such as beam and stairwell hinging and joint shear cracking. Associated with these structural changes is a change in the resonant frequency and the damping. Although in most cases the change is small from one frequency step to another, the change over a range of frequencies is significant. Consequently the frequency response curve method is not valid for these larger amplitude tests. However the curve-fitting method is, because the data recorded at each frequency step can be analyzed to give the resonant frequency and damping for that recorded set of information.
5.2.1 Frequency Response Curve Method
The approach used to determine the resonant frequencies and damping values by this method are developed in terms of the dynamic response of a single-degree-of-freedom system. The method is easily extended tomultidegree-of-freedom systems.
The differential equation which defines the response of the singledegree-of-freedom system (Figure 119) is
MX(t) + + Kx(t) = F(t) where x(t) is the displacement of the system from its equilibrium position,
M is the mass of the system,
C is the coefficient of viscous damping,
(5.1)
K is the spring constant or stiffness, and F(t) is the exciting force, as a function of time, t, seconds. An alternative form of this equation is: where a x(t) + x(t) + OJ x ( t) = n n F(t )/M = c/c is the damping ratio, dimensionless; c c = 2H W is the critical value of damping, c n wn = "KIM is the natural frequency of the system, radians/sec.
(5.2)
In theoretical calculations of the response of a system one assumes that the mass M, the coefficient of damping C, the spring constant K, and the exciting force F(t) are known. The response x(t), can then be calculated. In a steady-state test, however, we know the exciting force F(t) and we measure the response in terms of acceleration or displacement.
The problem is then to determine the mass, damping coefficient (or damping ratio), and the stiffness coefficient (or natural frequency). This information can be obtained from the test results if we can fit a theoretical curve to the experimental data. If the damping is suffi2 cient1y low (so that 1 - 1.0), we may make use of certain simple relationships in performing the fitting process. These relationships are indicated below.
Consider the response of the system if the exciting force is given by where M is the mass of a vibration generator x is the single amplitude displacement of this mass.
Equation 5.3 describes the exciting force created by the vibration generator. The normalized response of the system in terms of the amplitude of the displacement is given by where x is a reference displacement. Figure 120 corresponds to the diso placement transfer function when the exciting force is proportional to w
The response of the system to a force described by Equation 5.3 may also be expressed in terms of the acceleration of the system. In this case, the transfer function is given by
) where xl is a reference acceleration. This transfer function has been plotted in Figure 121; note that it corresponds to the response which is measured in steady-state vibration tests where accelerometers are used to measure the response.
In both of the theoretical response curves, increasing amounts of damping decrease the maximum response and cause a shift of the frequency at which the maximum response occurs. For low values of damping, the frequency at which the maximum response occurs coincides with the natural frequency of the system. In Figure 121, when the damping ratio is equal to 0.20, there is no maximum in the acceleration response curve near the resonant frequency. Experimental data in the form of acceleration response curves can be converted to displacement curves to accentuate the peaks. For sinusoidal excitation and response, displacements can be 2 computed from acceleration data by dividing by w .
For single-degree-of-freedom systems with small values of damping, the damping ratio may be determined from the width of the peak in the response curve. The usual procedure is to determine the width of the transfer function at the "half-power" points (Le., where the response is equal to 0.707 of the peak value), and to use the following approximate relationship
(5.6) where /:'w is the "bandwidth" or the width of the transfer function curve when the magnitude of the response is equal to 0.707 of the peak response. This relationship may be applied to either of the transfer function curves shown in Fig. 120 or 121 provided that /:'w < 0.2 w. Furthermore, it may be noted that the range of applicability of Equation 5.6 is greater for the first type of transfer function (Fig. 120) than it is for the second (Fig. 121).
If the damping of the system is large, more elaborate procedures are required in order to determine both the natural frequency of the system and the damping.
Until now, we have considered only the dynamic response of a singledegree-of-freedom system. This effort is not wasted because the dynamic behavior of a multiple-degree-of-freedom system can be analyzed as the combined response of several single-degree-of-freedom systems. Thus, for an n-degree-of-freedom system, there will be n characteristic ways in which this system can vibrate. We refer to these characteristic ways as the eigenmodes of the system, or for convenience, simply the "modes" of the system. It is the eigenmodes of vibration and associated parameters which we are most interested in identifying during vibration tests.
As for a single-degree-of-freedom system, each mode is characterized by a resonant frequency, a damping value, and an effective mass. In addition, a mode shape or eigenvector is required to specify how each point throughout the system would vibrate when responding only in each mode under question. Eigenvectors must be defined for each point in the structure for each mode of vibration.
During testing of a multidegree-of-freedom system the results most readily obtained from the frequency response curves measured at various points in the building are the resonant frequencies and damping values. This assumes that the conditions mentioned previously with regard to the single-degree-of-freedom system are satisfied.
For all damping tests performed frequency sweeps of the type required to define frequency response curves were performed. As stated previously not all these sweeps were capable of defining the resonant frequency and damping for the mode of interest, however wherever possible this method was used.
Typical tabulated data provided by McDonnell Douglas for each frequency sweep is shown in Table 13. The data consists of the steady state amplitude for each accelerometer located in the building. As with the mode shape data, the excitation force varied slightly from the frequency a squared variation (w ) required. Consequently the data of each channel was scaled. The scale factor was based on the force at resonance and all other channels were scaled so that their force level satisfied the frequency squared variation required.
5.2.2 Time Domain Analysis
The recorded acceleration time histories for all EW damping tests were analyzed using a time domain least squares curve fitting procedure. As stated earlier this is the only appropriate method to analyze recorded data from a structural system that is constantly changing. A similar method developed by Raggett (5) was used to analyze the data obtained from Blume's tests (Ref. 1,2) in a 4-story building.
The method assumes that for the duration of the record being analyzed the building is elastic. Further the method does not require the forcing function to be sinusoidal. Although the method as developed by Beck (6) is capable of determining mode shapes and participation factors it was \ only used to determine resonant frequencies and damping values. The participation factors and mode shapes measured during the test series were used in the identification process.
5.2.2.1 Theory of Least Integral Squares Identification
a) Brief Derivation of Modal Equations
The equation of mol ion of an N degree of freedom linear system is .. M x + C x + Kx = e. f(t) -1 where f(t) is the force history produced by the shaker at the i-th coordinate and e. is the unit vector, (e.). = 5 ... J
(5.7)
Let denote the modeshape matrix consisting of 0. , the modal value at the i-th floor for the r-th mode, and define S by
In the modal equivalent viscous damping approach it is assumed that the damper is viscous (i.e., it is proportional to the velocity only) and that uncoupled modes exist. t
Thus M c and K are all diagonal matrices, where w is the natural frequency and e is the equivalent viscous r r damping; is the v-th mode participation factor at coordinate j, and the r-th modal mass, expressed in terms of the lumped mass m..
If the system is lightly damped and the natural frequencies are sufficiently well separated, then i. when the exciting frequency J J is w w. An attempt is thus made to use the time history x.(t) in this r J resonant case to estimate the parameters w , e and r r J
b) Time-domain Identification vs Frequency-domain
The main advantage of time-domain identification for forced vibrations is when the structural properties are changing, because the identification is done at a particular amplitude. A frequency-domain identification, using frequency response curves, uses data at successively different amplitudes, and at each such amplitude the equivalent linear parameters have changed. Thus, the theory based on linear, time-invariant systems may not produce meaningful results.
Another advantage of the time-domain is that it does not assume that the motion is steady-state and it can handle arbitrary time-histories. Thus, the input (shaker force) does not have to be sinusoidal, as the frequency-response approach assumes.
A difficulty with the time-domain approach using the time-histories of shaker force and response for one frequency of excitation at, or near, the r-th modal frequency is that not all the parameters w , 8 and p(r) r . r k' k e K, can be uniquely determined. (Here K is the set of locations of which the response was measured and which are used in the identification).
The reason for this is the narrow-band, essentially monochromatic, frequency content of the excitation. Thus, in contrast to the case where earthquake records are used in the identification, the frequency content of the response gives no information about the system. The information about the system must come from the phase and amplitude of the response relative to those of the shaker force, and this information is not sufficient to distinguish between the effects of damping and the effects of the modeshape quantities
Increasing the number of locations at which the response is measured does not help because for each such location one new parameter is introduced but only the amplitude at the new location leads to additional information. The phase is essentially constant throughout the building because the response is dominated by one mode. To overcome this nonuniqueness, the can be assigned a priori.
The use of more than one response record is recommended, however, because it helps to overcome the difficulties in identification arising from modal interference. This is because the contributions of the other modes are different at different locations and hence the identification process is better able to sort out the dominant mode if several response records are used.
c) Minimization of Integral Square Measure of fit.
In time-domain identification, we need to determine the initial displacement and velocity in order to be able to determine the theoretical response, which is generated for the equations of motion. We therefore define the vector of parameters: and the integral-square measure-of-fit between the recorded acceleration response and the theoretical acceleration response: where
= (r) f (t); Pk r k = 1, ... K; (5.17 )
(from the modal equation given earlier) where a r b r c r f (t) r K
= recorded acceleration at location k
2
= Ul r 2rT IT ) r
= 2f3 Ul r r
= shaker force history when the excitation frequency Ul Ul , the natural frequency of r mode r
= = = number of response records used r-th mode participation factor at coordinate k the time interval over which the response matching is to occur
= theoretical displacement response at location k for a single-mode model of the system.
Note that if only one record was used (i.e., K = 1), J would be the mean-square error between the recorded and theoretical response.
The parameters are estimated by minimizing J with respect to these parameters. The technique used to perform this minimization is described in Ref. 6.
5.2.2.2 Analysis of Test Results Using Time-Domain Method
Using the theory described in the preceeding sections, a computer program FORCID was developed to analyze the recorded data. The computer program was a modification of the work performed by Beck (Ref. 6) on recorded earthquake data. The modifications were done by Beck. Testing the applicability of the FORCID was performed using simulated data on a 10 story shear building. The simulated tests performed are presented in
It is clear from the test runs that reasonably accurate results are obtained only when three conditions are met. These are,
1) The response of more than one different floor level is used simultaneously in the identification process.
2) The participation factors required in the identification procedure are specified from measured values.
3) Recorded response close to the resonant frequency is used.
In analyzing the EW data all three of the above conditions were met in obtaining the damping values presented in Table 9. The records used in the identification program were the filtered records obtained from MCDonnel-Douglas. The response at the 12th and 10th floors was used in the identification program. The participation factors of Eq. 5.13 at these two levels for the first and second EW translational modes are given in Tables 14 and 15. The tabulated results are presented for the mode shapes measured experimentally before and after the large amplitude tests, i.e., Tests 14E-M and 28E-M for the first mode and llE-M and 27E-M for the second mode. The actual value used in FORCID was the average of the two results. Test runs were made using both sets of values and as the variation in the damping was less than 10%, the use of the average value was considered to be reasonable. A more extensive analysis of the results using different combinations at floor levels and participation factors, etc., will be performed in the next phase of the analysis of test results.
5.3 UNIFORM BUILDING CODE EQUIVALENT OF THE BASE SHEAR FORCE INDUCED DURING TESTING
In order to provide a frame of reference for the magnitude of forces induced during the large amplitude shaking, the base shear force generated in the tests was compared with design base shear forces of the Uniform Building Code (UBC). The base shear force, VT , generated in the structure during testing was calculated as: 11 = 2:) i=l .. m. x. where mi is the mass at the ith level and xi is the maximum acceleration at the center of mass of the i th level. The UBC design base shear is calculated from v = ZKCW 1974 UBC c v = ZKICSW 1976 UBC c where W is the total weight of the structure, Z is a zone factor and varies from 1 to 1/4 for the 1974 UBC and 1 to 3/8 for the 1976 UBC. K is a factor dependent upon the framing system and for this example was taken as 1.0. I is an importance factor and is taken as 1.0. S is a factor dependent on the soil conditions and was taken at its maximum value of 1.5. C is a function of the period of the building and differs for the 1974 and 1976 codes. In the 1974 UBC,
C = 0.05 3...rr- and in the 1976 UBC, C = 1 ISvr- where T = O.lN in both and N is the number of stories.
The base shear force comparison VT/V c ' presented in Table 11 is made for both the code calculated period and for the period of the structure measured during the test.
6. DISCUSSION OF TEST RESULTS
The experimental values of the natural periods and percent of critical damping are presented in Tables 16 through 21 for each of the modes tested. The experimentally determined mode shapes are depicted in Figs. 109 through 114. The base shear forces generated in the first translational modes in both the EW and NS directions are listed in Table 11. Following is the discussion of these previously presented results.
6.1 PERIOD
There were progressive increases in the period of the building in all of the modes excited during the testing, and the largest changes occurred in the first translational modes. Changes in period which occurred during the lower force levels of excitation (5000 lbf, or 22 KN, nominal) were not associated with significant visual changes in the structural system, although it is obvious that internal structural changes were taking place. During the larger force-level tests (10000 lbf, or 44.5 KN, or larger nominal force) changes were visible and these are described in detail in Chapter 3. The resulting structural changes consisted of beam-end and stair-corner hinging, shear-cracking in the beam-column joints, and decreasing interaction of the infill panels with the structural frame. All of events occurred gradually because during each sweep there was a slow build-up in the amplitude of the forcing function as the resonant frequency was approached. This is illustrated in Fig. 118 and discussed in Sec. 5.2.
It should be noted that the changes in period associated with the larger amplitude tests were permanent. All lower force-level tests performed subsequently had essentially the same period as the last large input-force level test. This indicates that permanent changes had occurred in the lateral force resisting system.
From Table 16 it can be seen that for EW shaking with the external cladding in place the period of the first translational mode increased by a factor of 2.6 during the large amplitude tests from 0.74 sees. to 1.92 secs. as the input force increased from 4760 lbf (21.17 KN) to 29,000 lbf (129 KN), respectively. During the small amplitude tests the period measured at the force level of 1050 lbf (4.67 KN) was 0.65 secs.
These changes in period were associated with visually significant changes in the structural system (see Chap. 3). The change in the period of the first translational mode before and after an interval of large amplitude second mode tests was small, 0.89 secs. before and 0.93 secs. after, respectively. This indicates that only slight structural damage occurred during the large amplitude second mode tests, and this is consistent with the visual observations.
The data in Table 17 indicates that for the EW direction shaking with the external cladding in place the period of the second translational mode increased approximately 50 percent from 0.21 sees. to 0.31 sees. as the input force level increased from 5,400 lbf (24 KN) to 29,900 lbf (133 KN).
As noted above, this increase in period was not associated with any visually significant changes in the structure. Before and after an interlude of large amplitude first mode tests the period of the second mode did increase from 0.31 to 0.39 sees. This change is attributed to the structural damage during the first mode tests.
Data from the first translational mode tests in the NS direction without the cladding are given in Table 18. The period doubled from 1.23 to
2.50 sees. as the force level increased from 3610 lbf (16.1 KN) to 17,000 lbf (75.6 KN). As for the EW tests, the change in the first translational mode period before and after an interval of large amplitude second mode tests was small (1.25 vs 1.32 sees., respectively), indicating but slight changes in the lateral force resisting frame during these second mode tests.
The period of the first torsional mode increased approximately 50% from 1.04 sec. to 1.47 sec. as the force level increased from 5170 Ibf (23.0 KN) to 15,000 lbf (66.7 KN), respectively (Table 19). Only a slight change occurred during an interlude of second mode tests (1.08 to 1.09 sees.
Data from the second translational mode in the NS direction tests without cladding are presented in Table 20. The period increased by 35 percent from 0.31 sees. to 0.42 secs. as the force level at resonance changed from 3530 lbf (15.7 KN) to 22,840 lbf (101.6 KN), respectively. As with the tests in the EW direction, this increase in period was not associated with any significant structural changes. The period of the second translational mode before and after the first mode large amplitude tests was 0.37 secs. and 0.53 sees., respectively. This was associated with visually observed . structural damage during the first mode tests.
For the second torsional mode from NS shaking the increase in periods was much less (Table 21), changing from 0.28 to 0.32 secs. as the force level increased from 4500 Ibf (20.0 KN) to 26,940 lbf (119.8 KN). The period before and after the first mode large amplitude tests was 0.30 before and 0.36 sees. after.
6.2 MODE SHAPES
The mode shapes measured during the shaking tests are presented in Figs. 109 through 114. In the EW direction the first and second translational modes were predominantly translational although after the large amplitude tests the rotational component in the NS direction increased to approximately 10 percent of the EW translational component. Because the rotational component was small, Figs. 109 and 110 only compare the EW translational components of the first and second modes. As seen in these figures, the changes in both the first and second measured mode shapes, before and after the large amplitude tests, are minor even though the period increased by 110 percent for the first translational mode and 78 percent for the second translational mode. Significant structural damage did not appreciably affect the mode shapes, even though it greatly changed the periods.
In the NS tests without cladding there was a significant rotational component in each of the four measured modes (see Figs. 111 through 117), both before and after the damaging large amplitude tests. This damage was more severe in the NS tests than in the EW tests (Chap. 3). As a consequence the difference in the mode shapes before and after the large amplitude tests was greater than for the EW shaking. A comparison of the first torsional and the second translational mode shapes (Figs. 112 and 113, respectively) shows smaller changes before and after the large amplitude tests than the first translational and second torsional modes (Figs. 111 and 114, respectively).
6.3 DAMPING
It is clear from the damping data in Tables 16 and 17 that there are significant differences in the damping values obtained by the two methods used to determine them. The time-domain method (Sec. 5.2) was not used for the data from the NS shaking tests.
It appears that for the half-power-point method (frequency response curves) the damping varies according to the direction of the sweep (see
Tests l7N-D and 20N-D, Table 21). In the time domain method the damping was dependent on the number of accelerometer signals used in the analysis (see Appendix C). Table 22 shows a comparison of the results of four analyses at different frequencies in which two and three EW response signals were used (lO-th and l2-th floor accelerometers in the first instance, and an additional reference accelerometer in the other one). The damping values in Tables 16 and 17 were all obtained using the three signals. Future studies on the data will be performed with a greater number of accelerometer signals.
Until a greater confidence can be placed in the damping results obtained by either of the two methods, the discussion of the damping values will restrict itself here to the ranges in which the results for the various tests fall. For this purpose the ranges will be: 1-2 percent, 2-3 percent, 3-4 percent, 4-6 percent, 6-8 percent and 8-10 percent.
The damping obtained for the lower force level tests (less than 10,000 lbf, or 44.5 KN force), of the EW first translational mode, i.e., tests 10E-SD to 22E-D in Table 16, was 1 to 2 percent by the time domain method and 3 to 4 percent by the ha1f-power-point method (except for Test lE-SD in which the direction of sweep was up and opposite to all the other tests). For the two large amplitude tests (23E-D and 24E-D in Table 16) only the time domain method of analysis was used, and the damping results for all but the 0.56 cps test were in the 2 to 3 percent range. The damping for the 0.56 cps test was 3.9 percent. In summary it appears that for the first EW translational mode with the cladding in place the damping does not exceed 4 percent. For the lower force level tests the deflection of the roof of the building was less than 0.5 inches (13 rom).
Damping values are dependent on the method used to obtain them.
For the second EW translational mode there is a considerable difference in the damping results obtained by the two methods of analysis for the higher force level tests (Table 17). Furthermore, the trends different: 1) For the half-power-point method the damping increased with force level up to a maximum of 8 percent; it dropped subsequently to approximately 6 percent during a low force level test performed after a high force level test (2lE-SD, Table 17) and this value did not change appreciably after an interval of first mode tests (25E-SD). 2) For the time domain method of analysis the damping for all the large amplitude tests is in the 2-4 percent range. For the lower force level test performed after the larger amplitude tests (2lE-SD) the damping increased to approximately 5 percent, and after the first mode tests it dropped to 3.4 percent (25E-SD in Table 17).
For the NS shaking tests damping results have only been obtained by the half-power-point method, and as a consequence results for the larger amplitude first mode tests are not available. Because of the discrepencies in the results obtained from the two methods of analysis in the EW direction tests, caution is suggested in drawing definitive conclusions from the NS damping data.
For the first NS translational mode (Table 18) the damping of the lower force level tests performed prior to the large amplitude tests is in the 3-to-4 percent range. These are similar to the EW tests in which the cladding was still in place. Following the large amplitude NS tests the damping increased to 5.8 percent.
For both the NS first and second torsional modes (Tables 19 and 21 respectively) damping did not increase as the force level increased. In fact, for both torsional modes damping was in the 2-to-3 percent range, except for test 20N-D in which the direction of the sweep was in the opposite direction to all the other tests and damping was close to half that of the equivalent force level tests with the sweep in the opposing direction.
Damping was in the 3-to-4 percent range for the second NS trans lational mode (Table 20). The two exceptions were for the largest force level test (23N-D) in which damping was 5.6 percent, and for test 19N-D in which the direction of the sweep was in the opposite direction to all other tests. Here damping was about half of the value obtained for test l8N-D which had approximately the same force level but sweep was in the other direction.
6.4 UNIFORM BUILDING CODE EQUIVALENT OF THE BASE SHEAR FORCE INDUCED DURING TESTING.
The base shear force comparison vT/v c presented in Table 11 for several of the first mode tests in both the EW and the NS directions is made for both the code calculated period and for the period of the building measured during the particular test. For the code calculated period the maximum base shear force generated during the EW tests was 3.2 times the 1974 UBC design ya1ue, 2.4 times the 1976 UBC design value with the S(soil) factor of 1.0 and 1.6 times the code design value with S = 1.5, the maximum S-factor. The corresponding base shear ratios were 2.8, 2.1 and 1.4, respectively, for the NS tests. If the measured periods are used for calculating the design base shear force, then the ratio VT/VC increases for all tests where the period of the test is greater than the code period of 1.1 secs. As seen Table 11, this increase is greater . for the larger amplitude NS tests than for the EW tests.
In evaluating these results it is of interest to note that the duration of shaking for the tests in which large base shear forces were generated varied between 20 and 60 minutes. In the EW direction test
23E-D, with cladding in place, it is estimated that the ratio of vT/v c for the 1974 UBC exceeded unity for about 45 minutes, and it exceeded 2 for approximately 20 minutes. In the final test (41N-D), when the building was close to collapse, it is estimated that the ratio VT/VC exceeded unity for 10 minutes.
In addition to. the above described durations of the large amplitude excitations the total time for each of the tests varied between 40 and 90 minutes. As a result it is estimated that the building was subjected to varying amounts of excitation for at least 60 hrs. It is estimated that the ratio vT/V c for the 1974 UBC exceeded unity for at least 100 minutes in the EW direction tests and 70 minutes in the NS tests.
Although the code design base shear force values are not equal to the values that would be expected in a large earthquake, they do represent values that would be expected from a moderate earthquake. Furthermore, the building resisted these base forces over a much longer duration than the minutes of an earthquake. It is clear, therefore, that this non-seismically designed building, both with and without external cladding, was able to withstand base shear forces greater than those demanded by recent UBC requirements when subjected to the sinusoidal type of motion induced by the moving mass shaker. Until further analysis of the results it cannot be inferred, however, that this structure would have resisted an earthquake which would have induced a base shear force of the same magnitude.
6.5 COMPARISON OF LARGE AND SMALL AMPLITUDE TESTS.
The small amplitude tests performed with the eccentric mass vibrator (described in Chapter 2) excited the building in both the EW and the NS direction with the cladding in place. The fully clad building was tested with the moving mass vibrator only in the EW direction. Comparisons between the two series can thus be made only for the EW tests.
From Table 8 it can be seen that the resonant frequency of the first EW translational mode decreased from 1.53 Hz (T = 0.65 sees.) to 1.43 Hz (T = 0.7 secs.) as the force level increased from 1050 lbf (4.68 KN) to 4260 lbf (18.91 KN) in the small amplitude tests. For the same sequence of tests the damping varied between 1.5 percent and 0.9 percent, with the lower value associated with the larger force level. The first large amplitude test (i.e., resonance induced by the moving mass shaker), test lE-SD, had a resonant frequency of 1.36 Hz (T = 0.74 sees.) and a damping value of 1.4 percent, using the half-power-point method, and 2.2 percent from the time domain method (Table 16). This slight drop in the resonant frequency between the two sets of results is attributable to the shaking that was performed in testing and adjusting the moving mass vibrator prior to the performance of Test lE-SD.
For the second EW translational mode the resonant frequencies of the two sets of tests were 4.68 Hz for the eccentric mass vibrator and 4.60 Hz for the moving mass vibrator. The corresponding damping values were 1.9 and 2.6 percent, respectively.
A comparison of the mode shapes for the first and second modes is presented in Figs. 107 and 108. The agreement in the first translational mode is reasonable, however, there are significant discrepancies in the lower stories for the second mode results (Fig. 107). As the eccentric mass vibrator test was performed at approximately one third of the force level of the moving mass test the difference in the measured mode shapes is attributed to the decreased interaction of the infi11 panels in the lower force level tests.
6.6 SUMMARY
This chapter the dynamic data obtained in the shaking tests: period, mode-shapes, damping and base shear force, and it presented comparisons and discussions on the effects of cladding, force level, damage, type of excitation and duration of shaking on the dynamic behavior of the test structure. Conclusions from this chapter will be reviewed in detail in Chapter 8 of this report.