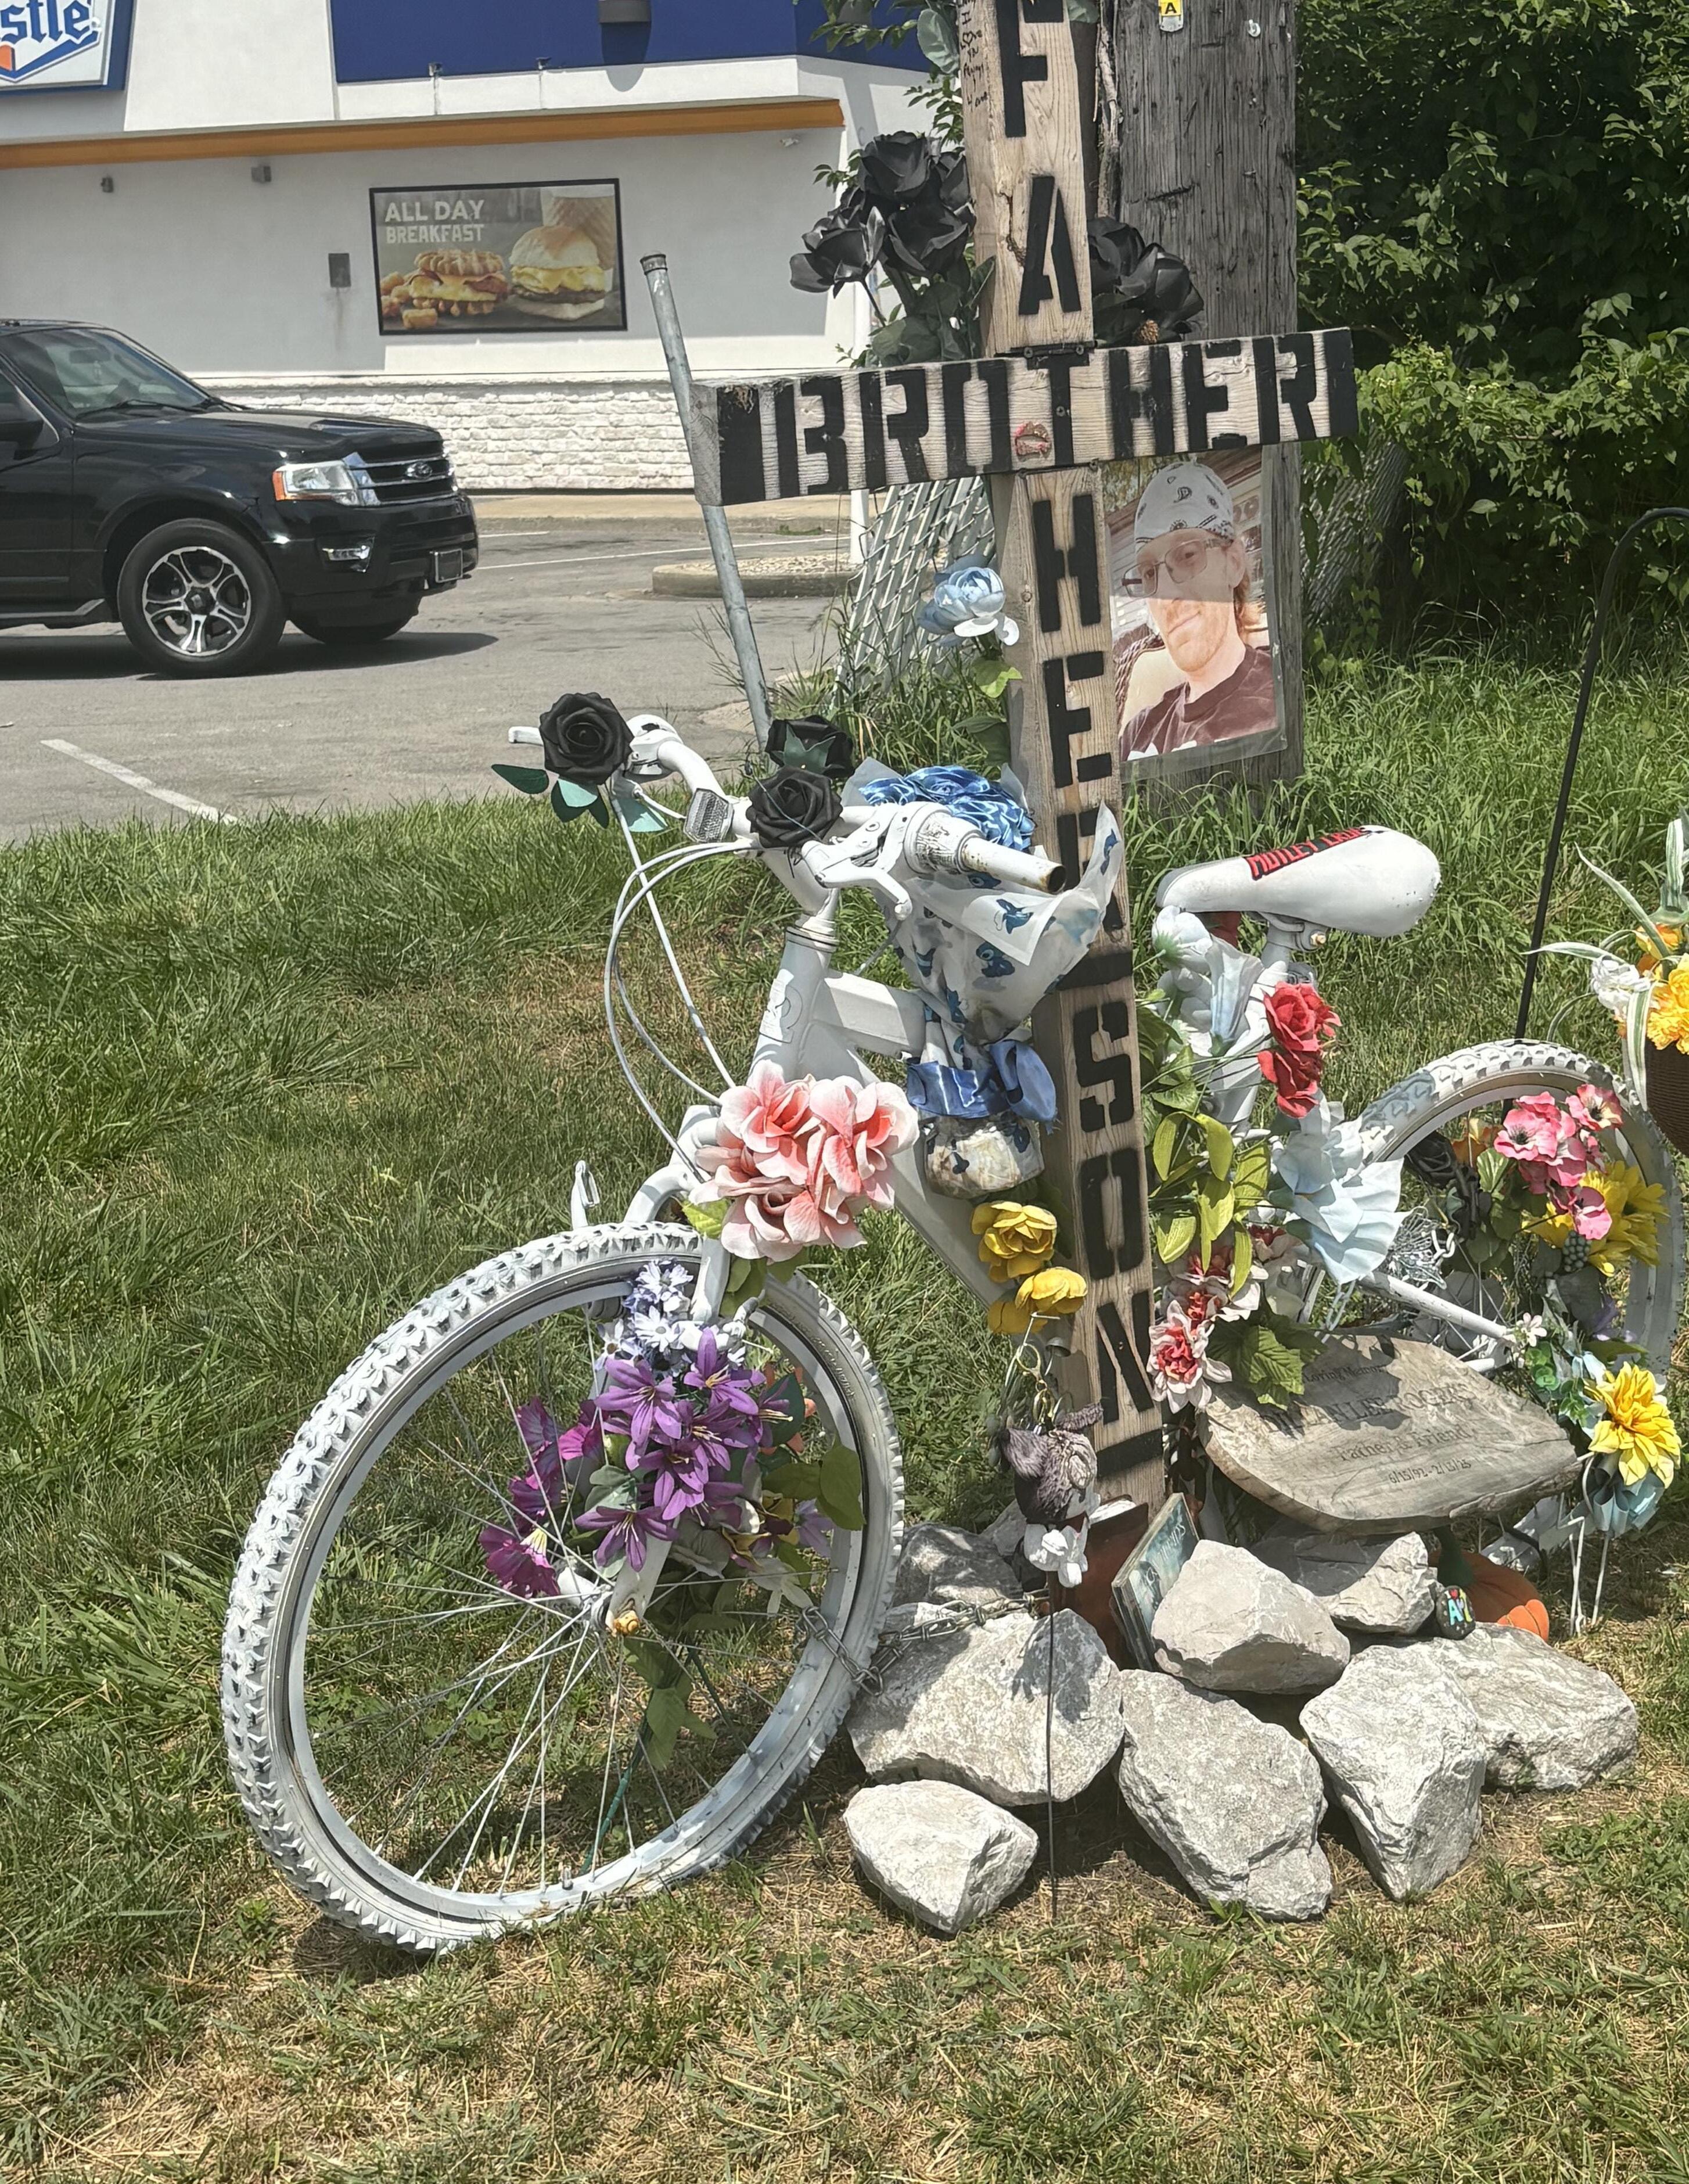
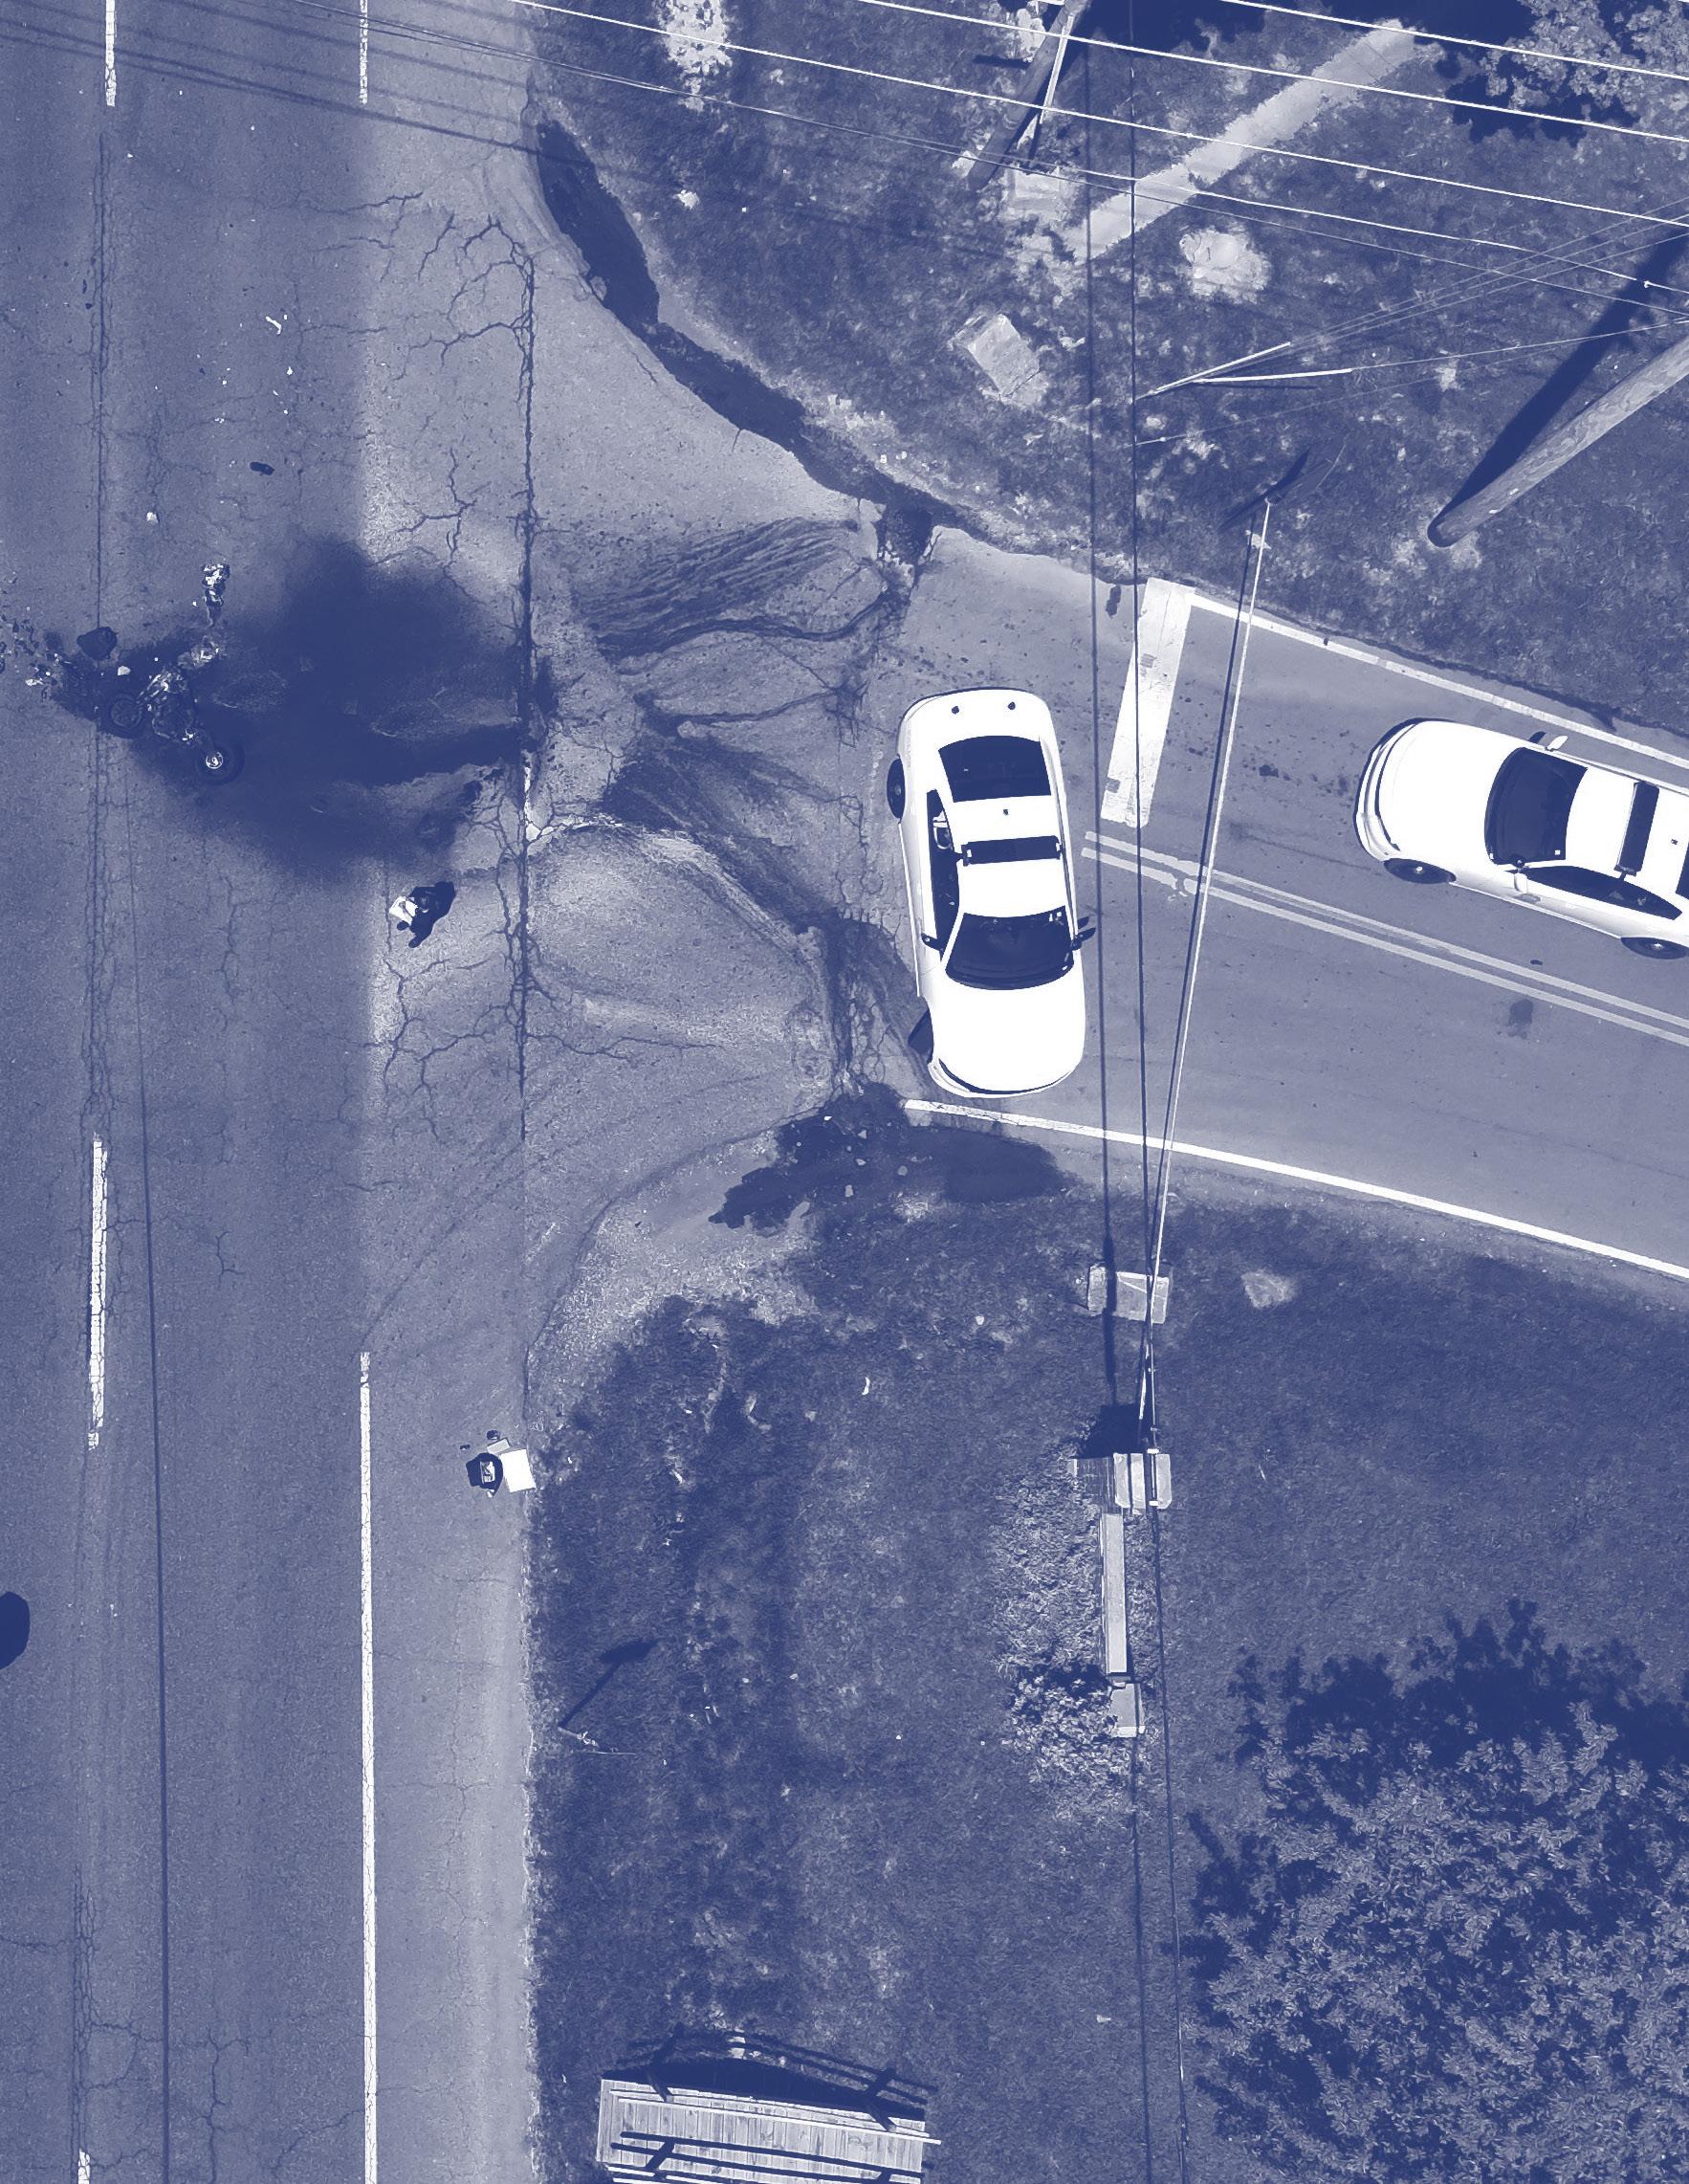
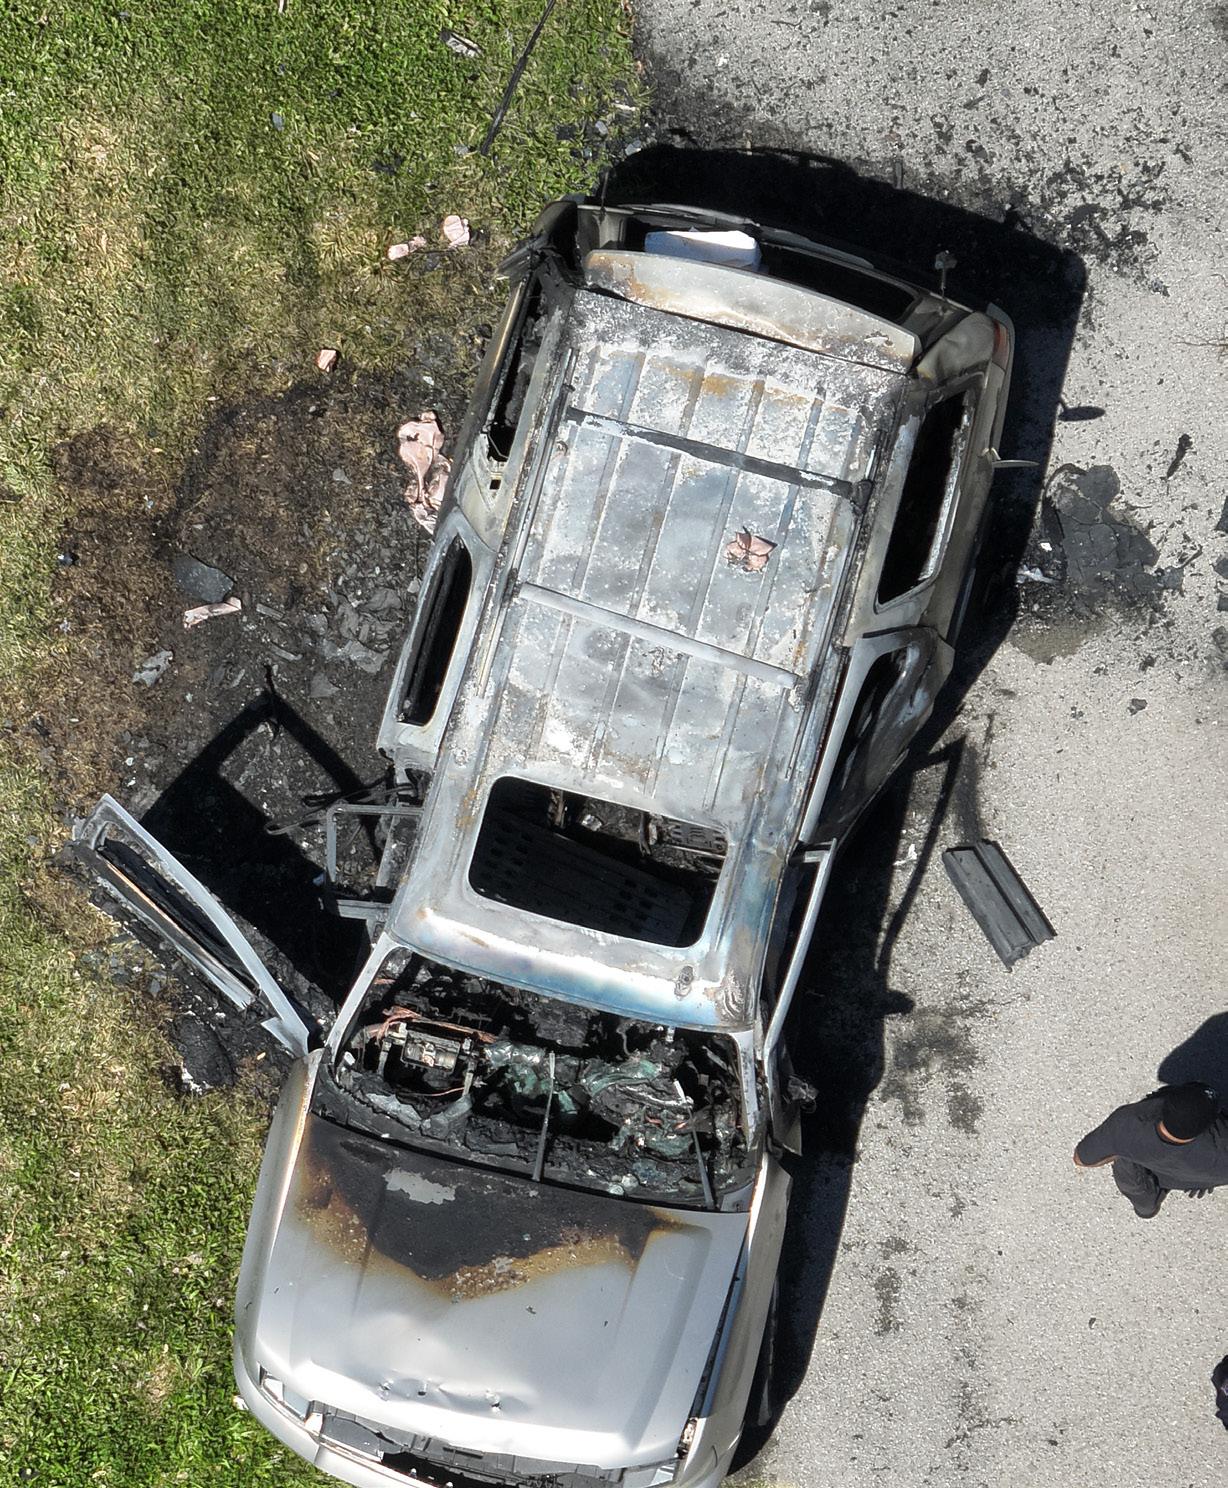
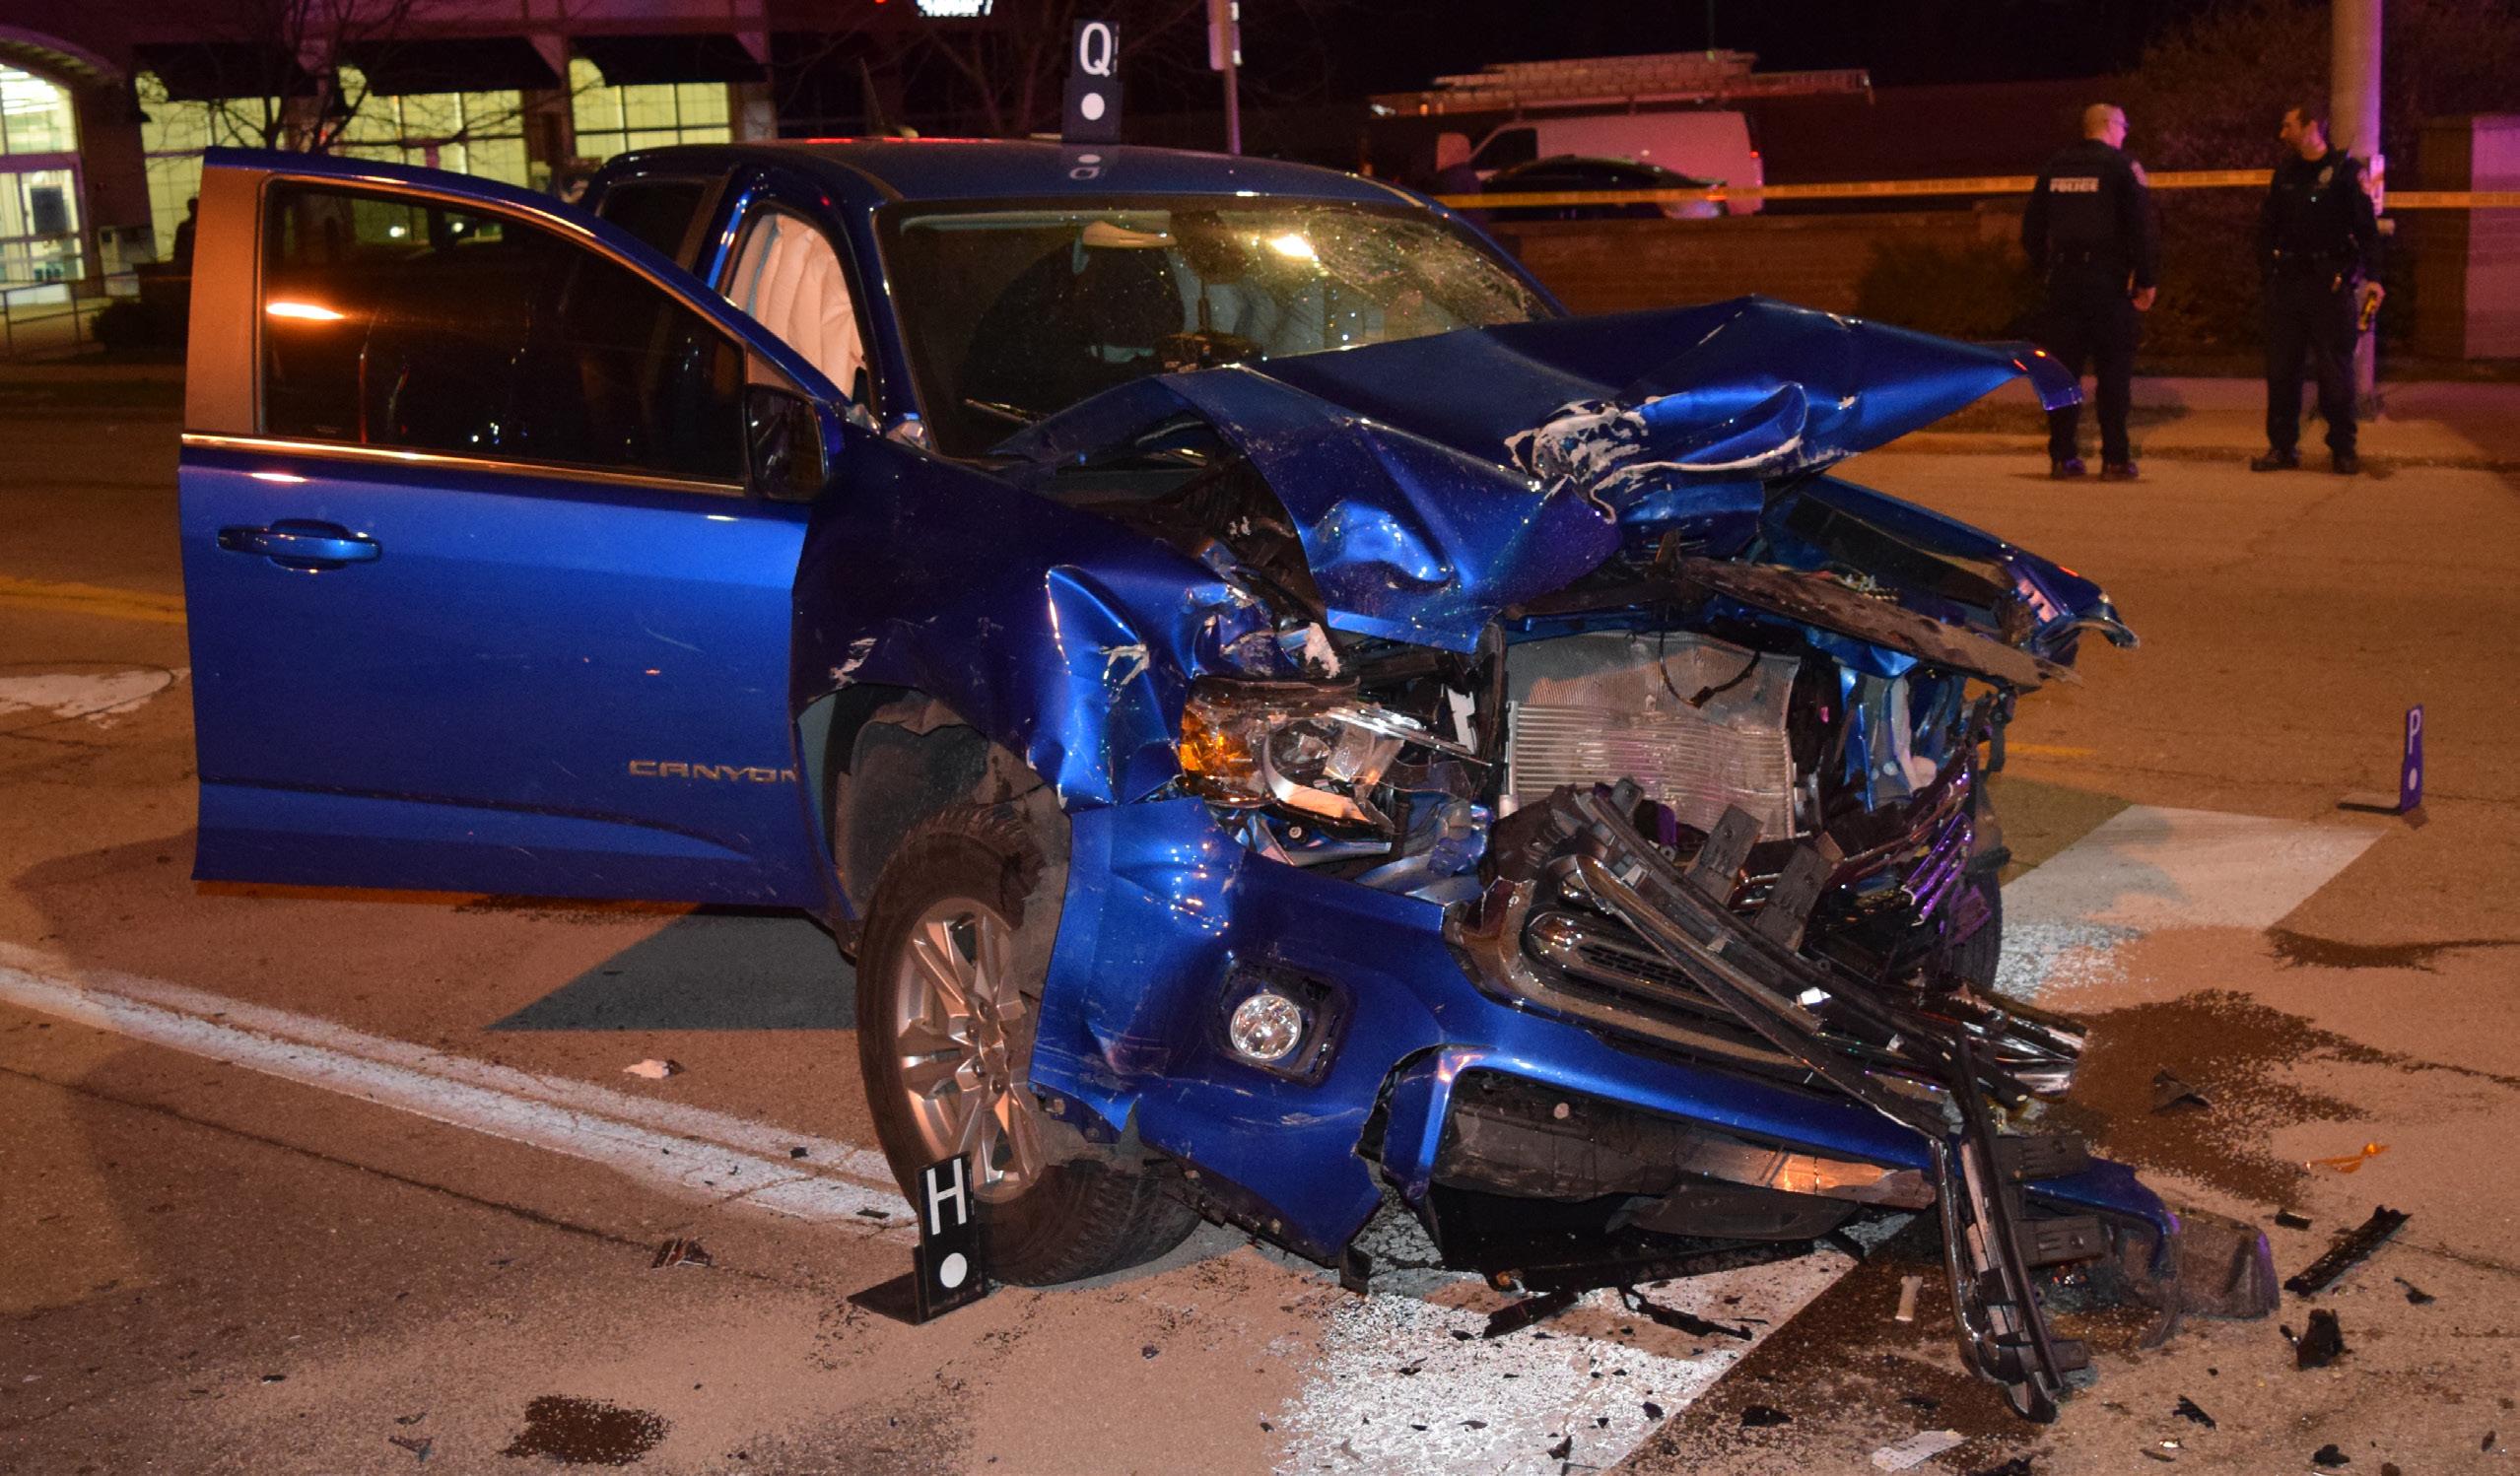
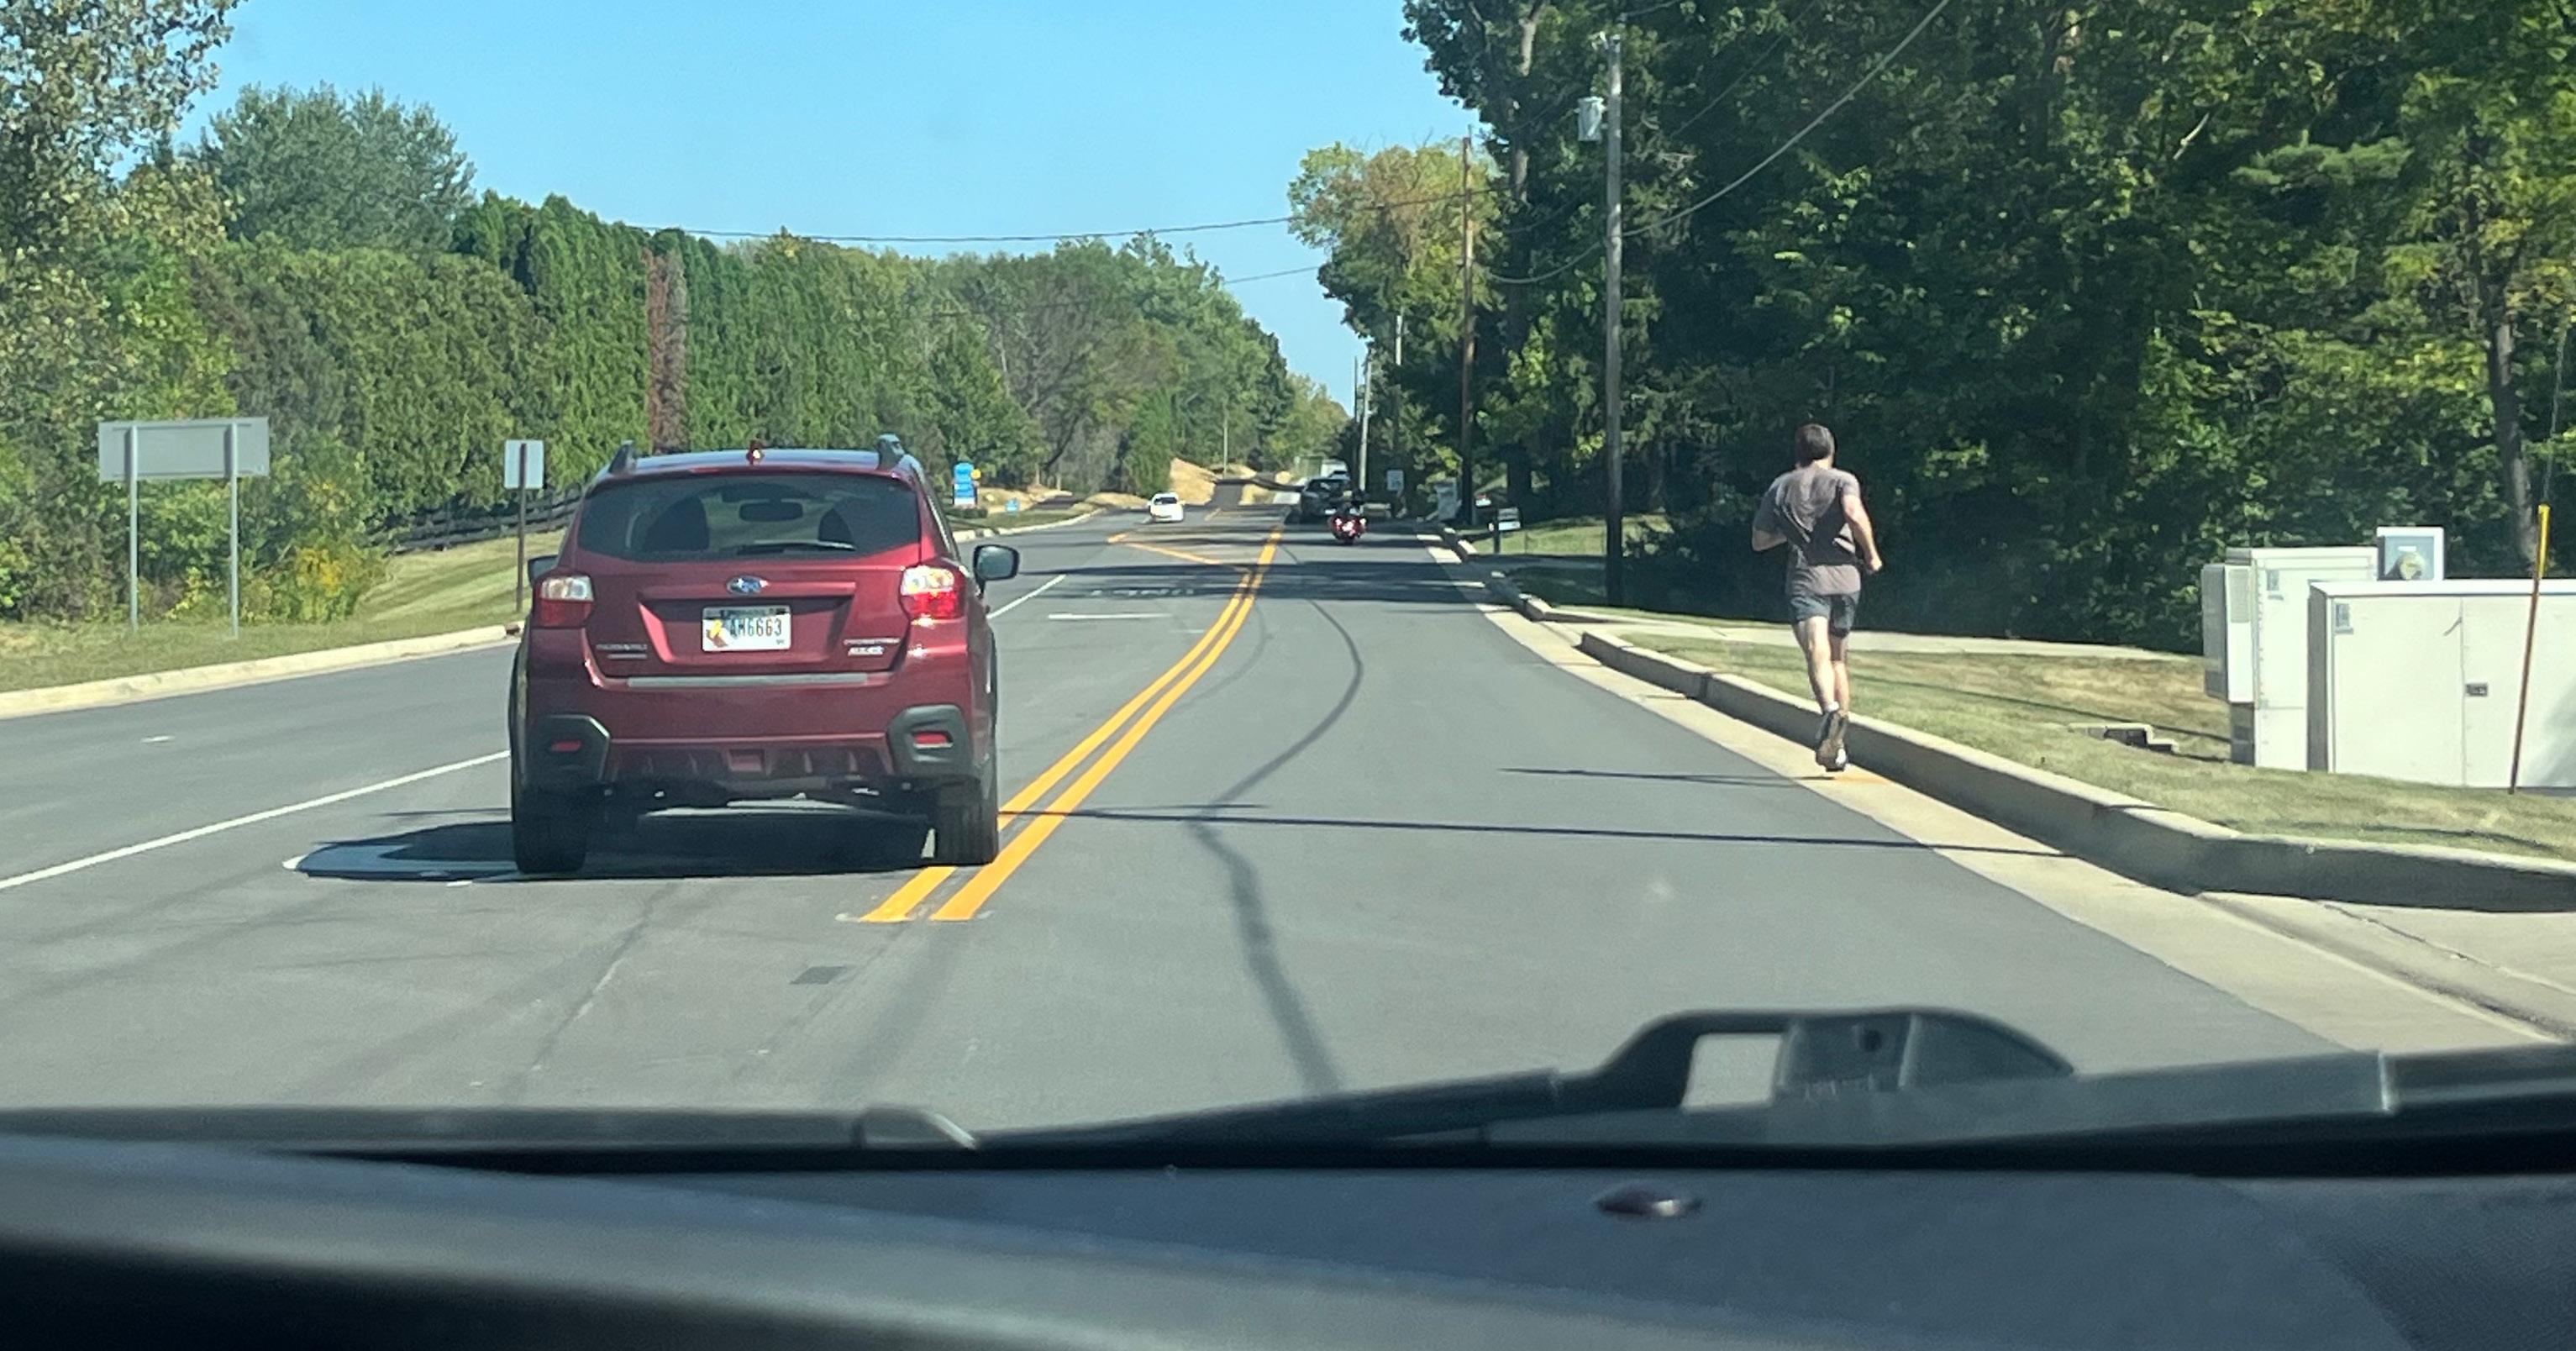
On February 13th, 2025, Dillan Lee Rogers, 32, was killed in Indianapolis while cycling home from work. He leaves behind two young children.
Photo credit: Fatal Crash Review Team
In Memoriam
Each fatal or serious injury on our city roadways represents a life forever changed: a loved one, a friend, a neighbor, or a colleague whose journey was cut short. These are not mere statistics; they are people who had families, dreams, and futures. Their absence leaves an unfillable void in our community.
The City of Indianapolis dedicates this Vision Zero Action Plan to the memory of all those who have lost their lives or been seriously injured in traffic crashes. We honor their memory by committing to meaningful change.
Every crash tells a story, and too many of those stories end in tragedy. Yet, these tragedies are not inevitable.
Vision Zero is built on a simple but powerful principle: no loss of life on our roads is acceptable.
This dedication is both a remembrance and a promise: to never forget those we’ve lost, and to ensure that others don’t have to endure the same pain.
A Letter From the Mayor
Dear Indianapolis Neighbors,
Everyone has the right to move safely around our city—regardless of how old they are, how they travel, or what neighborhood they call home. That is why, as Mayor of the City of Indianapolis, I am committed to Vision Zero and its goal of eliminating all traffic-related deaths and serious injuries by 2035.
Vision Zero is more than just a set of values. It’s a call to action. Our Indianapolis Vision Zero Taskforce has developed an Action Plan with clear strategies to make our streets safer. These include integrating safety into all street design and transportation decisions, strengthening Complete Streets, and implementing policies and countermeasures that reduce crashes, protect all road users, and promote safe mobility for everyone in Indianapolis. Together, these actions prioritize people and build a transportation system that works for all.
Because one thing is clear: decades of choices in policy and design, as well as human behavior have had lasting impacts on traffic deaths in our community. And we know that children, older adults, pedestrians, and cyclists, particularly in underappreciated neighborhoods, bear the greatest risks. We cannot accept this. We can and we must continue the important work to prevent families in our city from experiencing tragedy on our roadways.
Achieving this vision requires strong support and collaboration. City agencies, the City-County Council, community organizations, health and safety advocates, and residents all have a vital role to play in making Vision Zero a reality. By working together, we can create safer streets, expand transportation options, and foster a sense of shared responsibility for the safety of all road users.
Our neighbors deserve streets where zero is the only acceptable number of traffic deaths.
Sincerely,
Joe Hogsett Mayor City of Indianapolis
We Pledge...
As members of the Indianapolis Vision Zero Taskforce, we recognize that traffic deaths and serious injuries are preventable, and that safety is a shared responsibility. We are committed to advancing equitable, data-driven, and collaborative solutions that protect everyone traveling on our city streets. Guided by the Safe System Approach, we pledge to work hand in hand with the community to achieve the outcomes as outlined in the Vision Zero Action Plan.
INDIANAPOLIS VISION ZERO TASK FORCE
John Barth (Chair)
City-County Councilor
Andy Nielsen
City-County Councilor
Derek Cahill City-County Councilor
Todd Wilson Director, Dept. of Public Works
Chief Christopher Bailey
Indianapolis Metropolitan Police Department
Chief Ernest Malone
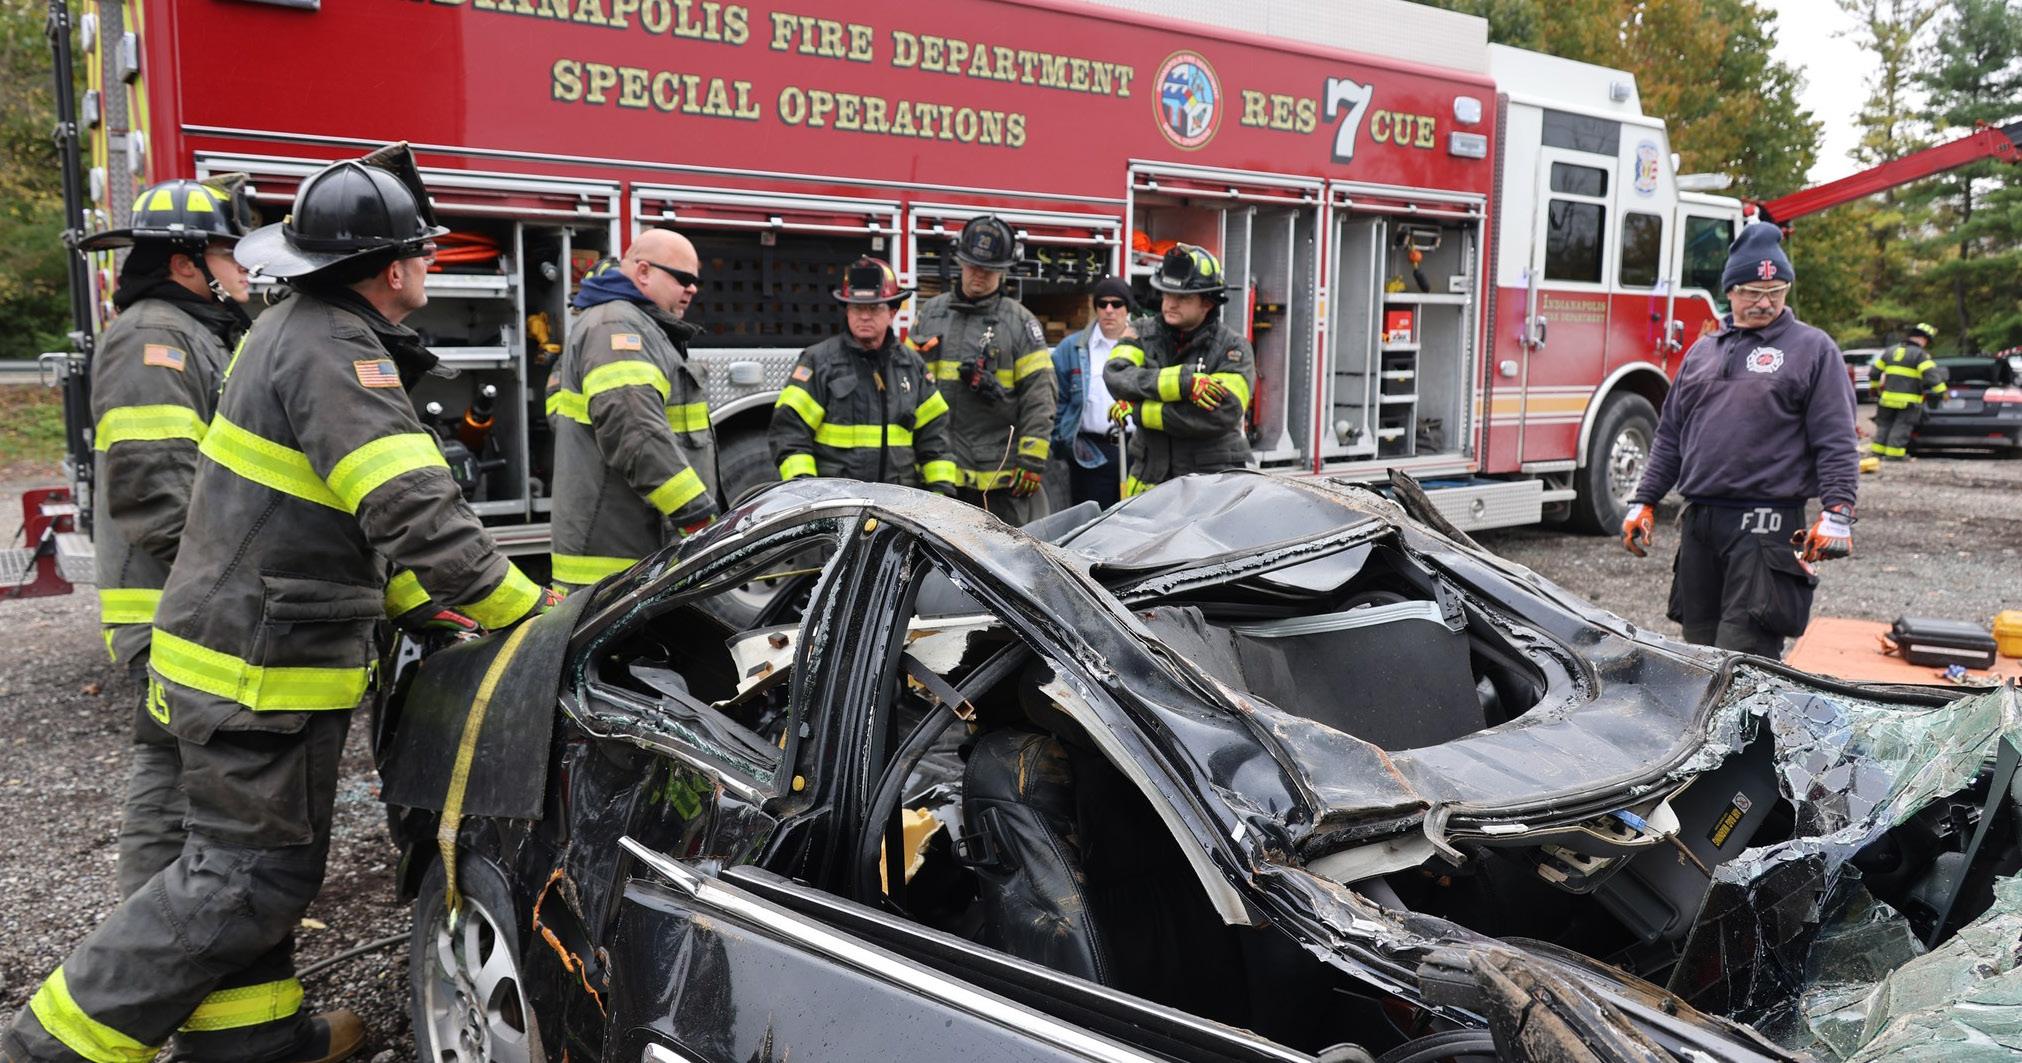
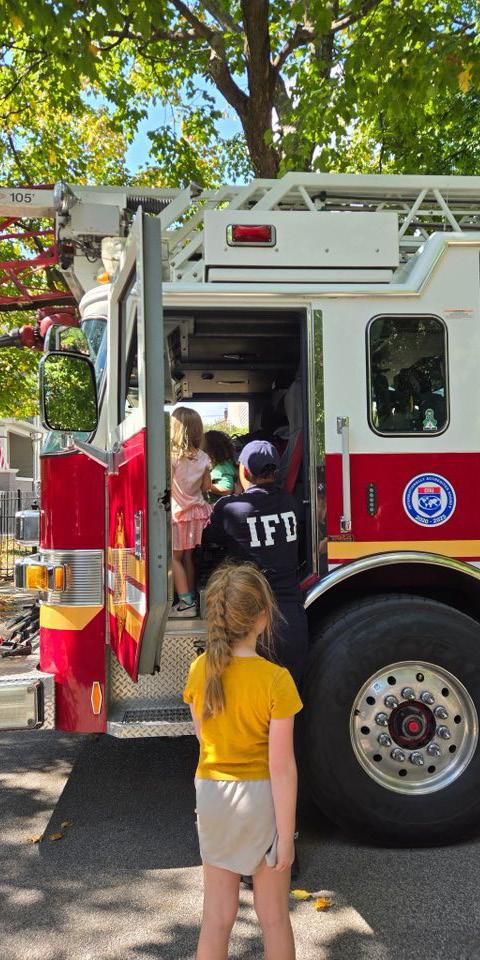
Indianapolis Fire Department
Abigail Hanson Controller, Office of Finance and Management
Megan Vukusich Director, Dept. of Metropolitan Development
Abbey Brands Director, Dept. of Business & Neighborhood Services
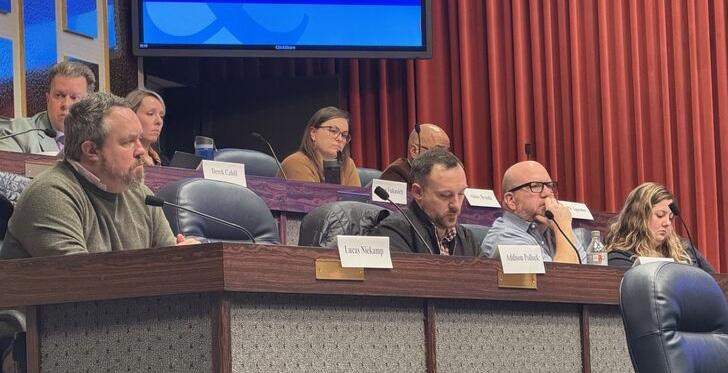
Lucas Niekamp Deputy Prosecutor, Marion Co. Prosecutor’s Office
Dr. William Murphy Chief Operating Officer, Indianapolis Public Schools
Addison Pollock Director of Community Engagement, AARP Indiana
Damon Richards Bicycle Advocate
Brooke Thomas Chief Development Officer, IndyGo
Marc McAleavey Chief Executive Officer, Health by Design
EXECUTIVE SUMMARY
Photo credit: Indianapolis Metropolitan Police Department
Indianapolis is taking bold action to end traffic deaths and serious injuries.
The Vision Zero
Action
Plan sets a clear path to make our streets safer, more equitable, and designed for people, because every life matters.
Indianapolis Vision Zero Chair, John Barth
Background
On August 12, 2024, the Indianapolis City-County Council adopted a Vision Zero Resolution setting a goal to eliminate all fatal and serious injury crashes by 2035.
The resolution called for the appointment of a Vision Zero Administrator in 2025 and the creation of a 15-member Task Force composed of City representatives, partner agencies, and advocacy members to guide a collaborative effort in developing the Vision Zero Action Plan.
Safe System Approach
The Safe System Approach (SSA) is a framework adopted by the U.S. Department of Transportation (USDOT) to eliminate fatal and serious injuries on roadways.
It places safety at the core of how we plan, design, operate, and maintain transportation systems, emphasizing shared responsibility and collaboration. Achieving zero fatalities and serious injuries requires the collective effort of transportation professionals, planners,
first responders, roadway users, and the broader community. The SSA seeks to minimize human error, prevent exposure to crash risks, and reduce the severity of crashes when they occur. This framework is built on five complementary elements: Safe People, Safe Roads, Safe Vehicles, Safe Speeds, and Post-Crash Care; all of which informed the development of this plan.
Current Safety Efforts
During the development of the Action Plan, the consultant team and City staff met with stakeholders and task force members to gain a clear understanding of existing policies, practices, and plans. These discussions highlighted the many positive efforts already underway and revealed opportunities for greater collaboration among agencies across Indianapolis to strengthen and better promote these initiatives. The meetings also helped identify key areas for improvement, which directly informed the action strategies outlined in the Vision Zero Plan.
Peer City Review
In the fall of 2024, the Consultant team and City staff met with several municipalities of similar size that are actively implementing Vision Zero Plans. These discussions focused on their challenges and successes, approaches to funding and staffing, and the scope of their street networks. The key takeaway was that achieving Vision Zero is a longterm effort for all communities; however, despite having comparable populations and land areas, Indianapolis manages a significantly larger street network.
Existing Conditions
To develop effective safety recommendations, existing data was collected and analyzed. Crash data was examined and translated into maps, charts, and graphs to identify critical areas across the city and illustrate the reasoning behind the recommendations included in this plan. The results of this existing conditions analysis informed the creation of the High Injury Network and Vulnerable Road User High Risk Network, highlighting the roadway segments within the City’s jurisdiction that experience the greatest safety concerns.
Equity Analysis
Using data from the American Community Survey, equity factors evaluated included zero-car households, race and ethnicity, poverty status, disability, language other than English spoken at home, and age (65 and older or under 18). Areas with a greater concentration of these factors were identified as Transportation Impacted Neighborhoods (TINs), indicating higher levels of transportation vulnerability. These neighborhoods were compared to the High Injury Network and Vulnerable Road User High-Risk
Photo credit: Indianapolis Michelle Craig for the Indianapolis Cultural Trail
Network to better understand the relationship between crash patterns and communities within the TIN. This analysis helps identify where targeted investments in the transportation network can improve safety and mobility for vulnerable populations who may not always rely on motor vehicles for travel.
Community Engagement
This plan gathered input from stakeholders and the public to determine the biggest safety needs and concerns in Indianapolis. Engagement occurred through various methods including pop-up public events throughout Indianapolis and online tools. Through these engagement opportunities a public survey was distributed, collecting over 600 responses and another 1500 comments on the online map indicating challenges throughout the City’s transportation network.
Action Plan
Strategies and action steps were developed through ongoing collaboration with Task Force members and City partners. These discussions incorporated public input, explored opportunities to strengthen and expand existing efforts, promoted coordination across agencies, and sought to
minimize duplication of work. The draft strategies and action items were shared with the public in June 2025, with feedback collected through August and reviewed with Task Force leaders to inform the set of strategies included in this plan. These strategies mark the beginning of the City’s Vision Zero initiative and are intended to evolve over time as implementation progresses and lessons are learned.
Implementation + Transparency
The City is already moving forward with implementing the strategies in this plan.
Tracking progress and measuring outcomes are essential to the plan’s success. Several of the general strategies emphasize transparency, including the development of a publicfacing website and dashboard to share updates, and report progress and Key Performance Indicators over time. Efforts are not limited to these strategies. This approach will continue to evolve as we learn from what works well and identify where adjustments are needed in this ongoing, steadfast commitment to ensuring everyone reaches their destination safely.
Indy’s Progress Towards Vision Zero
AUGUST 2024
Vision Zero Ordinance passed and Task Force established Burgess & Niple consultants hired as Vision Zero lead consultants.
OCTOBER 2024
FALL 2024 –WINTER 2025
Peer City Review conducted
Department/Agency/ Task Force member interviews to assess Vision Zero opportunities and concerns
First Vision Zero Public Task Force Meeting
FEBRUARY 2025
Second Vision Zero Public Task Force Meeting
Crash Data Analysis begins
MARCH –APRIL 2025
Indy Vision Zero Community engagement: Pop-up events and online portal conducted
Indy’s progress towards Vision Zero has been a robust and collaborative effort, bringing together a broad coalition of partners, stakeholders, and the community working together towards a common vision for a safer city.
MAY 2025
Vision Zero Administrator hired
JULY 2025
Public comment and feedback period on Draft Action Plan Strategies collected online
FALL 2025
Develop narrative to support Action Plan Strategies for adoption
JUNE 2025
Third Vision Zero Task Force meeting
Draft Action Plan Strategies presented to Task Force and public
AUGUST –SEPTEMBER 2025
Review and refinement of draft strategies in the Action Plan, incorporating public comments and additional feedback from Task Force members.
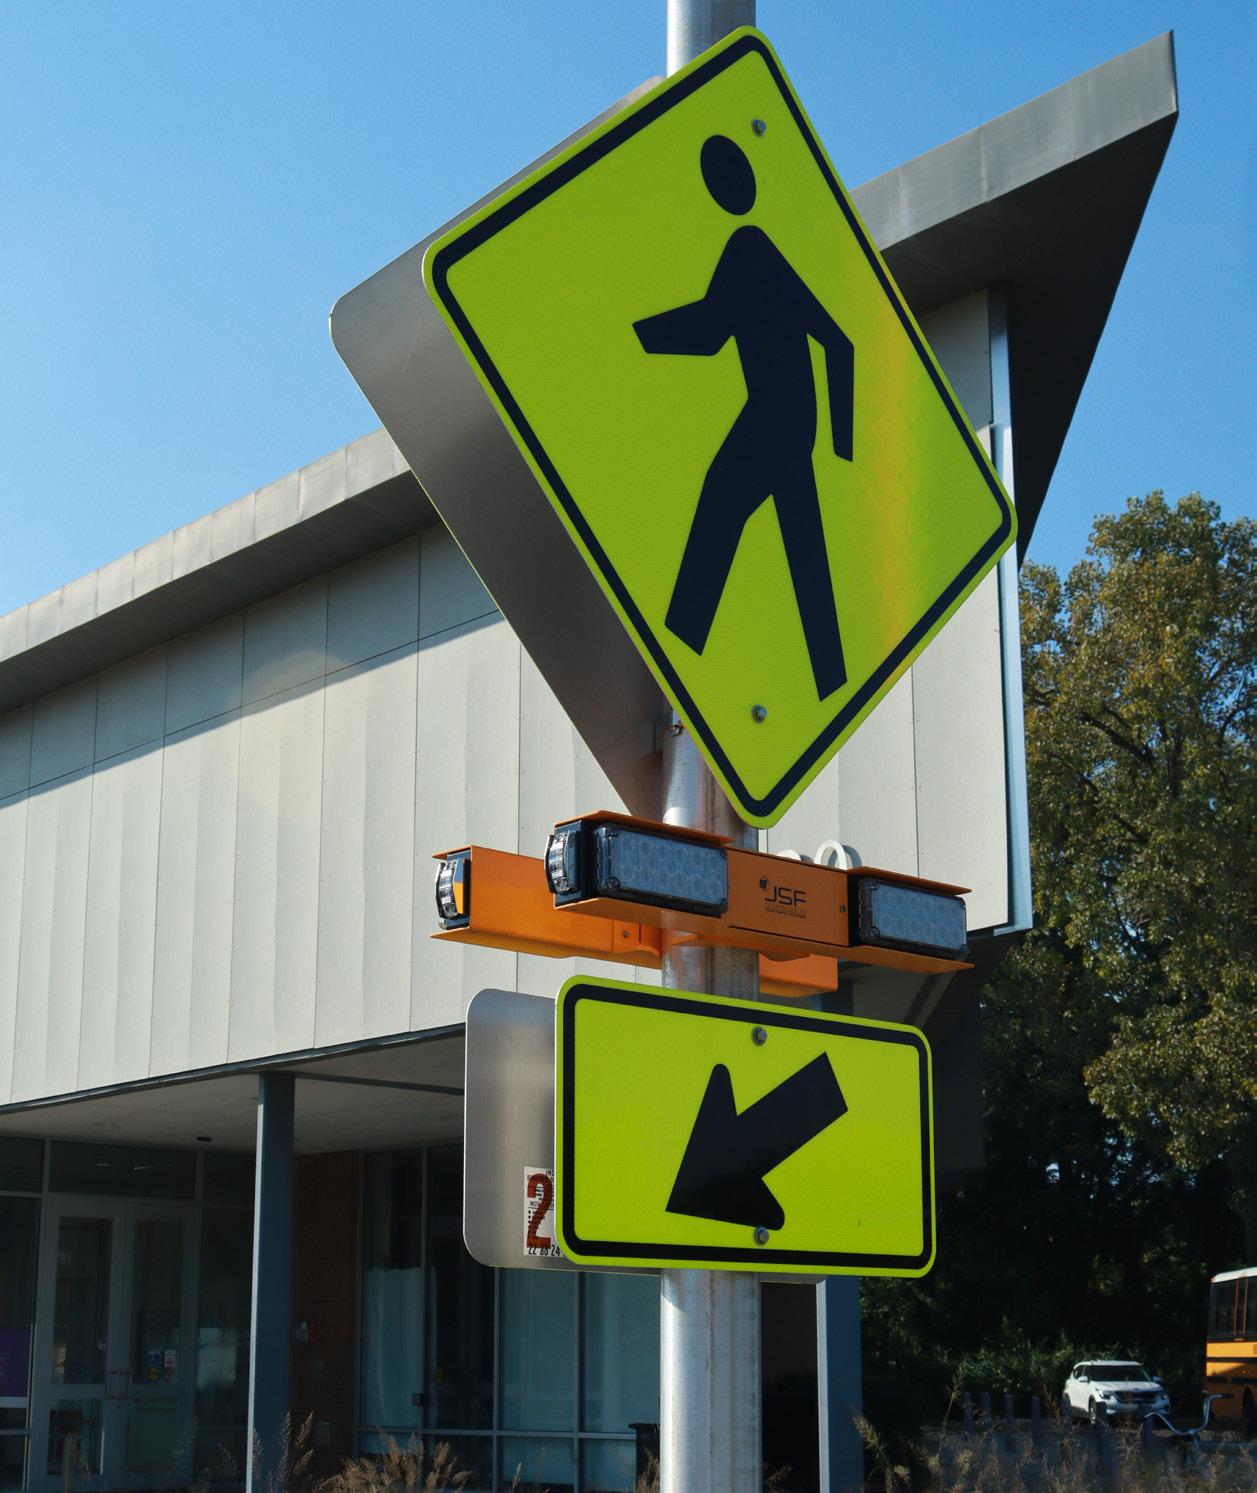
WHAT IS VISION ZERO?
Photo credit: Indianapolis Department of Public Works
What is Vision Zero?
Vision Zero is a global initiative to eliminate trafficrelated deaths and serious injuries. By rethinking how we design and use our streets, we aim to create a safe environment for everyone, whether walking, biking, driving, or taking public transit.
Vision Zero Goals
Eliminate traffic fatalities
Use proactive strategies to prevent deaths on our roads.
Design Safer Streets & Prioritize Safety through Policy
Prioritize accessibility and safety for all users.
Empower the Community
Collaborate with residents, organizations, and policymakers to foster a culture of safe, inclusive transportation.
Every resident deserves access to safe and reliable transportation and every injury is preventable.
Vision Zero Indianapolis is a bold, collaborative effort to ensure everyone can travel safely. By working together, we can make Indianapolis a place where people feel safe and confident moving through the city.
How do we reach Zero?
The Safe System Approach endorsed by the U.S. Department of Transportation recognizes that human error is inevitable, but death and serious injury are not. It’s based on six principles:
DEATH & SERIOUS INJURY ARE UNACCEPTABLE
Focus on preventing the most severe crashes.
PEOPLE MAKE MISTAKES
Design systems to anticipate and accommodate human error.
PEOPLE ARE VULNERABLE
Lower speeds and safer design reduce harm in crashes.
SHARED RESPONSIBILITY
Everyone, from system designers to road users, plays a role.
PROACTIVE SAFETY
Address risks before crashes occur.
REDUNDANCY SAVES LIVES
Multiple safety layers protect users when one part fails.
The Five Elements of a Safe System
Safe People
All road users—drivers, pedestrians, cyclists, transit riders—must act responsibly. Education, enforcement, and engagement promote safe behavior and awareness.
Safe Speeds
Lower speeds reduce both crash risk and injury severity. Street design, speed limits, and land use should be considered to encourage appropriate travel speeds.
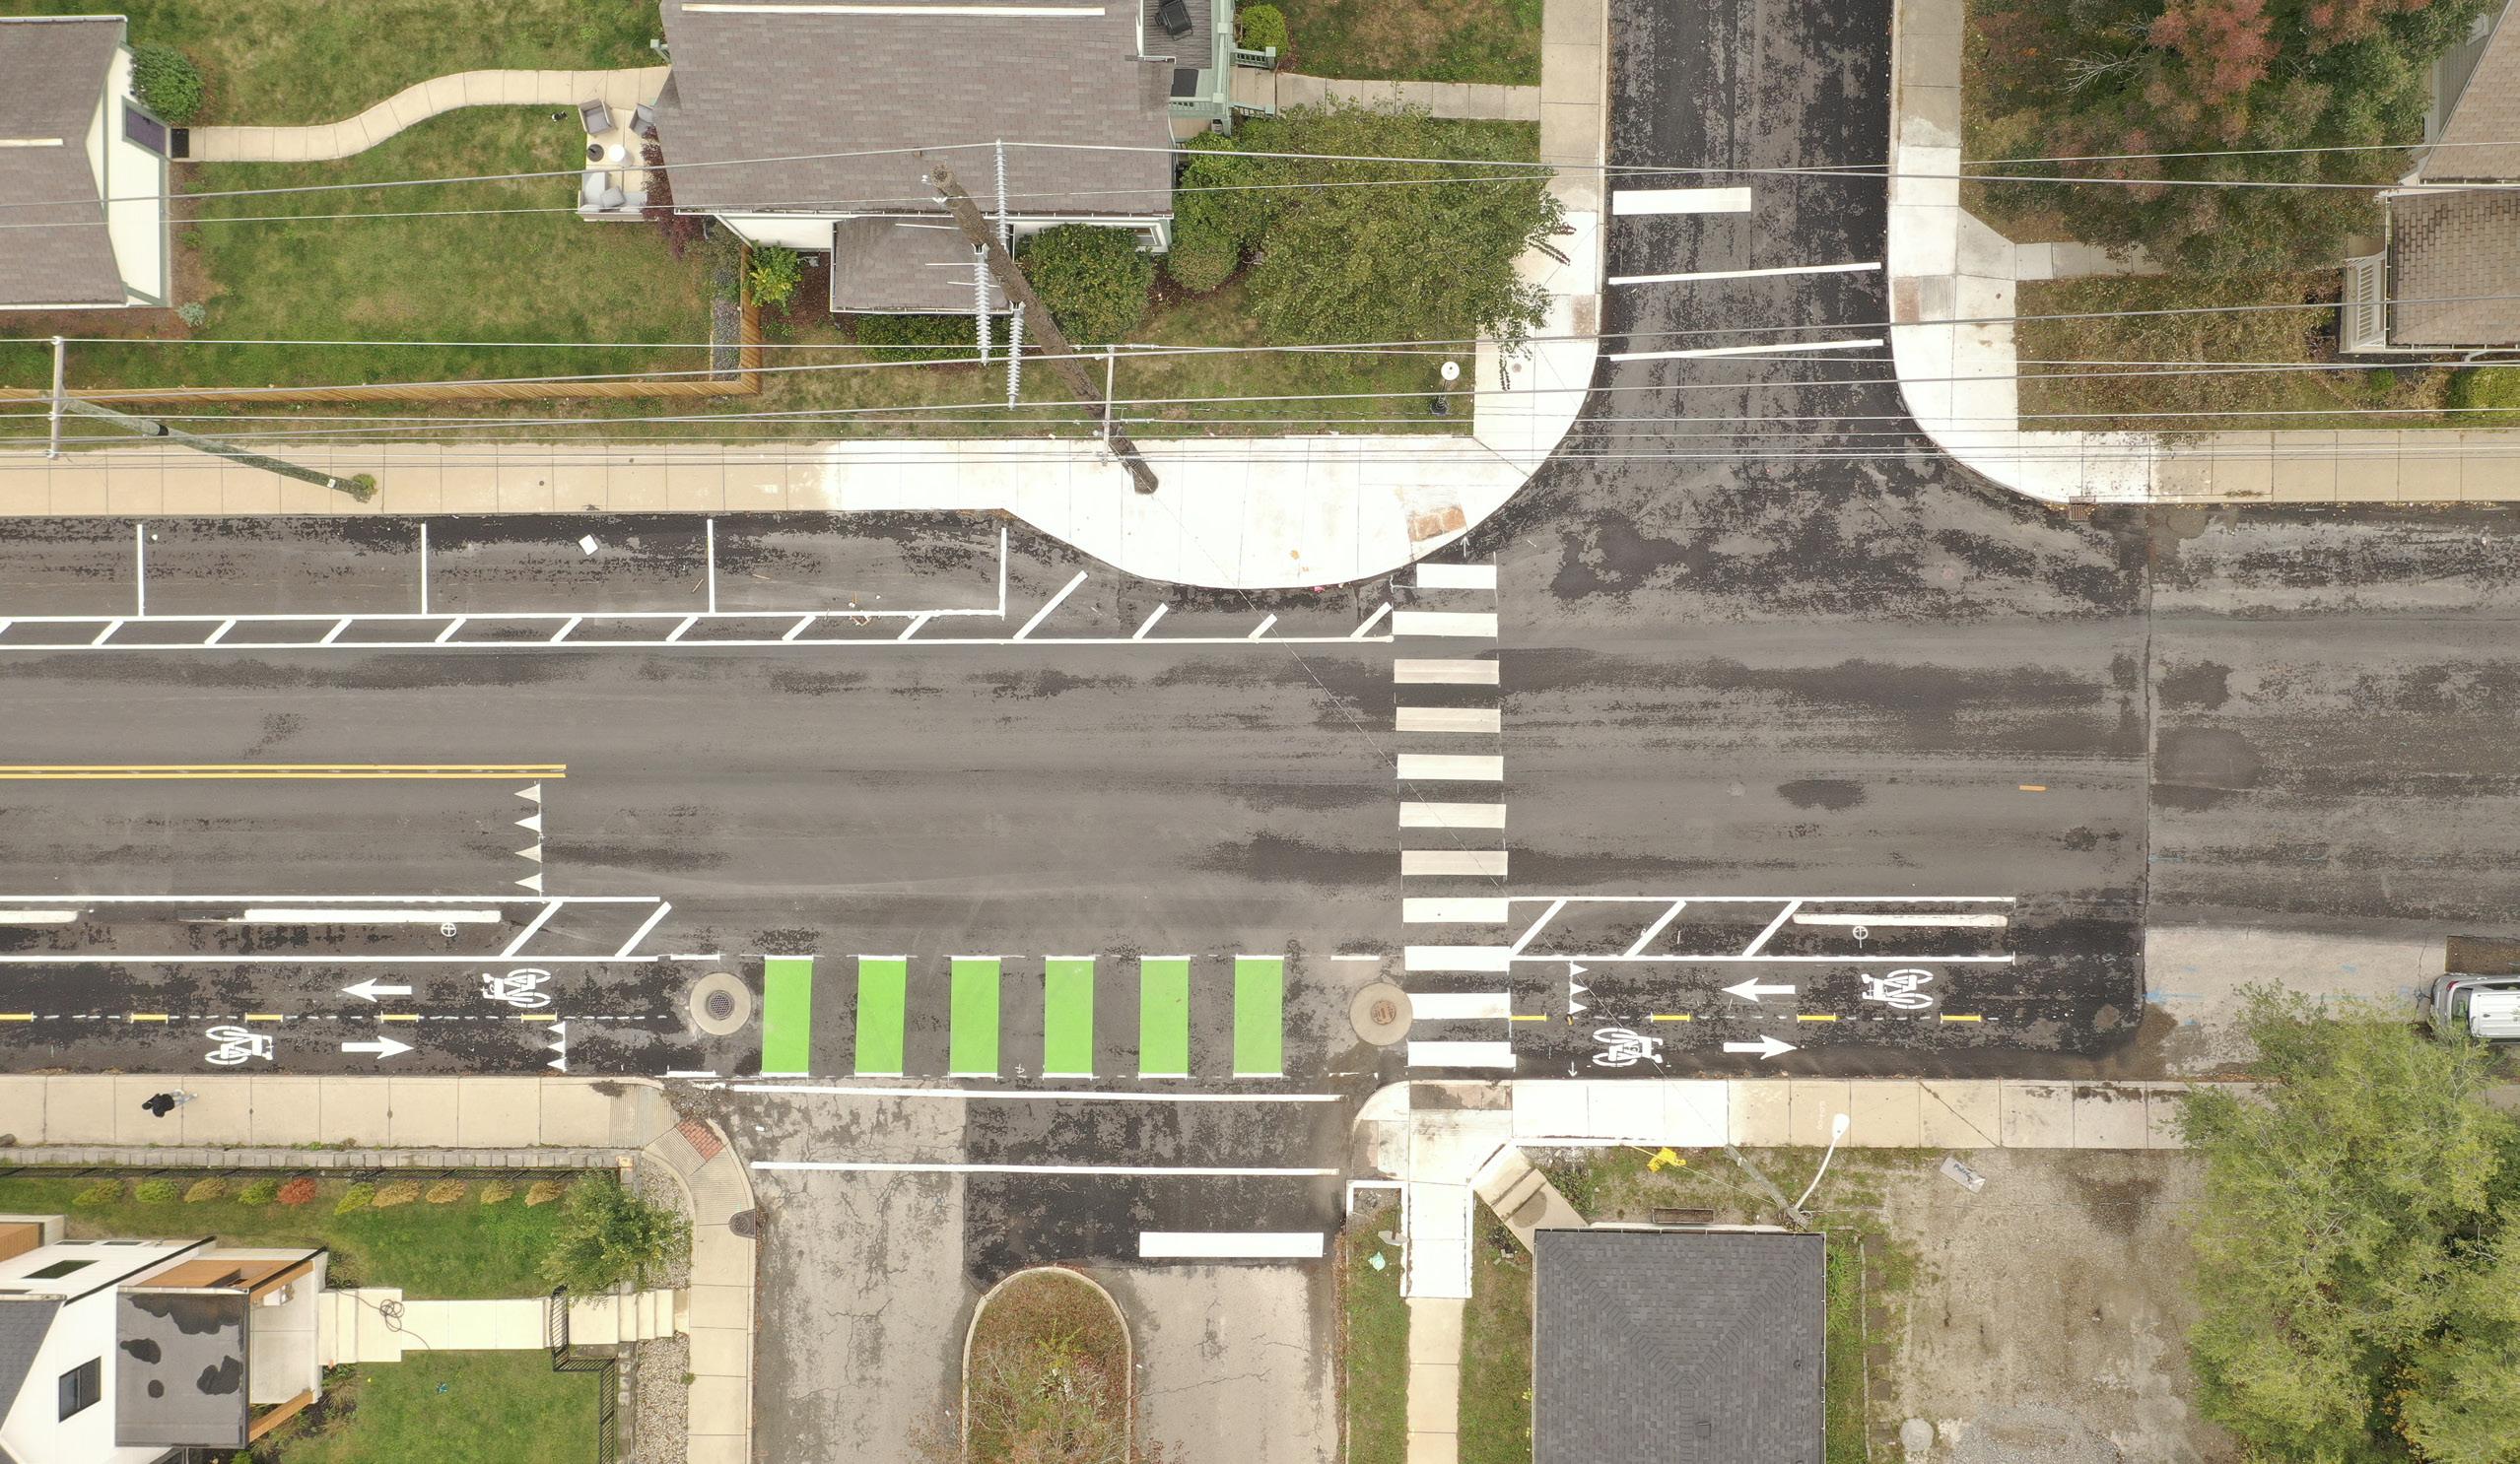
Safe Roads
Streets should be designed to minimize crash risk and protect users through features like protected bike lanes, medians, crosswalks, and traffic calming.
By layering these elements to create redundancy, the system becomes more forgiving. If one component fails, the others help prevent a crash and minimize harm if one occurs.
Safe Vehicles
Modern vehicle technologies like emergency braking, lane departure warnings, and airbags help prevent crashes and reduce injury severity, protecting both occupants and others.
Post-Crash Care
Timely emergency response and trauma care are critical to saving lives and improving recovery after a crash.
Shared Responsibility
Achieving zero deaths requires everyone’s involvement:
Designers and Engineers must build safe, inclusive infrastructure.
Policymakers must support effective laws and enforcement.
First Responders must act quickly when crashes happen. Community Members must make safe choices and look out for others.
This shared responsibility shifts the focus from blaming individuals to creating systems that prevent crashes from being fatal. This approach creates multiple layers of protection through safe road design, safe speeds, safe vehicles, safe road users, and effective post-crash response. For example, if someone makes the mistake of misjudging a turn or drifting out of their lane, effective roadway design and speed management can help prevent a fatal outcome. In contrast, unsafe behaviors such as choosing to drink and drive or deliberately speeding are violations of the rules and laws of the road that increase risk. Even when a crash occurs, vehicle safety features (like airbags), quick access by first responders, and rapid medical care, such as “Stop the Bleed” intervention and transport to a trauma center, can mean the difference between life and death.
Shifting the Mindset
Vision Zero is...
• A long-term commitment to a safe, equitable transportation system
• A data-driven, proactive approach that anticipates human mistakes
• A systems-based strategy that prioritizes prevention over punishment
Vision Zero is not...
• About blaming individuals or expecting perfect behavior
• Eliminating mobility
• A short-term or temporary initiative
• Optional for certain neighborhoods or groups
• Based on outdated assumptions or reactive measures
Traditional Approach
Traffic deaths are inevitable
Requires perfect human behavior
Prevents crashes
Individual responsibility
React based on crashes
Safety vs. mobility
The data makes it clear: what we’ve been doing isn’t working. More people are dying. Change is essential.
Vision Zero
Traffic deaths are preventable
Designed for human mistakes
Prevent fatal & severe crashes
Shared responsibility
Proactively addresses risks
Only “Safe Mobility”
By embracing Vision Zero and the Safe System Approach, we commit to designing a transportation system that forgives mistakes and protects lives, because no loss of life on our streets is acceptable.
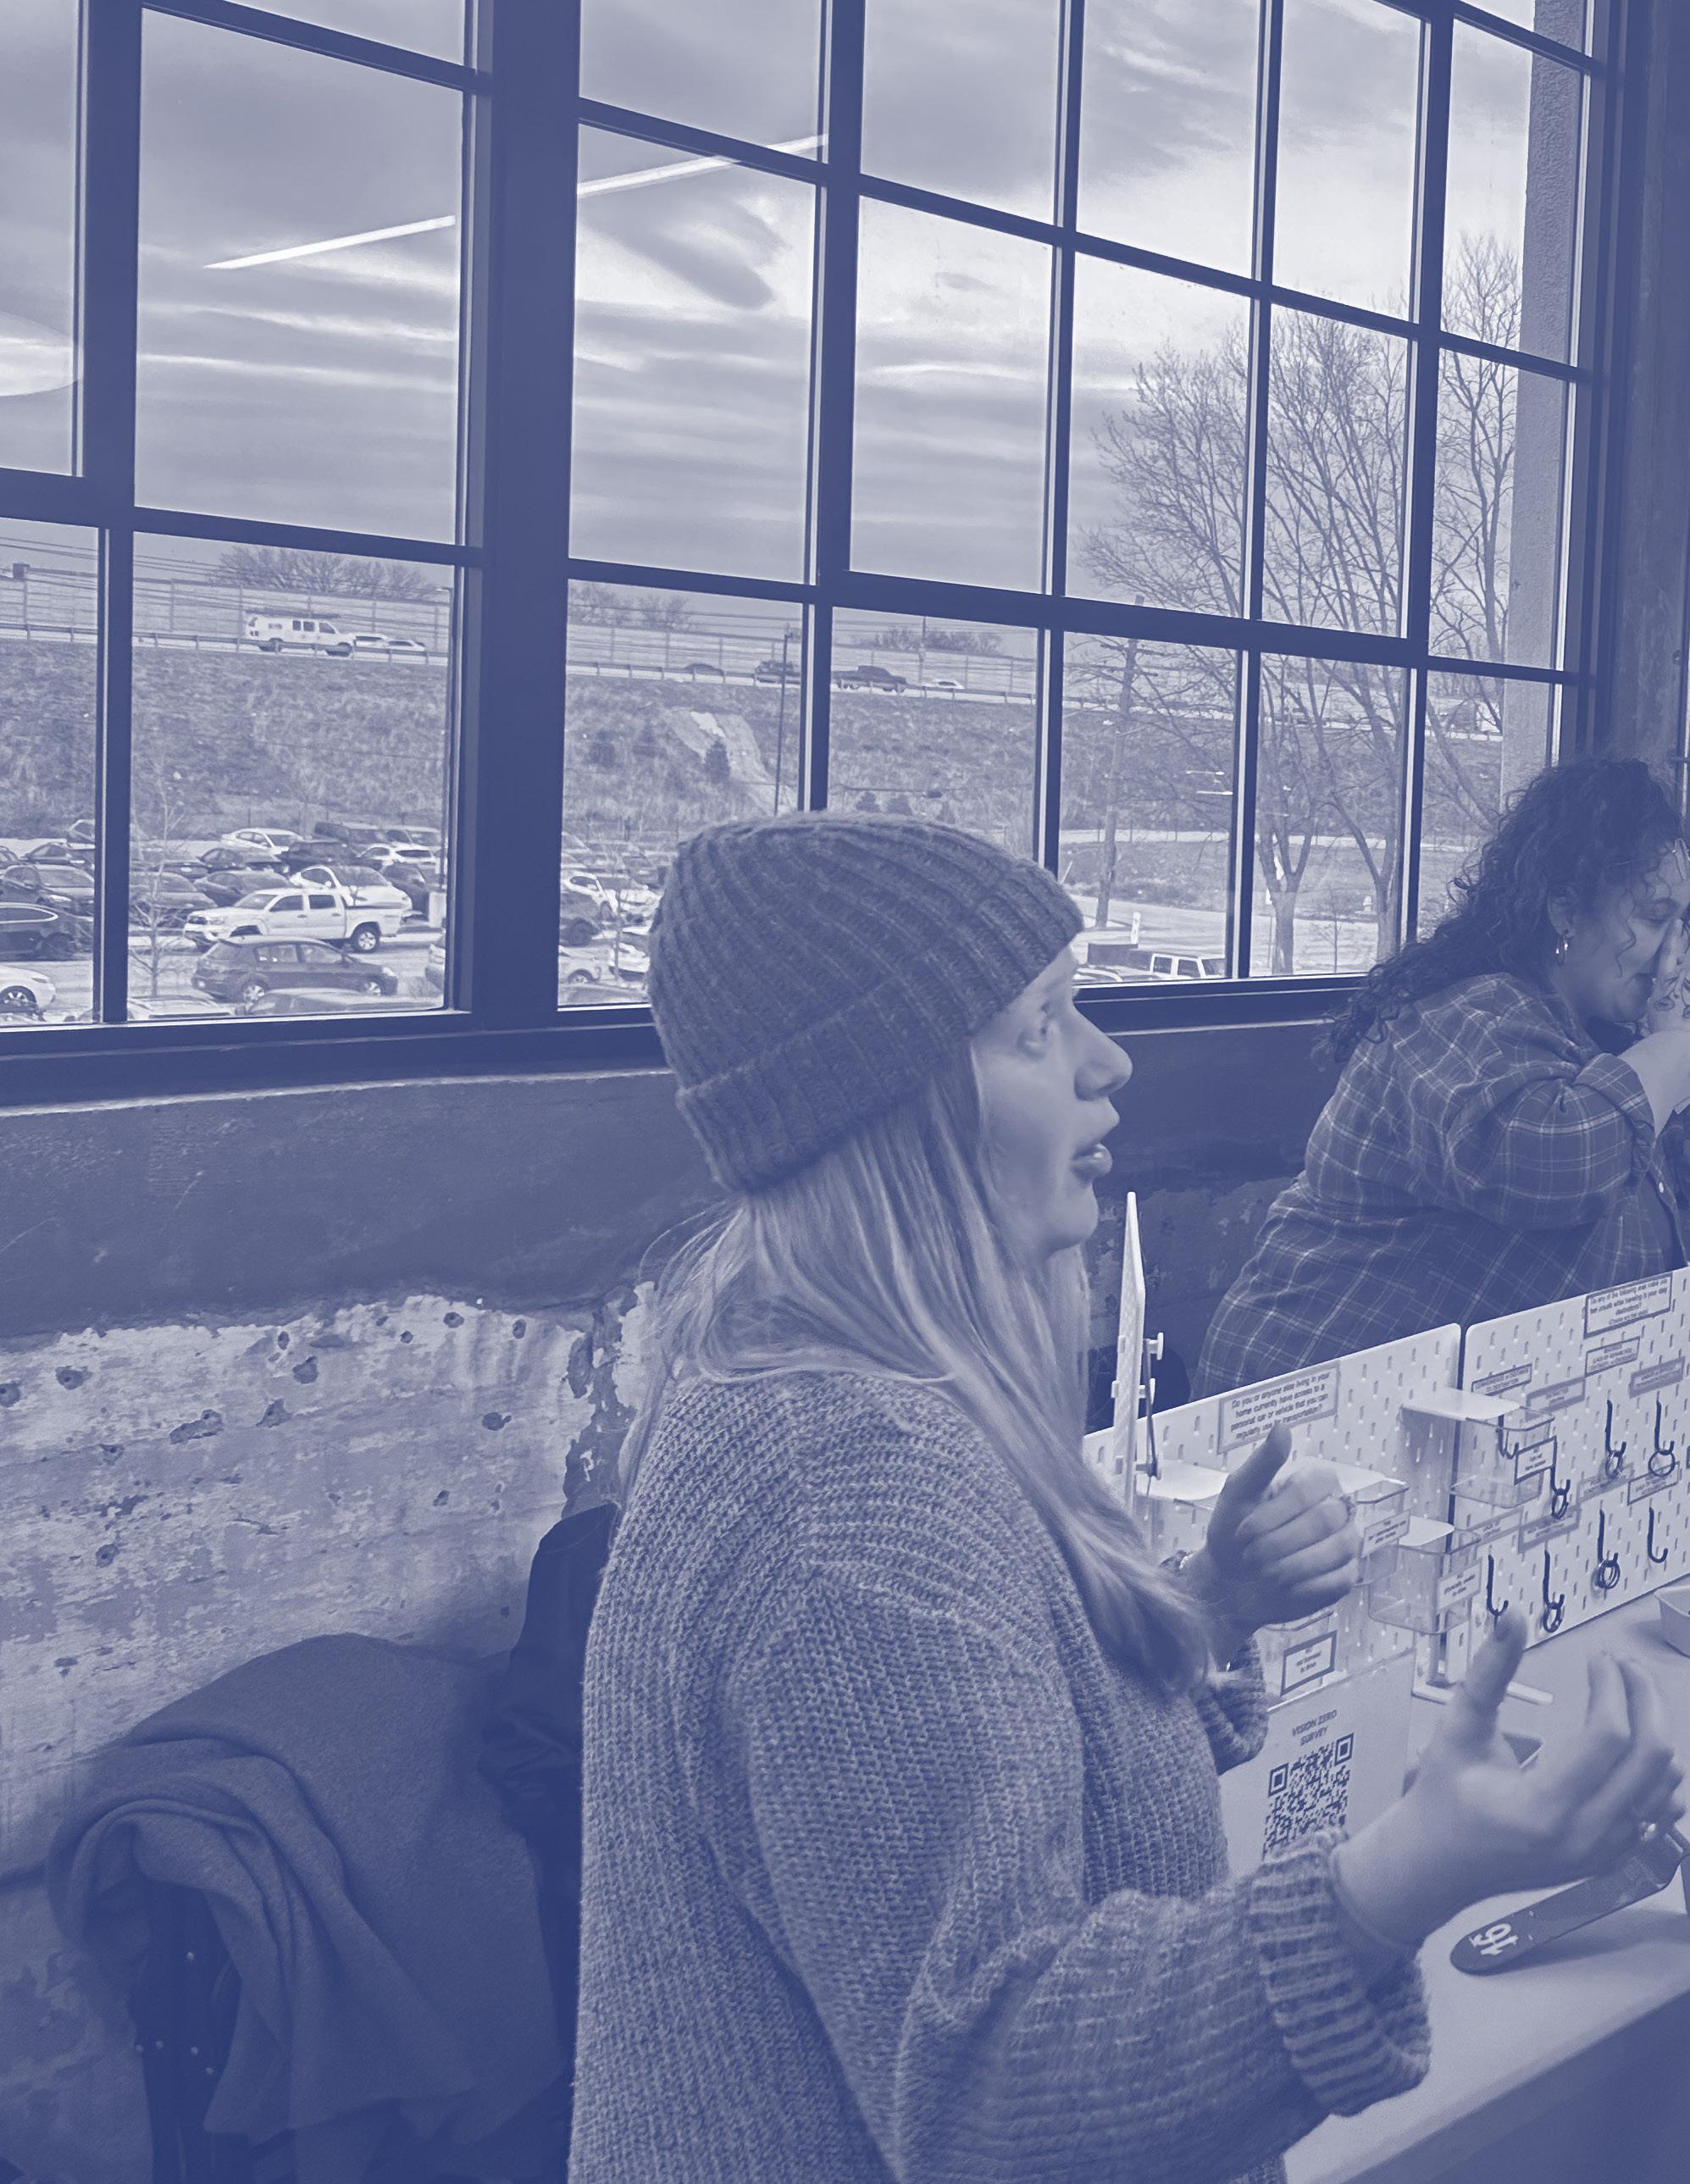
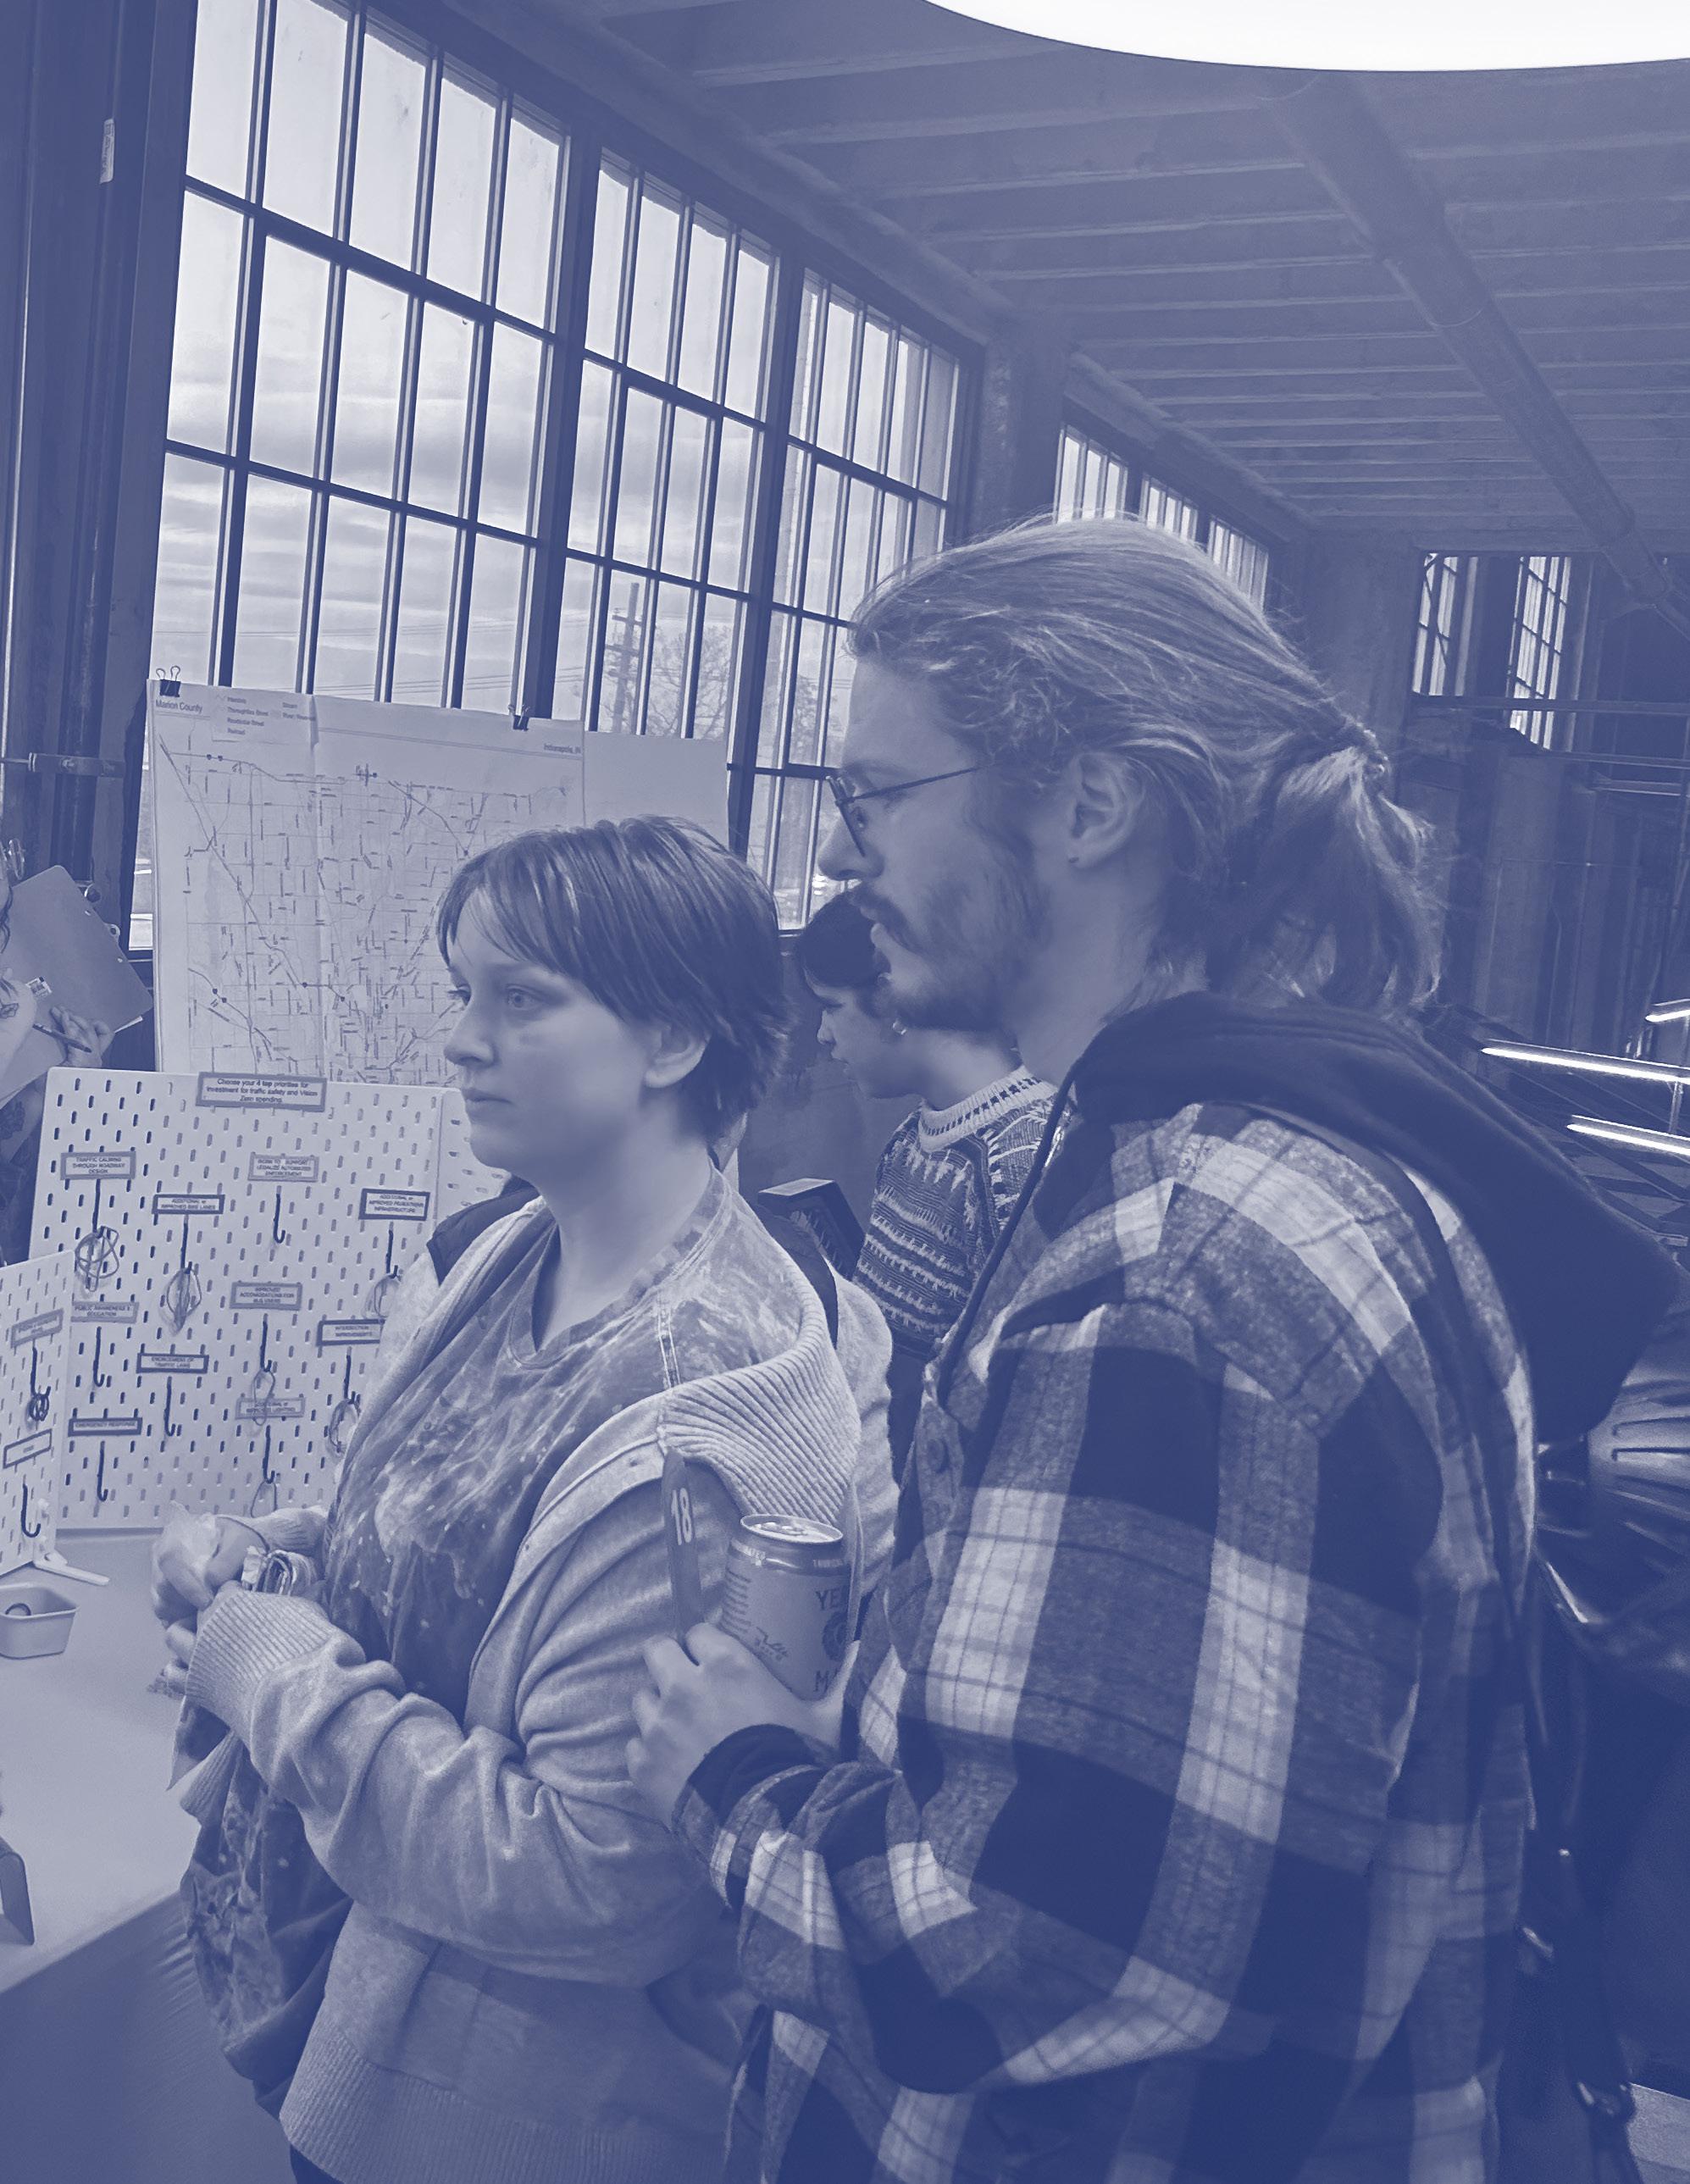
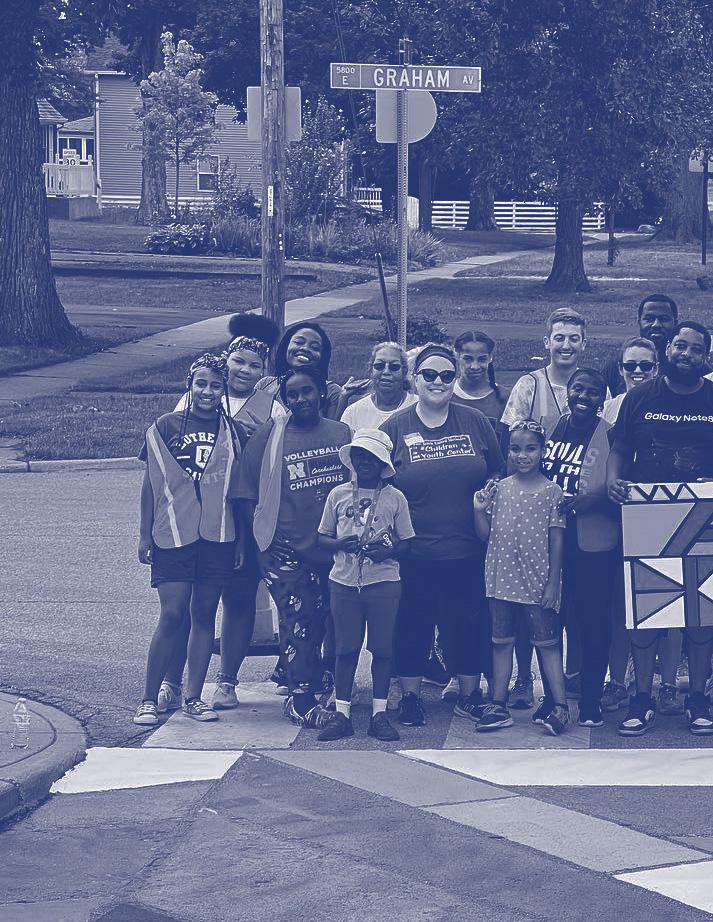
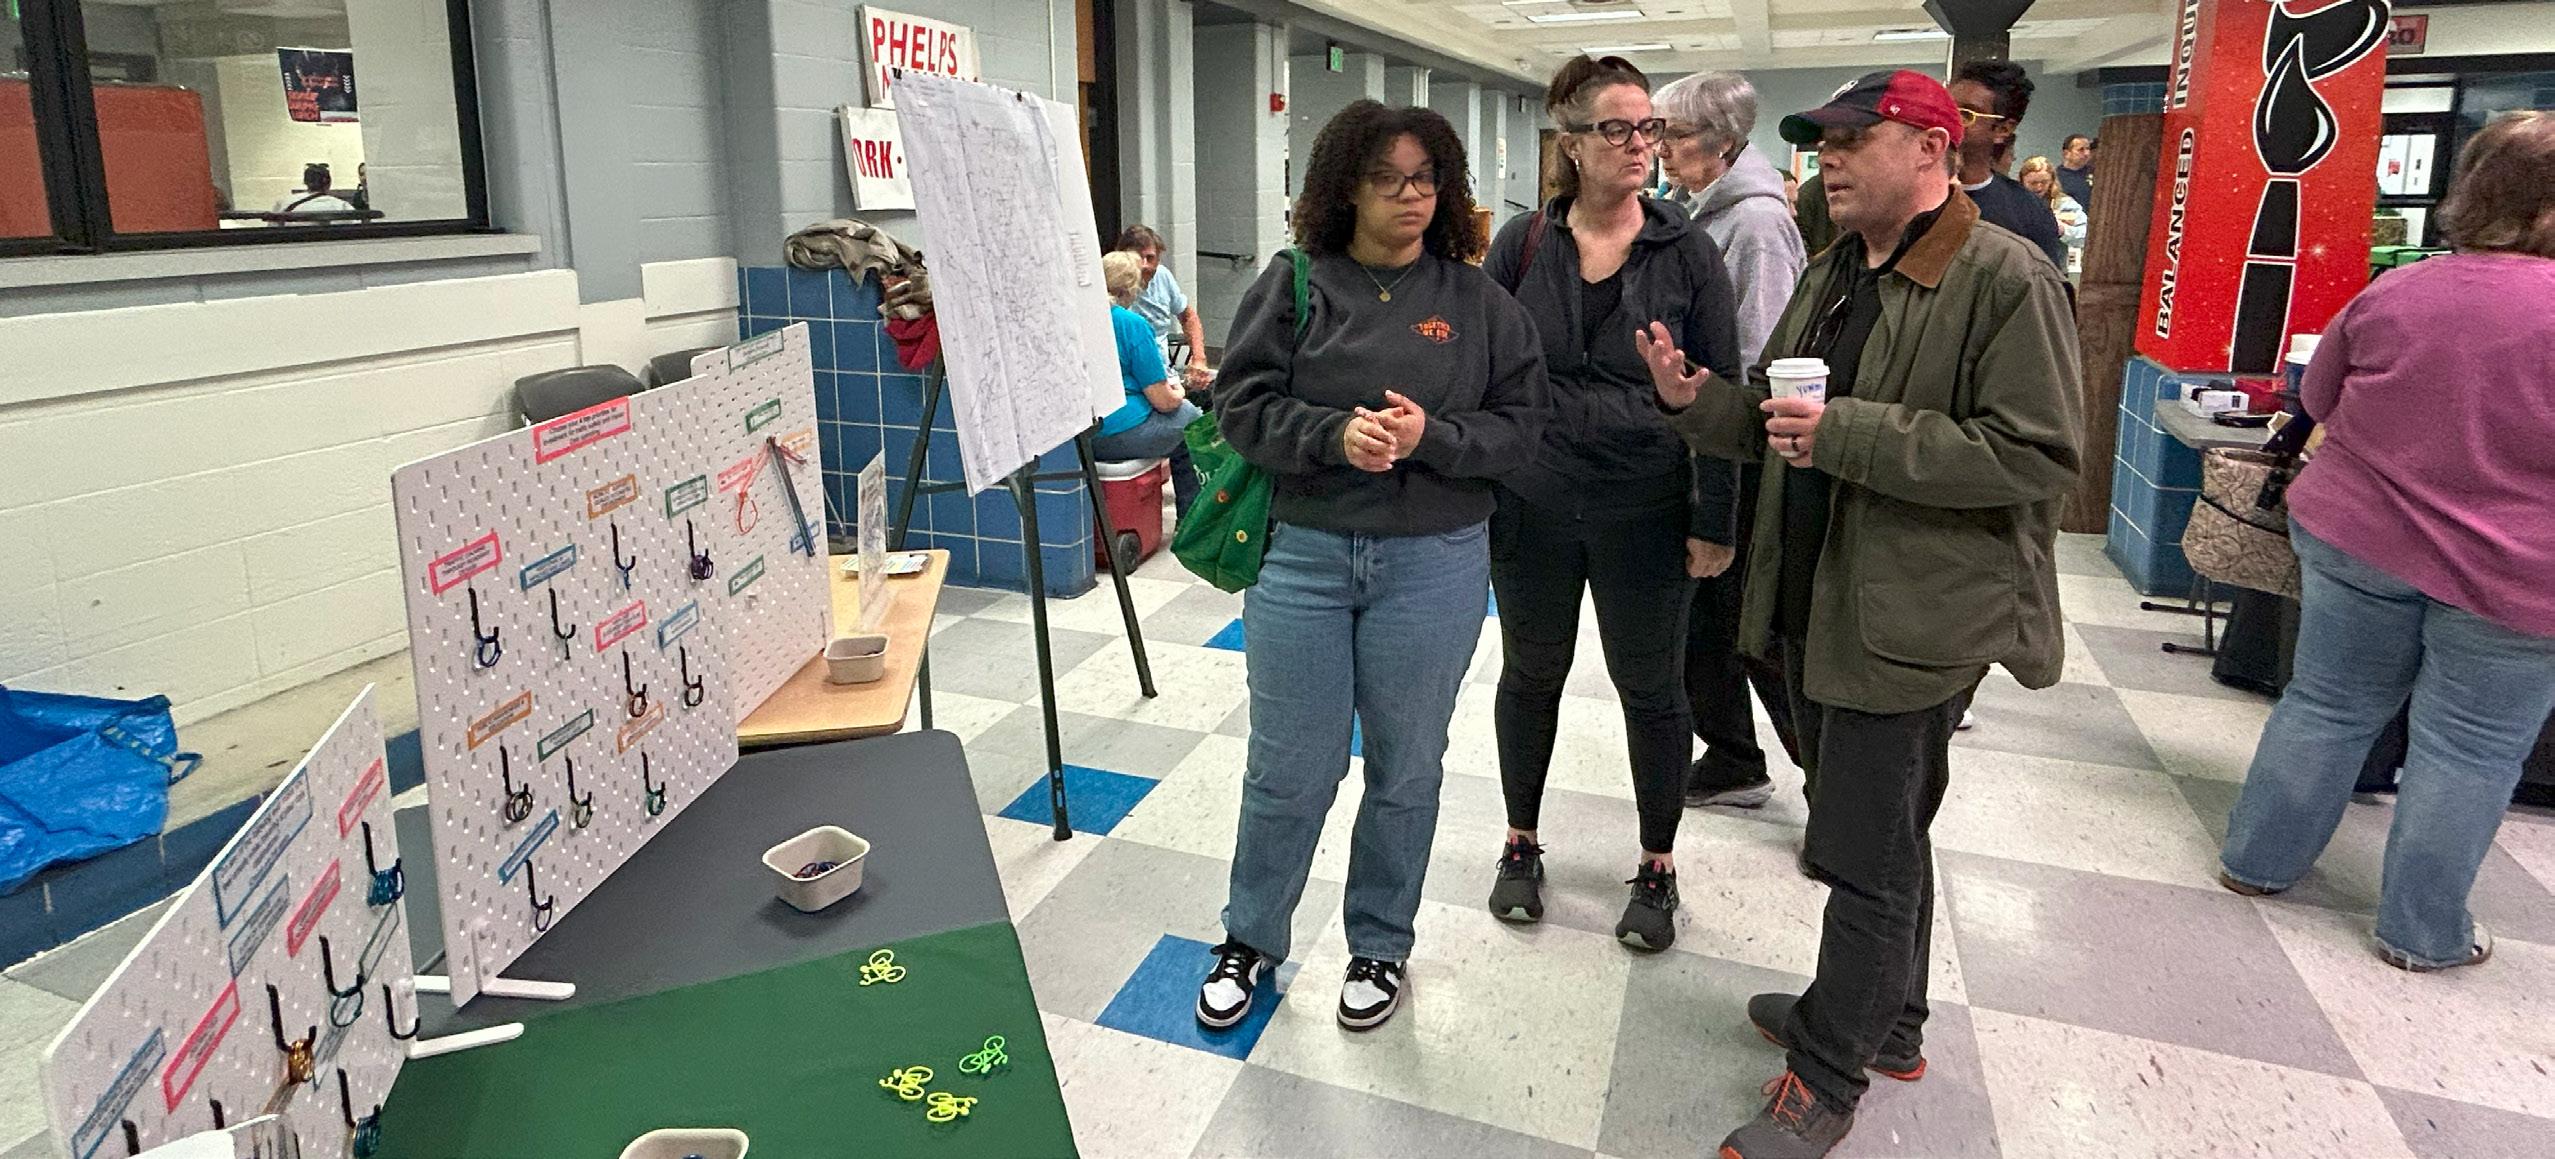
COMMUNITY ENGAGEMENT
Photo credit:Health by Design
Community Engagement
Vision Zero is not just a City initiative. It’s a community-wide commitment to safety, accountability, and shared responsibility. Achieving zero traffic deaths and serious injuries requires every voice, every perspective, and every neighborhood to be part of the conversation.
Community engagement ensures that the strategies within the Vision Zero Action Plan reflect the real experiences of people who walk, bike, drive, and take transit across Indianapolis every day. Residents know their streets best: where they feel unsafe to cross, where speeding is common, or where better lighting, signage, or sidewalks could make a difference. Listening to those lived experiences is essential to designing safer streets for everyone.
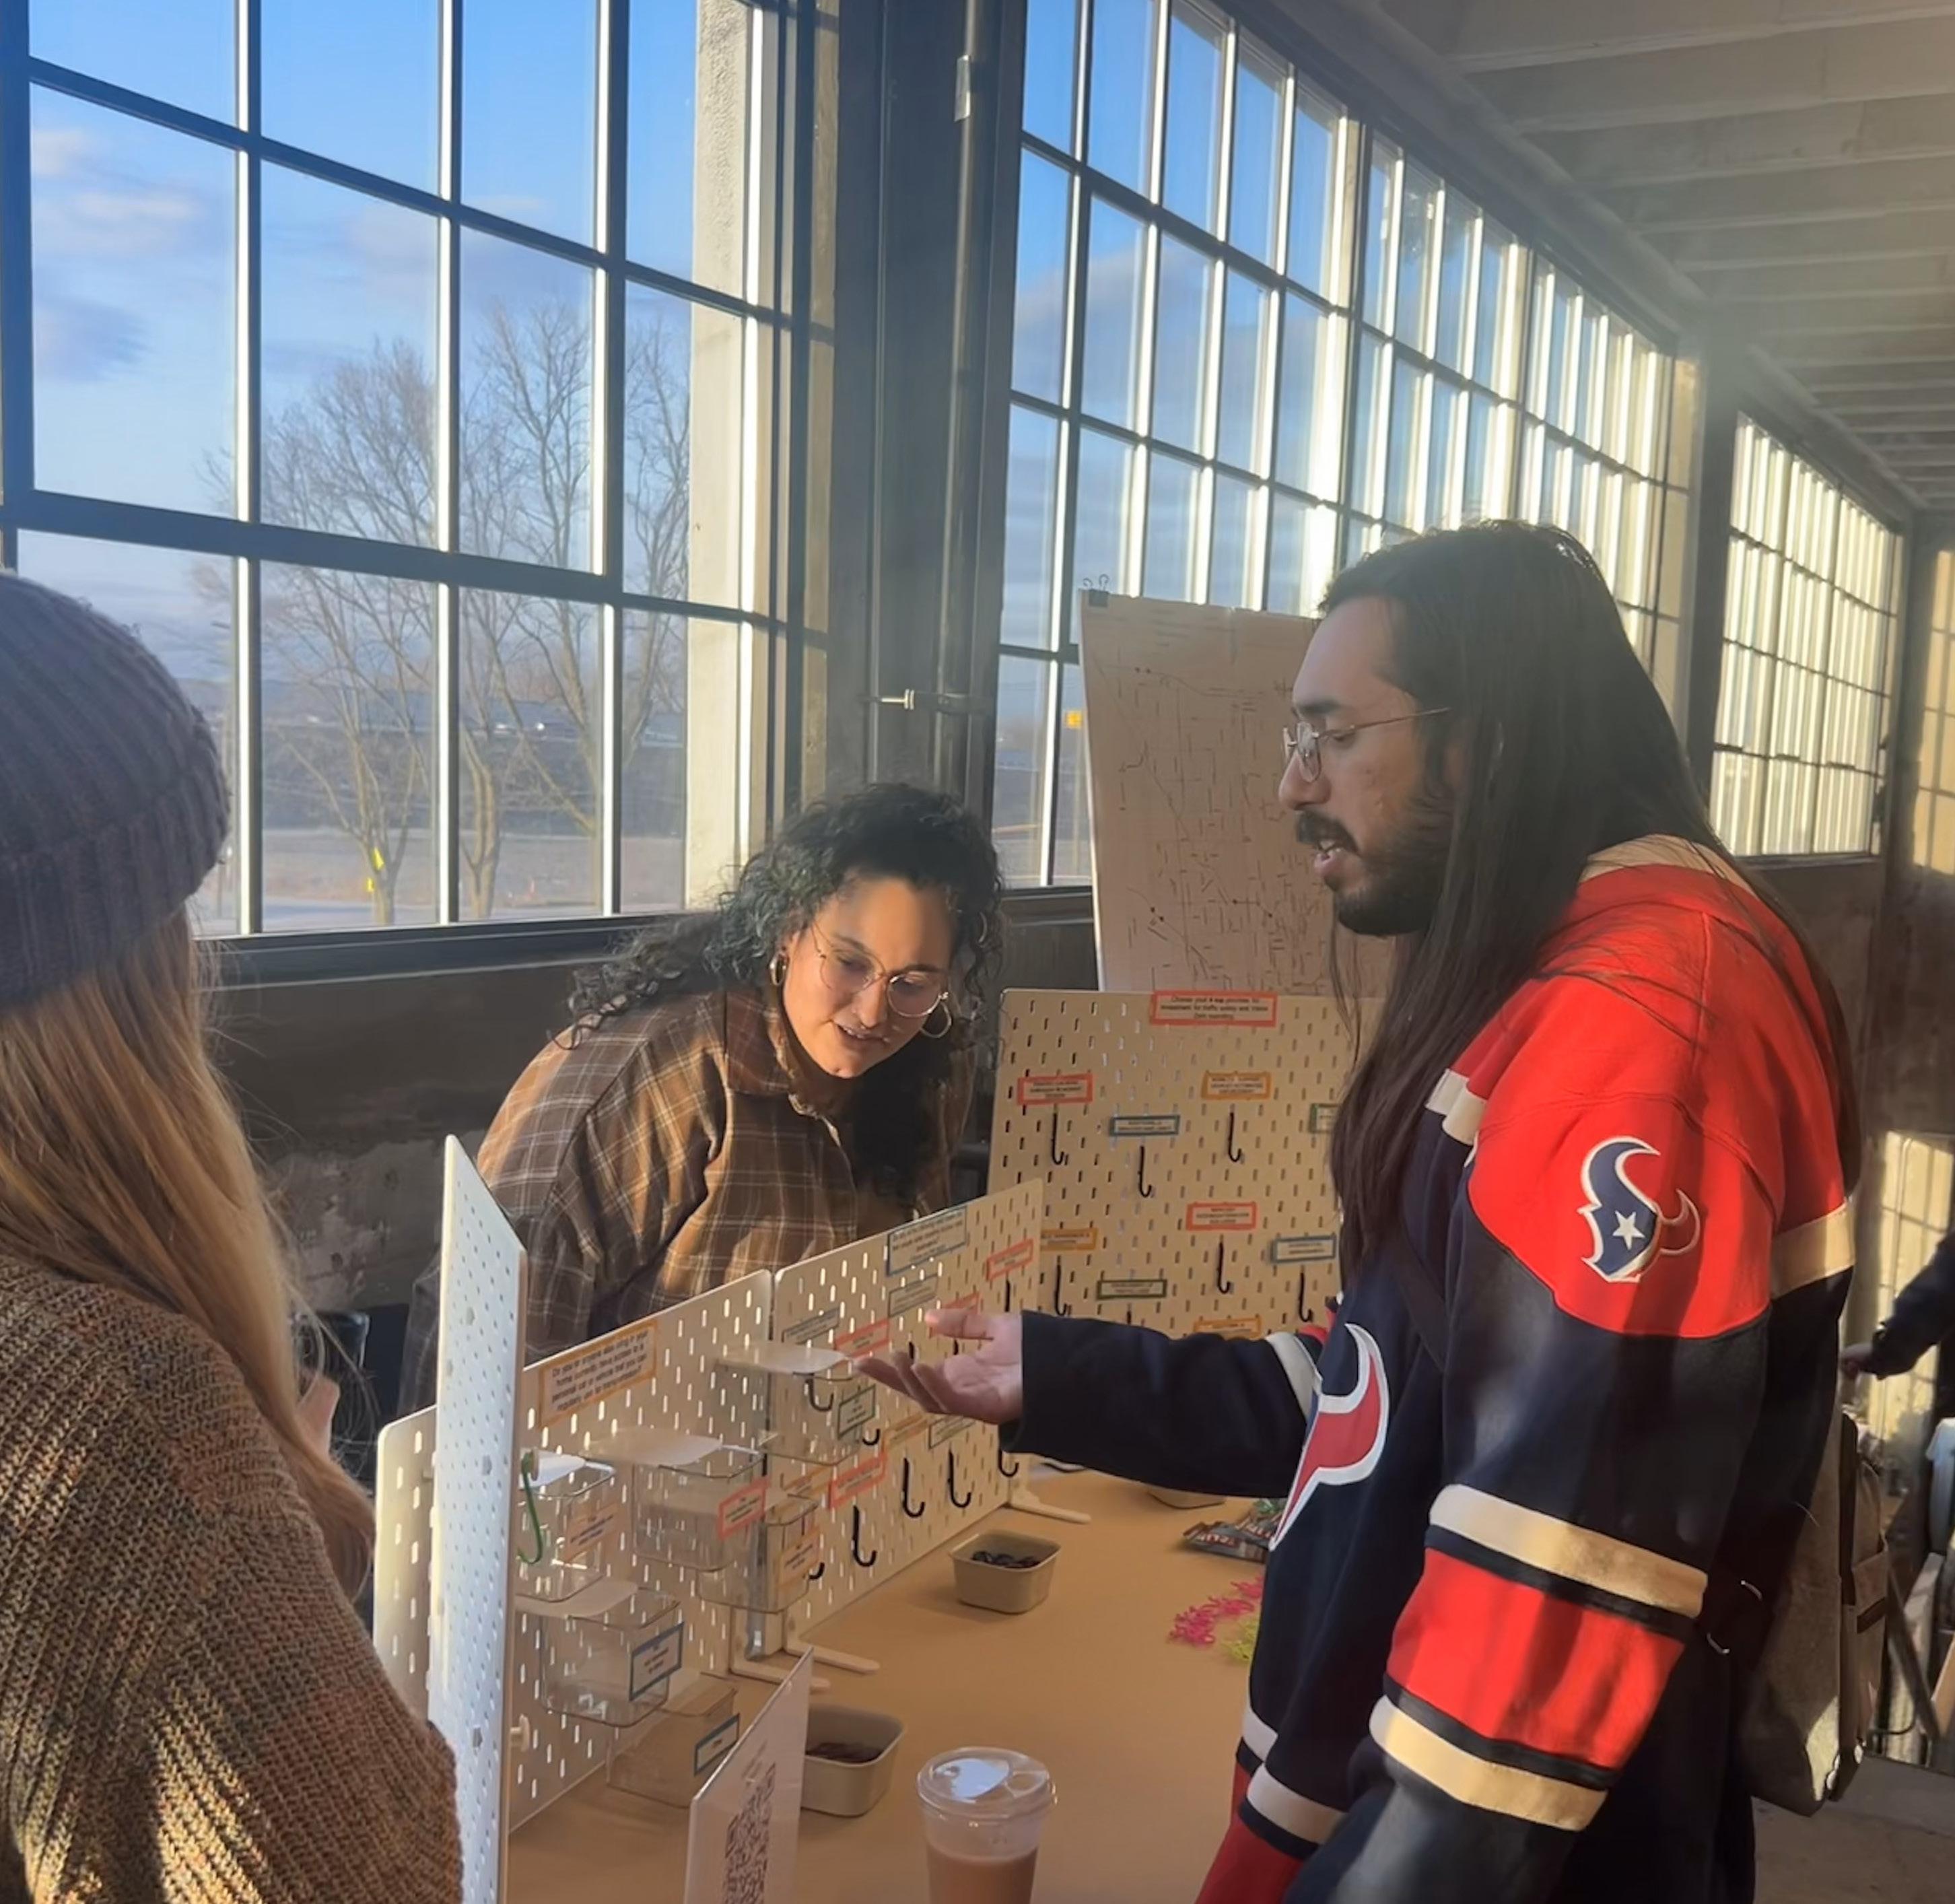
To advise this plan, our partners at Health By Design lead community engagement efforts to inform the Taskforce on the community’s perspective. It was imperative to hear the needs and concerns of members of the public. To do so, engagement opportunities were conducted inperson and online:
• Online survey and tool open for 6+ weeks
• 19 in-person “pop-up” events
• At least 1 event held at in each Marion County Township
• Over 600 flyers distributed at 7 events
• Advertised through press releases and social media.
• 289 people engaged in-person; 339 online
• 490 respondents left nearly 1500 “Mark Up the Map” comments indicating locations with challenges.
Participants were asked:
• How they travel?
• Their ability access to a vehicle?
• Their concerns around traffic safety?
• Priorities for Indy Vision Zero?
• How they’d prefer to travel if conditions changed.
Photo credit:Health by Design
MODES OF TRAVEL
Although the most common mode of commuting for residents is by motor vehicle, not all individuals have access to a car. If conditions were improved, a greater number of people would opt for biking or public transit and would prefer to drive less.
Survey respondents priorities included pedestrian and bike infrastructure, traffic calming, intersection improvements, and enforcement of traffic laws to help improve traffic safety.
Throughout the development of this plan, the City provided multiple opportunities for the public to express their opinions and give feedback about the Indianapolis transportation system. Community members participated through surveys, neighborhood engagements, pop-up events, and interviews with Taskforce representatives.
These diverse forms of engagement helped identify priority areas, shape policy recommendations, and strengthen the transparency and accountability of the Action Plan.
As the Action Plan Strategies are implemented, input and comments from the public can be reviewed and incorporated as appropriate.
How will public comments be used?
The input directs where/how funding should be prioritized, like building more sidewalks, traffic calming measures, or increased enforcement.
Mapped comments also highlight specific issues that practitioners can consider when implementing strategies such as need for improved crosswalks or signal improvements. Many of the comments aligned with High Injury Network, confirming the need to make improvements along these corridors.
COMMUNITY PRIORITIES FOR INVESTMENT
Pedestrian Infrastructure
Traffic Calming
Intersection Improvements
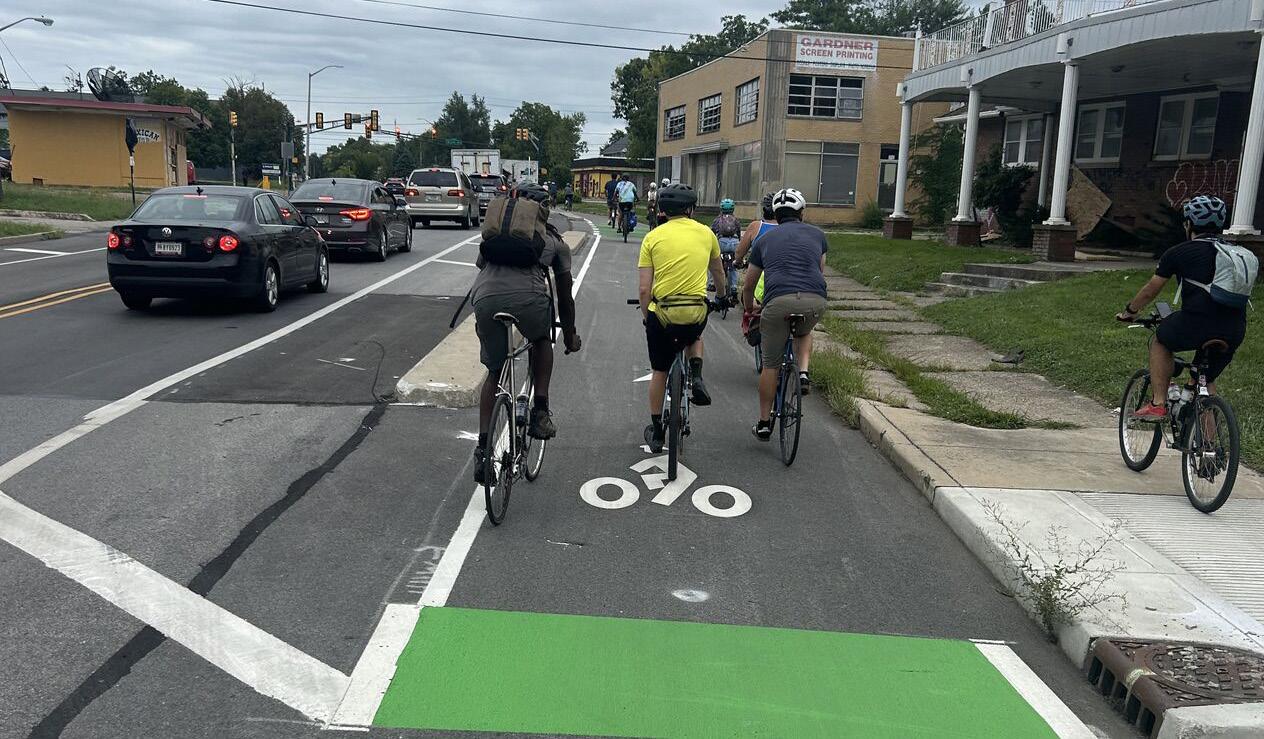
Bike Lanes
Enforcement of Traffic Laws
Public Awareness/Education
Lighting
of Speed Cameras
Survey participants were asked to select their five main priorities.
Engagement Locations
Township Location
Center North Mass Boulder
Center INRC/Neighbor Power Indy
Washington Indiana Food Pantry Summit
Washington Broad Ripple Farmers Market
Wayne Marian University
Center Be The Change Summit
Pike Michigan Road Branch
Lawrence Lawrence Library Branch
Perry Southport Library Branch - MNA office hours
Wayne International Marketplace Coalition/ Global village
Township Location
Washington Butler University
Franklin Franklin Road Library Branch
Decatur Goodwin Center (two shifts)
Decatur Decatur Library Branch
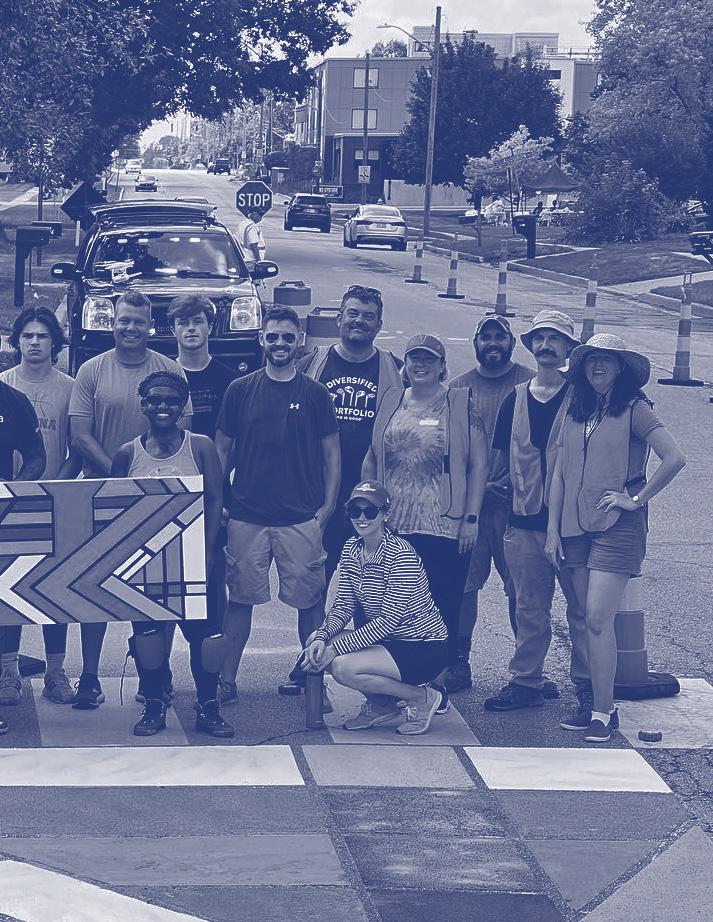
Perry Great UIndy Cleanup
Warren Councilor Nielsen’s Office Hours at Irvington Library
Center
Center
Center
Exodus Refugee Center
Julia Carson Transit Center - AM
Julia Carson Transit Center - PM
Pop-up Engagement
Pop-up engagement location
Public input locations
Transportation-Impacted
Neighborhoods
most impacted least impacted
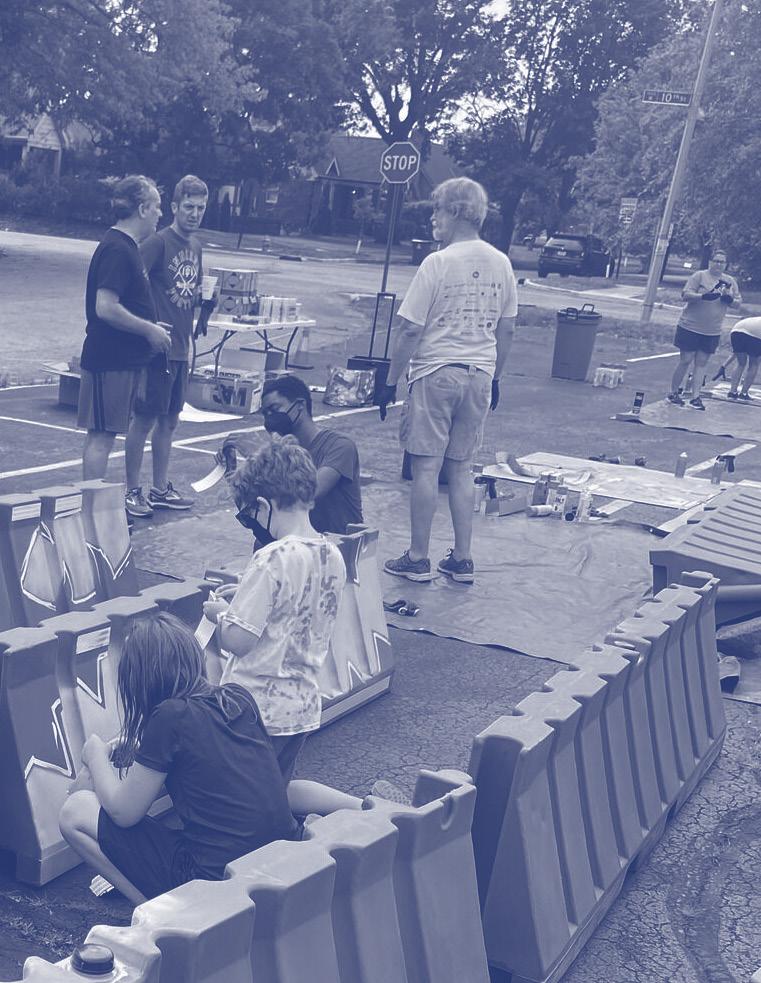
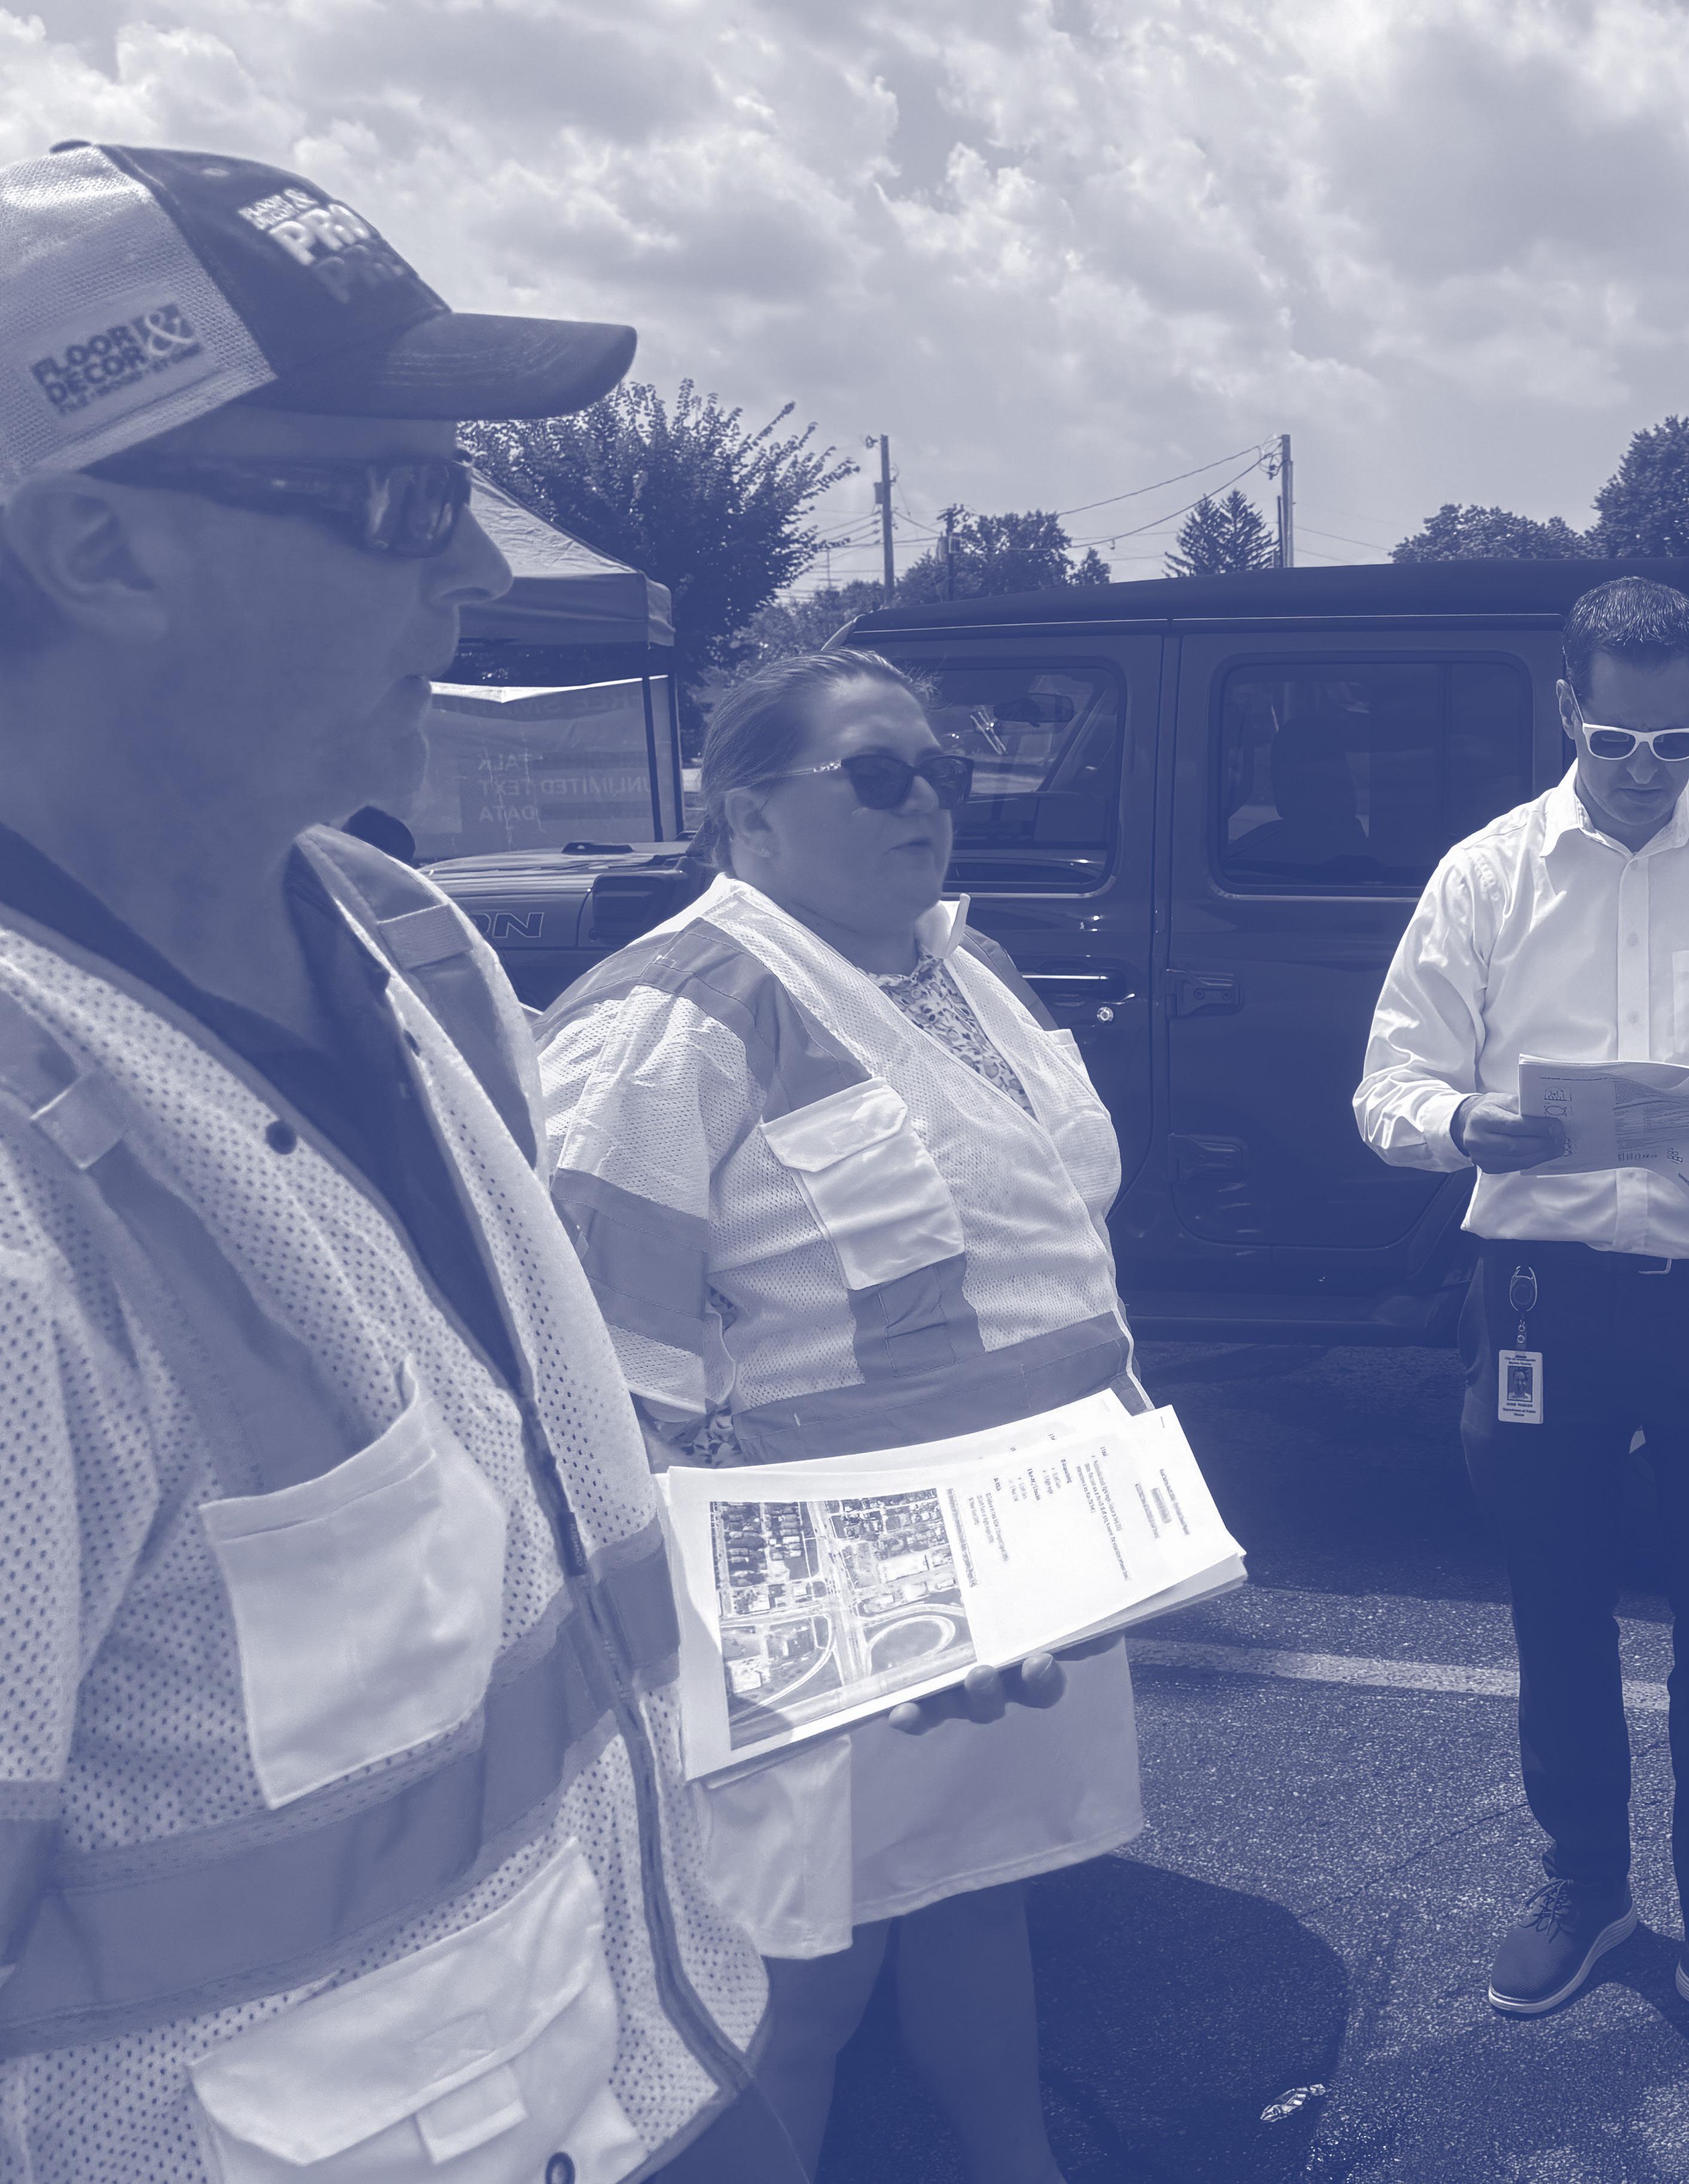
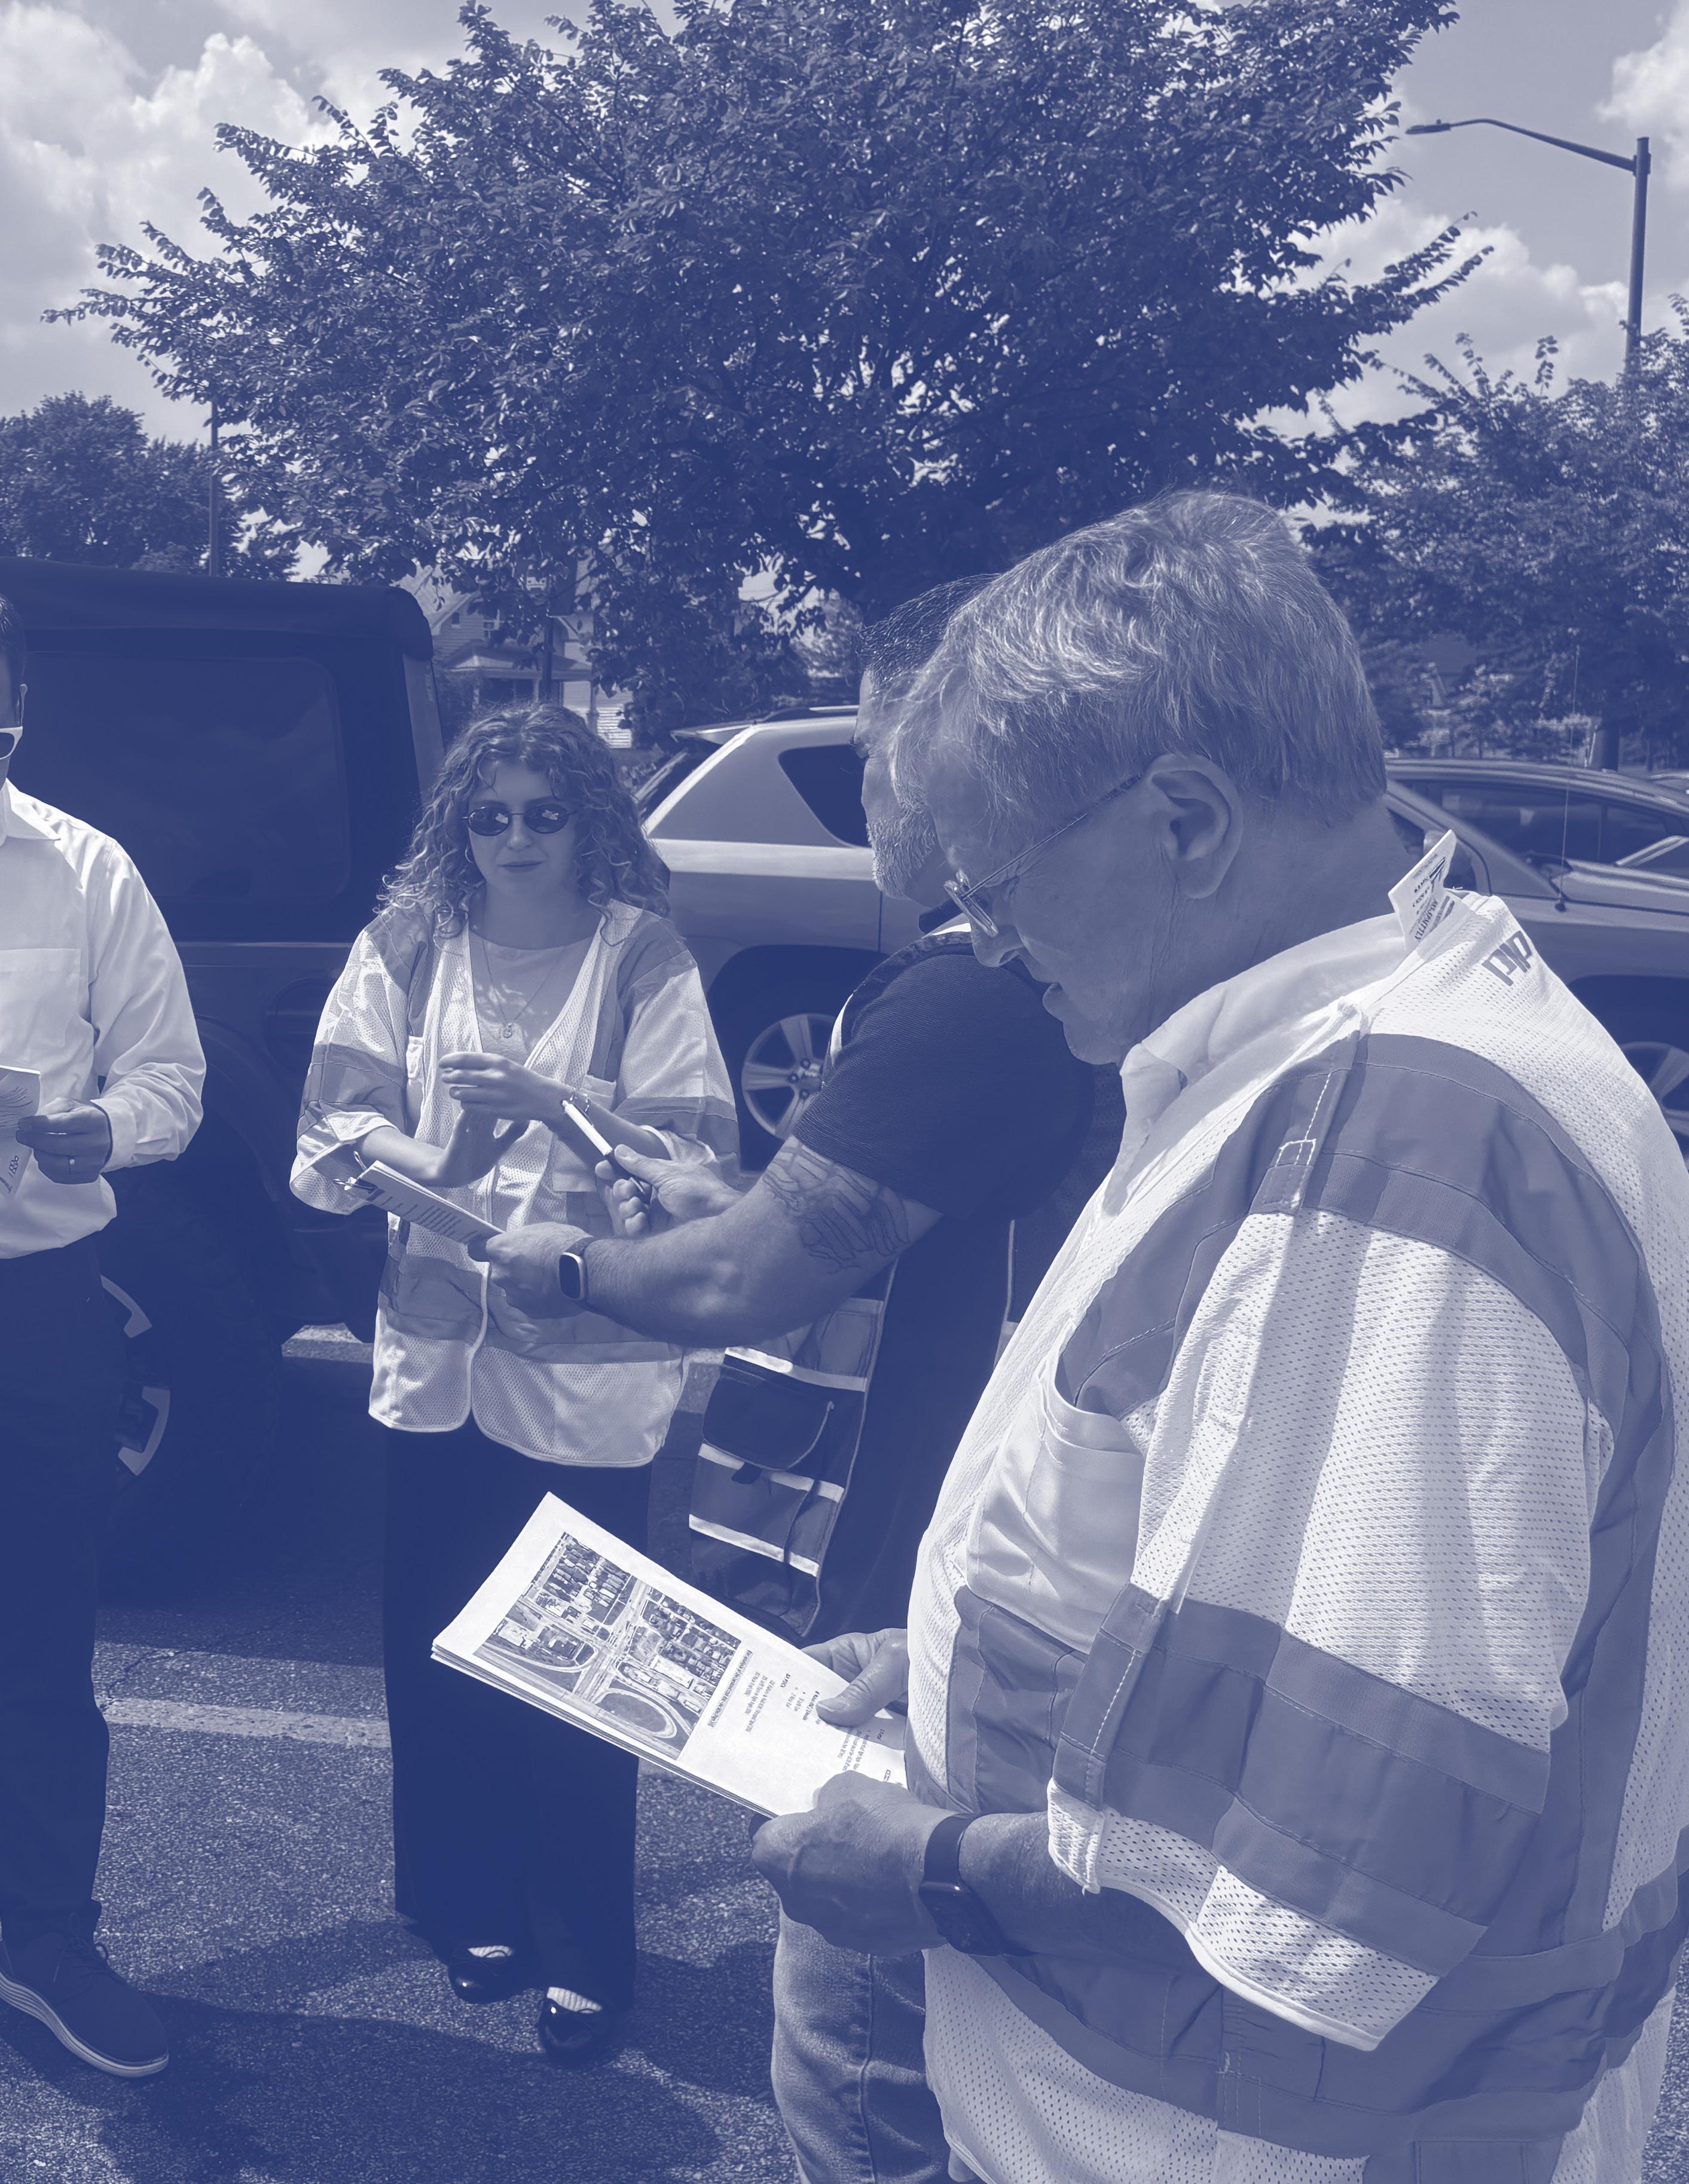
A pop-up event is a temporary, flexible engagement opportunity that is held in a public, hightraffic location to connect with people where they are, instead of making them go to a specific venue.
TRAFFIC SAFETY DATA ANALYSIS
Photo credit:Indianapolis Department of Public Health
Traffic Safety Data Analysis
This plan uses data to help City staff and decision makers put resources where they can make the biggest difference, instead of relying on opinions or assumptions. By looking at detailed crash data, leaders can tackle the most serious safety issues in a fair and effective way.
The analysis focused on fatal and serious injury crashes on streets maintained by the City, using 2019-2023 crashes from ARIES Automated Reporting Information Exchange System unless otherwise noted. This ensures the review includes not only crash numbers but also additional crash trends with complete records through 2023. As newer data for 2024 and 2025 becomes available, it will be added to future evaluations to improve accuracy and relevance.
Note: Interstates and roads managed by other agencies were not included, since the City cannot make changes on those roadways.
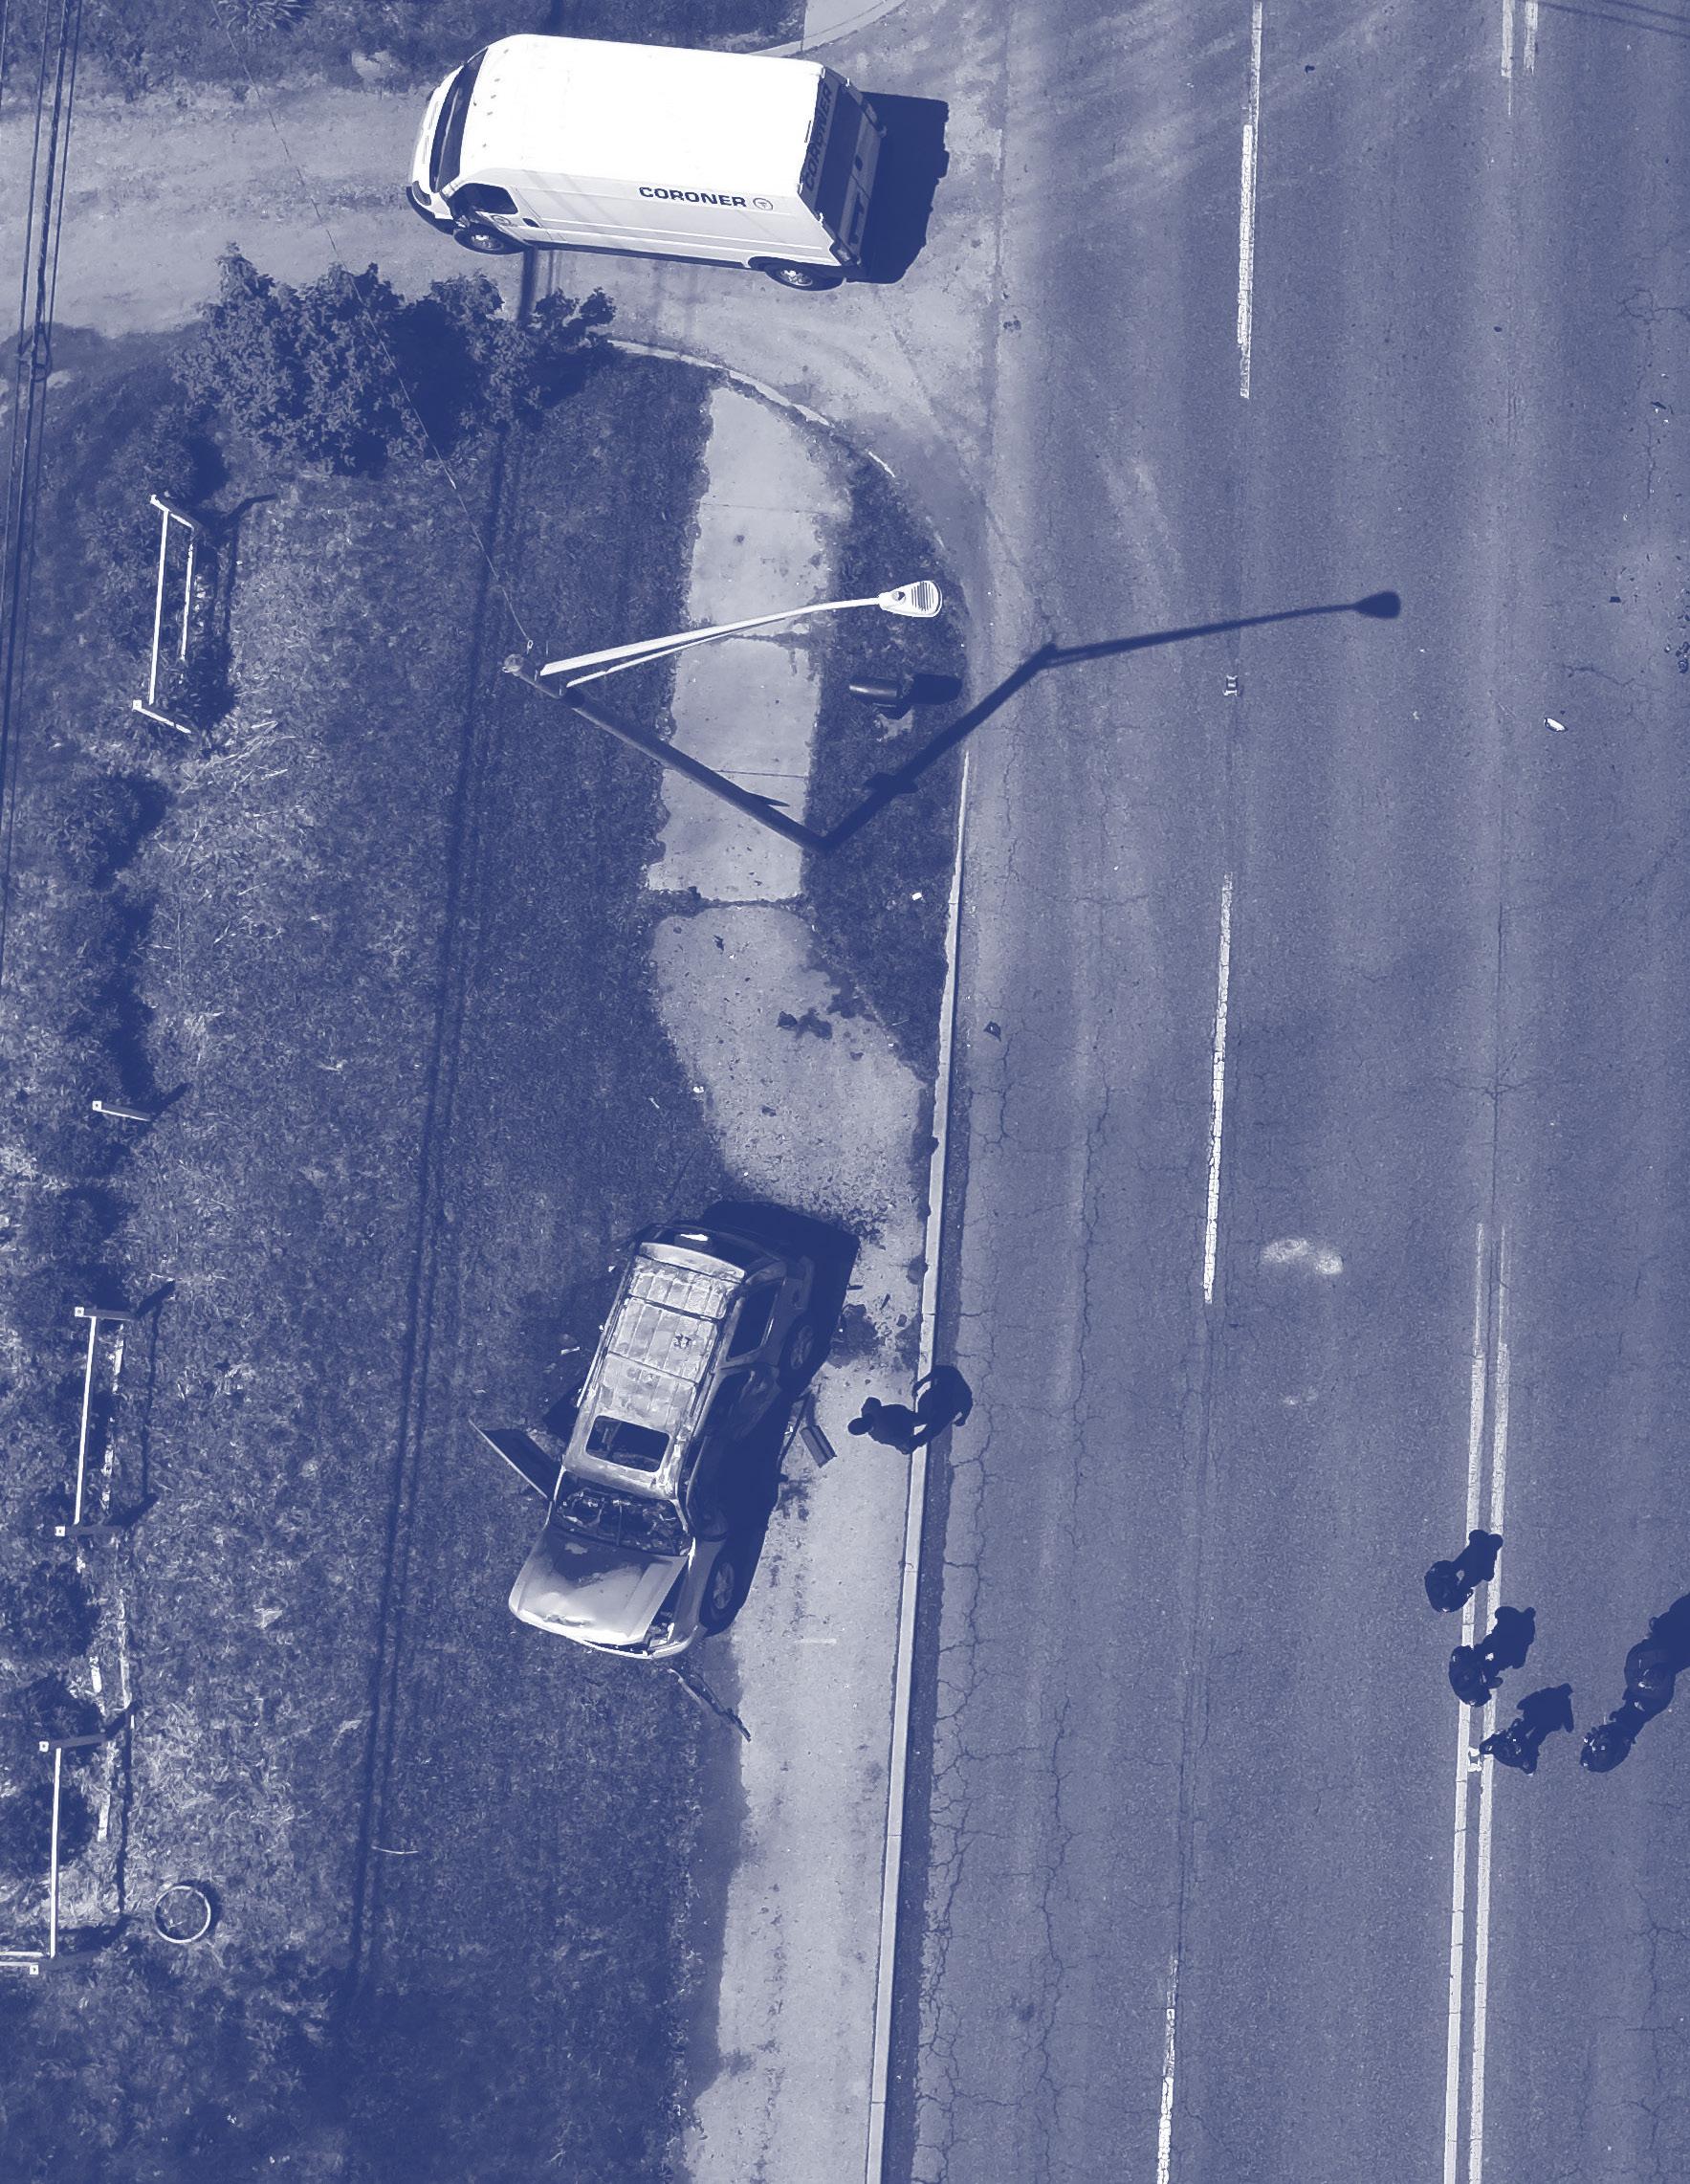
From 2019 to 2023, there was an average of one fatal or severe injury crash every five hours on the Indianapolis transportation network.
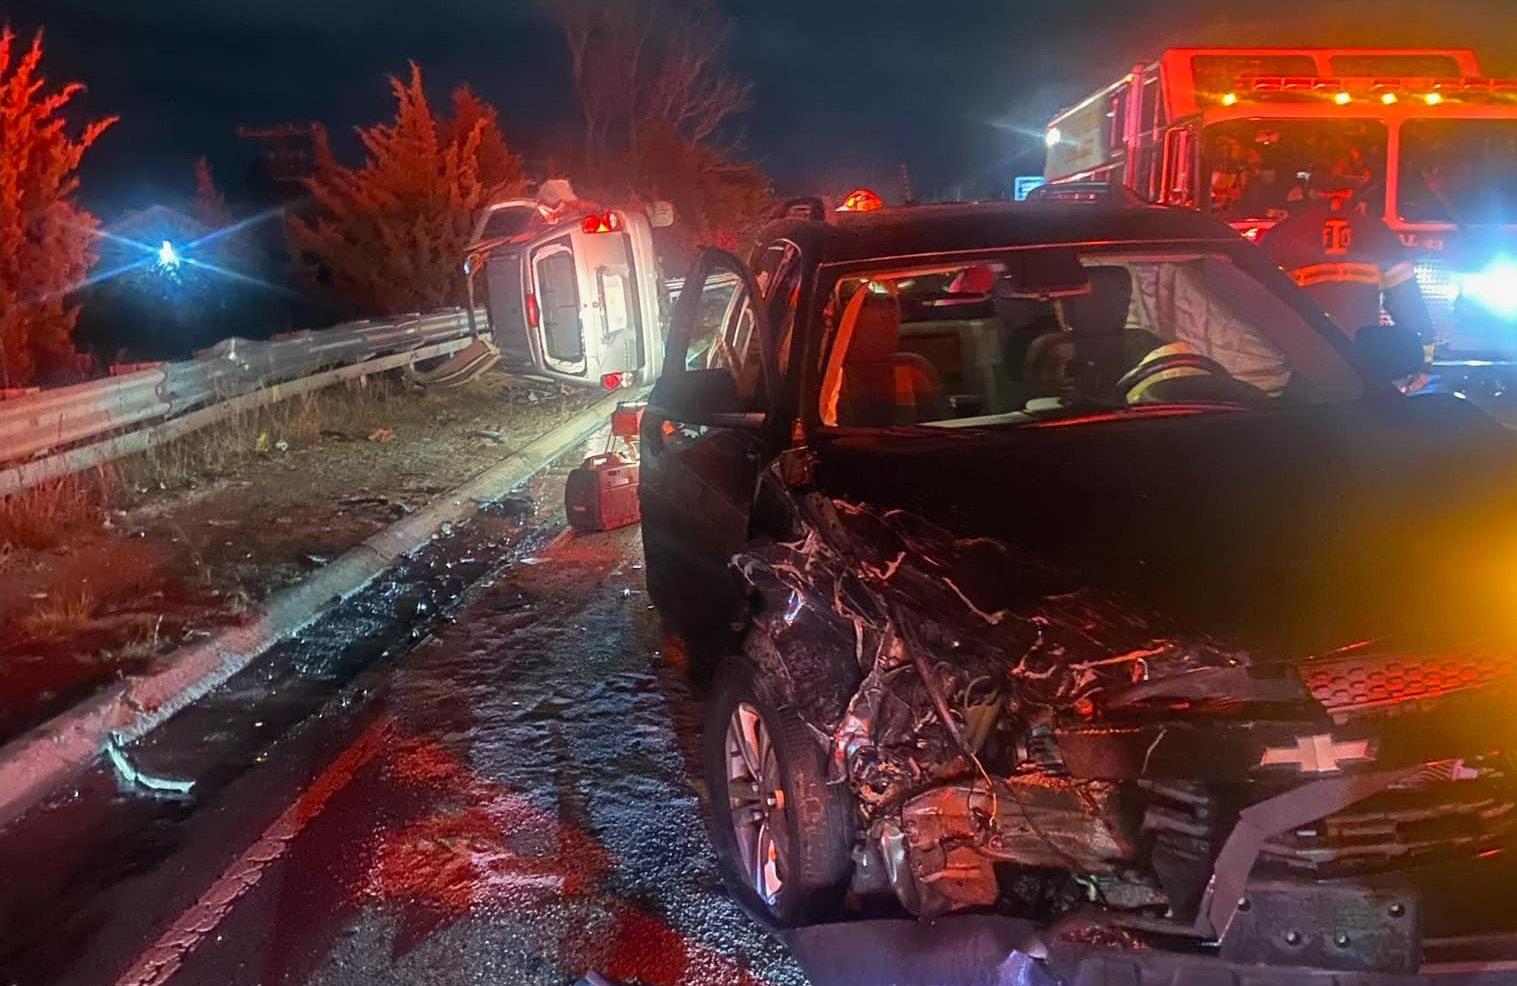
Photo credit:Indianapolis Metropolitan Police Department
LIVES LOST FROM 2019-2023 296
people driving 135 people walking
22 people riding bikes
Fatal Incapacitating
General Trends in Indianapolis
Traffic safety trends in Indianapolis closely mirror those seen across Indiana and the United States. When COVID-19 began in 2020, overall traffic dropped sharply due to stay-at-home orders and social distancing. At the same time, more people started walking and biking outdoors. Traffic enforcement also decreased, partly because of social distancing rules and growing public focus on social justice issues. Together, these changes led to more speeding and an increase in fatal and serious injury crashes.
Even though vehicle traffic has returned to pre-pandemic levels, the effects on risky driving behaviors and enforcement have continued, as shown in the data. The following graphics illustrate how these trends have evolved over time.
To give a broader perspective, data from the National Highway Traffic Safety Administration’s (NHTSA) Fatality Analysis Reporting System (FARS) was used to compare fatal crash rates at the national, state, and local levels. The tables and charts on the opposite page show annual fatal crash numbers and a five-year rolling average, highlighting recent trends in each area.
As illustrated in the graphics on the opposite page, traffic fatalities spiked nationwide, statewide, and in Indianapolis during 2020–2021.
Beginning in 2022 and continuing into 2023, fatalities started to decline, leading to a leveling off of the five-year rolling average, most noticeably in Indianapolis.
Across Indiana, fatal and serious injury crashes remain a pressing public safety concern.
According to data from INDOT’s Office of Traffic Safety, in 2024 someone was killed or seriously injured on Indiana roadways every 93 minutes. The Federal Highway Administration (FHWA) estimates that these crashes cost the state approximately $21.5 billion, underscoring the urgent need for continued investment and action to improve roadway safety.
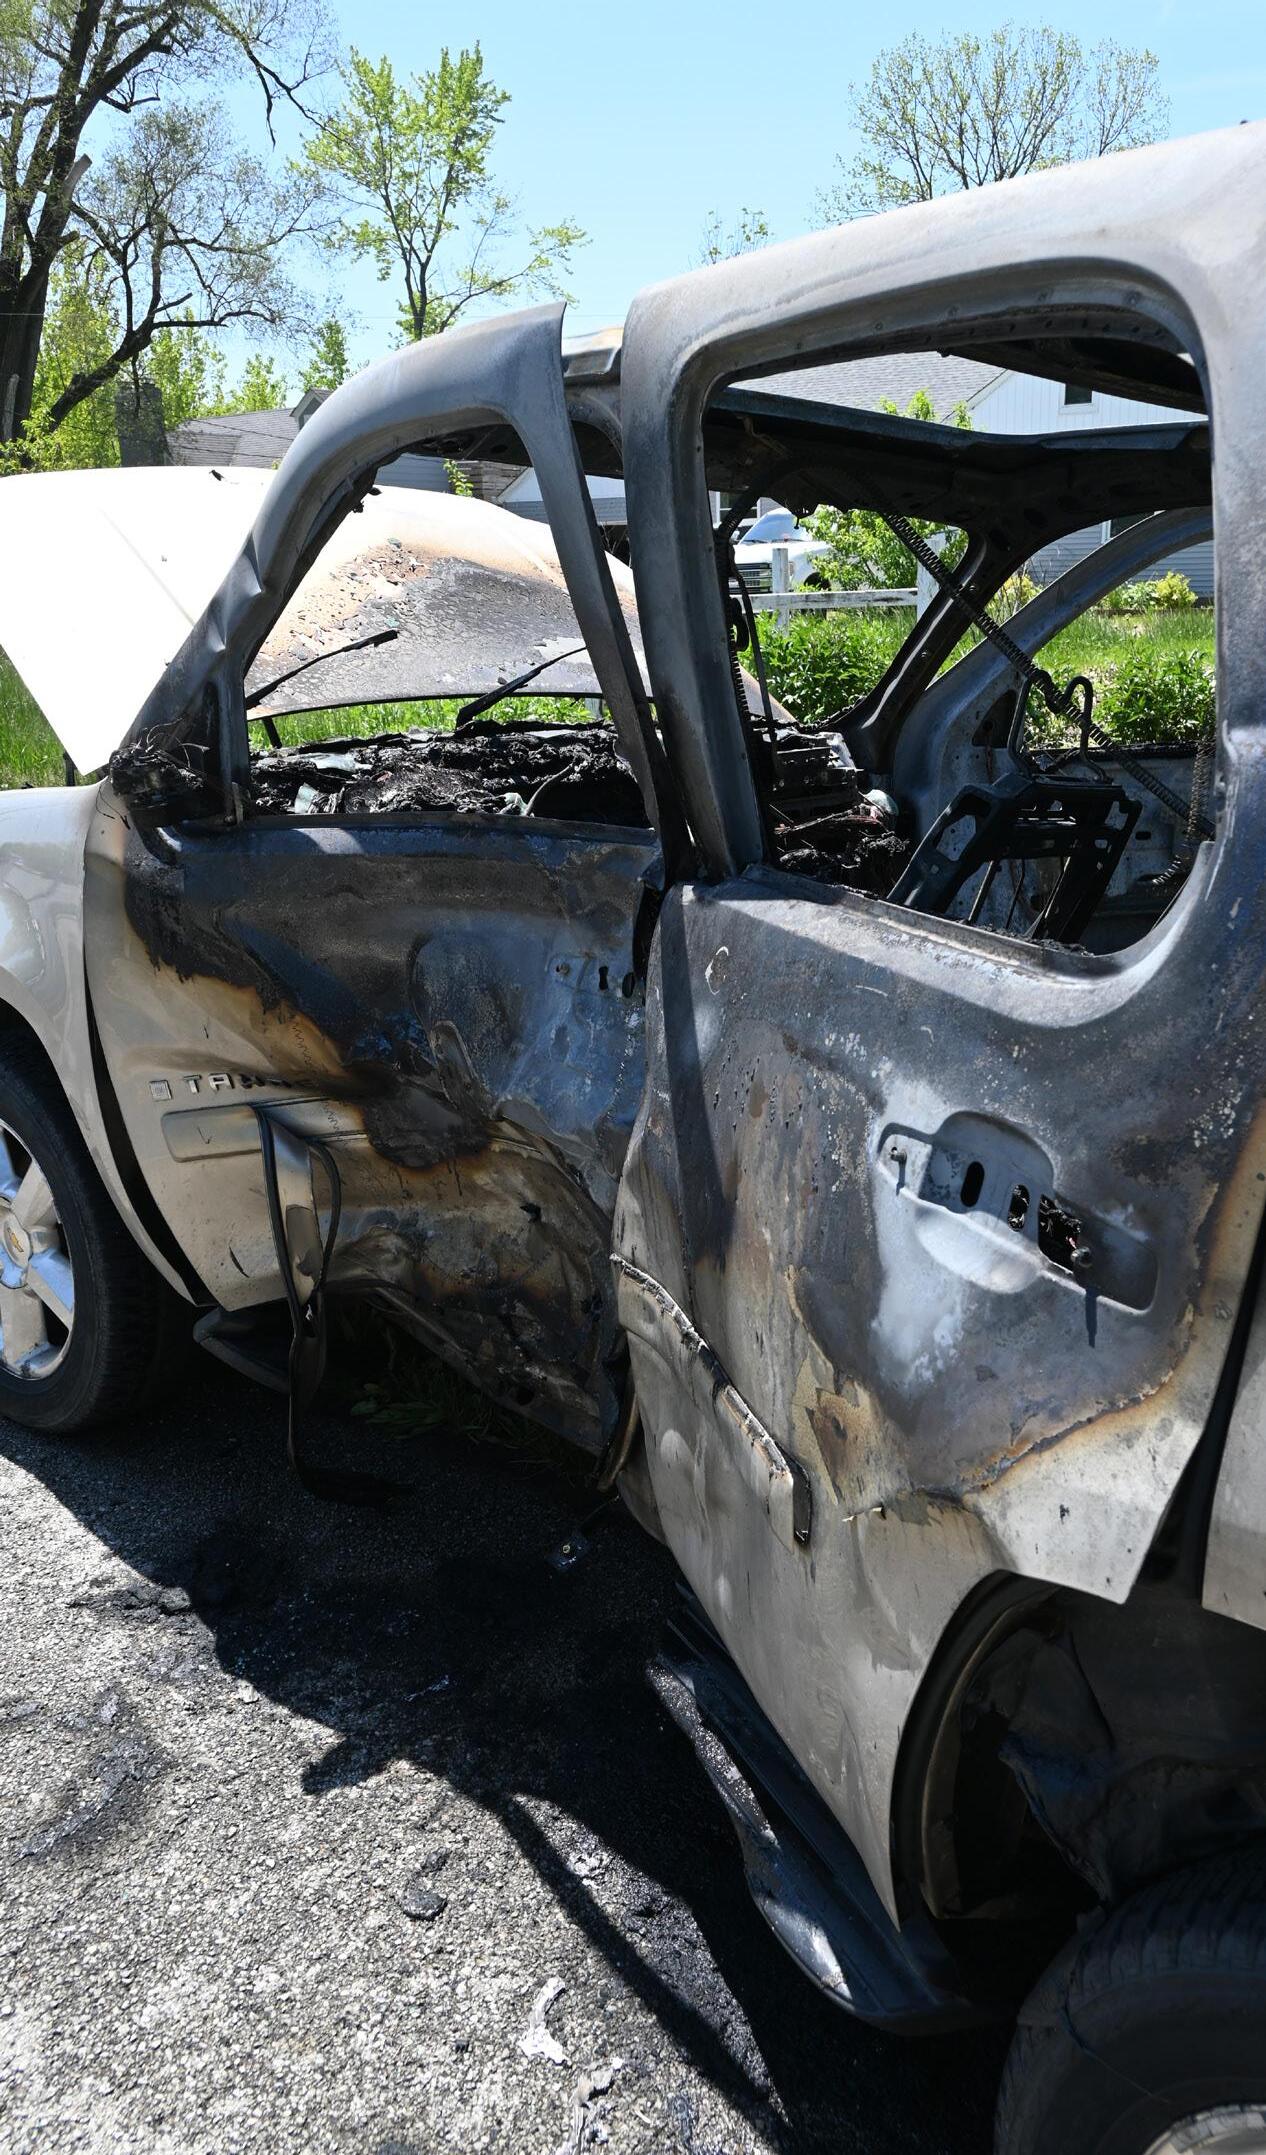
Photo credit: Indianapolis Metropolitan Police Department
Primary Causes of Fatal and Serious Injury Crashes in Indianapolis
When looking at crashes on all types of roads, most serious and deadly crashes in Indianapolis happen at intersections. The main reasons are people not giving the right of way (“Failure to yield”) and people ignoring stoplights or road signs (“disregard signal /reg sign”). These collisions often happen in places with lots of driveways or roads connecting to the main street, which can make it confusing and lead to crashes between drivers, bikers, and pedestrians.
Unsafe speeds and distracted driving are also some of the main reasons for serious crashes. However, these factors are often not listed as the cause in crash reports as police do not have this information or it can be difficult to prove. Still, speeding and distracted driving behaviors are noticed regularly.
Drivers look at their phones for an average of 5 seconds while texting
Data source: NHTSA, https://www.nhtsa.gov/risky-driving/distracted-driving
Crash types further emphasize intersection risks. Right-angle collisions are the most common, often resulting in severe outcomes due to the nature of the impact. Left-turning crashes, which also tend to be angle collisions, and high-speed rear-end crashes also make up a large portion of fatal and serious injury crashes.
At 40 mph, a vehicle travels for 293 feet in 5 seconds
Safe Speeds Matter
Speed plays a major role in both how likely a crash is to happen and how serious it can be.
Driving faster narrows a driver’s peripheral vision, making it harder to notice hazards, especially in urban areas. At 50 mph, a driver mostly sees just the road ahead, increasing risk for pedestrians and cyclists.
INDIANAPOLIS FATAL CRASHES WITH SPEEDING AS A FACTOR
From 2013 to 2023, approximately 20%–30% of fatal crashes in Indianapolis were directly linked to excessive speed. But let’s not forget, as stated previously, we know unsafe speeds are UNDERREPORTED.
Data source: NACTO Urban Street Design Guide
Looking at past data, speed has been a major factor in pedestrian deaths in Indianapolis. The human body can only handle so much force, and higher speeds make injuries much more severe.
LIKELIHOOD
Higher speeds don’t just put pedestrians and cyclists at risk. Research shows that the severity of crashes for people driving also increases as vehicle speeds go up.
Note: 56 MPH = 90 kilometers per hour
Data source: AAA Foundation for Traffic Safety (Brian C. Teft 2013)
INDIANAPOLIS
PEDESTRIAN AND BICYCLE CRASHES BY YEAR
Pedestrians and cyclists are being killed at a disproportionately higher rate in traffic crashes than people inside cars on Indianapolis streets. In particular, serious injuries to pedestrians have increased substantially. These Vulnerable Road Users need targeted safety measures to help reduce these crashes.
FATAL CRASHES
BY YEAR AND TRANSPORTATION MODE
Despite making fewer trips and traveling fewer miles than motorists, Vulnerable Road Users face higher risks of death or injury from traffic incidents.
The data shows clear patterns by season and time of day: more crashes and injuries happen in the summer and in the late afternoon to early evening, no matter how people are traveling. Pedestrian crashes happen more often in low light, with 58% of serious or fatal incidents occurring in these conditions. Cyclist crashes, on the other hand, happen more often in daylight, with 65% during the day and 35% in low light. For cyclists, the busiest hour for serious crashes is around noon.
CYCLIST CRASHES BY TIME OF DAY
Network Safety Analysis
Streets designed to protect Vulnerable Road Users improve safety for everyone. Two key networks have been identified:
High Injury Network (HIN)
The High Injury Network pinpoints the most dangerous streets in Indianapolis where a disproportionate number of serious and fatal crashes are occurring. This can help prioritize safety improvements and investments to save lives.
Transportation Impacted Neighborhoods (TIN)
Transportation Impacted Neighborhoods are areas in Indianapolis identified for targeted road safety investment. People living in these neighborhoods often have fewer transportation options, which can put them at greater risk. The map highlights neighborhoods with higher risk based on higher numbers of households without cars, as well as more residents with social and economic challenges, and racially diverse and ethnic minority communities.
Photo credit: Indianapolis Metropolitan Police Department
High Injury Network
High Injury Network
Transportation-Impacted Neighborhoods most impacted least impacted
Just 5% of the City’s Streets (205 miles) account for 43% of fatal and incapacitating crashes.
High Risk Network
Highest Risk Top 30 Miles (1%)
Highest Risk Top 200 Miles
Transportation-Impacted Neighborhoods
The High Risk Network safeguards VRUs by proactively assessing their exposure and crash risk.
Vulnerable Road User High Risk Network (VRU HRN)
A systemic analysis identified additional streets that are at higher risk for pedestrian and cyclist crashes, based on factors such as road type (arterials), number of lanes, traffic volumes (over 8,000 vehicles/day), speed limits (35 mph), areas with many households without cars, pavement type, population density, and closeness to destinations like schools, parks, and grocery stores.
Each street segment was given a score based on how many risk factors it had. This proactively prioritized locations most in need of safety improvements to protect VRUs.
SAFETY IS EVERYONE’S LANE.
Photo credit: Indianapolis Department of Public Works
Commuter Trends
According to 2023 STATS Indiana data, most people in Marion County get to work using their own vehicles. Community feedback supported this finding, showing that walking is the second most common way people travel. These results highlight the need to design a transportation system that keeps everyone safe, not just motorists. 87.7%
Personal
(With 73.8% of commuters traveling alone)
Although walking and biking account for fewer trips, Vulnerable Road Users make up 35% of fatal crashes.
As noted in the community engagement section, most people said they usually travel by car. However, many also shared that if conditions were safer and more convenient, they would prefer to bike or use public transit more often and drive less. This makes it essential for Indianapolis to adopt policies and design standards that create safe routes for everyone: drivers, cyclists, transit riders, and pedestrians alike. Policies should promote safe travel speeds and support the City’s Vision Zero goal of eliminating traffic deaths and serious injuries.
Education and outreach efforts should also extend beyond Indianapolis residents. Many people commute into the city from nearby counties for work, often traveling through different types of road environments along the way. According to 2023 STATS Indiana data, about 20% of Indianapolis’s workforce lives outside Marion County. Reaching these commuters is essential to promoting consistent roadway safety awareness and behaviors across the entire region. (https://www.stats.indiana.edu/dms4/ commuting.asp)
Demographic Factors
Age has a big impact on traffic fatality rates. In the United States, drivers between 25 and 64 years old are involved in the most traffic deaths, likely because they spend more time on the road. However, both younger drivers (24 and under) and older drivers (65 and over) also face higher risks. Young drivers may be more likely to crash because they have less experience or may be more likely to take risks, while older drivers may react more slowly and are often more physically fragile, which can make it harder for them to survive serious crashes.
According to the Federal Highway Administration’s Highway Statistics (2023), these two age groups make up about 34.5% of licensed drivers in Indiana. Data from the Fatality Analysis Reporting System (FARS) shows that in 2023, 42% of all fatal crashes that year. In comparison, drivers ages 25 to 64 make up 65.5% of licensed drivers and were involved in 58% of fatal crashes.
UNITED STATES
INDIANAPOLIS
UNITED STATES FATALITIES BY GENDER (2013-2023)
INDIANA FATALITIES BY GENDER (2013-2023)
INDIANAPOLIS FATALITIES BY GENDER
(2013-2023)
Gender also influences fatal crash rates, with male drivers consistently killed in more fatal crashes than females.
This gap has grown wider since 2019, highlighting the need for targeted education and safety campaigns to help reduce these differences.
Peer City Review
In fall 2024, staff from the City of Indianapolis interviewed established Vision Zero peer cities of comparable size both in area and population to learn from their experiences. The conversations focused on successes, challenges, and lessons learned. Cities included Columbus, OH; Charlotte, NC; Denver, CO; and
Louisville, KY. A common theme emerged: while no city had unlimited resources, strong political will, robust public engagement, and integrating Vision Zero principles across all aspects of city operations proved most effective in advancing safety initiatives.
Indianapolis Compared to Other Vision Zero Cities
Reviewing data from other Cities/Counties with similar populations, those with a higher population density generally reflect a lower fatality rate putting Indianapolis in the middle of the grouping. It was also noted that Indianapolis maintains more miles of roadways than its peers who often rely on the state for maintenance of state and U.S. routes.” Available data reflected a mix of centerline and lane-mile values. For comparison, lane-miles are typically at least double the centerline amount.
Conclusion
This analysis shows the urgent need for data-driven, context-sensitive transportation policies in Indianapolis. By focusing on high-risk areas, protecting vulnerable road users, and investing in neighborhoods most affected by traffic crashes, the City can make smart, targeted improvements that reduce deaths and serious injuries, bringing Indianapolis closer to achieving its Vision Zero goals.
Photo
ACTION PLAN STRATEGIES
Photo credit: Fatal Crash Review Team
Action Plan Strategies
By establishing a comprehensive framework of Vision Zero strategies, Indianapolis can systematically address the complex factors that contribute to roadway fatalities and severe injuries.
Strategies were developed through ongoing conversations with Task Force members and City partners. These discussions considered public input, explored opportunities to optimize and expand existing efforts, encouraged collaboration, and aimed to avoid duplication. Stakeholders shared their wish lists, identified challenges, and expressed key priorities. Across the board, funding and staffing resources emerged as the most significant barriers to implementing Vision Zero.
Infrastructure funding for roadways, sidewalks, and bikeways remains limited. To address this, the City takes a strategic approach by aligning projects with the criteria of competitive grant opportunities and other external funding sources. However, some state funding streams are restricted to specific types of street improvements, excluding others. This limitation complicates the timing and advancement of certain projects. Otherwise, this plan helps to prioritize the limited resources available to focus on the High Injury Network, High Risk Network, and in Transportation Impacted Neighborhoods.
A successful Vision Zero plan does not solely focus on infrastructure improvements to meet the goals of the plan. A change in culture within
governmental agencies, politicians, and the public must occur for the City of Indianapolis to realize its goal of zero fatal and serious injury crashes. That is why efforts such as policy reforms, comprehensive planning, improved operational processes, and more effective communications are included in the Vision Zero Strategies.
Strategies are organized by the primary Safe System Element they influence, with additional general strategies aimed at supporting the overall Vision Zero Plan.
The specific implementation details for each strategy are still to be determined. The strategies have been formulated to provide flexibility, enabling subject matter experts to utilize best practices for the most effective approach based on available resources.
The Vision Zero Action Plan Strategies differ in the time and resources they require. Some are quick and use minimal effort, while others demand long-term commitment and substantial investment.
Photo credit:Storyboard
Photo credit:Andrea Watts
Action Plan Strategies: Safe Roads
GOAL:
The city implements street designs and policies that maximize safety for all road users.
Photo credit:Indianapolis Department of Public Works
Safe Roads strategies and action items:
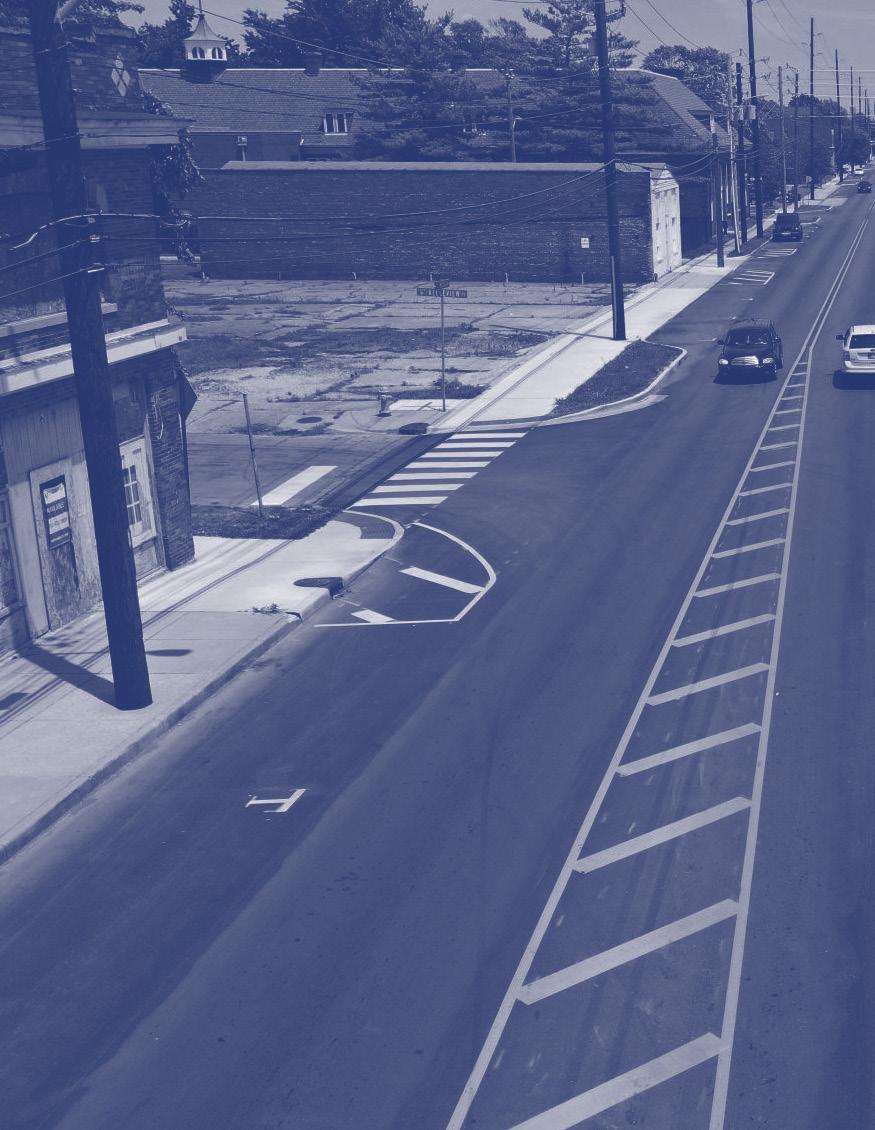
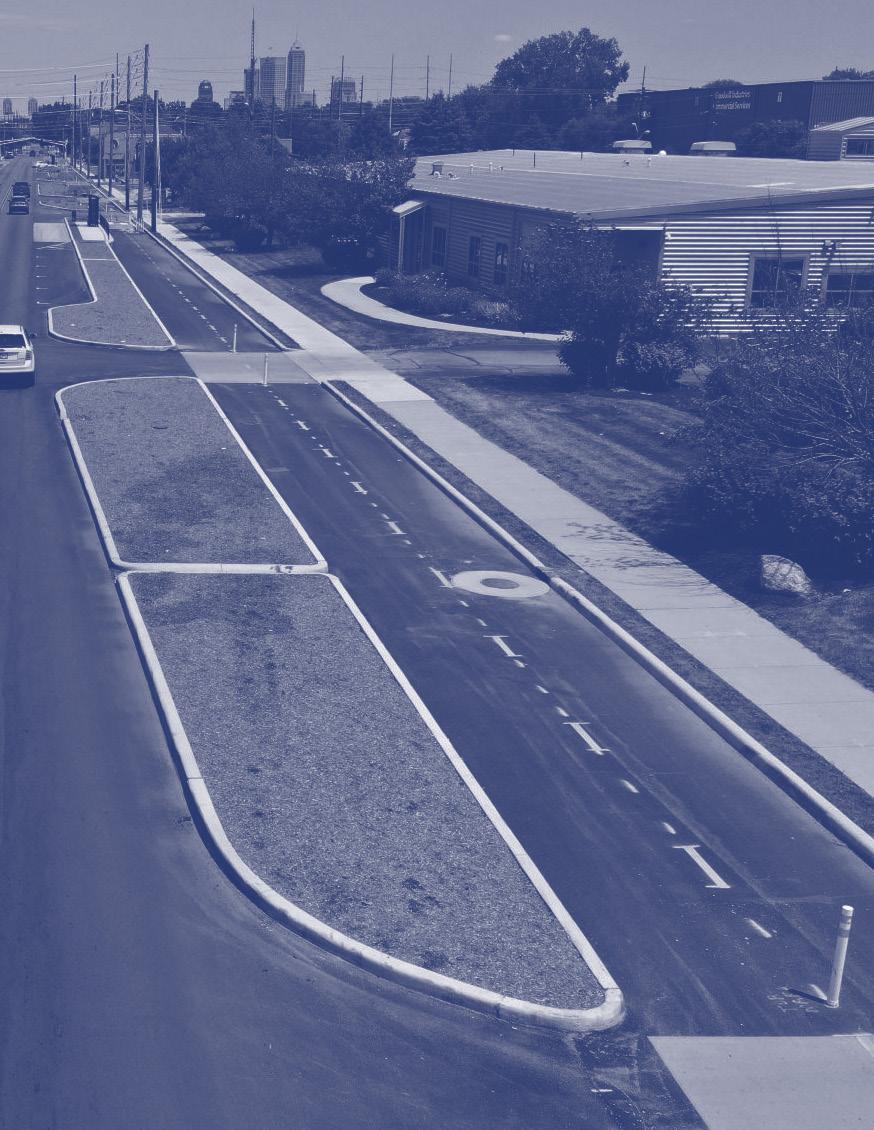
• Utilize the HIN, HRN, and TIN to strategically prioritize investment of limited resources for all road users.
• Incorporate FHWA-identified Proven Safety Countermeasures, including, but not limited to, Leading Pedestrian Intervals, Access Management, traffic signal timing, and road safety audits.
• Reassess existing mechanisms and resources for implementation of improvements.
• Provide a mechanism to define and communicate requirements for infrastructure improvements.
• Influence long-term outcomes through policy updates, clarifications, and publications.
• Increase public awareness of ongoing traffic safety efforts, fostering greater community buy-in and support.
• Monitor and evaluate the effectiveness of infrastructure improvements postimplementation.
Photo credit:Storyboard
Action Plan Strategies: Safe Roads
Estimate $ = typically under $50,000
= typically $50,000 – $1million
= typically, $ 1Millon +
Strategy Key: Safety countermeasures require varying levels of city resources. To support decision-making in creating safer streets, each strategy includes an estimated cost range and timeframe. These estimates account for planning, engineering, capital investment, staff capacity, installation, and other factors. Please note that cost and timeframe are intended as guides and indicators, rather than representing total costs or guaranteed completion dates for each strategy.
SR1 Safe Roads Strategy 1 Modify fatal crash review process to align with Vision Zero data.
SR1.1 Modify Fatal Crash Review Process to Complete Road Safety Audits at Priority HIN intersections (Instead of reviewing intersections that had the most crashes in the previous two months); Use TIN to help further prioritize locations.
SR2 Safe Roads Strategy 2
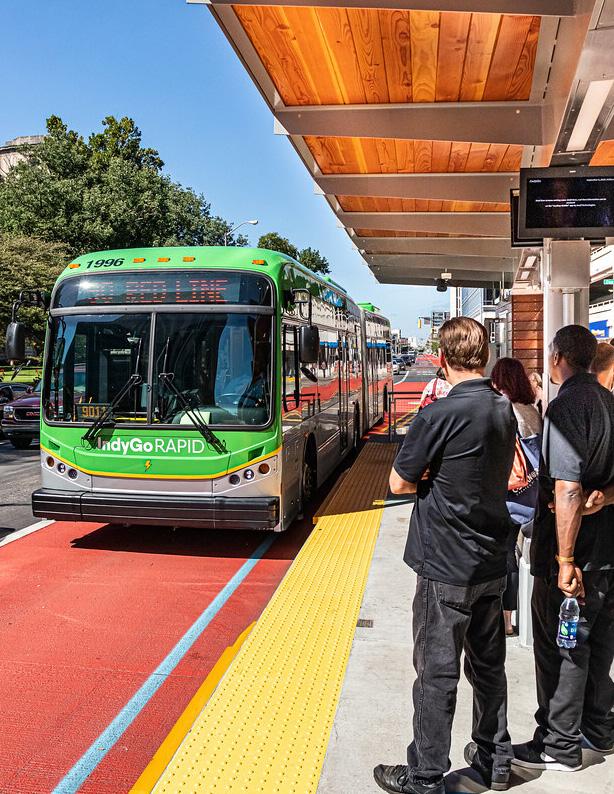
Incorporate Vision Zero principles and data into IndyGo's near- and long-range planning efforts.
SR2.1 Include the HIN and HRN data as metrics when performing future comprehensive operational analyses and share how the inclusion of this data shapes each update to IndyGo's future service plan.
SR2.2 Incorporate the HIN and HRN data as scoring criteria and share how the inclusion of this data helps IndyGo prioritize bus stop and station improvements as part of its ADA Transition Plan.
SR2.3 Continue to use the city's social vulnerability and transportation equity indices to inform short-, mid-, and long-range decisions on routing and/or bus stop placement.
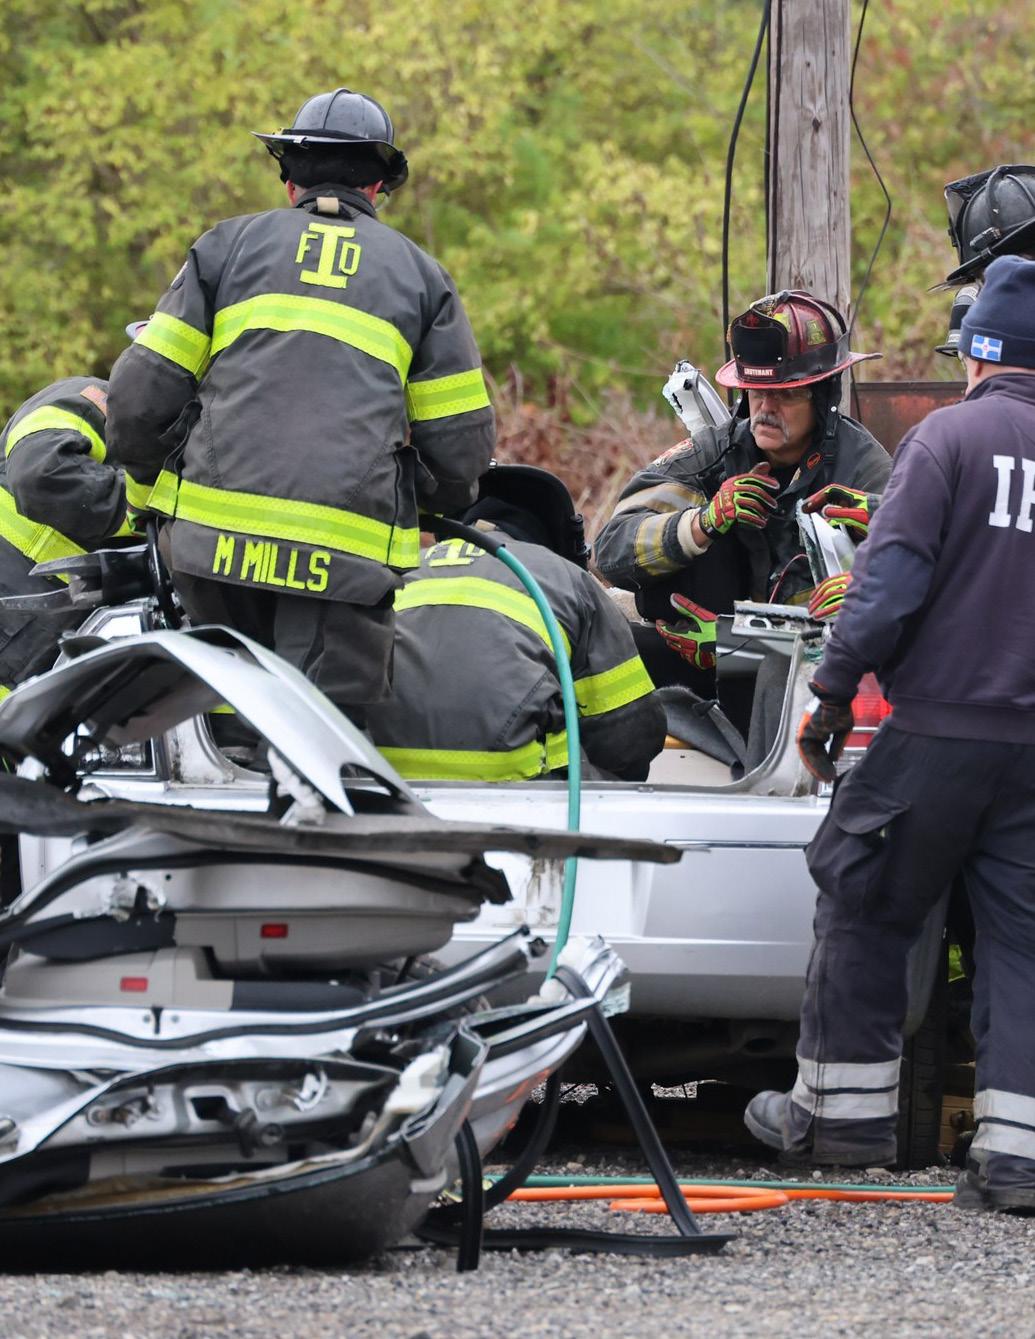
Fatal Crash Review Team
SR3 Safe Roads Strategy 3 Upgrade signal phasing/timing at HIN and HRN locations.
SR3.1 Secure traffic software for signal timing improvements.
SR3.2 Publish policies for Leading Pedestrian Intervals, No Turn on Red Locations, Protected Left Turns.
SR3.3 Track and monitor crashes at modified locations.
SR3.4 Report quantity of implementation annually.
Short Term Safe Roads
Action Plan Strategies: Safe Roads
SR4 Safe Roads Strategy 4
Utilize Vision Zero Data (HIN, HRN, TIN, and public input) to inform and support safe school travel for all modes of travel to/from Indianapolis schools.
SR4.1 Review and utilize the HIN, & HRN for all modes of transportation planning for students, and families. Provide information to bus stop planners and families of students.
SR4.2 Establish an intra-district school transportation safety committee to encourage and promote Safe Routes to School Plans and principles.
SR4.3 Establish a mechanism for students' families to share specific infrastructure challenges en route to/from their school with the District.
SR4.5 Establish a mechanism for schools to communicate infrastructure challenges to DPW such as street crossing activity to daily destinations (high frequency destinations like parks, libraries, grocers where kids are walking to before/after school).
Zero Admin, Schools, Health by Design
and DPW
and DPW
SR4.6 Pursue continued Safe Routes to School grant funding to develop and support future efforts. Health by Design and Schools
Ongoing
Short Term, Ongoing Safe Roads, Safe People
SR5 Safe Roads Strategy 5
Develop a Vision Zero 'Quick-Build Program' that supports the recommendations from Fatal Crash Review Team, Community-Powered Infrastructure projects and supplement larger permanent Capital Improvement Projects. The rapid deployment program will pilot traffic safety interventions in HIN & HRN areas with a focus on Transportation Impacted Neighborhoods.
SR5.1 Establish a clear process for advancing projects to test low cost, quick build alternative materials and protocols aimed at speed management and traffic calming.
SR5.2 Install, track, and monitor quick build locations. Compare crash and speed data at modified locations.
SR5.3 Report information of upgrades and installation annually.
$ Short Term Safe Roads, Safe Speeds
$ Medium Term Safe Roads, Safe Speeds
DPW $ Ongoing Safe Roads, Safe Speeds
Photo credit:Indianapolis Department of Public Works
Action Plan Strategies: Safe Roads
SR6 Safe Roads Strategy 6
Update Development land use policies to prioritize safety for all road users.
SR6.1 Improve/formalize an administrative policy coordination process between DMD, DPW, BNS.
SR6.2 Complete a review of land use policies to identify where road user safety could be impacted. Adopt policies that prioritize walkability, bikeability, transit and network cohesion. Focus on zoning codes and standards such as block size, form-based codes, parking maximums, access management, etc.
SR6.3 Incentivize projects and development along existing and developing multimodal networks.
SR6.4 Clarify the process for reviewing and approving access management and make it public-facing.
SR6.5 Review and provide guidance for schools when adding a new building, addition, and/or exterior earth disturbance threshold on construction of sidewalks, lighting, or other multi-modal safety infrastructure in the Right of Way based on the locations needs.
SR7 Safe Roads Strategy 7
Prioritize infrastructure Capital Improvement Projects utilizing HIN, HRN, Transportation Impacted Neighborhoods, and public input data.
SR7.1 Include HIN, HRN, TIN Data, and Public input data as a supportive component when prioritizing Capital Improvement Projects.
DMD, DPW, BNS
SR8 Safe Roads Strategy 8
Continue to include Complete Streets elements in project scoping.
SR8.1 Publish the Complete Streets Checklist which is utilized in infrastructure planning and development.
SR9 Safe Roads Strategy 9
Reevaluate mechanisms to implement short term infrastructure traffic safety improvements.
SR9.1 Improve the capabilities of in-house operations/labor through education and training on safety improvement work orders and efficiencies.
SR9.2 Focus on strengthening the safety related capabilities of contractors, identifying cost-effective opportunities for safety-focused work orders, and streamline procurement to accelerate delivery of safety improvements in support of Fatal Crash Review Team and other Vision Zero strategies.
SR10 Safe Roads Strategy 10 Update city GIS data layers.
SR10.1 Add Vision Zero data layers to the City database.
SR10.2 Update infrastructure/asset collection processes and policies (sidewalk, bike lanes, traffic volumes) - Improve accuracy and availability of data mapping to inform decisions.
DPW $ Short Term Safe Roads
Action Plan Strategies: Safe Roads
SR11 Safe Roads Strategy 11
Promote transit-oriented developments.
SR11.1 Create communication material to clarify its importance and benefits; Dispel misconceptions, such as the need for excessive commercial parking (e.g. large gas stations).
SR11.2 Update policies to incentivize transit oriented development beyond Bus Rapid Transit (BRT) corridors to all serviced areas.
SR12 Safe Roads Strategy 10
Promote Vision Zero.
SR12.1 Use IndyGo's social media channels to cross-promote content developed by the Vision Zero Initiative Taskforce (e.g. "Using public transit is 10 times safer than driving in a car").
SR12.2 Share the findings/community benefits illustrated by each 'before' and 'after' BRT study pertaining to both traffic impacts and transit impacts.
SR12.3 Highlight the successes from roadway safety-related projects and programs completed by IndyGo as well as securing competitive grant funding, such as the SS4A planning and implementation grants.
DMD $ Medium Term Safe Roads
IndyGo $ Ongoing Safe Roads
Photo credit:IndyGo
Action Plan Strategies: Safe Speeds
GOAL:
To promote safe speeds in all roadway environments through a combination of thoughtful, equitable, context-appropriate roadway design, targeted education, outreach campaigns, and enforcement.
Photo credit:Indianapolis Metropolitan Police Department
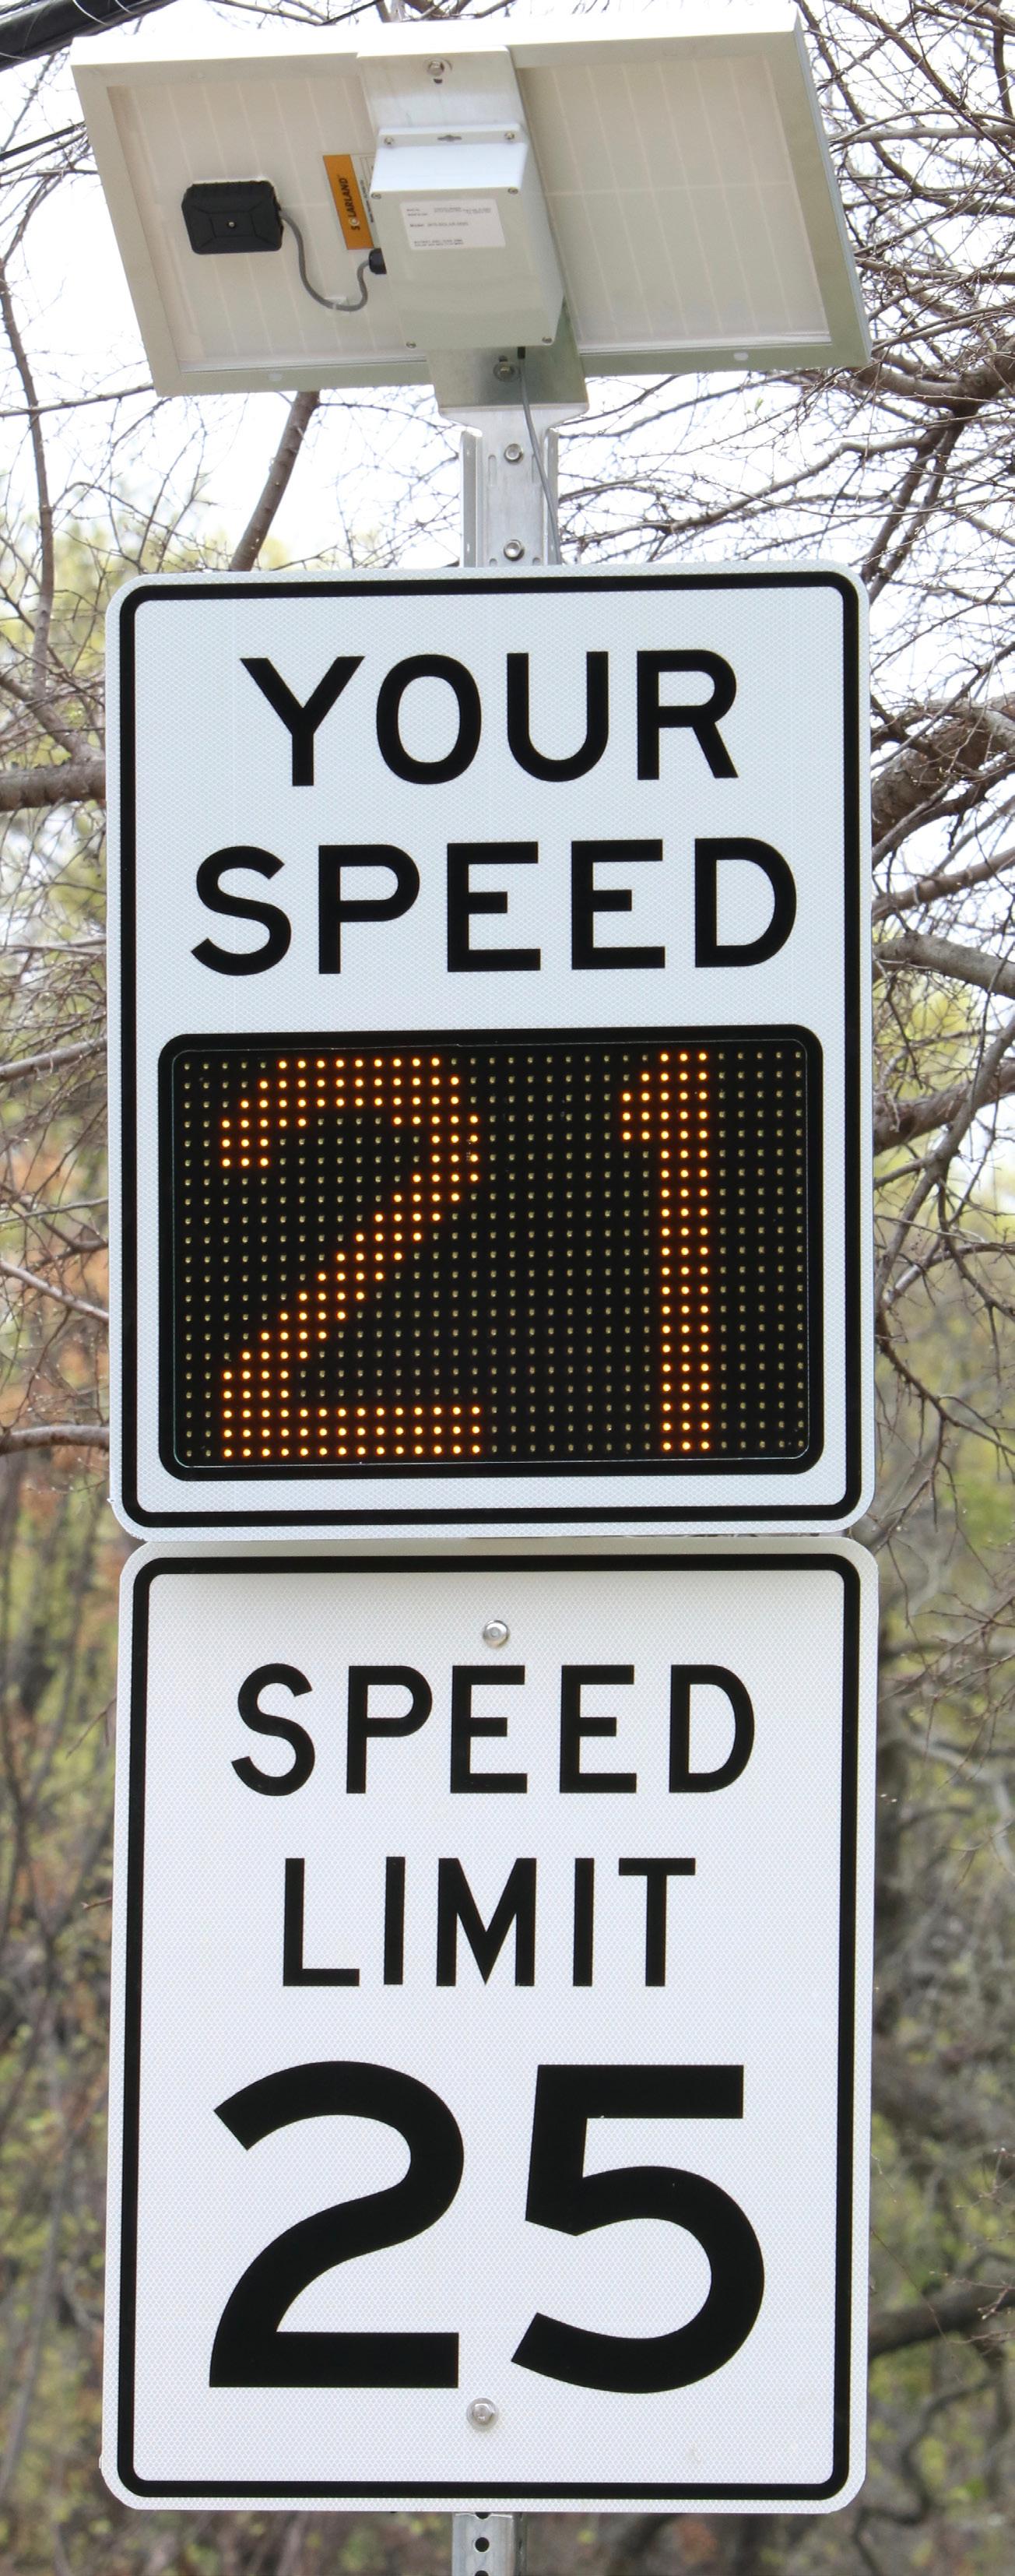
Speed management efforts are intended to reduce harmful speeds rather than merely controlling speeding behavior. High, legal speeds impact safety since human injury tolerance can be exceeded even when drivers comply with the legal speed limit.
Safer speeds can be influenced through:
• Setting context appropriate speed limits. Currently the ability to implement this is limited by state statutory speed limits.
• Street design – implementing features to encourage the desired speed at which a driver is comfortable to travel (self-enforcing street design).
• Enforcement – often, drivers do not perceive safety as a risk of speeding and their only deterrent is being held accountable through citations.
• Automated enforcement is a proven safety countermeasure endorsed by both the FHWA and NHTSA but is limited by state law.
• Traditional Traffic patrol resources are limited – so data can be used to optimize when and where to implement traffic stops.
• Adjudication – engaging the judicial system to uphold traffic safety enforcement.
• Culture Change – it is culturally and socially acceptable to drive a few miles above the speed limit. Nearly everyone does. Education and awareness efforts promote safe behaviors are a tool to influence social norms.
Action Plan Strategies: Safe Speeds
Cost Estimate
$ = typically under $50,000
$$ = typically $50,000 – $1million
$$$ = typically, $ 1Millon + Timeframe short term = 1 year medium term = 2 – 5 years long term = 5 years + Ongoing = continually evolving
SS1 Safe Speeds Strategy 1 Develop and implement a City-wide, proactive speed management program.
SS1.1 Follow the FHWA Safe System Approach for Speed Management, connect to traffic calming and context specific design standards.
SS1.2 Connect to post crash care and EMS partnerships ensuring buy-in on the speed management plan as it relates to their work.
DPW, IMPD, Vision Zero Administrator
DPW, IMPD, Vision Zero Administrator
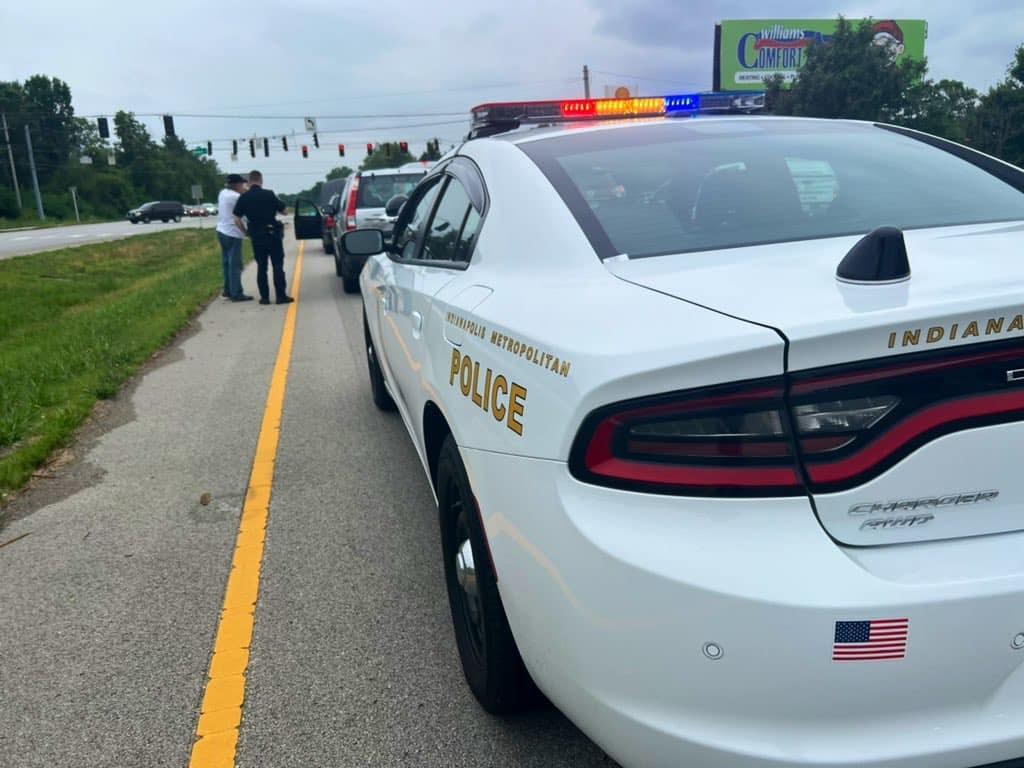
SS1.3 Conduct high-visibility speed enforcement on HIN and HRN routes in ways that promote and encourage safe driving, walking, rolling, and biking and in collaboration with neighborhood communities. IMPD
SS1.4 Continue to support a push for equitable, automated enforcement technology.
DPW, IMPD, Vision Zero Administrator
SS1.5 Promote and support a Pilot Program for Speed Safety Cameras in school zones. School Districts, Health by Design, IMPD
Term Safe Roads, Safe Speeds, Post Crash Care
Term Safe Speeds
Ongoing Safe Speeds
Did you know?
Decreased speed limits don’t necessarily lead to increased delay for several reasons:
• Urban traffic flow is often dictated by intersections, not speed limits. In many city environments, traffic signals, stop signs, and congestion already limit how fast vehicles can travel. Lowering the speed limit may have little impact on actual travel time once stopped time is factored in.
• More consistent speeds can improve traffic flow. Lower speed limits can reduce the need for sudden braking, stop-and-go conditions, and aggressive driving. This smoother flow can lead to more predictable travel times and reduce delays caused by crashes or near misses.
• Crashes are a major source of delay — and lower speeds reduce them. Collisions, especially severe ones, cause significant traffic disruptions. By lowering the frequency and severity of crashes, reduced speed limits can actually improve overall traffic reliability and reduce unexpected delays.
• Most trips are relatively short, and the time difference is minimal. On short urban trips, reducing the speed limit from, say, 35 mph to 30 mph might only add seconds to the total travel time — a negligible difference in exchange for a substantial safety benefit.
Action Plan Strategies: Safe People
GOAL:
Encourage safe, responsible driving and behavior by people who use our roads and create conditions that prioritize their ability to reach their destination unharmed.
Photo credit:Burgess & Niple
Culture plays a vital role in shaping traffic safety outcomes.
Too often, drivers are only motivated by the fear of getting a ticket, without fully considering the real risk of injuring themselves or others. However, the data is clear: traffic crashes and injuries are common and have serious consequences.
Commuting is not an individual act; it’s a shared responsibility.
We must all look out for one another, whether behind the wheel, walking, biking, or using public transit. Creating a safer transportation culture requires a shift in mindset, supported by education, encouragement, and enforcement.
Safe People Strategies aim to raise awareness and provide education about road safety.
These efforts include empowering motivated community members to share traffic safety information with friends and neighbors, partnering with first responders to promote Vision Zero Principles during community interactions, and reaching people of all ages and abilities in every neighborhood.
Action Plan Strategies: Safe People
Cost Estimate
$ = typically under $50,000
$$ = typically $50,000 – $1million
$$$ = typically, $ 1Millon +
SP1 Safe People Strategy 1 Develop a Vision Zero Strategic Education and Awareness Plan.
SP1.1 Focus on specific, core messages that apply to all users: e.g. “Everyone is a Pedestrian” There’s space and a place for all users.
SP.1.1.5 Establish a 'Indy Vision Zero Partnership Network', aimed to partner with non-profit organizations, research and educational institutions, advocacy groups to share their safety expertise, proven programming, and innovative ideas that supports safer roadways for all.
SP1.2 Include mechanism for action (pledge, commitment, etc.)
Administrator, Supported by City-County Councilors
SP1.3 Create “Vision Zero Neighborhood Universities” featuring, presentations, speakers, experts, and relatable community stories.
SP1.4 Create materials and programming available in multiple languages and ensure cultural relevance.
Zero Administrator, Supported by City-County Councilors
Administrator, Supported by City-County Councilors
SP1.5 Encourage public figures and community/civic leaders to publicly pledge to not drive over the speed limit, under the influence, or while distracted.
Vision Zero Administrator, Supported by City-County Councilors
SP1.6 Create 'How to use' infrastructure/ lanes/signages reels or handouts. Vision Zero Administrator, DPW
SP2 Safe People Strategy 2
Establish crash prevention engagement and outreach.
SP2.1 Similar to fire prevention, discuss traffic safety with members of the public to influence culture change.
SP2.2 Partner with Health System Injury Prevention Coordinators for child car seat installations.
SP2.3 Track number of events where this engagement occurs (use existing events, too).
Ongoing
Safe Vehicles
Action Plan Strategies: Safe People
SP3 Safe People Strategy 3
Adjust traffic court programs/policies to support safer driver behaviors.
SP3.1 Adjust the Deferral Program for speeding (to avoid points on license) to limit eligibility to drivers cited for speeds no more than 15 mph over the posted limit on local streets, rather than the current 25 mph threshold.
SP3.2 Second (or more) distracted driving violations will not be elegible for the Deferral Program.
SP3.3 Require Driver Safety Program for citations in excess of 20 mph.
SP3.4 Investigate outdated ordinances related to traffic enforcementupdate.
Office
Office
Office
Prosecutor's office, with support from IMPD
SP3.5 Establish a process to alert the DPW City Engineer of infrastructure needs or gaps to support enforcement and compliance with the law. Prosecutor's Office, DPW
Safe People Strategy 4
Prioritize
SP4.1 Conduct High Visibility Enforcement blitzes (DUI checkpoints, street racing, etc.) along the HIN and/ or HRN in ways that promote and encourage safe walking, rolling, and biking and in collaboration with neighborhood communities.
SP4.2 Promote and encourage safe driving, walking, rolling, and biking and in collaboration with neighborhood communities through enforcement and engagement.
SP4.3 Include education materials with traffic stops (Hot Card with Vision Zero QR code).
SP4
SP5 Safe People Strategy 5
Promote safe driver (and passenger) education for older and younger users.
SP5.1 Promote Safe Driver (and Passenger) education for older and younger users.
SP5.2 Promote and track AARP training. AARP
SP5.3 IPS and Health Systems to coordinate existing efforts such as Think First- which engages High School students to engage is safe driving and passenger behaviorsprioritize schools within TIN.
SP6 Safe People Strategy 6
AARP
Term, Ongoing
Ongoing
Schools, Health, Injury Prevention Coordinators
Pursue a Vision Zero Ambassador program.
SP6.1 Pursue funding to pilot a "Community Ambassador" effort within all communities to share materials, and information regarding Vision Zero and improve civic engagement and education citywide to shift traffic safety culture.
SP6.2 Identify community ambassadors to expand the pilot and launch community awareness and education of Vision Zero principals.
SP7 Safe People Strategy 7
Health by Design, Vision Zero Administrator
by Design, Vision Zero Administrator
Raise traffic safety awareness with the criminal prosecutors.
SP7.1 Encourage appropriate judicial outcomes for road users involved in risky behaviors, especially those resulting in a fatality or serious injury.
SP7.2 Evaluate levels of recidivism of risky behaviors and evaluate alternative measures to curb the behaviors (i.e., stiffer penalties, required remedial courses).
office, with support from IMPD
Prosecutor's office, with support from IMPD
Ongoing
Action Plan Strategies: Post Crash Care
GOAL:
Enhance the survivability of crashes through expedient access to emergency medical care, while creating a safe working environment for vital first responders and preventing secondary crashes through robust traffic incident management practices.
Photo credit:Indianapolis Fire Department
This component continues to evolve as new information and technologies emerge. The first step is to encourage collaboration among agencies and departments to build shared understanding and support around both opportunities and challenges. Engaging healthcare professionals, emergency medical responders, and other first responders in discussions about efficient crash response, scene management to prevent secondary incidents, optimized on-site treatment, and appropriate routing to trauma care centers are all critical factors that influence post-crash care outcomes.
Action Plan Strategies: Post Crash Care
KEY
Cost Estimate
$ = typically under $50,000
$$ = typically $50,000 – $1million
$$$ = typically, $ 1Millon +
PCC1 Post Crash Care Strategy 1
Partner with Marion County Public Health Dept. and the Indiana Department of Health to embed public health policies and considerations with planning and transportation efforts.
PCC1.1 Identify key staff within Health Agencies and coordinate with City departments to improve community assets and socioeconomic factors that are impacted and influenced by transportation access.
PCC1.2
Appoint a representative of the Marion County Health Dept. or a Public Health practitioner to the Vision Zero Task Force & Fatal Crash Review team.
PCC1.3 Appoint a representative of Indianapolis Emergency Medical Service (Indy EMS) to the Vision Zero Task Force.
PCC2 Post Crash Care Strategy 2
Councilors
Evaluate speed management infrastructure to ensure response times for EMS and first responders.
PCC2.1 Assess emergency service routes and inventory traffic regulation devices (preemption), infrastructure (curb extensions, medians, speed humps), general conditions.
PCC2.2 Overlay HIN and HRN with service routes for collaboration between Departments to ensure that potential improvements for safety are balanced and can accommodate emergency vehicles for the shared goal of reducing serious crashes and maintaining response times.
Action Plan Strategies: Safe Vehicles
GOAL:
Expand the availability of vehicle systems and features that help to prevent crashes and minimize the impact of crashes on both occupants and nonoccupants.
Photo credit:Indianapolis Department of Public Works
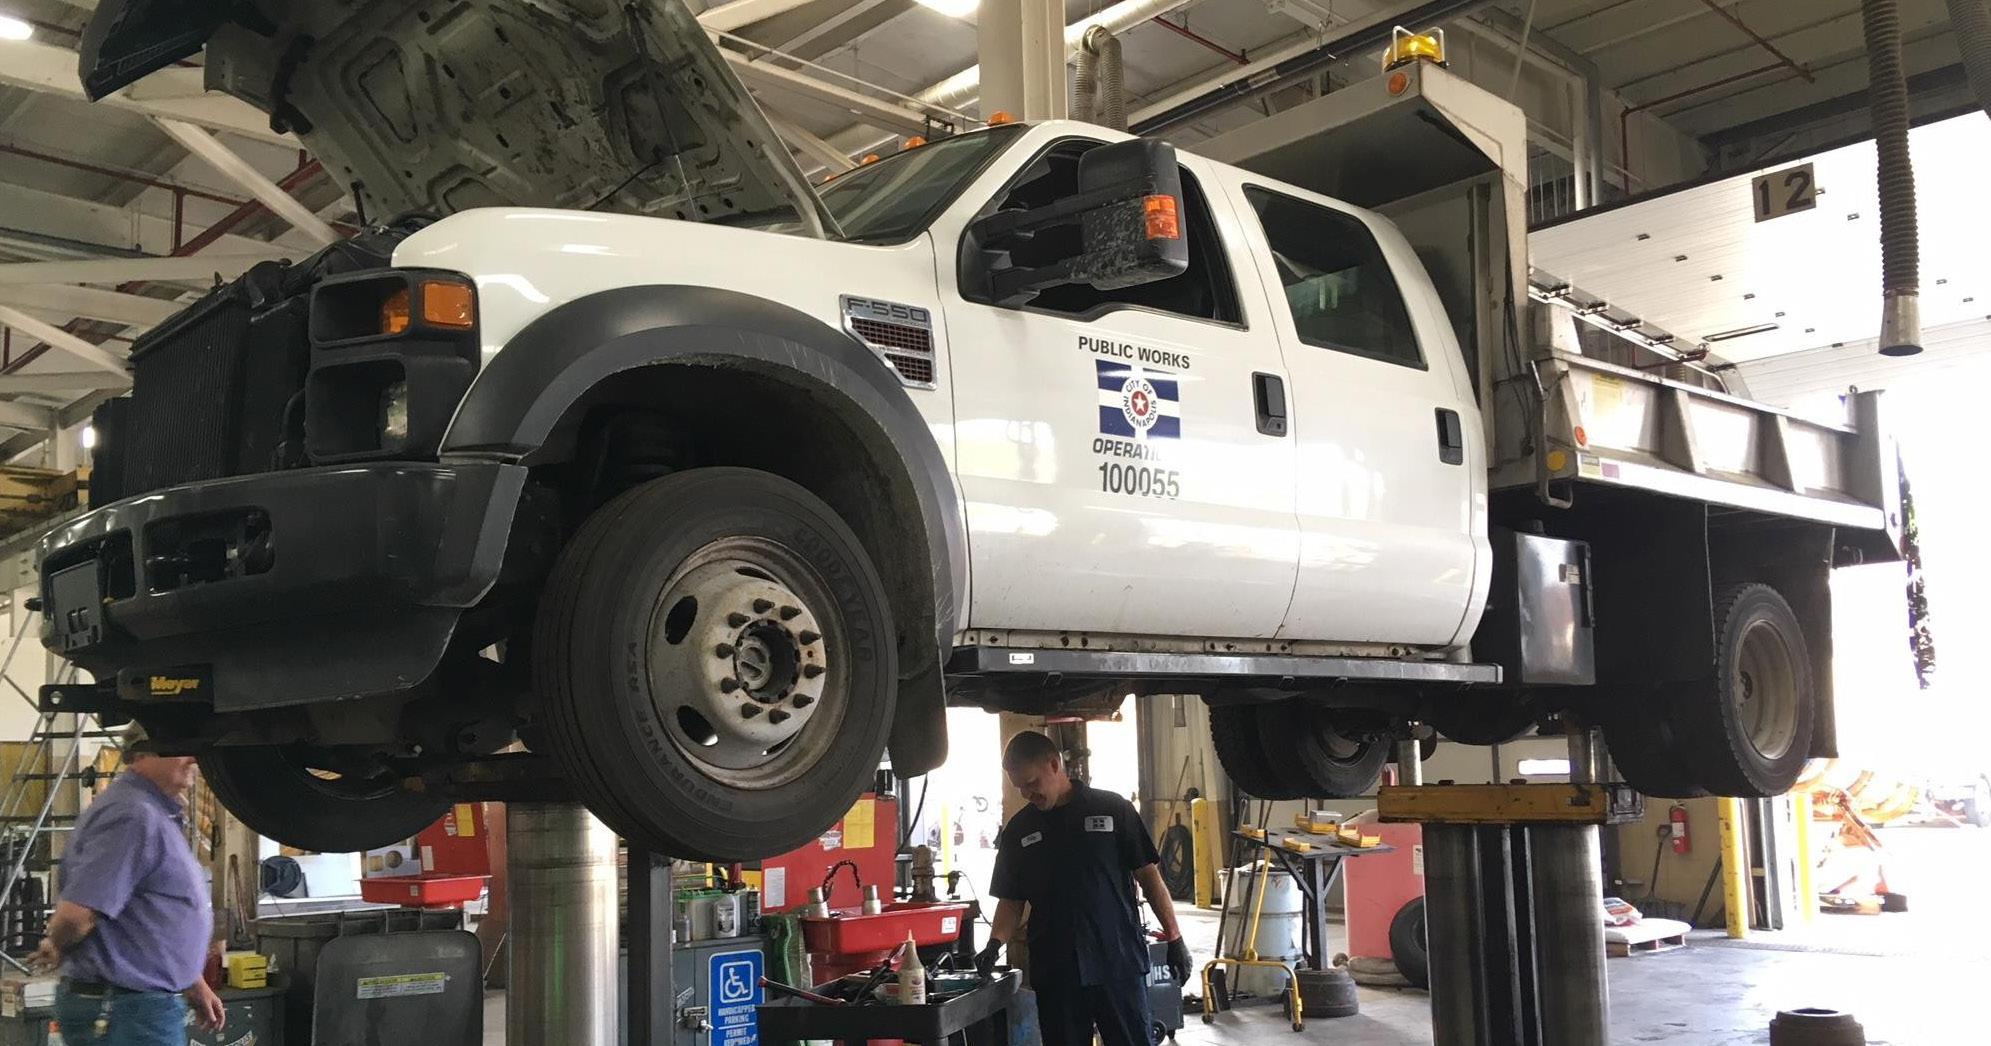
While the City cannot directly influence vehicle manufacturers, it does own and operate its own vehicle fleet. By equipping new fleet vehicles with modern safety features, retrofitting existing vehicles when feasible, and implementing a system that prioritizes timely maintenance to ensure safe operation, the City has meaningful opportunities to advance its Safe Vehicles goals.
SV1.3 Establish recurring citywide training requirements for fleet vehicle operators.
SV1.4 Incorporate fleet
and reporting.
Photo credit:Indianapolis Department of Public Works
Action Plan Strategies: General
Photo credit: Health by Design
These strategies support the overall plan and reflect what the community has clearly expressed: people want better, more open communication. City departments acknowledged that they haven’t always done a great job of sharing their stories, especially when it comes to showing the work already happening and how it makes our streets safer. Putting these strategies into action will help raise awareness, improve understanding, and build stronger trust and partnership between the City and the community.
Action Plan Strategies: General
KEY
Cost Estimate
$ = typically under $50,000
$$ = typically $50,000 – $1million
$$$ = typically, $ 1Millon +
G1 General Strategy 1
Create Vision Zero website with dashboards, crash maps, FAQs, VZ Plan.
G1.1 Website is created and posted with communications elements.
G1.2 Update the HIN & HRN every 3-5 years.
G2 General Strategy 2
Zero Administrator
Administrator
Provide training for media professionals on how to best communicate about traffic crashes and roadway safety, develop media kit at the City.
G2.1 Train PIOs and identify a main contact for media and other communication strategies.
G2.2 Work to educate local media (e.g. "crash not accident") to increase awareness, reduce victim blaming and promote systemic safety culture.
G2.3 Include media focusing on priority populations. Scan messaging for cultural competence.
Zero Administrator, Supported by City-County Councilors
Vision Zero Administrator, Supported by City-County Councilors
Zero Administrator, Supported by City-County Councilors
G2.4 Task Force and Administrator provide quarterly updates to media outlets, highlighting key projects and successes.
G2.5 Track earned media and report annually.
Zero Administrator, Supported by City-County Councilors
Vision Zero Administrator, Supported by City-County Councilors
Safe People
G3
General Strategy 3
Create and publish a Vision Zero annual report.
G3.1 Develop and implement an evaluation process.
G3.2 Identify and track Key Performance Indicators (KPIs).
G3.3 Ensure interdepartmental coordination and collaboration in all development processes.
G4
General Strategy 4
Administrator, Task Force
Administrator, Task Force
Administrator, Task Force
Establish a street project communication process with the public.
G4.1 Share potential project info publicly: Provide project Purpose & Need, engage Councilors and project staff to survey public on potential alternative(s) options in advance of project design/execution to garner support as project advances. DPW, City-County Councilors
G5 General Strategy 5
Improve Inter-agency roadway/traffic data sharing.
G5.1 Coordinate between Task Force partners to remove silos of information, minimize duplication of efforts.
G5.2 Train/educate officers on importance of accurate crash report information/narratives and its impact to data decisions.
Administrator
TRANSPARENCY & ACCOUNTABILITY IN VISION ZERO REPORTING
Transparency & Accountability in Vision Zero Reporting
Indianapolis is committed to transparent and accountable reporting on the progress of the Action Plan.
Public trust and community engagement are essential to ensure that safety improvements are effective, equitable, and data driven.
This approach uses a combination of Key Performance Indicators (KPIs), measurable targets, and regular reporting to track progress and share results with the Task Force and public.
Safety Outcomes (Vision Zero Dashboard)
The core of Vision Zero is to eliminate Fatalities and Serious Injuries on our streets. The Task Force will track safety outcomes using the following metrics:
Total Traffic Fatalities
Targeting zero fatalities (0) by 2035. Quarterly reporting will track trends and progress on the Vision Zero Dashboard and in the Annual Report.
Serious Injuries & by mode
Targeting zero (0) by 2035 with year-over-year trends. Reporting will include mode-specific breakdowns and highlight trends.
Fatalities by Mode
Pedestrians, bicyclists, motorists. Annual updates showing trends and identify priority areas for intervention.
Demographic Disparities
Aggregated data of demographics will be reported to highlight inequities and monitor progress toward reducing disparities.
All safety outcomes will be reported regularly via the Vision Zero Dashboard and in the Vision Zero Annual Report as dedicated by ordinance, ensuring public access to clear and timely information.
Total traffic fatalities
Zero (0) by 2035
Total traffic serious injuries
Fatalities by mode (pedestrian, bicycle, motorist)
Serious Injuries by mode (pedestrian, bicycle, motorist)
Fatalities by Demographics
Zero (0) by 2035
Zero (0) by 2035
Zero (0) by 2035
Zero (0); showing disparity reduction and comparison
Quarterly Vision Zero Dashboard; Annual Report
Quarterly Vision Zero Dashboard; Annual Report
Quarterly Vision Zero Dashboard; Annual Report
Quarterly Vision Zero Dashboard; Annual Report
Quarterly Vision Zero Dashboard; Annual Report
Photo credit: Health by Design
Safe System Implementation Metrics
(Annual Reports)
To ensure public accountability, annual reports will be submitted each May, detailing progress on implementation to support safety outcomes, and key performance metrics. Indy Vision Zero Annual Reporting aims to monitor the effectiveness and implementation Action Plan Strategies using Safe System Approach across five pillars; these metrics could include some of the following metrics:
Safe Roads
Percent of high-injury network streets with safety interventions, miles of protected bike lanes or pedestrian infrastructure, and streets redesigned using Safe System principles. Reporting includes project details, capital investments, and safety improvements.
Safe Speeds
Speed-reduction interventions implemented, traffic enforcement metrics, and percentage of traffic signals or signage reviewed/ adjusted.
Safe Vehicles
Progress of City fleet equipped with safety technology.
Safe People
Public education events, enforcement intervention events, and community-led safety programs, and impact assessments.
Post-Crash Care
Aggregate analysis and recommendations from the Fatal Crash Review Team, including locations, interventions, and investments.
Each metric aims to quantify data and to track progress and safety improvements annually.
Community Engagement & Transparency
Public Dashboard Updates
Update quarterly to provide open access to real-time data.
Neighborhood-Focused Engagement
Across Indianapolis neighborhoods and communities.
Vision Zero Task Force Meetings
Policy & Strategy Evaluations
An annual review of existing strategies’ effectiveness and the identification of policy gaps and/or recommendations for new strategies for improvement.
By publishing these metrics, the Task Force ensures that residents, advocacy groups, and stakeholders can track progress and contribute to ongoing improvement efforts.
Photo credit: Health by Design
Acknowledgments
We extend our deepest gratitude to the many individuals, city agencies and departments, and community members whose time, expertise, and care made this Indianapolis Vision Zero Action Plan possible. This plan reflects a shared commitment to safer streets, equitable outcomes, and the belief that traffic deaths and serious injuries are preventable. Thank you.
Todd Wilson, Director of Department of Public Works
Jill Palmer, P.E, Muli-model Program Manager, DPW
Mark St. John, P.E, Chief Engineer, DPW
Nathan Sheets, Deputy Director of Engineering, DPW
Tucker Born, P.E, Traffic Signal Systems Engineer, DPW