


Actionable data provides real-time insights into your project's performance, highlighting issues that demand immediate attention.
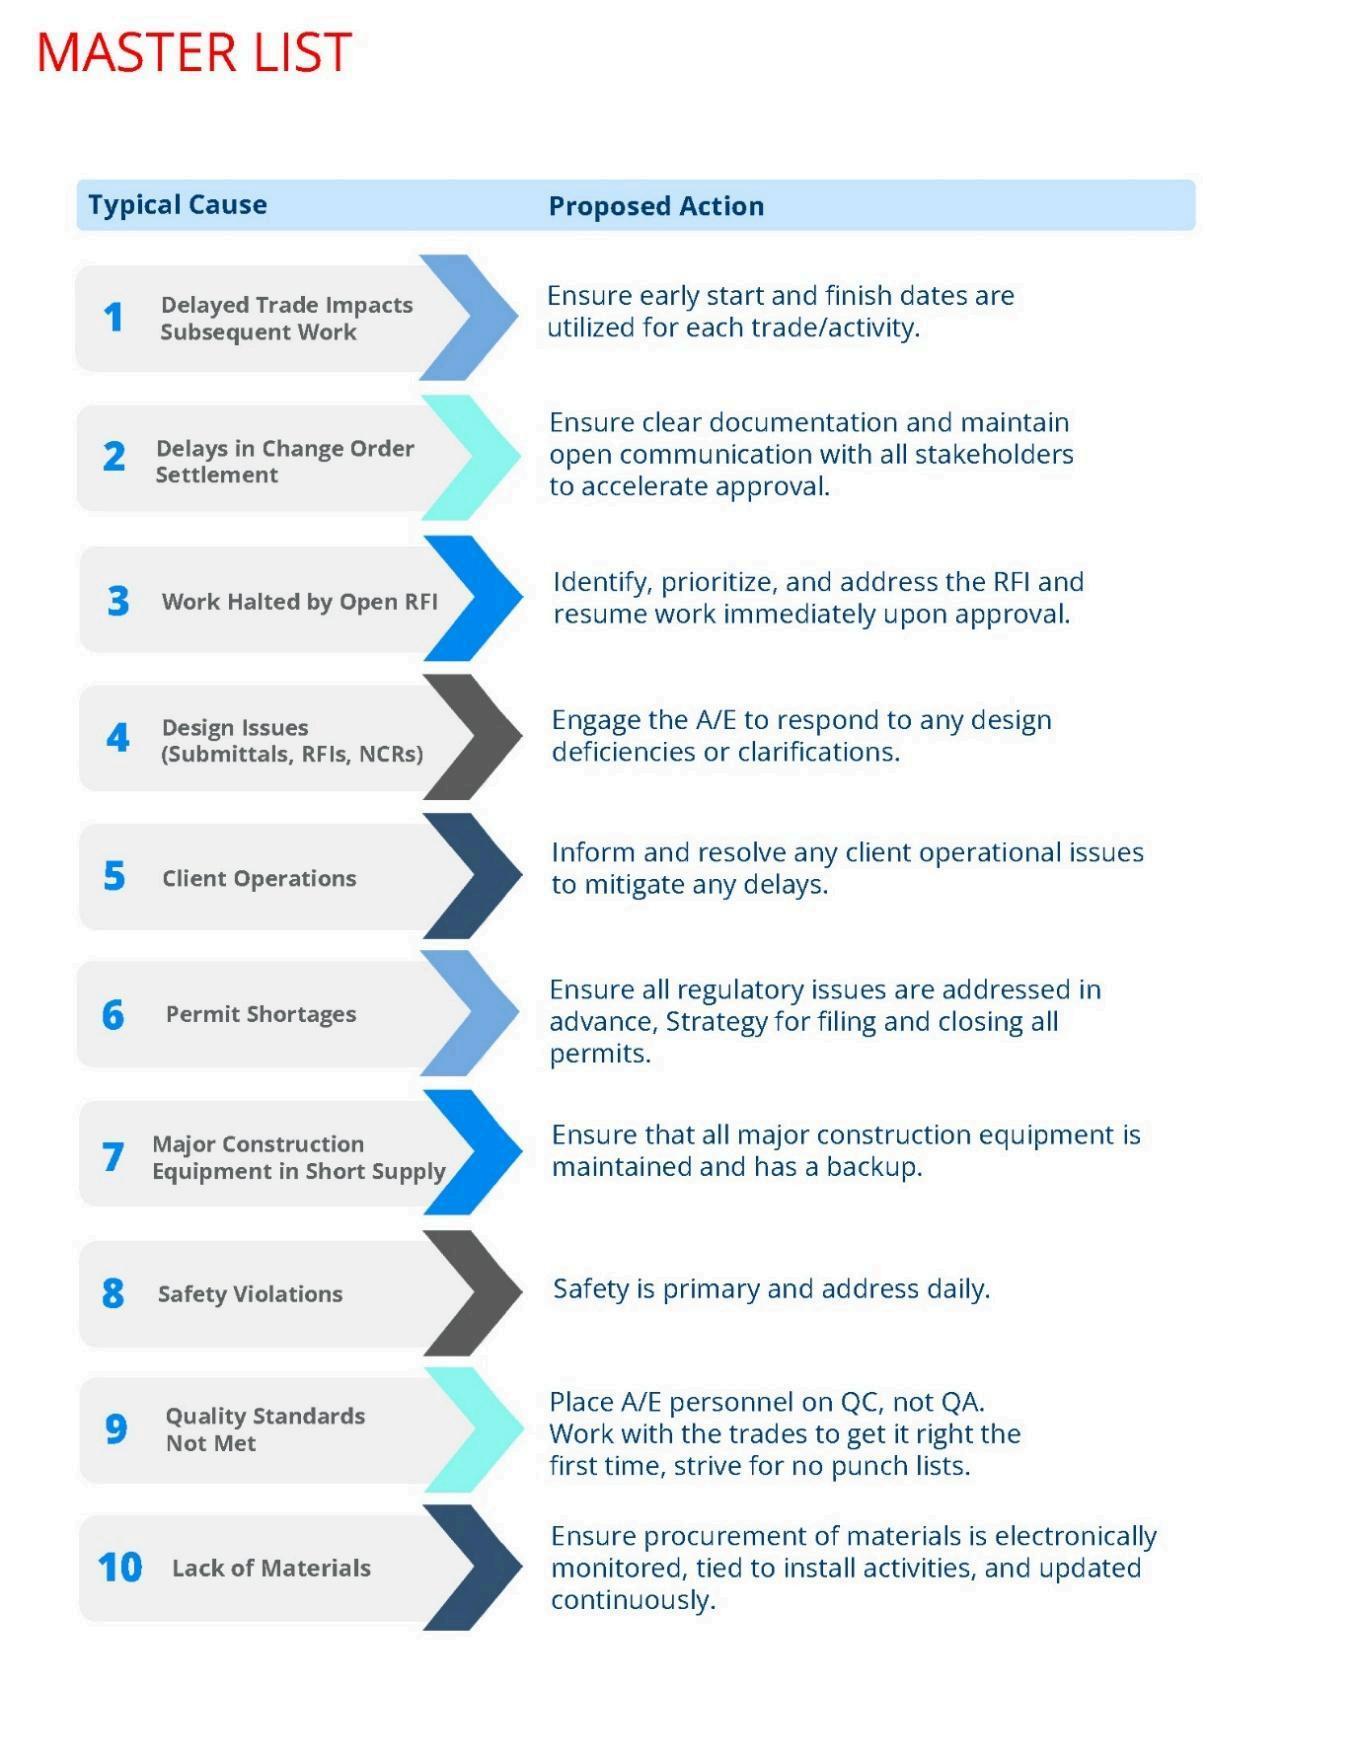
At Group PMX, we understand that the biggest challenges in project delivery often stem from the unknown. Whether it's managing manpower, closely managing schedules, handling submittals, procuring materials, addressing open RFIs, or processing change orders, any of these areas, if not properly managed, can severely impact efficiency and cause significant delays
Monitoring live data allows you to spot a problem or potential delay before it affects the schedule and eliminates the standard practice of reviewing old data
We bring data sources to life by building secure, user-friendly dashboards that will redefine how you approach project management. Our dashboards seamlessly integrate multiple data sources, providing a centralized, customizable, and interactive hub that enhances your ability to monitor project health
We utilize Microsoft Power BI to create dashboards from data generated in systems such as Procore, Primavera P6, On Target, Unifier, e-Builder, myComply, and Newforma, to name a few. We also integrate with PlanGrid, GoFormz, and practically any software that offers OpenAPIs.
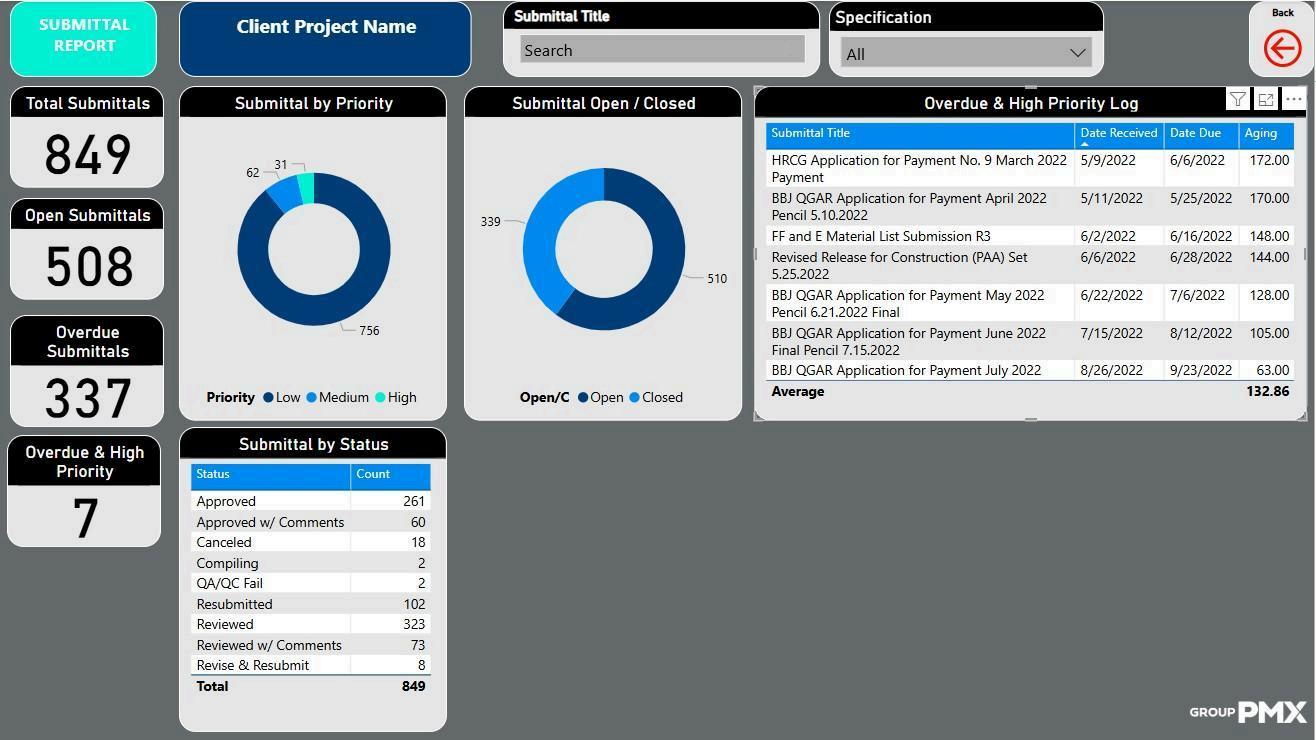
*Sample Dashboards on pages to follow
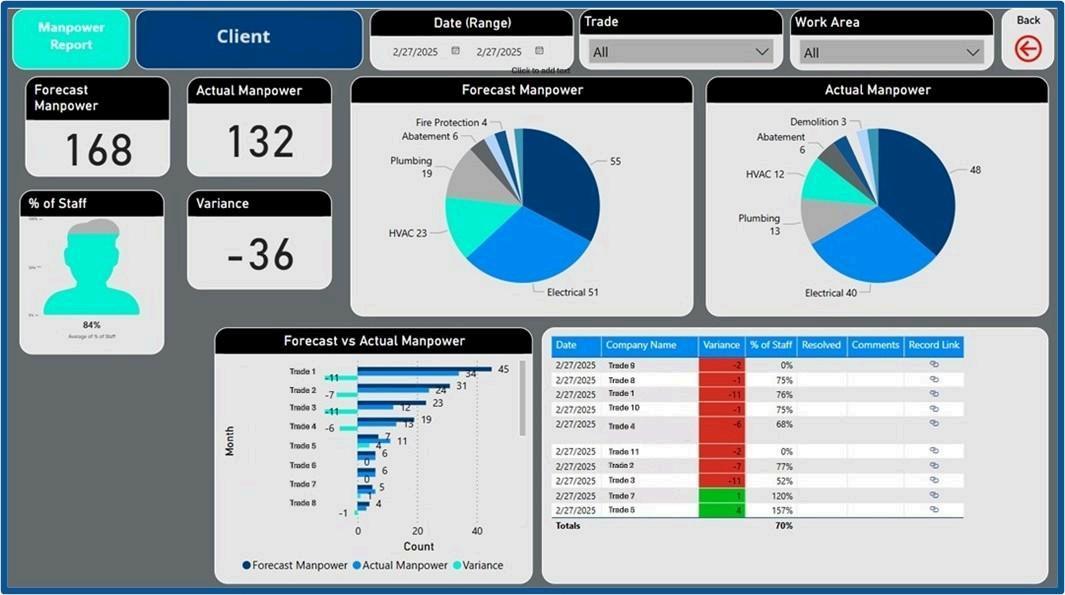
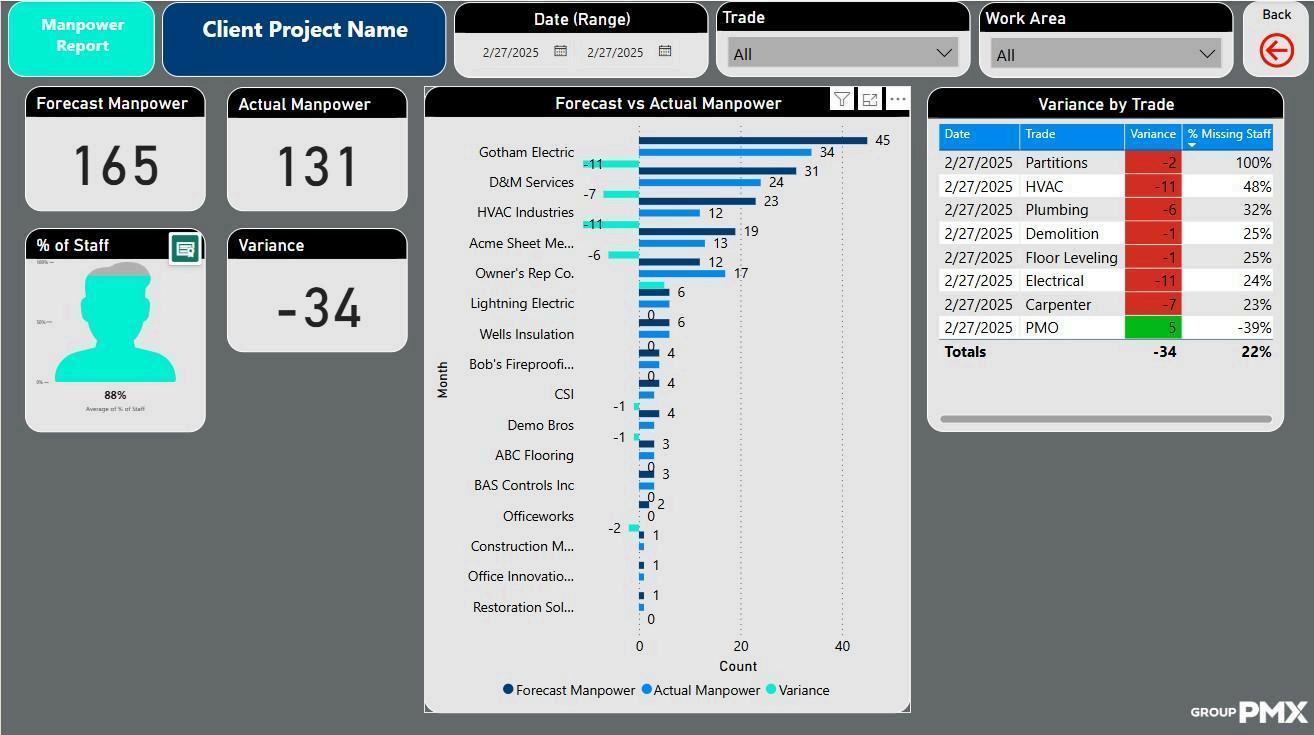
+ Planned vs. Actual Manpower by Trade*
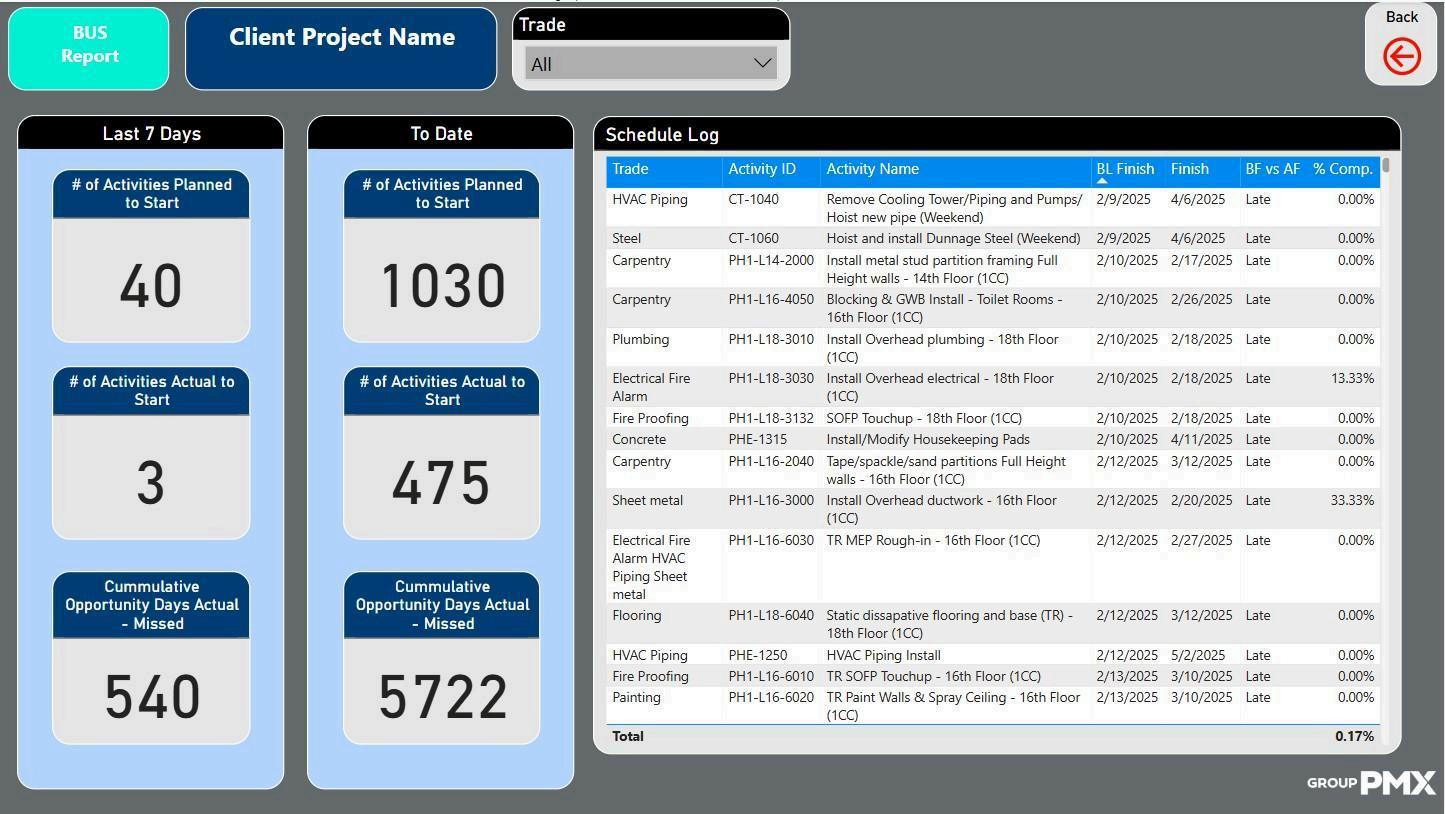
+ Schedule Early Dates Compliance*
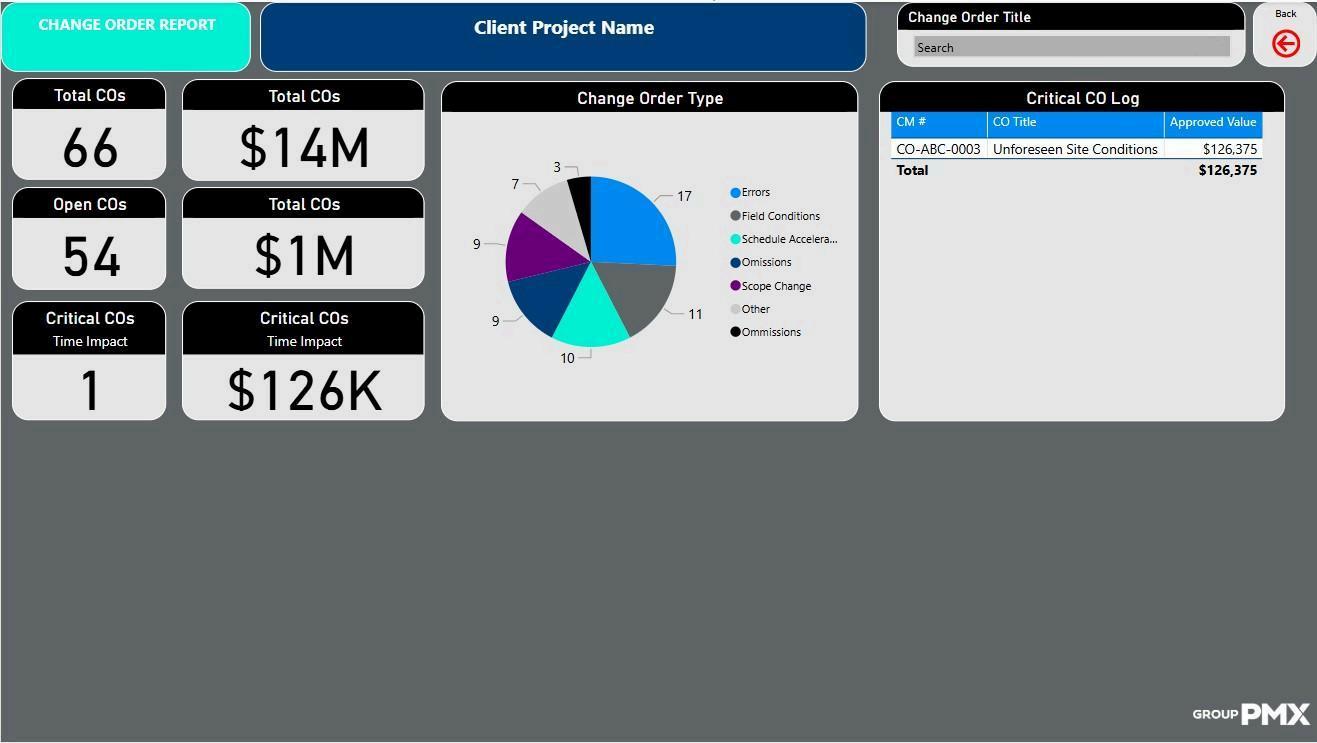
+ Change Orders*
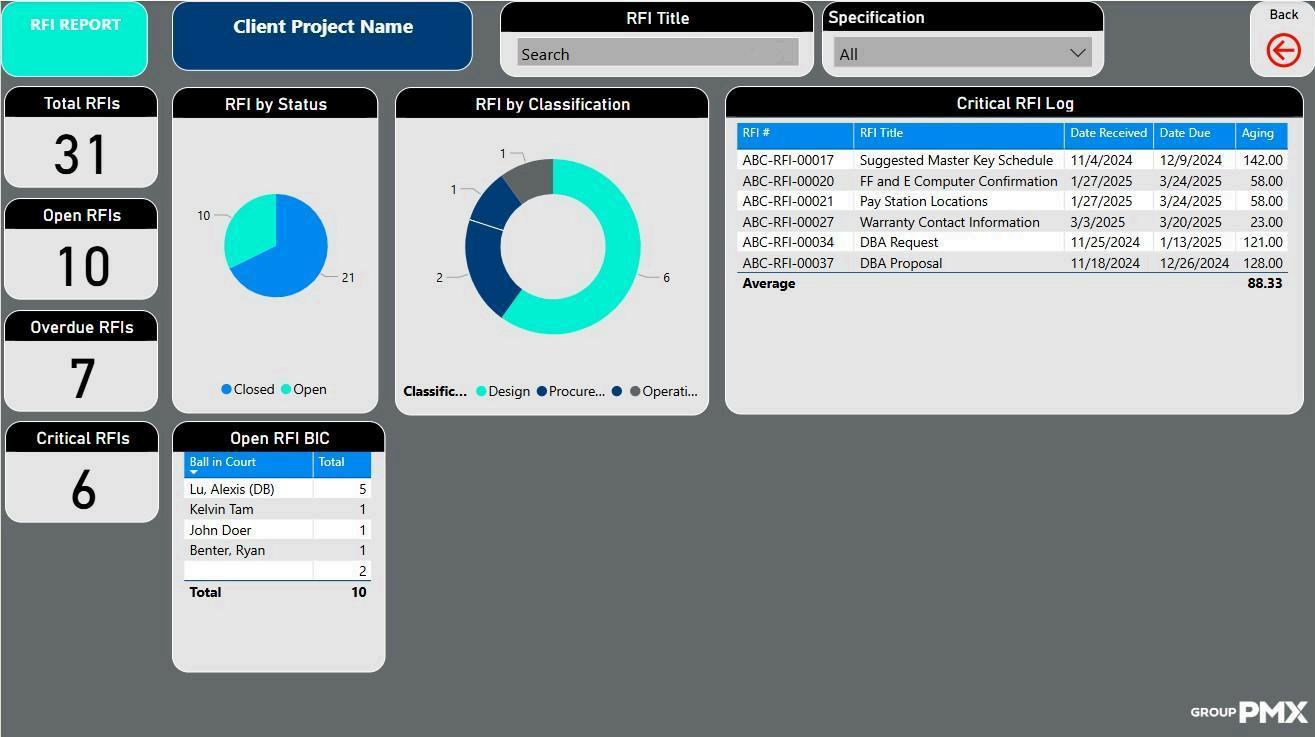
+ RFI's (Request For Information)*


+ Submittals*
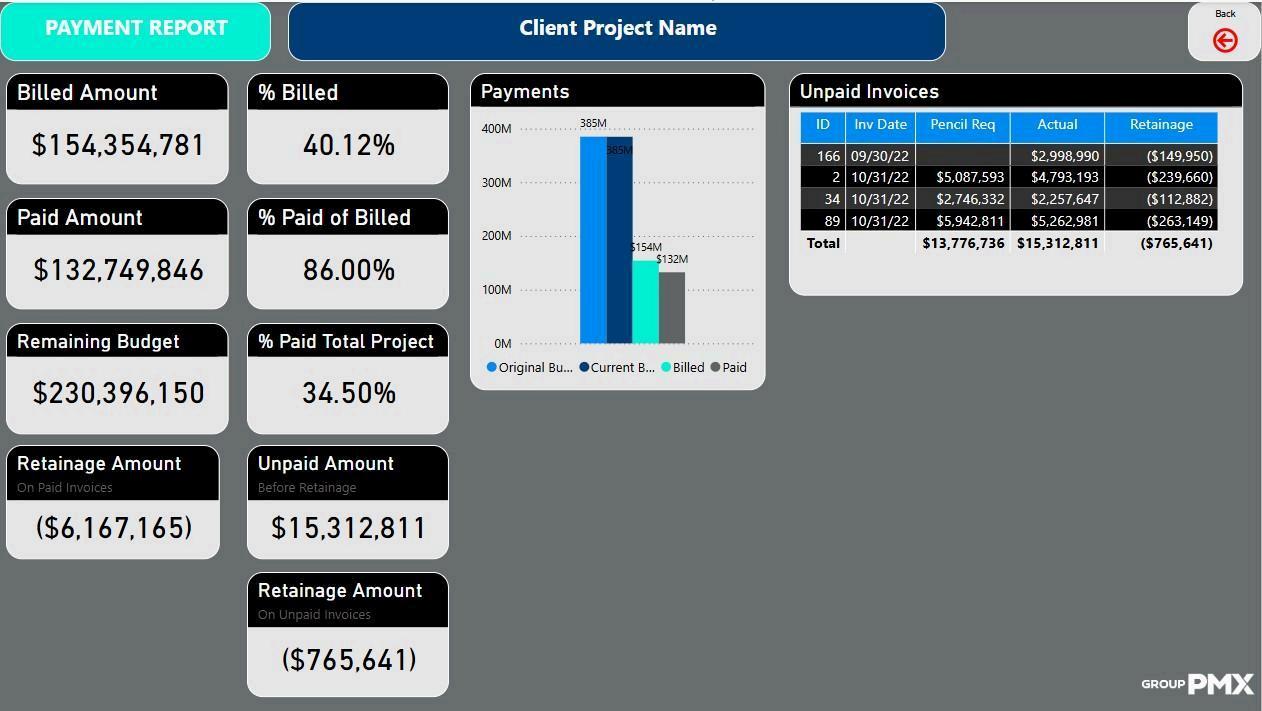
+ Payments*
+ Procurement of Materials by Trade
+ Equipment Status
+ Design Issues
+ Safety Violations/Incidents
+ Risk Appetite
+ QA/QC (Quality Assurance/Quality Control)
+ Regulatory/Permit Issue
These common issues can be addressed by monitoring real-time data and responding quickly. No longer do you have to rely on month-old data that keeps you lagging behind. Your goal: Take action to remove obstacles and prevent project delays, not just report on them.
Data points to review to detect issues, identify causes, and mitigate immediately:
+ Total planned manpower vs. actual manpower by trade by day.
+ Variance between planned and actual as a percentage of actual manpower.
+ For any variance of more than 10% less than the plan, identify reasons why and remove the delay or hindrance immediately.
Data points to review to detect issues, identify causes, and mitigate immediately:
+ # of activities planned to start and finish vs. actual starts and finishes
+ # of opportunity days misses
+ # of delayed starts or finishes by trade
Data points to review to detect issues, identify causes, and mitigate immediately:
+ # of total/open change orders illustrating potential delays in settlements
+ Change orders tracked by initiator/reason
+ Total change orders + value
+ Total change orders + value + aging
Data points to review to detect issues, identify causes, and mitigate immediately:
+ Tracking the number of RFIs submitted per project, the time taken to resolve them, and/or the RFI resolution rate.
+ Identify critical RFIs and measure response time.
+ Open RFIs + overdue + aging
Data points to review to detect issues, identify causes, and mitigate immediately:
+ Overdue submittals
+ Average submittal review time
+ Number of submittal revisions
+ On-time submittal rate
+ Open, late, and critical submittals
Data points to review to detect issues, identify causes, and mitigate immediately:
+ Billed vs Paid % + Billed vs Paid $ Amount + Remaining Budget + Unpaid Invoices View