


Greater Phoenix has long been a healthcare destination because of its excellent quality of life and well-established healthcare providers. Today, a new innovative healthcare and bioscience industry has emerged from Greater Phoenix’s legacy of care. Supported by outstanding educational partners and a talented growing workforce, the healthcare and bioscience industries are booming in Greater Phoenix.
With an innovative and collaborative ecosystem in Greater Phoenix, it is no surprise that so many top companies choose the region.
Here are just a few reasons why so many top companies choose Greater Phoenix:
• A vibrant research and development ecosystem with thousands of ongoing clinical trials anchored by nationally recognized healthcare institutions
• The perfect blend of workforce quality and talent availability for staffing requirements that fit company priorities
• University and industry alignment to cultivate R&D and entrepreneurial innovation
• Significantly lower operating costs than traditional competitor regions, allowing companies to grow and scale


University Alignment

Competitive Operating Costs
Bioscience & Healthcare Innovation
Value Proposition

Broad Healthcare Provider Network
University Alignment
• Multiple medical schools throughout the region
• Innovative programs at Arizona State University and University of Arizona driving medtech, diagnostics, and translational research
Cutting-Edge Research Talent Availability
• Thousands of clinical trials take place in Greater Phoenix annually
• Four primary bioscience clusters driving innovation:
i. Mayo Clinic’s Discovery Oasis (DO)
ii. Phoenix Bioscience Core (PBC)
iii. Phoenix Medical Quarter
iv. Scottsdale Cure Corridor (SCC)
• More than 11,000 graduates from related degree programs in 2022
• Workforce consisting of nearly 14,000 more employees than that of San Diego

Cutting Edge Research

Talent Availability
Broad Healthcare Provider Network
• Nationally recognized hospitals and institutes call Greater Phoenix home
• Banner Health, headquartered in Phoenix, is the region’s largest private employer
Competitive Operating Costs
• Operating costs are significantly lower than traditional competitor regions
• Workforce costs are thousands less than peer markets
• Housing costs are 2.5x less than San Francisco

Greater Phoenix’s bioscience ecosystem is experiencing rapid growth, positioning the region as an emerging industry hub. Cutting-edge research in precision medicine, neurosciences, biomarker identification and immunotherapies are advanced in the region through strong core capabilities in translational genomics, medical device manufacturing, diagnostic development and clinical trials activity. These innovations are supported by a renowned institutional network, strong university system and workforce pipeline, while the funding opportunities and business-friendly ecosystem make the region an increasingly competitive market for bioscience innovation.
Bioscience Leaders

EarlyPhaseComplex Clinical Trial Services
Diagnostic and Prognostic Clinical Operations


Biopharmaceutical Manufacturing
CGM Manufacturing

CompoundingAdmixture PharmacyServices

Cancer Diagnostic Development
Microelectronic Manufacturing Automated Diagnostic Testing

25-Acre Biomedical ManufacturingSite

Blood and Specimen Processing

Microarray Development andManufacturingfor Diagnostics and Life ScienceResearch

R&D, Bioinformatics, Blood ProfilingLab,Specimen Processing

Manufacturing of Breast ImagingTechnology

Laboratory Services (Subsidiary of Quest Diagnostics)
Greater Phoenix Arizona
Source: City of Phoenix
Greater Phoenix is home to a diverse population, making it an ideal location for clinical trials. This diversity has helped Arizona become a top state for clinical trials with over 1,000 active trials and 1,500 more in the recruitment phase.
In October 2023, a consortium of 28 public, private and academic partners led by GPEC was awarded a Strategy Development Grant as part of the EDA’s Tech Hubs program. The group was one of 29 recipients across the U.S. to receive the award. It will go toward strategic planning to increase medical device manufacturing in the region driven by emerging technologies such as artificial intelligence and machine learning, bolstering the sector’s domestic competitiveness and creating opportunities to grow the field’s skilled workforce.
The consortium is made of:
• Arizona State University
• Grand Canyon University
• Northern Arizona University
• Phoenix Bioscience Core
• University of Arizona – Phoenix
• City of Chandler
• City of Phoenix
• Maricopa County
• Barrow Neurological Institute (BNI)
• Dignity Health
• HonorHealth
• Medtronic
• GT Medical Technologies
• W.L. Gore & Associates (Gore)
• IdeaLabX

• BD Peripheral Intervention (BD)
• Intel
• Mayo Clinic
• Remedy Medical Manufacturing
• Greater Phoenix Economic Council (GPEC)
• Partnership for Economic Innovation (PEI)
• Maricopa Community Colleges
• Flinn Foundation
• Arizona Bioindustry Association (AZ Bio)
• Yoo & Co Accelerators
• Vitalyst Health Foundation
• Local Initiatives Support Corporation (LISC) –Phoenix, Healthy Communities
• Virginia G. Piper Charitable Trust

Below are the total number of non-distance program completions at colleges and universities in Greater Phoenix for healthcare and bioscience fields. With over 11,000 graduates in 2022, the region’s talent pipeline is comparable to peer markets like Atlanta, Houston and San Diego. Its STEM completion growth rate is twice the national average, putting its average ratio of graduates to total population in line with markets like New York, Raleigh-Durham and Nashville.
67%


The University of Arizona College of Medicine – Phoenix is committed to four pillars that empower its mission and vision for the future. The education, research, clinical and community service pillars converge in many areas and synergistically for the foundation of the college.
• Nine clinical partners, anchored by Banner Health
• 2,500+ faculty

Since its 1987 arrival to Arizona, Mayo Clinic has expanded its footprint with education, research and medical facilities on its Phoenix and Scottsdale campuses. By the end of 2024, Mayo Clinic is scheduled to complete its 1.6 million square-foot expansion to double the size of its Phoenix campus. In Scottsdale, the Mayo Clinic Alix School of Medicine and Arizona State University (ASU) offer dual degree programs in health care delivery, health informatics and biomedical diagnosis. Overall, its facilities account for more than 10,000 staff members, provide more than 65 medical and surgical specialties, and serve more than 155,000 patients annually.

Located at Dignity Health St. Joseph’s Hospital and Medical Center in Phoenix, the students from the Creighton University School of Medicine have served clinical rotations at this location since 2005. In 2017, the school founded an alliance alongside Dignity Health, District Medical Group and Valleywise Health to provide access to high-quality teaching environments for Creighton students and medical residents. Creighton University and ASU partnered on education and research in 2020. In 2021, the school opened a 195,000-square-foot full four-year medical school campus in midtown Phoenix, which can accommodate roughly 900 students.

Midwestern University, which expanded to Glendale in 1995, specializes in the education of dental medicine, health science, osteopathic medicine, optometry, pharmacy, podiatric medicine and veterinary medicine. The university has invested over $350 million in Glendale and has created over 700 campus-based jobs. As of January 2024, it had more than 32,000 graduates across two states, and it has repeatedly been named one of the region’s healthiest employers by the Phoenix Business Journal.


ASU stands out for its significant engagement in the healthcare and bioscience sectors, underlining a commitment to collaborative research, education and innovation that spans across disciplines and industries. Through strategic initiatives like the pioneeringBiodesign Institute, a robust partnership with the Mayo Clinic and the comprehensive offerings of the College of Health Solutions, ASU fosters an environment where interdisciplinary teams work together to push the boundaries of medical science and healthcare delivery.
ASU’s Biodesign Institute encompasses 350,000 square feet of building space to suit the needs of researchers in biomedicine, health outcomes, sustainability, and security. One-third of ASU research facilities are devoted to biological and biomedical sciences, which include biosafety level3 laboratories, and more than a quarter of the STEM degrees the school awards annually are in the biological sciences. There are more than 15 research centers at theBiodesign Institute, including:
• Bioelectronics and Biosensors
• Bioenergetics
• Biomaterials Innovation and Translation
• Fundamental and Applied Microbiomics
• Health Through Microbiomes
• Innovations in Medicine
• Molecular Design and Biomimetics
• ASU-Banner Neurodegenerative Disease
For more information about ASU’s Biodesign Institute, please visit: https://biodesign.asu.edu/
#1 most innovative school in the U.S. (U.S.News & WorldReport,2016,2017,2018, 2019, 2020, 2021, 2022, 2023)
#1 in the nation for global impact in research, outreach, and stewardship (U.S News & World Report, 2022)
$800M spent on R&D expenditures in 2022 (NSF)
Student population of almost 80,000 across four regional campuses

ASU offers hundreds of undergraduate and graduate degrees to thousands of students in its health and bioscience programs. Highlighted below are 3 key programs:

The evolution of data and analytics in the 2020s have molded an ecosystem in which informatics are imperative to the entirety of the healthcare sector. Among the College of Heath Solutions key offerings is specializations in biomedical informatics (B.S., M.S., Ph.D.) biomedical diagnostics (M.S.) and health informatics (M.S.) as offerings to the health program’s student population.

The School of Life Sciences is rapidly becoming a global leader in life science education and discovery. With nine undergraduate programs and 20 graduate programs, students pursue several types of biology, microbiology, molecular and cellular biology, and neuroscience, along with computational, environmental and other life sciences.

CISA recognizes that the complexities and interconnectedness of our world, diving into a broad variety of areas including indoor farming, multiculturalism research, and studies on the effects of climate change. Among its dozens of undergraduate and graduate degrees is applied biosciences, which provides rigorous field and lab work to prepare students for biology and related sciences.

Explore major companies and bioscience hubs on the Greater Phoenix map.

Bioscience Hubs
Phoenix Bioscience Core Discovery Oasis
Phoenix Medical Quarter Scottsdale Cure Corridor
Source: MAG 2022 Employer Database
Located in downtown Phoenix, the Phoenix Bioscience Core (PBC) is a 30-acre urban medical and bioscience campus that serves as a premier and dynamic environment for research activities. The PBC hosts the highest concentration of research scientists and complementary research professionals in the region and provides firms with unprecedented opportunities for growth and collaborative efforts with industry leaders.
It is a collection of Arizona’s three major universities, three of the five major hospital systems that operate in the region, and a mixture of public and private research clustered in the same neighborhood in the heart of the capital.
Representing the full spectrum of the healthcare industry, PBC is home to educational institutions, government agencies, hospitals, and bioscience companies. Here is a sample of the industry’s presence inside the core:
Academia/Public Research


Government/Non-Profit Private


Center forEntrepreneurial Innovation


THC Detection CancerDetection CancerVaccines

PrecisionNAPPA Arrays

Clinical Partners

As of 2023, the PBC has 2 million square feet of biomedical-related research, academic, and clinical facilities, with plans to develop more than 6 million at full buildout. Part of the current campus includes 850 PBC, a 227,000-square-foot fully lab-enabled center that was opened by Wexford Science + Technology in the spring of 2021.
850 PBC was designed as an incubator and coworking laboratory space for bioscience companies to collaborate and innovate as part of the Phoenix bio-ecosystem. It is currently home to emerging companies such as Calviri and Theriome, ASU’s Translational Research Center, the Center for Entrepreneurial Innovation along with their Market Validation Lab andLabForce programs that offer training courses. In September of 2023, Wexford announced that the NIH will be expanding into the space to accommodate the Phoenix Epidemiology and Clinical Research Branch of the NIH’s NIDDK.
In 2022, the University of Arizona announced its plans to develop a new anchor institution for the PBC in its Center for Advanced Molecular and Immunological Therapies (CAMI). It will be a national biomedical research hub in Phoenix to unravel the complexities of the immunology of cancers, infectious diseases and autoimmune conditions. The goal is to develop novel strategies for the diagnosis, prevention and treatment of diseases.
For more information about PBC, please visit: https://phoenixbiosciencecore.com/

The Discovery Oasis is a 120-acre medical and research campus with 3.3 million square feet of facilities, created for the entire ecosystem of biomedical innovators and home to the Mayo Clinic and ASU Health Futures Center. Designed as a unique scientific community, the flowing site plan incorporates research facilities, offices and site amenities in hubs that intersect to encourage collaboration and convergence.
The Discovery Oasis is also home to the MedTech Accelerator, a flagship program of the Mayo Clinic and Arizona State University Alliance for Health Care, providing early-stage medical device and health care technology companies with an entrepreneurial curriculum and personalized business development plans to accelerate go-to-market and investment possibilities.
The site at a glance:
• Build-to-suit Class A facilities
• Wet and dry labs, biomanufacturing facilities, and flexible office space
• Multi-modal transit system connecting the campus
• Adjacent to Mayo Clinic Hospital Phoenix campus
• 150,000-square-foot ASU Health Futures Center
• South of Loop 101 freeway in North Phoenix between 56th and 64th Streets
• Easy highway and airport access
• Ideal co-location opportunities for companies with biomedicine, health sciences, medical technologies, big data and computational focus


For more information about the Discovery Oasis, please visit:https://discoveryoasis.com/
Announced in April 2023, the Phoenix Medical Quarter is a bio-innovation district anchored by Creighton University, Barrow Neurological Institute and Phoenix Children’s Hospital in and around Park Central. The designation recognizes the influx of healthcare, bioscience and biomedical education into the midtown region, including the WearTech Applied Research Center, RadNet imaging center, Alliant International University’s nursing school, WCUI Smith Chason College, DMG Children’s Rehabilitation Services and more.
The Barrow Neurological Institute is also undergoing significant expansion. In 2022, it officially opened the state-of-the-art Barrow Neuroplex, strengthening its position as a premier destination in the world for neurology and neurosurgery. In 2024, the new Ivy Tumor Brain Center global headquarters will open, making it the world’s largest translational research center dedicated solely to brain tumor drug development and treatment.







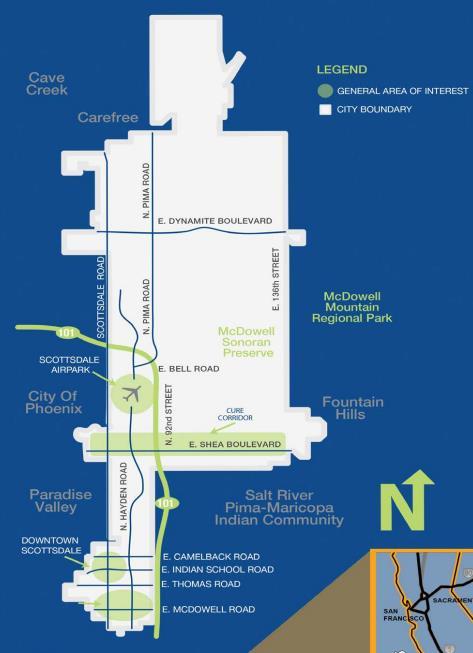
The Scottsdale Cure Corridor (SCC) is a concept designed to promote innovative activities around the concentration of the bio-life sciences sector in Scottsdale. SCC is a locale for education and research, clinical trials and patient care delivery.
Select Businesses in SCC
• Arizona Breastnet
• Arizona Oncology
• ASU Department of Biomedical Informatics
• Cereset
• CVS Caremark
• GlobalMed
• HonorHealth Research Institute
• LabCorp
• Mayo Clinic
• Provista Diagnostics
• Southwest Medical Imaging
• St. Jude Medical
• Translational Drug Development (TD2)
• US Oncology
• West Pharmaceutical Services




The West Valley Health Quarter is a growing center in Avondale. It runs along the I-10 from 99th Avenue west to Dysart Road between Thomas Road and Van Buren Street. It measures 8 square miles with over 65 healthcare-related companies, 12,000 technology workers and 40,000 healthcare workers.
Some representative healthcare-related providers include the Copper Springs Hospital, the Phoenix Children’s Southwest Specialty and Urgent Care Center and the Arizona Center for Cancer Care.
• AKOS Medical Campus
• Arizona Center for Cancer Care
• Bio Life
• Bridgewater Assisted Living
• Copper Springs Hospital
• IORA Health by Humana
• Legacy House of Arizona


For more information about AHTC, please visit: https://avondaleedge.com/west-valley-health-quarter/

Midwestern University — Glendale
Midwestern University (MWU), located in Glendale, is on the cutting edge of a variety of healthcare research. The Nanomedicine Center of Excellence in Translational Cancer Research under the College of Pharmacy allows students from pharmacy, biomedical science, osteopathic medicine, dental medicine and veterinary medicine to participate in the center’s initiatives. Its vision is to build a growing institutional research investment based on the experience of its multidisciplinary team of well-established investigators in nanoscience and nanomaterials, as well as expand the current collaborative research network with pre-clinical and clinical investigators with diverse experiences and skills.
CTCA’s comprehensive cancer treatment hospital is committed to bringing its patients new and innovative cancer treatment options. It has a cancer hospital in Goodyear, and three outpatient care centers in the Greater Phoenix area including Gilbert, Phoenix and Scottsdale.
With locations throughout Greater Phoenix, ICRC provides advanced cancer treatments to many in the region. ICRC has an active and expanding clinical research program and is committed to the advancement of medical knowledge and patient care. They have an active and expanding clinical research program that is helping to create the future of high-quality medical care.


Top Greater Phoenix Private Employers Across All Industries
#1
Banner Health
29,745 employees
Banner Health
#8
HonorHealth
9,461 employees
#9
Dignity Health
9,149 employees
#10
Mayo Clinic
8,786 employees
Banner Health focuses on diagnostic, treatment and prevention methods for diseases such as Alzheimer’s, Parkinson’s, cardiovascular disease, respiratory disease, infectious disease, COVID-19 and cancer. The Banner Alzheimer’s Institute, which operates in Phoenix, Sun City and Tucson, has a three-part mission is to end Alzheimer's without losing another generation, set a new national standard of patient and family care and forge new models of collaboration in biomedical research.
Barrow Neurological Institute
Barrow Neurological Institute is an internationally renowned medical institution that offers care for people with brain and spinal diseases, conditions, and injuries. Routinely ranked as a best hospital for neurological surgery and neurosurgical, the institute performs more neurosurgical procedures annually than anywhere else in the United States.
Dignity Health
Dignity Health employs over 9,000 people in the region and offers more than 1,000 active clinical trials to patients across Arizona, California and Nevada. In addition to supporting and providing clinical trial opportunities across its hospital and clinic enterprise, Dignity Health is home to awardwinning research centers. Including the Dignity Health Research Institute, Barrow Neurological Institute, Norton Thoracic Institute and Dignity Health Nursing Research and Analytics.
HonorHealth
HonorHealth, a top-ten private employer in Greater Phoenix, has attracted some of the most distinguished physicians and researchers in the nation while serving as a patient destination for treatments largely unavailable elsewhere. It has evolved into a multi-pronged early-phase clinical research and care facility, deploying new drug and medical device innovations.
Mayo Clinic
Mayo Clinic is a world-leading healthcare provider with a presence in Arizona since 1987 that has expanded to include four facilities throughout Greater Phoenix. Since 2003, Mayo Clinic and ASU have collaborated on medical research and education to advance the workforce, health care delivery and biomedical innovation.
Source: MAG 2022 Employer Database
The Flinn Foundation is a privately endowed, philanthropic grantmaking organization established in 1965 with a mission to improve the quality of life in Arizona to benefit future generations. The Flinn Foundation offers funding to companies within the bioscience sector in Arizona. It also provides a full scholarship to high-achieving high school students bound for Arizona public universities, boosts the fiscal and creative capacity of the state’s arts and culture organizations, and develops future state-level civic leaders.
The Arizona Bioscience Roadmap is a long-term strategic plan originally commissioned by the Flinn Foundation in 2002 and updated in 2014 with the goal of increasing increasing Arizona’s global competitiveness in select areas of biosciences. The goals include:
1. Forming an entrepreneurial hub
2. Turning research into practice
3. Developing bio-talent
4. Promoting Arizona’s convergence of research, healthcare, and commercialization to economic partners in neighboring states, Canada and Mexico
5. Enhancing the state’s “collaborative gene” reputation
AZBio is a not-for-profit trade association promoting the growth of the Arizona life science sector. The association is comprised of member organizations inbusiness, research and education, health care delivery, economic development, government, and other professionsinvolved in the biosciences. As the unified voice of our industry in Arizona,AZBio strives to make Arizona a place where bioscience organizations can grow and succeed.


On Feb. 7, 2002, an assembly of more than 50 leaders and visionaries in science, medicine, government and business gathered at the Arizona state capitol to discuss establish a one-of-a-kind genomics research institute to situate Arizona as a key player in the new economy of the biotechnology industry. With an unprecedented cooperative spirit, the group rallied to the task of securing $90 million in support for TGen, a fundraising mark they achieved in a five-month window. Less than a year after that initial gathering in the Governor's office, TGen began operations.
TGen is an affiliate of City of Hope. It is a Phoenix-based, nonprofit medical research institute dedicated to conducting groundbreaking research with life-changing results. They work to unravel the genetic components of common and complex diseases including cancer, neurological disorders, infectious disease and rare childhood disorders. By identifying treatment options in this manner, they believe medicine becomes more rational, more precise, and more personal.
Today, TGen has grown into an institute with over 350 employees, multiple locations, hundreds of partnerships around the world, numerous groundbreaking studies and nearly 20 spin-out companies. Its capacity to detect early signs of cancer has never been greater, with sequencing accuracy improving 100-fold while cost per-patient dropping 100-fold over the last decade. The new methods for early detection and increased clinical trials has improved screening, posttreatment monitoring and biopsies with low percentage of tumor present.
TGen is also creating better reference genomes, especially in underserved populations. Having better references means a better understanding of which changes in the genome are significant and to which population.
“TGen is proud to have played a key role in the establishment of the Phoenix Biomedical Campus. We are delighted to see the progress that has grown up around us, and the City of Phoenix’s continuing vision for future biomedical development.”
-Tess Burleson, TGen COO
For more information on TGen, please visit: https://www.tgen.org/

Listed below are four examples of the type of innovative companies growing in the Greater Phoenix region.

Based in Phoenix, Akos provides telemedicine products and services using artificial intelligence and augmented reality. Akos’ devices and applications collect patients’ data such as blood pressure and lung sound, which providers then verify and modify to finalize system-formulated treatment plans. In June 2021, Akos Medical Campus opened in the West Valley Health Quarter.

Headquartered in Scottsdale, CND Life Sciences develops an evidence-based tool to help confirm diagnoses of synucleinopathy. It has launched the SynOne Test, a commercially available test to detect, visualize, and quantify the presence of abnormal, phosphorylated alpha-synuclein in cutaneous nerve fibers. In 2023, the company was named as one of the three Fast Lane Honorees by the Arizona Bioindustry Association for its innovation in the neurodiagnostics field.
Headquartered in Scottsdale, Toothio is a medtech company that assists dental staffing by connecting dental offices with high quality talent on demand. The company currently operates in Phoenix, Austin, Dallas, Denver and Las Vegas and has plans to continue expanding across the U.S.

Headquartered in Phoenix, WebPT offers outpatient rehabilitation software. Their end-to-end business platform works for rehabilitation organizations, regardless of specialty, setting, or practice size. Founded in 2006, WebPT employs over 300 people in Phoenix and has more than 160,000 members.
Below are some of the notable deals in the Greater Phoenix region in recent years:

eVisit
Headquartered in Mesa, eVisit is an end-to-end, enterprise care delivery platform built for health systems and hospitals. The virtual care platform enables healthcare organizations to improve outcomes, revenue and efficiencies using their own network of providers to deliver virtual care. In September 2021, the company completed a $45 million Series B funding round.

GT Medical Technologies (GT), a Tempe-based medical device company, is focused on improving the lives of patients with brain tumors. GT has developed an innovative approach to treatment by combining a conformable collagen matrix with brachytherapy (radiation) seeds. Since being founded in 2017, the company has treated over 1,000 patients with brain tumors. GT raised $45 million in a Series C funding round in March 2023.


OncoMyx Therapeutics is a cancer treatment development company headquartered in Tempe. The company, a spinout from Arizona State University, is developing its oncolytic virus (OV) therapeutic program intended to treat hard-to-cure cancers. The company closed its Series A and B funding rounds in June 2019 and December 2021 with $25 million and $50 million, respectively. Source:
Solera
Solera Health
Headquartered in Phoenix, Solera Health is a digital healthcare platform that helps to connect patients, employers, and physicians with community organizations and apps to meet their specific health-related needs. In May 2019, the company completed a $42 million Series C funding round.
The Arizona Commerce Authority's annual Arizona Innovation Challenge awards $1.5 million in total, one of the largest amounts for any challenge of its kind in the country. Below is a list of winners from the healthcare and bioscience industry in Greater Phoenix from 2022 and 2023.
DX4Liver offers MMP7, a patent-pending transformative, highly accurate diagnostic biomarker kit of Biliary Artesia. The test can save users up to 95% of the cost with same-day time-to-results. Macula Vision
Macula Vision Systems is developing an automated computational microscopy solution that will increase efficiency and precision in microscopy testing. CenSyn
CenSyn, a pre-FDA stage medical device company, develops handheld EEG monitoring devices for accelerated screenings of Alzheimer’s, traumatic brain injury and epilepsy.
Padma AgRobotics
Padma AgRobotics builds AI-powered agricultural robots that help farmers increase yield and decrease costs. Paxauris
Paxauris is developing new earplug technology with the goal of providing better hearing protection for people who suffer from loud noise.
Sense is developing non-invasive technology enabling rapid, comprehensive detection of stroke subtype + TBI and continuousbrain injury monitoring. Source: Arizona Commerce Authority
Sense Neuro Diagnostics

Greater Phoenix is home to an assortment of innovative medical device manufacturers.
Listed below are some of the largest by employment.
Source: MAG 2022 Employer Database
Source: MAG 2022 Employer Database

The Annual Business Operating Cost Analysis for healthcare and bioscience back office operations has been prepared using the following parameters as an estimate for healthcare and bioscience operations in competitor markets. Component and custom analyses to match your company’s operations can be provided upon request.
Assumptions
• $1,500,000 personal property investment
• 10,000 square foot Suburban Class A, Lease
•
•
Annual Operating Cost by Region Healthcare Back Office
Source: Applied Economics Metrocomp Tool, January 2024
Source: Applied Economics Metrocomp Tool, January 2024
Notes: 1.There isno personal propertytaxinNew York. 2.Theleasingterm includesreal propertytax.
Source: Applied Economics Metrocomp Tool, January 2024

Arizona has a very competitive tax and fringe/mandated benefits environment compared to other major healthcare and bioscience markets.

Even with the highly competitive tax environment in Greater Phoenix and Arizona, there are several tax incentives that can be utilized to mitigate operating costs. Some of the most relevant to the healthcare and bioscience industry are listed below. Please note that this is not a comprehensive list of all incentives available within the state of Arizona. Additionally, it should be noted that this document is only a guide for potential incentives. Actual incentives will depend on actual project parameters and varying program qualifications and requirements as determined by the Arizona Commerce Authority.
This program provides tax credits to employers creating a minimum number of net new quality jobs and making a minimum capital investment in Arizona. The Quality Jobs Tax Credit offers up to $9,000 of Arizona income or premium tax credits over a three-year period for each net new quality job. The tax credit is equal to $3,000 per qualified employment position, employed for each full taxable year of continuous employment for three years. If the allowable tax credit exceeds the income or premium tax liability, any unused amount may be carried forward for up to five consecutive taxable years. Employers must cover 65% of employee health insurance premium costs. Additional program qualifications are listed below.
65%
Capped at 10,000 jobs per year
Employer must offer to pay at least 65%of employee health insurance premium
• Targets headquarters or manufacturing facilities, including manufacturing-related research and development
• Offers refundable income tax credit equal to the lesser of:
• 10% of the qualifying capital investment, or
• $20,000 per net new full-time employment position at the facility, or
• $30,000,000 per taxpayer
• Requires annual wages of greater than 125% of the state median wage for production occupations in urban areas ($49,274); 100% in rural areas ($39,419)
• At least 65% of benefits package covered by employer
• Minimum capital investment of $250,000
• Designated areas where imports can be stored without full customs formalities
• In Arizona, property is reclassified from Class 1 to Class 6, lowering assessment ratio from 17.5% to 5%
• Property tax savings of up to 71.4%
This legislation sets the full cash value of business and agricultural personal property initially classified during or after Tax Year 2022 to 2.5% of the property’s acquisition cost. Properties that can benefit from the new legislation include shopping centers, golf courses, manufacturers, and other personal property devoted to commercial or industrial use that is not classified elsewhere, agricultural property, and personal property in a FTZ or MRZ.


Greater Phoenix is home to hundreds of parks and hundreds of miles of hiking, biking and walking trails. The region is home to the largest municipal park in the United States, South Mountain Park/Preserve (SMP). SMP covers more than 16,000 acres. Other large parks in the region include the White Tank Mountain Regional Park, Camelback Mountain, Piestewa Peak and the Superstition Mountains. Notable walking trails in the region include the canal system, Tempe Town Lake, the Greenbelt and Papago Park.

Greater Phoenix is more affordable for companies and the people that make them successful.
Across all major buckets of expenses, Greater Phoenix is less expensive than many peer markets.
*Averagebetween Raleigh,Durham andChapel Hill
Source: C2ER 2023 Q3 COLI
Greater Phoenix’s housing market remains affordable relative to competing markets.
*Average between Raleighand Durham
Source: Zillow Home Value Index, November 2023; Zillow Rental Index, November 2023
Greater Phoenix has the lowest personal income tax of states that have a personal income tax across all income levels. With its affordable cost of living and low taxes rates, income goes further in Greater Phoenix.
*Above $7,000 of income
Source: Tax Foundation 2023
Notes: Tax rates are for single filers
Greater Phoenix’s tax environment remains favorable relative to competing markets.
Source: Tax Foundation 2024

Skybridge at Phoenix-Mesa Gateway Airport:
• The air logistics hub to ship high-value goods directly to consumers through a bonded facility incorporating Mexican and U.S. customs will be the first of its kind in the interior U.S. for air freight activities.
• Ideally situated within the Southwestern U.S. to not only meet growing e-commerce and airport logistics demands in the Phoenix metropolitan area but also to serve as a direct carrier to and from consumers in Mexico and across the nation.
• The proximity to Arizona State University’s Polytechnic Campus creates opportunities for partnerships to attract and retain workforce talent within the airport.

Phoenix Sky Harbor
International Airport (PHX): Cargo Community at PHX:
• 44 million passengers in 2022
• 418,856 landings and takeoffs in 2022
• Over 1,000 tons of cargo handled daily
• ABX
• American Airlines
• DHL
• FedEx
• South Air Cargo
• Southwest Airlines
• Swissport Cargo
• UPS
• West Air Cargo
• Worldwide Flight Services (WFS)
Greater Phoenix is served by two major railroads, Union Pacific and BNSF. The map below displays all major rail lines throughout the Southwest.



 Pinal County
#1
Phoenix was ranked #1 by population growth from 2010 to 2020 among all U.S. cities
#1
Arizona State University named America’s Most Innovative Schools nine years in a row by U.S. News & World Report
#2
Arizona is ranked #2 by U.S. News and World Report in power grid reliability
#3
Sky Harbor International Airport ranked 3rd in the Wall Street Journal’s “The Best of the Biggest Airports”
#4
Arizona was ranked the No. 4 place to do business in 2022 by Chief Executive
In 2022, Scottsdale was listed in the top 20 happiest cities in the nation
#7
In 2023, Arizona was ranked as the seventh-best state to start a business by WalletHub
APS and SRP rank as top business service providers by J.D. Power and Associates for reliability


