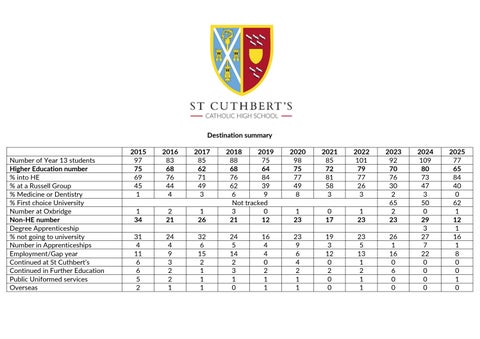
Destination summary Number of Year 13 students Higher Education number % into HE % at a Russell Group % Medicine or Dentistry % First choice University Number at Oxbridge Non-HE number Degree Apprenticeship % not going to university Number in Apprenticeships Employment/Gap year Continued at St Cuthbert’s Continued in Further Education Public Uniformed services Overseas
2015 97 75 69 45 1
2016 83 68 76 44 4
2017 85 62 71 49 3
2020 98 75 77 49 8
2021 85 72 81 58 3
2022 101 79 77 26 3
1 26
2018 2019 88 75 68 64 76 84 62 39 6 9 Not tracked 3 0 21 12
1 23
0 17
1 23
2023 92 70 76 30 2 65 2 23
1 34
2 21
31 4 11 6 6 5 2
24 4 9 3 2 2 1
32 6 15 2 1 1 1
24 5 14 2 3 1 0
23 9 6 4 2 1 1
19 3 12 0 2 0 0
23 5 13 1 2 1 1
26 1 16 0 6 0 0
16 4 4 0 2 1 1
2024 109 80 73 47 3 50 0 29 3 27 7 22 0 0 0 0
2025 77 65 84 40 0 62 1 12 1 16 1 8 0 0 1 0