

Q1: Is there a statistically significant difference among last semester gpa (GPA_last) based on race (student ethnic origin)?
Null hypothesis: There is no significant difference among last semester GPA based on race.
Alternative hypothesis: There is a significant difference among last semester GPA based on race.
Assumption testing:
Independence assumption: The assumption states that the sample drawn should be independent of one another. The assumption has been met by the data as the students are independent of one another.
Normality assumption: The normality assumption states that the distribution of last semester GPA for each category of race should be normally distributed. The results for the Shapiro Wilk test (under the null hypothesis which states that the distribution is normal) show that the p-value for the test is close to zero for all the three categories of race. At 5% alpha, since the p-value is less than 0.05, we have enough evidence to reject the null hypothesis. Thus, we conclude that the distribution of the variable is not normal. However, the central limit theorem, which states that for the large sample size the distribution can be considered to be normal, applies here as the sample size for each of the category of race is large. Thus, the assumption is met by the data.
Tests of Normality
Constant variance: The homoskedasticity assumption states that the variance of the three categories of race should be equal. The results for the Levene statistic show that the pvalue for the test is 0.519. At 5% alpha, since the p-value is more than 0.05, we do not have enough evidence to reject the null hypothesis (which states that the variances of the groups are equal). Thus, we conclude that the variances of the three groups are equal.
Test of Homogeneity of Variances
Hypothesis results: The results for the One-way ANOVA show that the p-value for the test is close to zero. At 5% alpha, since the p-value is less than 0.05, we have enough evidence to reject the null hypothesis.
Thus, we conclude that there is a significant difference among last semester GPA based on race.
Multiple Comparisons
Dependent Variable: GPA LAST TERM
*. The mean difference is significant at the 0.05 level.
Discussion: The results show that the GPA in the last term differs on the basis of the race categories. The GPA in the last term is significantly higher for the White people (M=2.84, SD=0.93) than Black people (M=2.52, SD=0.94) and “Other” race people (M=2.56, SD=0.98). But there is no significant difference found in the last term GPA for Black and “Other” race people.
Q2: Is there a significant difference between last semester GPA (GPA_last) and the current semester GPA (GPA_curr) for white students only?
Null hypothesis: There is no significant difference in last semester GPA and the current semester GPAfor white students only.
Alternative hypothesis: There is a significant difference in last semester GPA and the current semester GPAfor white students only.
Assumption testing:
Dependent variable must be continuous: Both the variables used in the analysis namely last semester GPA and current semester GPA are continuous variables and thus, the assumption is met by the data.
Independence assumption: The assumption states that the sample drawn should be independent of one another. The assumption has been met by the data as the students are independent of one another.
Normality assumption: The normality assumption states that the distribution of last semester GPA and current semester GPA should be normally distributed. The results for the Shapiro Wilk test (under the null hypothesis which states that the distribution is normal) show that the p-value for the test for both the variables is close to zero. At 5% alpha, since the p-value is less than 0.05, we have enough evidence to reject the null hypothesis. Thus, we conclude that the distribution of the variable is not normal. However, the central limit theorem, which states that for the large sample size the distribution can be considered to be normal, applies here as the sample size for both the variables is large. Thus, the assumption is met by the data.
Tests of Normality
a. Lilliefors Significance Correction
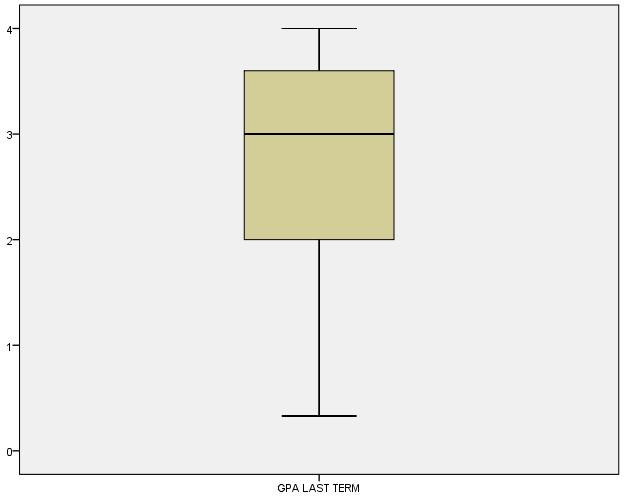
No outliers in the data: The assumption states that there are no outliers in the data. The box plot presented below shows that there are no outliers in the data for GPA (last term) variable but there are a few outliers in the data for current GPA. Hence, the assumption is not met by the data for Current GPA.
Hypothesis results: The results for the paired samples t-test show that the p-value for the test is close to zero. At 5% alpha, since the p-value is less than 0.05, we have enough evidence to reject the null hypothesis. Thus, we conclude that there is a significant difference in last semester GPA and current GPA for white students only.
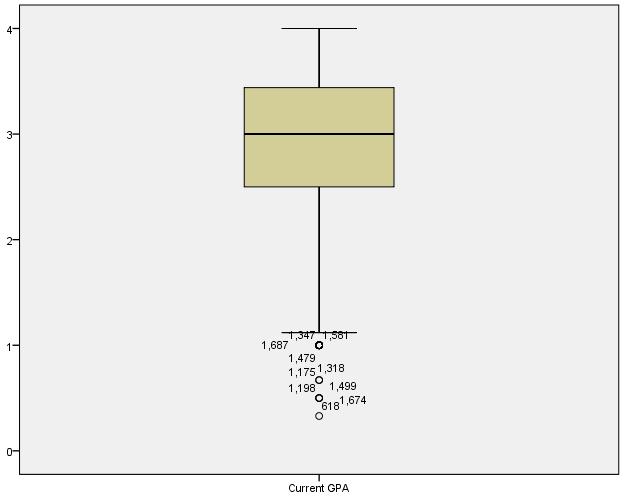
Discussion: The results show that for white students, there is a difference in the GPA in the last term and current term. The mean GPA in the last term for the White people was 2.84 with standard deviation of 0.93) but the same for current GPA for white people is 2.91 with standard deviation of 0.72. The mean of the difference in last term GPA and current GPA is -0.072 which means that on an average, the students have scored better in current GPA than last term GPA.
Q3: Was the performance of Black students better or worse than the average performance of all students during the last semester?
Null hypothesis: There is no significant difference in performance of Black students in comparison to all students during last semester.
Alternative hypothesis: There is a significant difference in performance of Black students in comparison to all students during last semester.
Assumption testing:
Dependent variable must be continuous: The dependent variable used in the analysis namely last semester GPA is continuous variable and thus, the assumption is met by the data.
Independence assumption: The assumption states that the sample drawn should be independent of one another. The assumption has been met by the data as the students are independent of one another.
Normality assumption: The normality assumption states that the distribution of last semester GPA for black students should be normally distributed. The results for the Shapiro Wilk test (under the null hypothesis which states that the distribution is normal) show that the p-value for the test for both the variables is close to zero. At 5% alpha, since the p-value is less than 0.05, we have enough evidence to reject the null hypothesis. Thus, we conclude that the distribution of the variable is not normal. However, the central limit theorem, which states that for the large sample size the distribution can be considered to be normal, applies here as the sample size for the variable is large. Thus, the assumption is met by the data.
Tests of Normality
a. Lilliefors Significance Correction
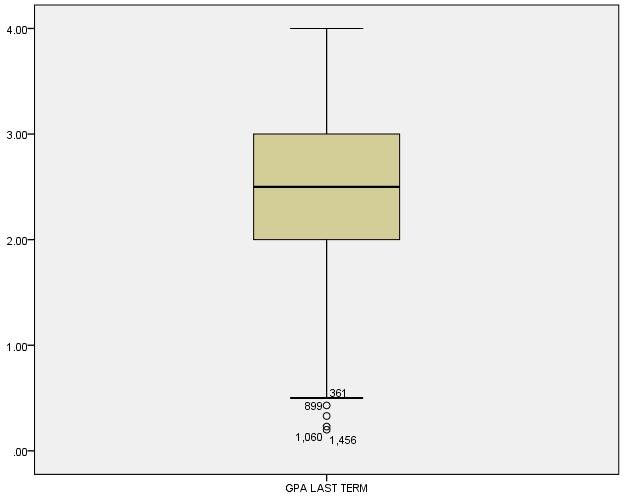
No outliers in the data: The assumption states that there are no outliers in the data. The box plot presented below shows that there are outliers in the data for GPA (last term) variable. Hence, the assumption is not met by the data.
Hypothesis results: The results for the one-sample t-test show that the p-value for the test is close to zero. At 5% alpha, since the p-value is less than 0.05, we have enough evidence to reject the null hypothesis. Thus, we conclude that there is a significant difference in performance of Black students in comparison to all students during last semester. One-Sample
Test Value = 2.69
Discussion: The results show that for black students, the mean GPA in the last term was 2.51 with standard deviation of 0.94 and this is lower than the average GPA of .last semester by all the students at 2.69. Thus, the performance of the Black students is worse than the average performance of all students during the last semester.
Q4: Whether or not students believe instructors provide helpful comments (item10) or used examples (item 20).
Helpful Comments
Null hypothesis: The students believe instructors provide helpful comments.
Alternative hypothesis: The students believe instructors do not provide helpful comments.
Assumption testing:
Dependent variable must be continuous: The dependent variable used in the analysis namely helpful comments is continuous variable and thus, the assumption is met by the data.
Independence assumption: The assumption states that the sample drawn should be independent of one another. The assumption has been met by the data as the students are independent of one another.
Normality assumption: The normality assumption states that the distribution of helpful comments should be normally distributed. The results for the Shapiro Wilk test (under the null hypothesis which states that the distribution is normal) show that the p-value for the test for both the variables is close to zero. At 5% alpha, since the p-value is less than 0.05, we have enough evidence to reject the null hypothesis. Thus, we conclude that the distribution of the variable is not normal. However, the central limit theorem, which states that for the large sample size the distribution can be considered to be normal, applies here as the sample size for the variable is large. Thus, the assumption is met by the data.
Tests of Normality
a.
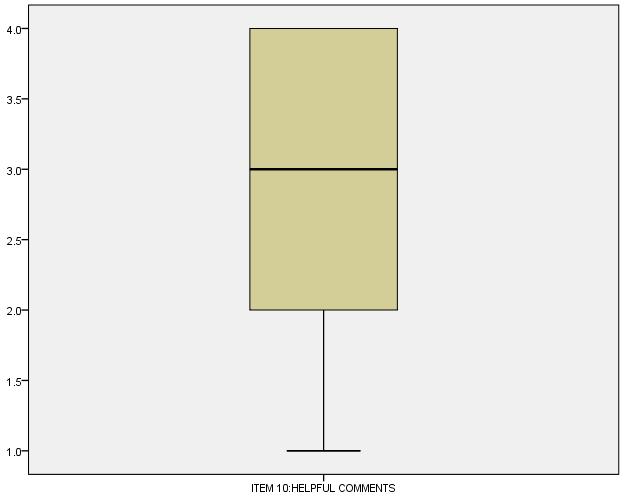
No outliers in the data: The assumption states that there are no outliers in the data. The box plot presented below shows that there are no outliers in the data for helpful comments variable. Hence, the assumption is met by the data.
Hypothesis results: The results for the one-sample t-test show that the p-value for the test is close to zero. At 5% alpha, since the p-value is less than 0.05, we have enough evidence to reject the null hypothesis. Thus, we conclude that students believe instructors do not provide helpful comments.
Discussion: The results show that the mean rating of question related to helpful comments was 2.65 with standard deviation of 1.11. This means that the students on an average either “disagree” or “agree” with the question of helpful comments and this is lower than the rating of helpful comments at 4, suggesting strongly agree. Thus, the students believe instructors do not provide helpful comments.
Used Examples
Null hypothesis: The students believe instructors provide used examples.
Alternative hypothesis: The students believe instructors do not provide used examples.
Assumption testing:
Dependent variable must be continuous: The dependent variable used in the analysis namely used example sis continuous variable and thus, the assumption is met by the data.
Independence assumption: The assumption states that the sample drawn should be independent of one another. The assumption has been met by the data as the students are independent of one another.
Normality assumption: The normality assumption states that the distribution of used examples should be normally distributed. The results for the Shapiro Wilk test (under the null hypothesis which states that the distribution is normal) show that the p-value for the test for both the variables is close to zero. At 5% alpha, since the p-value is less than 0.05, we have enough evidence to reject the null hypothesis. Thus, we conclude that the distribution of the variable is not normal. However, the central limit theorem, which states that for the large sample size the distribution can be considered to be normal, applies here as the sample size for the variable is large. Thus, the assumption is met by the data.
Tests of Normality
No outliers in the data: The assumption states that there are no outliers in the data. The box plot presented below shows that there are no outliers in the data for used examples variable. Hence, the assumption is met by the data.
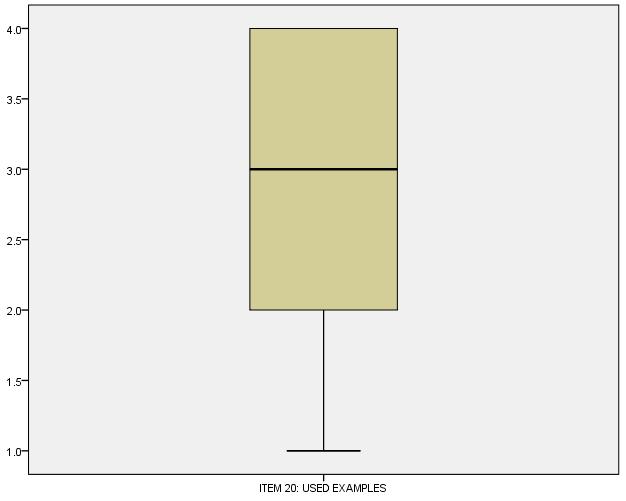
Hypothesis results: The results for the one-sample t-test show that the p-value for the test is close to zero. At 5% alpha, since the p-value is less than 0.05, we have enough evidence to reject the null hypothesis. Thus, we conclude that students believe instructors do not provide used examples.
Discussion: The results show that the mean rating of question related to “used examples” was 2.74 with standard deviation of 1.05. This means that the students on an average either “disagree” or “agree” with the question of used examples and this is lower than the rating of “used examples” at 4, suggesting strongly agree. Thus, the students believe instructors do not provide used examples.