


Hurricane Milton, a Category 4 storm, made landfall on Florida's west coast, heavily affecting the Tampa Bay area. The closure of Port Tampa Bay disrupted key exports, including agricultural and manufactured goods to major trade partners like China, Brazil, Japan, and Canada. Cargo diversions have caused significant congestion at Gulf and East Coast ports, straining infrastructure and compounding delays for shippers who are already navigating tight capacity and rising operational costs.
Road and rail closures, along with power outages, severely impacted the transportation network, limiting access to critical infrastructure and delaying freight movement. Florida's citrus industry is facing severe damage, likely causing supply shortages and price volatility. Shippers should also be aware of potential disruptions in the petroleum supply chain due to prolonged port closures, which may increase costs and lead to fuel shortages.
Port Tampa Bay, vital for handling petroleum, steel, and agricultural imports and exports, faced prolonged closures, further congesting alternate ports and risking a breakdown of intermodal supply chain efficiency. Shippers must consider alternate sourcing strategies and develop contingency plans to mitigate ongoing disruptions.
Milton's Disruption by the Numbers:
• Port Tampa Bay closure led to a 25% increase in average dwell times at alternate ports.
• Road closures affected over 1,200 miles of major highways, with estimated delays of 3-5 days for shipments.
• Citrus crop losses are estimated at 30%, leading to a projected 15-20% increase in citrus prices.
The recent International Longshoremen’s Association strike on the East and Gulf Coasts, though brief, resulted in significant cargo backlogs, with experts predicting weeks before operations normalize. Terminal closures worsened freight constraints, with reduced shipping capacity from Europe to North America as ports clear the backlog. Trucking freight prices largely remained stable, but diversion strategies by shippers, such as frontloading goods and rerouting to alternate ports, increased congestion at contingency routes, particularly at West Coast ports and Canadian gateways, straining rail operations due to higher inland point intermodal volumes.
• The strike resulted in a 15% increase in container dwell times at affected ports.
• Linehaul rates for East Coast routes increased by 8% during the strike period.
• Backlogs are expected to take 3-4 weeks to fully clear, impacting shipping schedules well into November.
Metrics
The Transportation Utilization Index registered at 57.6 in September, indicating ongoing expansion, though slightly down from August. Inventory levels increased to 59.8, reflecting an uptick in downstream activity as retailers prepare for the peak season. The Logistics Managers' Index (LMI) rose to 58.6, marking its highest level in two years and signaling robust recovery across the logistics sector. Freight volumes, however, remained stagnant, continuing along a trough that began in March 2022, with year-over-year declines persisting.
• Inventory levels increased by 4.1 points from the previous month.
• The Logistics Managers' Index (LMI) rose by 2.3 points, indicating the highest expansion rate in two years.
• Freight volumes have decreased by 5.2% year-over-year, with stagnant growth since March 2022.


Source: FreightWaves
The Transportation Capacity Index remained unchanged at 50, signaling a plateau in available capacity. Seasonal tightening is expected as the market moves into November, but a loosening period is anticipated in early 2025. The effects of Hurricane Milton, coupled with ongoing port backlogs, have also affected capacity availability, particularly for flatbed and reefer carriers in Florida.
Data indicates that truckload capacity remained largely unaffected during the ILA strike, demonstrating the resilience of the market. However, freight constraints due to cargo backlogs have extended the recovery period for maritime logistics, with DHL Global Forwarding estimating a full recovery in 3-4 weeks.
• Transportation Capacity Index remained flat at 50, indicating no expansion for the second time in 2024.
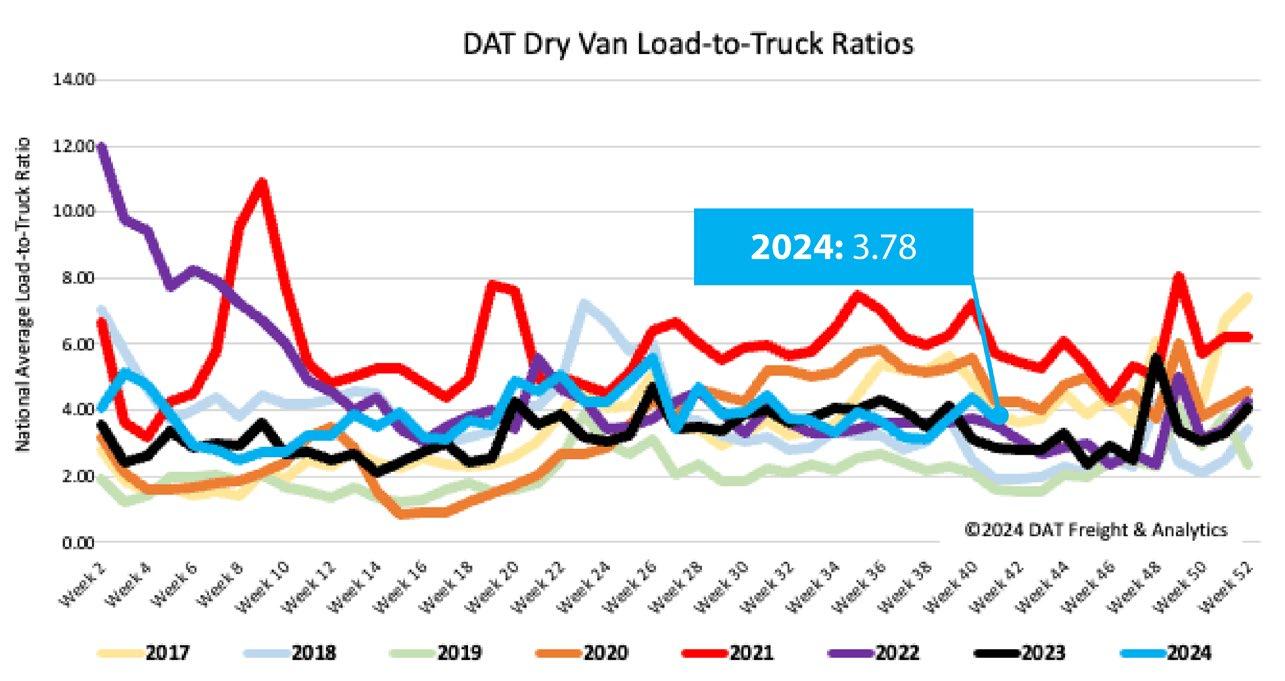
• Flatbed load-to-truck ratio increased by 13.54, 54% higher than the previous year.
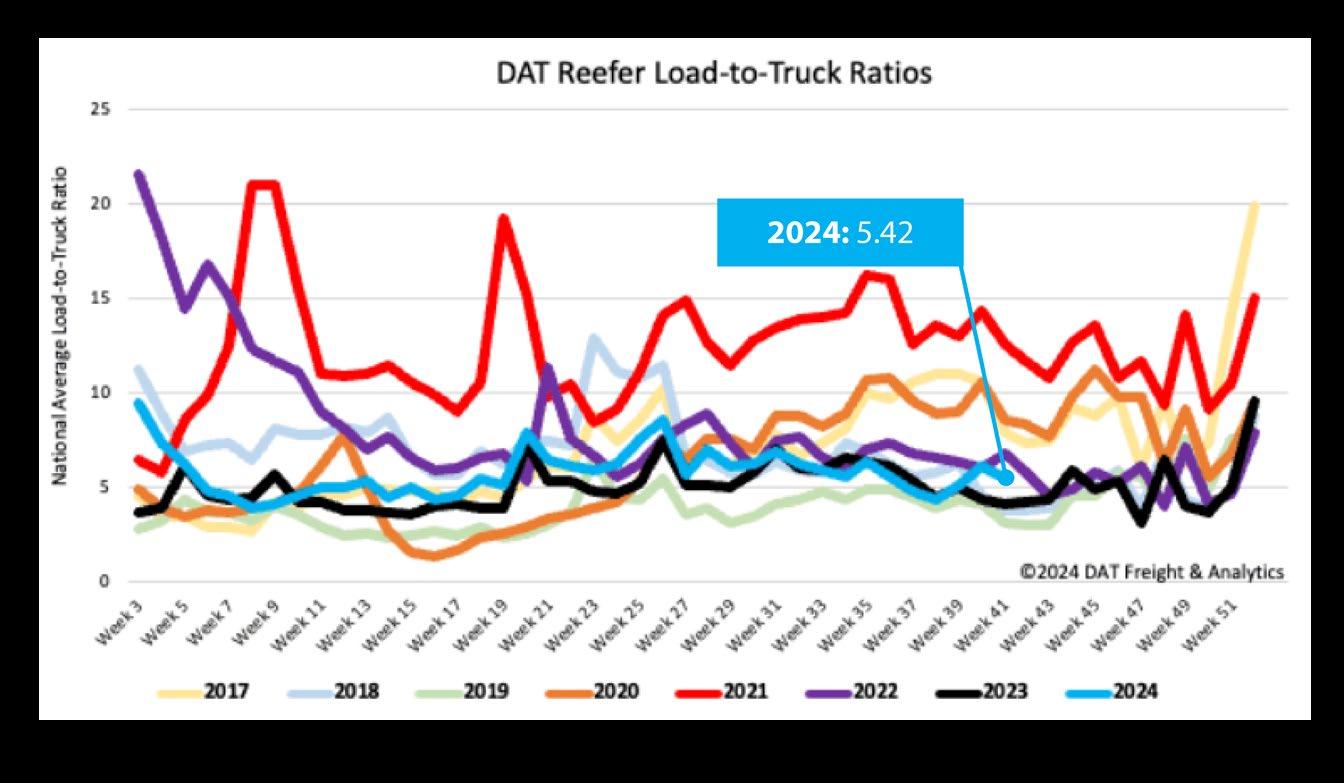
• Reefer load postings decreased by 14%, while the load-to-truck ratio remains 31% above the long-term average.
Freight expenditures fell by 6.6% year-over-year in September, driven in part by a 4% drop in diesel prices. Despite the decline, expenditures rose 1% from August on a seasonally adjusted basis. Warehouse prices surged to 66.9 as retailers stocked up for the fourth quarter, leading to increased warehousing costs. Additionally, load-to-truck ratios for flatbed carriers increased significantly, reflecting tightening capacity as a result of the hurricanes' impact on the Southeast region.
National reefer load postings decreased by 14% in the wake of Hurricane Milton, and the loadto-truck ratio declined to 5.42, though it remains above historical averages. The impact on Florida’s citrus industry, compounded by agricultural damage from the hurricanes, has further tightened capacity for refrigerated carriers.
• Warehouse prices increased to 66.9, marking the highest level in over a year.
• Freight expenditures dropped by 6.6% year-over-year, but increased by 1% from August.
• Flatbed load-to-truck ratio increased to 13.54, reflecting tightening capacity.


Source: DAT
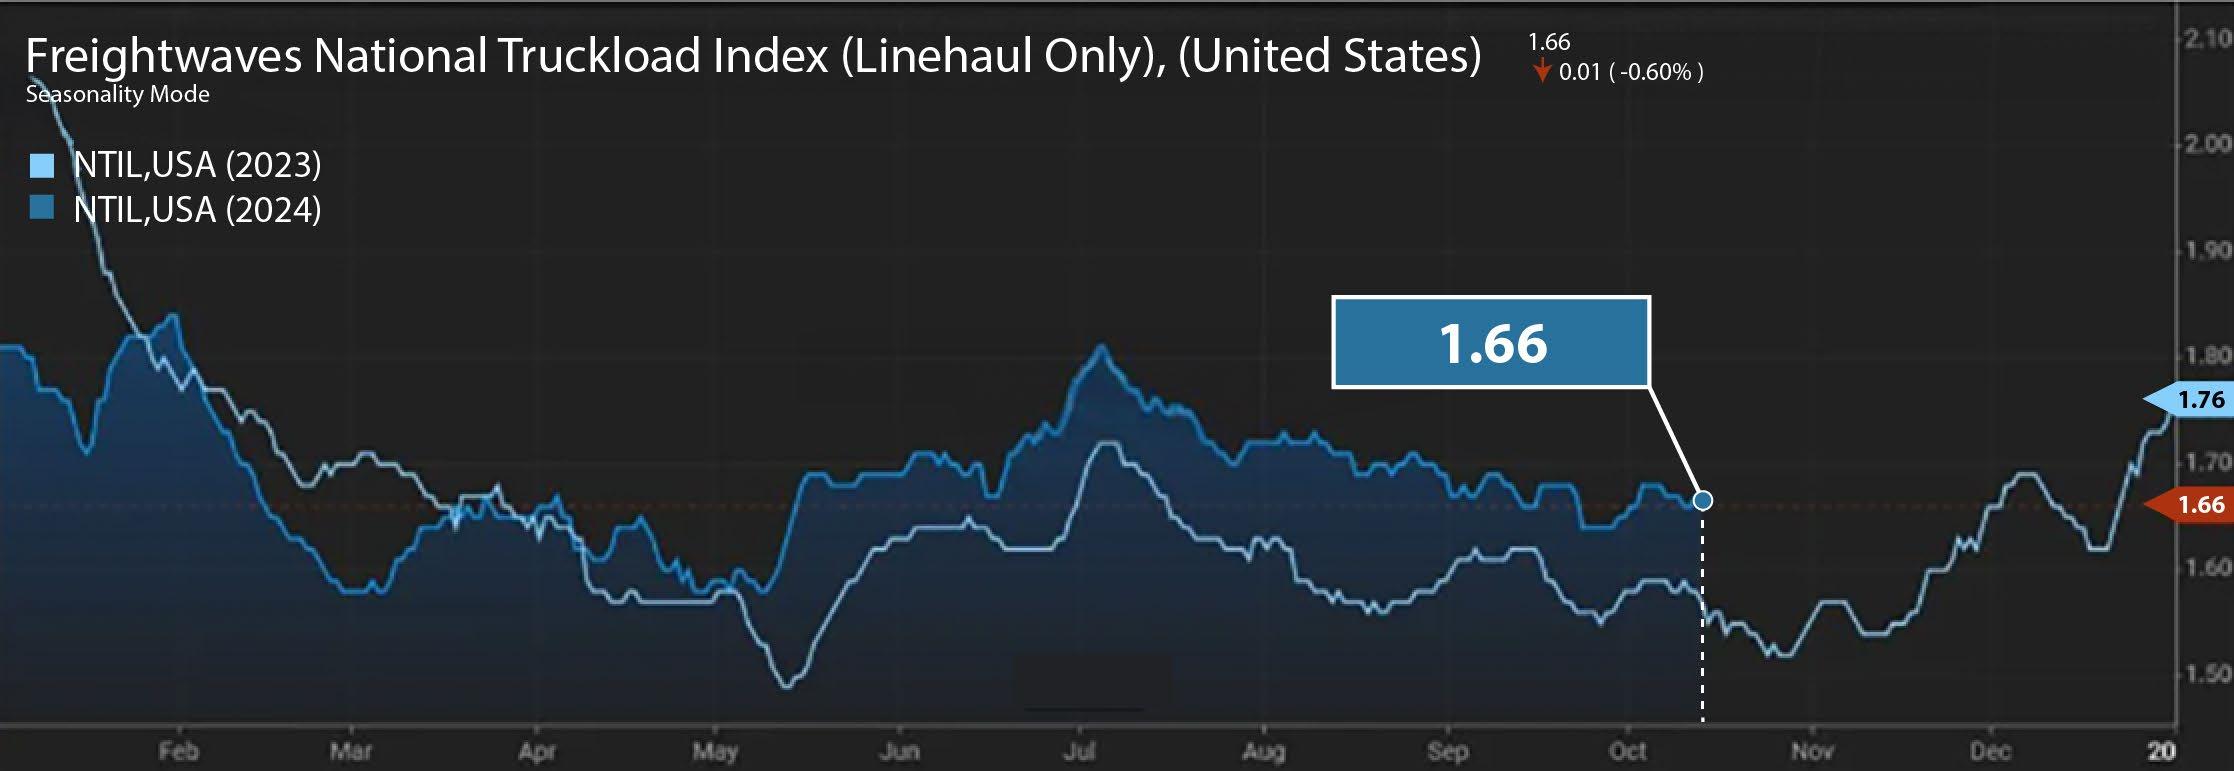
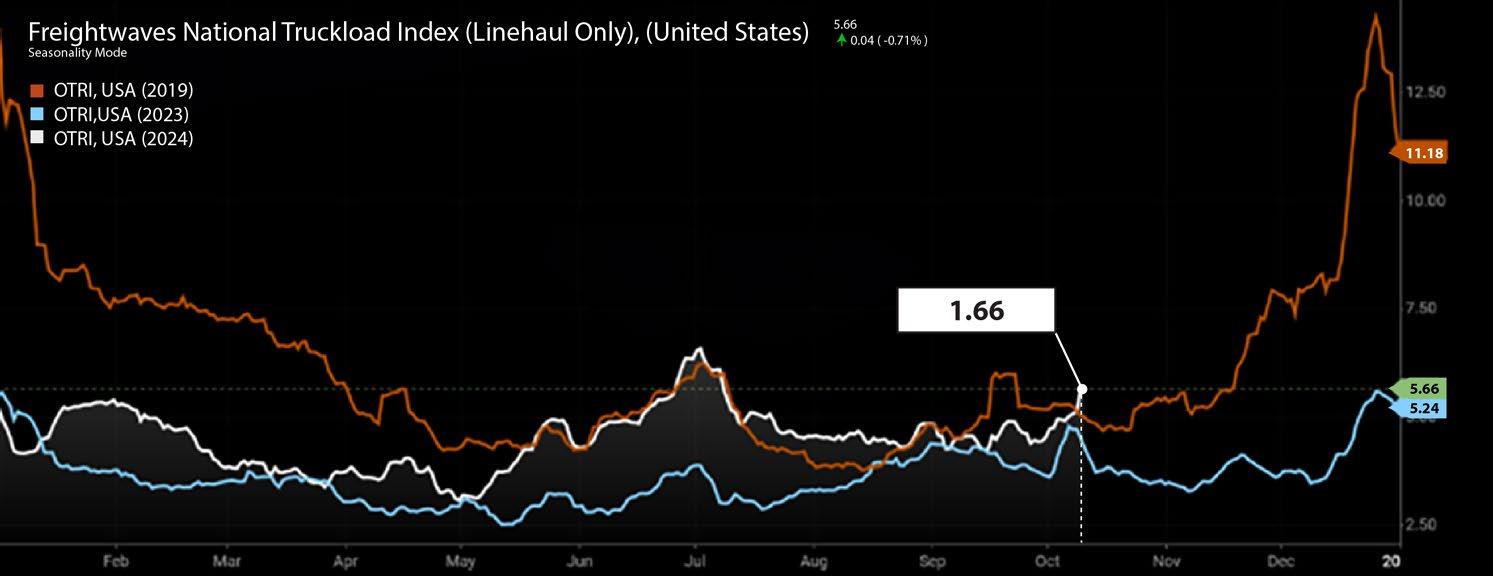
Spot rates remained relatively flat overall despite increased rejection rates due to Hurricane Milton. The National Outbound Tender Rejection Index jumped from 5.13% to 5.62% during the hurricane, indicating tightening market conditions, particularly in hurricane-impacted areas like Lakeland, Florida. FEMA's engagement in disaster relief efforts is expected to further increase competition for higher-paying loads, putting upward pressure on spot rates.
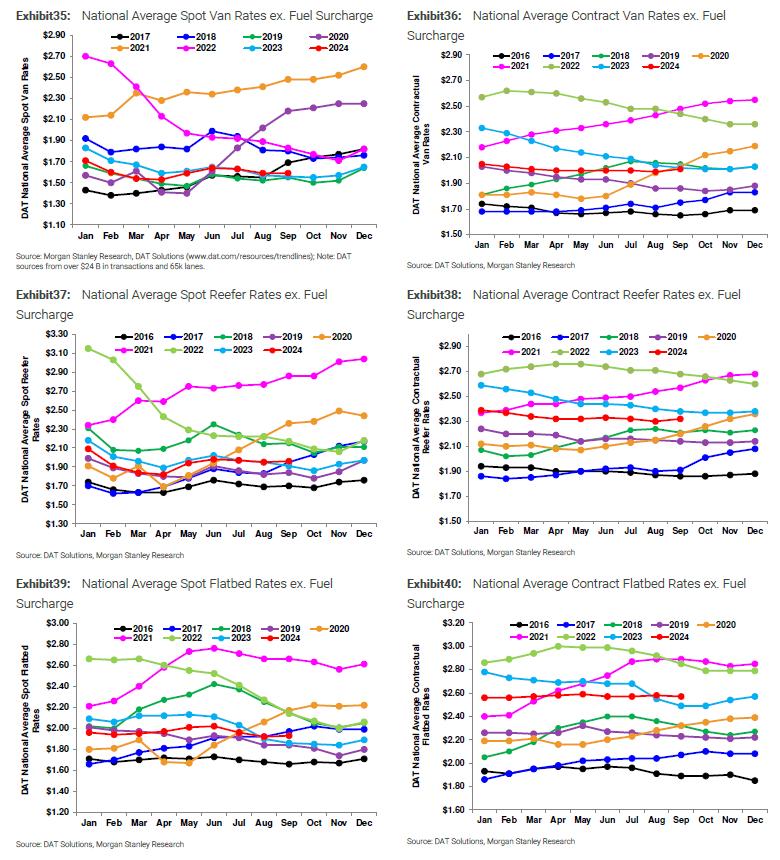
National dry van spot rates held steady at $1.65 per mile, slightly higher than the previous year but still below the five-year average. Southeastern routes, particularly those originating from Florida, experienced increased rates due to reduced outbound volumes and the ongoing impact of the hurricane.
• National Outbound Tender Rejection Index (OTRI) increased by 0.49 percentage points to 5.62%.
• Spot rates for dry van increased by 0.1% year-over-year, but remain 12% below the five-year average.
• FEMA-related disaster relief efforts are expected to increase competition for high-paying loads by 10-15%.
Contract rates remained suppressed, down 2% year-over-year, but have shown signs of stabilizing over the past six months. Shippers can expect increased pressure on contract rates as capacity tightens heading into the peak holiday season. Isolated contract rate increases have been reported, particularly in areas affected by recent disruptions, indicating a possible inflection point as the market responds to ongoing supply chain challenges. Flatbed spot rates have remained stable around $2.00 per mile, with national average rates $0.11 higher than last year. The Atlanta to Lakeland lane, however, experienced tight capacity and rising rates, with outbound flatbed volumes from Lakeland dropping by 40% week-over-week.
• Contract rates are down 2% year-over-year but stable for the past six months.
• Flatbed spot rates averaged $2.00 per mile, with a year-over-year increase of $0.11 per mile.
• Outbound flatbed volumes from Lakeland dropped by 40%, leading to increased spot rates on certain lanes.