

MISSING VOTERS
U.S. citizens aged 18 or older who are eligible to vote but are not registered, or who are registered, but are in “inactive” status.

MISSING VOTERS
U.S. citizens aged 18 or older who are eligible to vote but are not registered, or who are registered, but are in “inactive” status.
Recent elections in North Carolina have been marred by false allegations of voter fraud based on the claim that the state’s voter rolls are bloated with “ineligible” voters. These loud and relentless accusations are usually based upon erroneous data analysis and lack any real evidence of widespread unlawful voting. They have nonetheless captured the imagination of legislators across the country who are erecting additional barriers to the ballot box for people who want to exercise their fundamental right to vote.1
The real threat to our democracy is just the opposite: too many people don’t register to vote and don’t show up at the polls. As a result, public officials are chosen by a fraction of the electorate and legislative bodies are not truly representative of the people. Even in record years of voter turnout, the United States lags significantly behind global peers.2
Nearly 1.5 million North Carolinians are considered “missing voters” — U.S. citizens aged 18 or older who are eligible to vote but are not registered, or who are registered, but are in “inactive” status because they’ve gone two federal election cycles or more without casting a ballot. The number of missing voters is more than the combined
population of the state’s largest cities, Charlotte and Raleigh. This is perhaps unsurprising given North Carolina’s democratic ecosystem, which is rife with obstacles to civic engagement. According to Dēmos’s Power Scorecard, North Carolina ranks 38th in terms of democratic vitality.3 This means North Carolina is in the bottom quarter of states based on how easily people can engage in the political process to determine who represents them and how they are served.4 It ranks 39th in terms of representative elections, or how people experience and participate in inclusive electoral processes.5 These rankings confirm the need to improve systems that facilitate political participation in the state.
Even more concerning, a close look at North Carolina’s data tells us that the status quo is leaving behind voters from our most vulnerable and historically marginalized communities, namely Black and brown voters, voters with disabilities, and our youngest voters.
In this report, Southern Coalition for Social Justice and Dēmos set the record straight regarding North Carolina’s voter rolls. Using reliable methodology and accurate data, we find North Carolina has nearly 1.5 million missing voters. We also examine barriers to voting in North Carolina to identify commonsense policy changes that can expand voter participation and move us closer to an inclusive and multiracial democracy.
Each circle represents 10,000 people.
Missing voters who are inactive but registered to vote (approx. 1 million)
Missing voters who are not registered to vote (approx. 500,000)
Regular voters (approx. 6.5 milion)

MISSING VOTERS fall into two categories:
• UNREGISTERED VOTERS: Unregistered voters are U.S. citizens aged 18 and over who are eligible but not registered to vote.
• INFREQUENT VOTERS: In every election, a sizeable number of registered voters do not cast a ballot. For purposes of this report, we define infrequent voters as registered voters who have not participated in the past two federal elections. This definition parallels state law, which designates voters as “inactive” if they do not participate in two federal elections and do not respond to subsequent confirmation mailings. 6
CITIZEN VOTING AGE POPULATION (CVAP): The number of U.S. citizens over the age of 18. Depending on the data set, the CVAP can include people who are not eligible to vote for state policy reasons, such as those serving felony sentences.
To develop a profile of the North Carolina electorate, we used a combination of U.S. Census Bureau data and public voter files available from the North Carolina State Board of Elections.7 To determine racial estimates based on U.S. Census data, we used the “Asian alone,” “Black or African American alone,” “American Indian or Alaskan Native alone,” “Native Hawaiian or Pacific Islander,” and “white alone” categories, so multiracial individuals are not double counted in estimates of those populations. To develop estimates for the Latino/Latina/Latine population (henceforth “Latino”), we used the “Hispanic or Latino (of any race)” category, which is classified as an ethnic rather than racial category in the data.
For registration and turnout data, we relied on a combination of U.S. Census and state election data. Registration rates are notably difficult to measure because of the unreliability of self-reported data and the undercount of unregistered people in commercial voter files. In many cases, researchers prefer using data collected by the U.S. Census Bureau’s Current Population Survey (CPS), as the Census Bureau’s practices are standardized and provide a useful baseline to compare across states and elections. However, these data related to registration and turnout are unavailable at the county level.
For these reasons, we compared the overall registration rates reported by the 2020 CPS to the CVAP to determine the total number of unregistered voters in North Carolina. Then, to examine the electorate by age and race, we used the North Carolina State Board of Elections' voter file for state and county breakdowns. While the CPS does also provide registration rates by age and race, we wanted to be able to compare county registration rates against the state average, so we relied on the voter file for that information. To determine the number of infrequent voters, we used North Carolina State Board of Elections data to determine whether registered voters had participated in any of the last two federal elections.
18.75% of North Carolinians eligible to vote are Missing Voters
There are approximately 1.5 million missing voters in North Carolina: half a million unregistered voters and nearly 1 million infrequent voters (registered voters who did not vote in the last two federal elections). Our analysis shows Black, Latino, and young voters are overrepresented in North Carolina’s missing voter population.
North Carolina had about 8 million voting-eligible adults in early fall 2024, according to Carolina Demography, a demographic research center at the University of North Carolina at Chapel Hill.8 As of March 2025, after the November 2024 general election and subsequent list maintenance, the number of registered voters was approximately 7.5 million.9
There are a minimum of 500,000 unregistered eligible voters in North Carolina.
Census data provide additional insight into what demographic groups may be over or under-represented among unregistered voters. For example, 2020
Census analysis on voter registration rates (shown in Tables 1 and 2 on following page) shows North Carolina’s younger voters (aged 41 and below) are less likely to register to vote than older voters (aged 41 and above), and its Black and Latino voters are less likely to register to vote than their white counterparts.
The lower registration rates for North Carolina’s Black and Latino communities are a result of the harmful legacy of the Jim Crow era as well as modern barriers North Carolina’s Black and brown communities face accessing the ballot, further described in the section on barriers to voting. 10
Due to limitations in the Current Population Survey and sampling challenges, not all racial and ethnic groups are included in Table 2. The margin of error for the Asian voter registration rate is the broadest at about 12%, and thus the estimated rate (76.4%) is not reliable enough to include. The American Indian/Alaskan Native and the Native Hawaiian/Pacific Islander voter registration rates are also not reliable enough to include, given the low number of individuals who offered measurable responses (two people and one person, respectively). 15
2: Estimates of North Carolina’s Voter Registration Rates by Race. 12
registering, and one out of 10 registered voters are listed as “undesignated.” Nearly 16% of this group skews younger, between the ages of 18 to 25, and 13% of 26- to 40-year-olds fall into this category. Carolina Demography suggests this rise “could be a reflection of a shifting understanding of racial and ethnic identities, a reflection of potential voter fears about race/ethnicity being used to block access to the polls, or a rise in general distrust surrounding the current election system.” 14
As of March 2025, North Carolina’s voter rolls include 988,581 infrequent voters – voters who did not vote in the past two general elections (2022 or 2024) and did not contact their county board of elections to confirm they wish to remain an active voter. 17
Young voters in North Carolina aged 18 to 25 are more likely to be infrequent voters compared to their older counterparts. While this age group makes up about 12% of the registered population, they account for almost 16% of inactive voters. In contrast, voters over age 66 make up about 25% of registered voters but only about 15% of inactive voters.
PROPORTION OF TOTAL VOTERS
PROPORTION OF INFREQUENT VOTERS
Figure 1: Infrequent Voter Rates by Age. 16
Black voters are significantly overrepresented among infrequent voters, making up 25% of inactive voters, compared to 19% of registered voters overall. In contrast, white voters, the largest voting bloc in the state, are less likely to be inactive: they constitute 64% of all registered voters and 51% of those who are infrequent.
In Figure 2, we combined Asian, American Indian/Alaska Native (AIAN), Native Hawaiian/Pacific Islander (NHPI), and "Other" racial groups due to the extremely small sample sizes of AIAN and NHPI respondents. Because the resulting bars would have been too small to interpret meaningfully, we opted to aggregate for clarity. More detailed data, including for AIAN and NHPI voters, is available through the North Carolina State Board of Elections voter history file. 19
PROPORTION OF INFREQUENT VOTERS PROPORTION OF
Similarly, Latino voters in North Carolina are also overrepresented among inactive voters. While Latinos make up about 4% of the state’s registered population, they account for 6% of inactive voters. The rest of the registered population is categorized as "not Hispanic or Latino" or "undesignated."
WHO ARE N.C.'S
VOTERS?
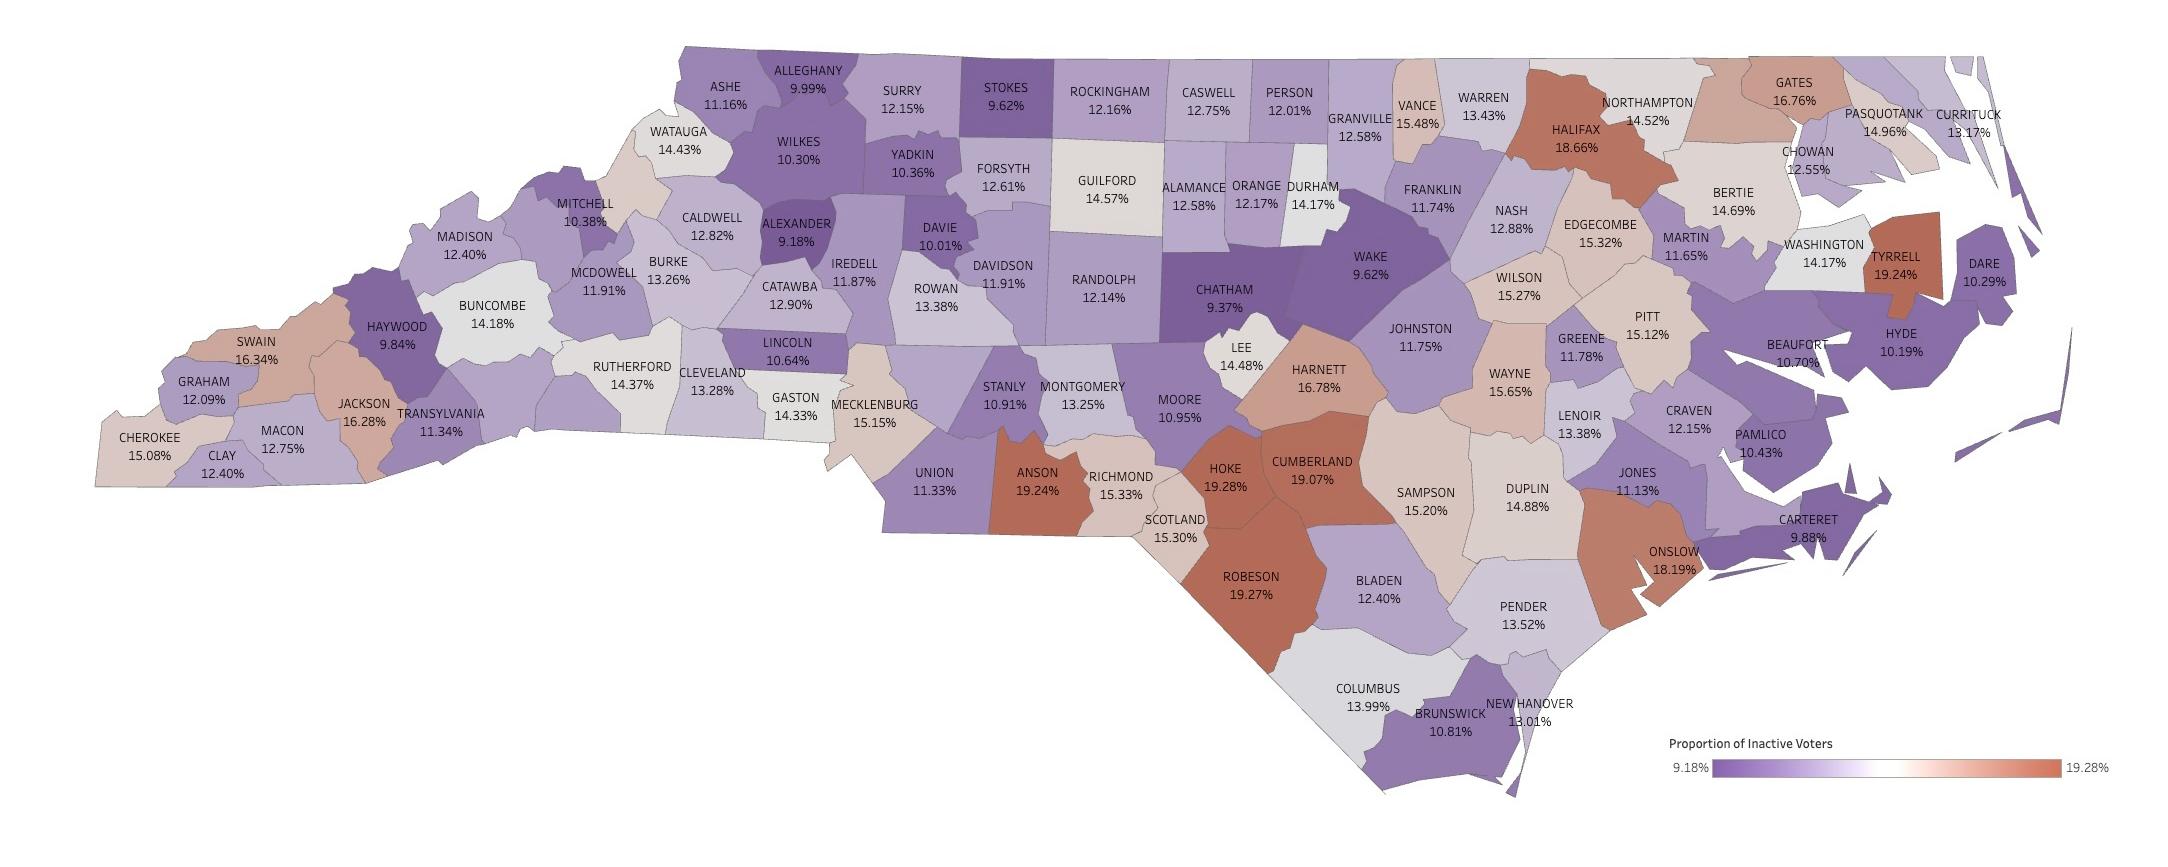
There is significant variation in the proportion of infrequent voters by county, ranging from 9% of registered voters (Alexander County) to 19% (Hoke County). Several counties (Anson, Cumberland, Gates, Halifax, Harnett, Hertford, Hoke, Onslow, Robeson, and Tyrell) categorized more than 16% of their registered voters as inactive.
Figure 4: Proportion of Inactive Voters by County.
FOR MORE INFORMATION
View the interactive geographic visualizations by scanning the QR code or visiting t.ly/proqq.
HIGHEST SHARES OF INACTIVE VOTERS
Table 3. Counties with highest proportion of inactive voters. The full table is available in the appendix.
Table 4. Counties with lowest proportion of inactive voters. The full table is available in the appendix.
The proportion of inactive Black voters is highest in the Northeast region of the state, commonly referred to as North Carolina’s “Black Belt.”
Bertie, Hertford, Northampton, Edgecombe, and Halifax counties are part of North Carolina’s “Black Belt.”
HIGHEST SHARES OF INACTIVE VOTERS
COUNTY
OF BLACK INACTIVE VOTERS
Table 5. Counties with highest proportion of Black inactive voters. The full table is available in the appendix.
LOWEST SHARES OF INACTIVE VOTERS
OF BLACK
COUNTY
Table 6. Counties with lowest proportion of Black inactive voters. The full table is available in the appendix.
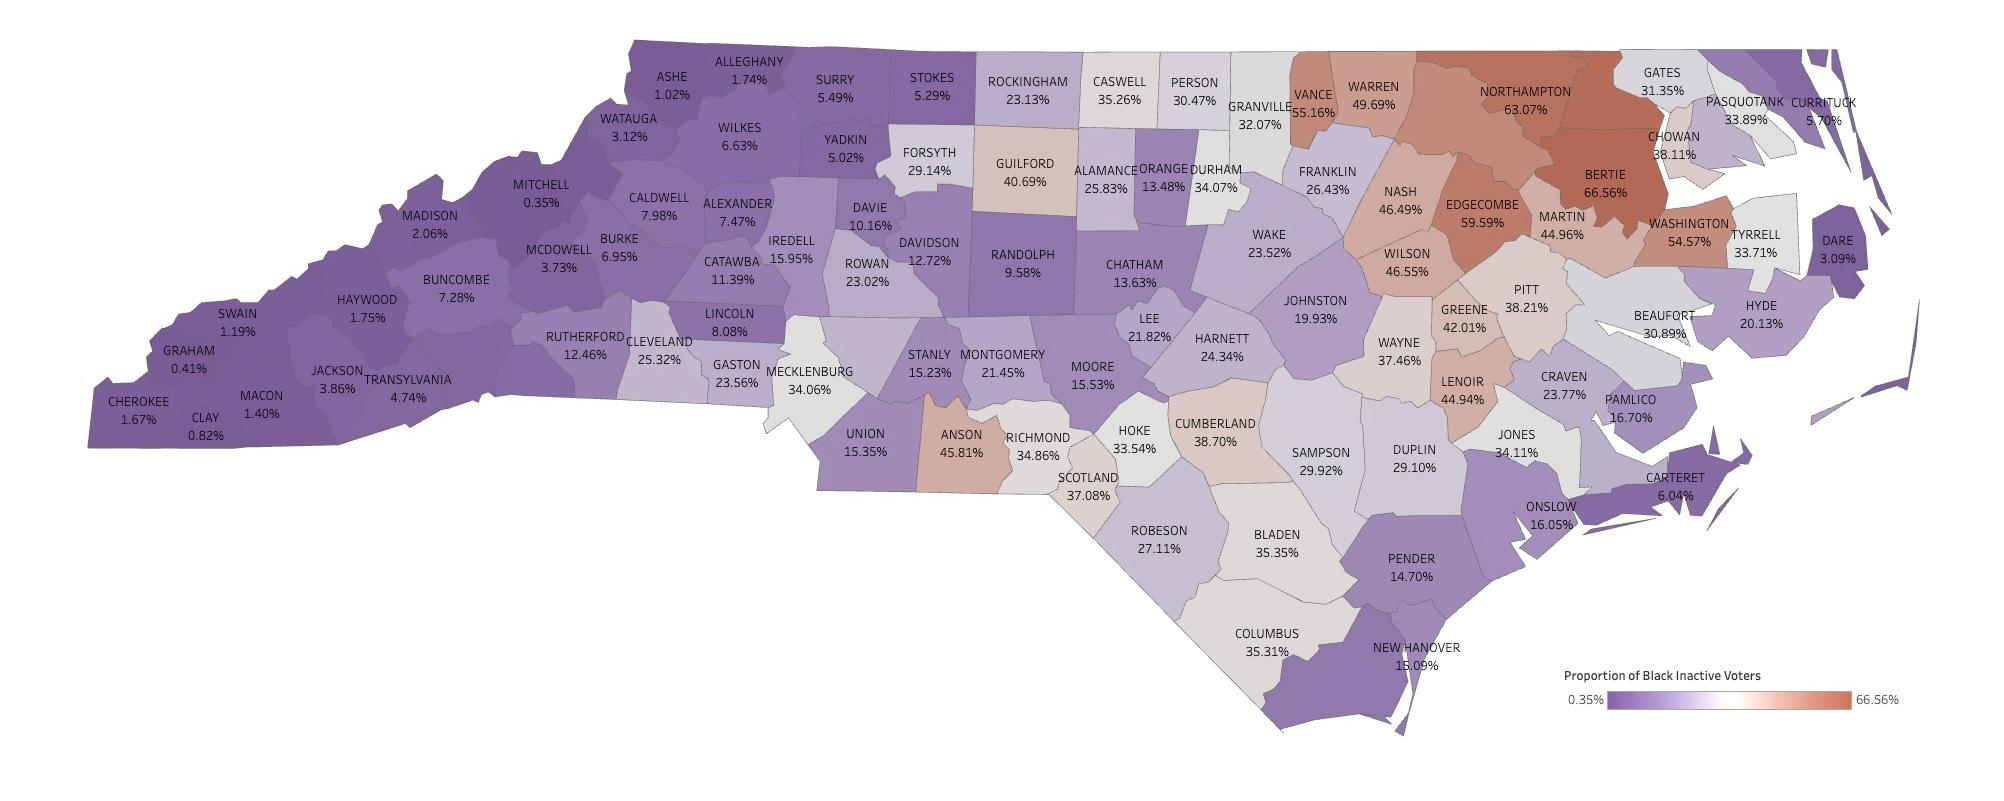
Figure 5: Proportion of Black Inactive Voters by County. 21
Nationally, North Carolina has rapidly declined in terms of ease of registration and voting. It is among the more difficult states to register to vote, ranking 30th in the nation in voting accessibility, according to the nonpartisan Cost of Voting Index. 22 North Carolina’s rank fell by 14 spots in just four years (from 2020 to 2024), the largest drop among all states, “indicating that voting has become relatively more difficult for its citizens.”23 Some of the reported challenges to registration and voting include:
• Lack of same-day voter registration on Election Day
• Strict voter ID laws
• Burdensome requirements to vote by mail, including providing a photocopy of photo ID and a notarized signature or two witness signatures on the return ballot envelope
Our analysis revealed that North Carolinians face numerous logistical and structural barriers that likely contribute to low registration and turnout across the state. These barriers disproportionately impact Black and brown communities, young voters, and disabled voters.
North Carolinians face significant logistical and structural barriers to voter registration.
After the 2020 presidential election, over one fifth of North Carolina’s eligible voters did not register to vote due to logistical challenges. The U.S. Census Bureau’s Current Population Survey estimated 14% of North Carolina’s eligible voters were unable to register because they “did not meet registration deadlines” or “did not know where or how to register.” 24 Another 7.2% were unable to register due
to disability or illness.25 These estimates reveal that additional accessibility accommodations and greater community education are needed to boost registration rates.
The main structural barriers to registration are onerous eligibility requirements, particularly concerning mail access and felony disenfranchisement.
• MAIL ACCESS. North Carolina’s State Board of Elections uses a mail verification system to confirm residency for purposes of voter registration eligibility. This system requires everyone who registers to vote to have an address that can reliably receive mail from the U.S. Postal Service.26 This is required even for those who do not seek to vote by mail. However, mail access is not one of the requirements of eligibility under North Carolina’s constitution or law.27 Moreover, there is substantial evidence that mail deliverability is an unreliable method to confirm residency. This is because there are many reasons a piece of mail could be returned that have nothing to do with a voter’s eligibility or residence, including sender or postal errors, overflowing mailboxes due to
“Voters who are unhoused don't have a safe place to keep their social security card, their ID, their driver's license or birth certificate. A lot of times they don't have a safe place to keep those so when one gets stolen, it all gets stolen. How do you replace your birth certificate if you don't have an ID? How do you get your ID if you can't get your birth certificate?”
—Jenny McKenney, North Carolina State Director, VoteRiders
unclaimed mail, lack of proper postage, and the fact that a substantial number of addresses, often in rural areas, exist on so-called “phantom routes” that are not within deliverable areas.28 Student voters, the unhoused, transient voters, and those who have been displaced by hurricanes and other natural disasters can be particularly at risk for having their registration applications denied based on lack of deliverability because of issues associated with their addresses.
• FELONY DISENFRANCHISEMENT. Individuals convicted of felonies lose their right to vote in North Carolina until they have completed their sentence, including any periods of probation, parole, or post-release supervision. This makes North Carolina among the more restrictive states in the country in terms of felony disenfranchisement.29 Instead of automatically restoring a person’s voter registration upon completion of a sentence, North Carolina requires people to re-register.30 This requirement falls disproportionately on the state’s Black population, given the entrenched discrimination in the state’s legal system that puts Black North Carolinians at 55% of the state’s prison population but only about 22% of the state’s adult population, according to N.C. Second Chance Alliance. 31
In 2022, a three-judge panel in Wake Superior Court found the state’s felony disenfranchisement law violated the state Constitution for discriminating against Black voters. This decision allowed over 50,000 people who were not in prison but on post-release supervision, parole, or probation to register to vote. In 2023, the N.C. Supreme Court reversed this ruling in a controversial decision.39
Felony disenfranchisement can suppress overall participation within communities. States with a greater percentage of Black voters who cannot vote because of a felony conviction also experience lower overall Black voter turnout, even among Black voters not directly affected by felony disenfranchisement laws.32 This is likely due to the “communal nature of voting,” where communities often collectively participate in the process by sharing transportation, information about candidates and election deadlines, or encouragement.33 When members of a community are ineligible, it can break community norms around voting and lower total turnout rates.
• LACK OF AUTOMATIC VOTER REGISTRATION (AVR). AVR would make registering to vote “opt-out” instead of “opt-in” when eligible citizens interact with government agencies, such as the Department of Motor Vehicles. AVR has expanded access to the ballot and is gaining momentum across the country.34
• LACK OF SAME-DAY REGISTRATION (SDR) ON ELECTION DAY. While North Carolina provides SDR during early voting, it is the only state that allows voters to register during the entire early voting period but not on Election Day.35 As a result, voters in North Carolina are unable to both register to vote and cast a ballot on Election Day, even if they come with proof of residence and fulfill the state’s voter ID requirements. That is not a theoretical problem — nearly 36,000 people had their provisional ballots discounted because they were not registered on Election Day, had tried to register after the deadline, or had been previously denied registration.35
provisional ballots are cumbersome and time-intensive to fill out. It is impossible to tell how many voters simply walk away without voting a provisional ballot when they are told they are not registered. A look at provisional ballots alone may not show the whole picture of who attempts to vote but is unable due to registration issues, but available data show at least some voters are disenfranchised by this process.
For example, in the 2020 general election, at least 2,280 voters who were removed from the voter rolls in the prior year attempted to vote but were forced to cast provisional ballots.36 In 2022, this was true for 1,770 voters who were previously purged and showed up to vote.37 And in 2024, county board research indicated that 5,608 provisional voters were “previously removed” from the voter rolls, and another 1,009 had “no record of registration” but matched against registration records of recently removed voters.38
“My entire adult life I was involved in the criminal legal system and did not have the ability or the right or the interest half the time in voting, and so it was very daunting. It was, I don't know how any of this works. I don't know any of these candidates. I don't know who believes in me or not, but I know that this is something I didn't have the right to do before, and I have the right to do now, and I need to go do it right.”
—Kristie
Puckett, Senior Project Manager, Forward Justice
Even if a person successfully registers, they can encounter additional barriers before they make it to the polls. Our analysis of provisional ballot data indicates that there are eligible voters who are wrongly purged from voter rolls.
Provisional ballots are intended to be a “fail safe” for voters who encounter an issue with their registration status at the polls, including previously registered voters who were purged from the voter rolls. In practice, however,
These data suggest some people were removed from North Carolina’s voter rolls when they were, in fact, still eligible voters. This may occur for several reasons entirely outside a voter’s control, such as the unreliability of mailing confirmation cards and the lack of funding available for more robust voter outreach.
Once North Carolinians clear the hurdle of voter registration and potential removal from voter rolls, additional structural barriers can prevent many from actually casting a ballot. These barriers have contributed to lower turnout levels for certain populations, including younger voters ages 18 to 25 and voters of color.
Structural barriers to voting in North Carolina include:
• BURDENSOME ID REQUIREMENTS. North Carolina requires voters to provide photo identification at the polls in order to cast a ballot. These voter identification requirements have only limited exceptions. Reports to the Election Protection Hotline in the 2024 General Election indicated this ID requirement was frequently misunderstood by poll workers, who mistakenly rejected qualifying identification or provided other misinformation about the requirement to voters.
North Carolina’s latest voter ID law was passed after its prior iteration was struck down as racially discriminatory by a federal appellate court who found the law targeted voters of color with near “surgical precision.” The more recent version of photo ID law was also struck down after the N.C. Supreme Court
Table 7. 2024 General Election Voter Turnout, by Age Group by County. 52 (Turnout is calculated by dividing the total number of eligible voters in an age group by the number of voters in that age group who cast a ballot.)
Table 8. 2024 General Election Voter Turnout, by Race. 53 (Turnout is calculated by dividing the total number of eligible voters in a racial group by the number of voters in that racial group who cast a ballot.)
found it intentionally discriminated against Black voters. However, in an unprecedented move in 2023, the N.C. Supreme Court reversed that ruling after a shift in the makeup of the court.40 The legality of North Carolina’s voter ID law is still being considered in a federal court challenge.
• OBSTACLES FOR MAIL-IN BALLOTS. North Carolina is one of just two states (along with Alabama) requiring the signature of two witnesses or a notary for mail-in ballots to successfully be counted.41 This is in addition to the requirement that those voting by mail provide a photocopy of their photo ID. Restrictions also limit who can assist voters with completing and returning mail-in ballots. North Carolina is also among just 12 states that do not have secure drop boxes for mail-in ballot returns.42 These barriers disproportionately impact those who cannot make it to the polls in person, including voters with disabilities.
People with disabilities also comprise a notable portion of missing voters in North Carolina, though voter files do not account for disability status. The U.S. Census estimates that 11% of North Carolina’s registered voters did not vote because of a disability or illness.43 Furthermore, MIT’s Election Performance Index ranks North Carolina the 46th worst state for disability access in voting.44
• LANGUAGE BARRIERS. Lack of language access can also prevent voters, and particularly naturalized citizens from immigrant communities who are not proficient in English, from accessing the ballot. According to the U.S. Census, 14% of North Carolinians speak a language other than English at home and among those, 38% speak English “less than very well.”45 The rate of limited English proficiency is especially high in particular communities. Among North Carolinians who speak Spanish at home, 42% are
considered Limited English Proficient (LEP). Limited English proficiency is also significant among North Carolina’s Asian communities, who have emphasized the importance of language access in registering and voting.46 For example, among North Carolinians who speak Vietnamese and Korean at home, 62% and 54% are LEP, respectively. However, not a single jurisdiction in North Carolina is currently covered under Section 203 of the federal Voting Rights Act (VRA), which guarantees multilingual ballots to language minority communities that reach certain population thresholds. While the North Carolina State Board of Elections offers a website that can be translated to additional languages and makes some election materials (such as voter registration forms) available in Spanish, access to information at the county level in other languages is more limited.
“There are new rules that may not seem unreasonable at first, but in reality, they will affect different parts of the community disproportionately. Election boards have the responsibility to provide language access and translations, and to ensure those resources get to the voters who need it. Our representatives have the responsibility to enable that to happen.”
—Jimmy Patel-Nguyen, Communications Director, North Carolina Asian Americans Together
Lack of competitive races and districts can also contribute to lower turnout. As of 2024, onethird (33%) of North Carolina’s federal, state, and local elections were uncontested.47 Quantitative analysis has also confirmed that increased gerrymandering of voting districts — a persistent issue in the state — can cause lower voter turnout by decreasing the number of competitive districts.48
According to the 2020 U.S. Census Bureau’s Current Population Survey, the most common reasons North Carolina voters gave for staying away from the polls were because they felt their vote wouldn’t make a difference (18.8%) or because they didn’t like the candidates or campaign issues (14.6%). In addition, significant numbers of voters also had barriers to access, including registration problems (7.0%), transportation issues (2.2%), and inability to find the time within work or other schedules (13.5%).
These barriers all add up. According to State Board of Election data, over two million of North Carolina’s voters who registered to vote ultimately did not cast a ballot in the 2024 election.49 Compared to the overall turnout rate of 74%,50 turnout was markedly lower for younger voters (57% for 18 to 25-year-olds), as well as for Black and brown voters (66% for Black or African American, 68% Asian, and 56% Latino).51
problems (i.e. didn't receive absentee ballot, not registered in current location)
of town or away from home
Concerns about coronavirus (COVID-19) pandemic
Forgot
A healthy and thriving democracy must include the nearly 1.5 million voters currently “missing” from North Carolina’s elections. The overrepresentation of Black and brown voters among North Carolina’s missing voter population, along with North Carolina’s history of restrictive voting policies, demands election policies that proactively address glaring racial disparities in voter registration and turnout. Our analysis also demonstrates a vital need for state elected officials to enact measures to increase access for young voters, voters with disabilities, and voters with limited English proficiency. We recommend that policymakers:
• Allocate more funding and resources to state and county election boards to manage voter registration databases and increase voter engagement, with special attention to marginalized and underrepresented communities. This could include allocating additional funds to support and update the voter registration database, referred to as Statewide Elections Information Management System (SEIMS), and ensure North Carolina’s enrollment and participation in the Electronic Registration Information Center (ERIC). ERIC facilitates outreach to unregistered but eligible voters while also helping states to identify registered voters who have moved within the state or to another state, voters who have died, and potential duplicate registrations. It could also include expanded programs for voter registration at public colleges and universities and civic engagement programs in high schools to encourage voter registration as soon as registrants become eligible through youth-led outreach teams.
• Enact automatic voter registration (AVR) in North Carolina, whereby eligible individuals are automatically registered to vote when interacting with certain government agencies (such as the DMV) but may opt out if they choose. The state should also designate more voter registration agencies to increase opportunities for voters to register and update their registration when needed.
• Provide expanded registration opportunities. Implementing Election Day same-day registration would allow voters with proof of residence to vote on election day. Eliminating the requirement that any same-day registrant who produced proof of residency must also pass mail verification to have their vote counted would prevent eligible voters from having their ballot rejected because of mail access issues beyond their control. Offering expanded online voter registration that does not require an account with the Department of Motor Vehicles (which can cause confusion as to whether a fee is required) would increase access for younger voters and those with transportation or logistical barriers to in-person and mail-in registration.
• Reform voter registration list maintenance practices to make it easier for voters to stay registered. This includes ending the use of failure to vote and mail undeliverability to trigger removal. Instead, the state should provide resources for additional methods (e.g., phone, text, and email) to reach voters before they are removed from the voter rolls and make it easier for them to confirm their eligibility.
• Enact automatic restoration of voting rights after sentence completion, to ensure that people can be invested members of their communities with the long-term goal of ending the discriminatory practice of felony disenfranchisement.
• Lower the burden of voting through various reforms, especially for marginalized and underrepresented communities. This could include increasing requirements and funding for early voting and election-day voting locations to reduce waiting times and lines; reducing the
witness and ID requirements for mail-in ballots and allowing ballot drop boxes for their return; and reversing the recent changes that reduced the time for postmarked mail-in ballots to be received by county board of elections (back to three days post-election) and for voters to cure any issues with them (back to nine days postelection).
• Develop robust language access policies and practices to ensure that eligible voters can participate in elections, regardless of their English language fluency.
When unnecessary and discriminatory barriers to voting are removed, North Carolina’s missing voters will be found. Policymakers can address this and other threats to our democracy by implementing the above recommendations. These policy proposals represent a floor—though certainly not a ceiling—of changes that would secure access to the ballot for millions of North Carolinians and bring us closer to being a government that is of, by, and for the people.
1 See “Voting Laws Roundup: 2024 in Review,” BRENNAN CENTER FOR JUSTICE (Jan. 15, 2025), https://www. brennancenter.org/our-work/research-reports/votinglaws-roundup-2024-review.
2 See “Turnout in U.S. has soared in recent elections but by some measures still trails that of many other countries,” PEW RESEARCH CENTER (Nov. 1, 2022), https://www. pewresearch.org/short-reads/2022/11/01/turnout-in-us-has-soared-in-recent-elections-but-by-some-measuresstill-trails-that-of-many-other-countries/.
3 “Scorecard: North Carolina,” DĒMOS (September 2024), https://power.demos.org/scorecards/north-carolina.
4 “Scorecard: North Carolina,” DĒMOS (September 2024), https://power.demos.org/scorecards/north-carolina.
5 “Scorecard: North Carolina,” DĒMOS (September 2024), https://power.demos.org/scorecards/north-carolina.
6 See N.C. State Board of Elections, “North Carolina Voter Registration List Maintenance” (updated Aug. 21, 2024) at 29, https://s3.amazonaws.com/dl.ncsbe.gov/ Voter_Registration/North_Carolina_List_Maintenance_ Policy_2024_08_21.pdf.
7 Data from the North Carolina State board of Elections is available at https://dl.ncsbe.gov/?prefix=data/Snapshots/; Data from the U.S. Census is available at https://data. census.gov.
8 Bhairavi Jayaraman and Emma Marshall, “Who are North Carolina’s 7.6 million registered voters? (2024),” CAROLINA DEMOGRAPHY (Oct. 10, 2024), https:// carolinademography.cpc.unc.edu/2024/10/10/whoare-north-carolinas-7-6-million-registered-voters-2024/ (relying on State Board of Elections data for its analysis).
9 See “Voter Registration Statistics,” NORTH CAROLINA STATE BOARD OF ELECTIONS (Reporting Period 3/22/2025), https://vt.ncsbe.gov/RegStat/ Results/?date=02%2F15%2F2025.
10 See generally “A Brief History of Voter Suppression in North Carolina,” DEMOCRACY NORTH CAROLINA, https:// democracync.org/wp-content/uploads/2021/12/A-BriefHistory-of-Voter-Suppression-in-NC-2.pdf.
11 “Voting and Registration Supplement,” U.S. CENSUS BUREAU, Current Population Survey, November 2020.
12 “Voting and Registration Supplement,” U.S. CENSUS BUREAU, Current Population Survey, November 2020.
14 See Nicholas Long, “How have registered voters in NC shifted demographically in the last decade?” CAROLINA DEMOGRAPHY (Nov. 15, 2023), https:// carolinademography.cpc.unc.edu/2023/11/15/how-haveregistered-voters-in-nc-shifted-demographically-over-thepast-decade/.
15 For more information on issues with registration data, see the sidebar in this Section.
16 See N.C. Voter History File, North Carolina State Board of Elections, https://s3.amazonaws.com/dl.ncsbe.gov/data/ ncvoter_Statewide.zip (file dated 3/23/2025).
17 See N.C. Voter History File, NORTH CAROLINA STATE BOARD OF ELECTIONS, https://s3.amazonaws.com/ dl.ncsbe.gov/data/ncvoter_Statewide.zip (file dated 3/23/2025).
18 See N.C. Voter History File, North Carolina State Board of Elections, https://s3.amazonaws.com/dl.ncsbe.gov/data/ ncvoter_Statewide.zip (file dated 3/23/2025).
19 See N.C. Voter History File, North Carolina State Board of Elections, https://s3.amazonaws.com/dl.ncsbe.gov/data/ ncvoter_Statewide.zip (file dated 3/23/2025).
20 See N.C. Voter History File, North Carolina State Board of Elections, https://s3.amazonaws.com/dl.ncsbe.gov/data/ ncvoter_Statewide.zip (file dated 3/23/2025).
21 See N.C. Voter History File, North Carolina State Board of Elections, https://s3.amazonaws.com/dl.ncsbe.gov/data/ ncvoter_Statewide.zip (file dated 3/23/2025).
22 Michael J. PomanteII, “Cost of Voting in the American States: 2024,” Election Law Journal: Rules, Politics, and Policy, at 56 (2024), https://doi.org/10.1089/ elj.2024.0037.
23 Michael J. PomanteII, “Cost of Voting in the American States: 2024,” Election Law Journal: Rules, Politics, and Policy, at 55 (2024), https://doi.org/10.1089/ elj.2024.0037.
24 “Voting and Registration Supplement,” U.S. Census Bureau, Current Population Survey, November 2020.
13 Miriam McKinney Gray, “Surfacing Missing Voters,” Democracy and Power Innovation Fund at 4, 7-10 (2024) https://drive.google.com/file/d/1ed_3oI34JXkJvT8oxZlwCipmmaCrx7n/view.
25 "Voting and Registration Supplement,” U.S. Census Bureau, Current Population Survey, November 2020. For our purposes, “disability or illness issues” includes responses of “permanent disability or illness” and “concerns about the coronavirus (COVID-19) pandemic.”
26 See “North Carolina Voter Registration List Maintenance,”
North Carolina State Board of Elections (updated Aug. 21, 2024) at 13, https://s3.amazonaws.com/dl.ncsbe.gov/ Voter_Registration/North_Carolina_List_Maintenance_ Policy_2024_08_21.pdf.
27 See N.C. Const. art. VI (“Suffrage and Eligibility to Office”); N.C.G.S. § 163-55 (“Qualifications to vote; exclusions from electoral franchise”).
28 See “Mail Returned as Undeliverable in List Maintenance,” Southern Coalition for Social Justice (March 2024), https:// southerncoalition.org/mail-returned-as-undeliverable-inlist-maintenance.
29 See “Locked Out 2024: Four Million Denied Voting Rights Due to a Felony Conviction” The Sentencing Project, (Oct. 10, 2024) at Table 1, https://www.sentencingproject. org/reports/locked-out-2024-four-million-denied-votingrights-due-to-a-felony-conviction.
30 See “North Carolina voter Registration List Maintenance,” North Carolina State Board of Elections (updated Aug. 21, 2024) at 19, https://s3.amazonaws.com/dl.ncsbe.gov/ Voter_Registration/North_Carolina_List_Maintenance_ Policy_2024_08_21.pdf.
31 See NC Second Chance Alliance, https://ncsecondchance. org/about/.
32 King, Bridgett A., and Laura Erickson, “Disenfranchising the Enfranchised: Exploring the Relationship Between Felony Disenfranchisement and African American Voter Turnout,” J. of Black Studies, Vol. 47 No. 8, 804, 812 (2016), http://www.jstor.org/stable/26174229.
33 Marc Mauer, “Thinking About Prison and its Impact in the Twenty-First Century,” Ohio State J. of Crim. L. Vol. 2:607 at 615-16, https://core.ac.uk/reader/159576450.
34 See “Automatic Voter Registration,” Brennan Center for Justice, https://www.brennancenter.org/issues/ensureevery-american-can-vote/voting-reform/automatic-voterregistration.
35 Data available from the North Carolina State Board of Elections at https://s3.amazonaws.com/dl.ncsbe.gov/ ENRS/2024_11_05/provisional_20241105.txt (file dated Nov. 27, 2024).
36 This list was created by matching the 2020 provisional ballot file with the State Board’s 2019 list of removed voters using combinations of county name, voter name, and address. See “North Carolina Voter List Maintenance: 2025 Update,” Southern Coalition for Social Justice (2025), https://southerncoalition.org/resources/northcarolina-voter-list-maintenance-2025-update/.
37 See “North Carolina Voter List Maintenance: 2025 Update,” Southern Coalition for Social Justice (2025), https://southerncoalition.org/resources/north-carolinavoter-list-maintenance-2025-update/.
38 See “North Carolina Voter List Maintenance: 2025 Update,” Southern Coalition for Social Justice (2025), https://southerncoalition.org/resources/north-carolinavoter-list-maintenance-2025-update/.
39 See “Fighting for rights restoration: CSI v. Moore,” Protect Democracy (Sept. 21, 2021), https://protectdemocracy. org/work/csi-v-moore/.
40 For more information, see “Holmes v. Moore,” Southern Coalition for Social Justice, https://southerncoalition.org/ cases/homes-v-moore/.
41 See “Table 14: How States Verify Voted Absentee/Mail Ballots,” National Conference of State Legislators, https:// www.ncsl.org/elections-and-campaigns/table-14-howstates-verify-voted-absentee-mail-ballots (last updated Jan. 21, 2025).
42 See “Table 9: Ballot Drop Box Laws,” National Conference of State Legislators, https://www.ncsl.org/elections-andcampaigns/table-9-ballot-drop-box-laws (last updated Jan. 31, 2025).
43 “Current Population Survey, November 2020: Voting and Registration Supplement,” U.S. Census Bureau (2020).
44 “Election Performance Index,” MIT Election Data and Science Lab (2020), https://elections.mit.edu/#/data/
map?view=indicatorprofile&indicator=T&year=2020.
45 See “American Community Survey: Language Spoken at Home,” U.S. Census Bureau, https://www.census.gov/acs/ www/about/why-we-ask-each-question/language/ (last accessed Jan. 23, 2025).
46 48 See “2024 AAPI Voter Demographics | North Carolina,” APIAVote (2024), https://apiavote.org/wp-content/ uploads/North-Carolina-2024-State-Fact-Sheet.pdf.
47 See “Election results, 2024: Uncontested races by state,” Ballotpedia (December 12, 2024), https://ballotpedia. org/Election_results,_2024:_Uncontested_races_by_state; “Scorecard: North Carolina,” Dēmos (September 2024), https://power.demos.org/scorecards/north-carolina.
48 See, e.g., Jones, Daniel et. al., Partisan Gerrymandering and Turnout, J. of Law and Econ. Vol. 66 No. 3 (Aug. 2023), https://www.journals.uchicago.edu/ doi/10.1086/725767.
49 See “Voter Turnout,” North Carolina State Board of Elections, https://www.ncsbe.gov/results-data/voterturnout.
50 “Voter Turnout,” North Carolina State Board of Elections, https://www.ncsbe.gov/results-data/voter-turnout.
51 “2024 General Election Turnout,” North Carolina State Board of Elections, https://www.ncsbe.gov/results-data/ voter-turnout/2024-general-election-turnout.
52 See “2024 General Election Turnout,” North Carolina State Board of Elections, https://www.ncsbe.gov/results-data/ voter-turnout/2024-general-election-turnout.
53 See “2024 General Election Turnout,” North Carolina State Board of Elections, https://www.ncsbe.gov/results-data/ voter-turnout/2024-general-election-turnout.
54 “Voting and Registration Supplement,” U.S. Census Bureau, Current Population Survey, November 2020.
55 The “Other” category encompasses responses of those who selected “Other,” “Don’t Know,” “Refused to Answer,” “Bad Weather,” and “Inconvenient Hours.”
Table 10. North Carolina Counties and proportion of inactive voters and inactive Black voters.
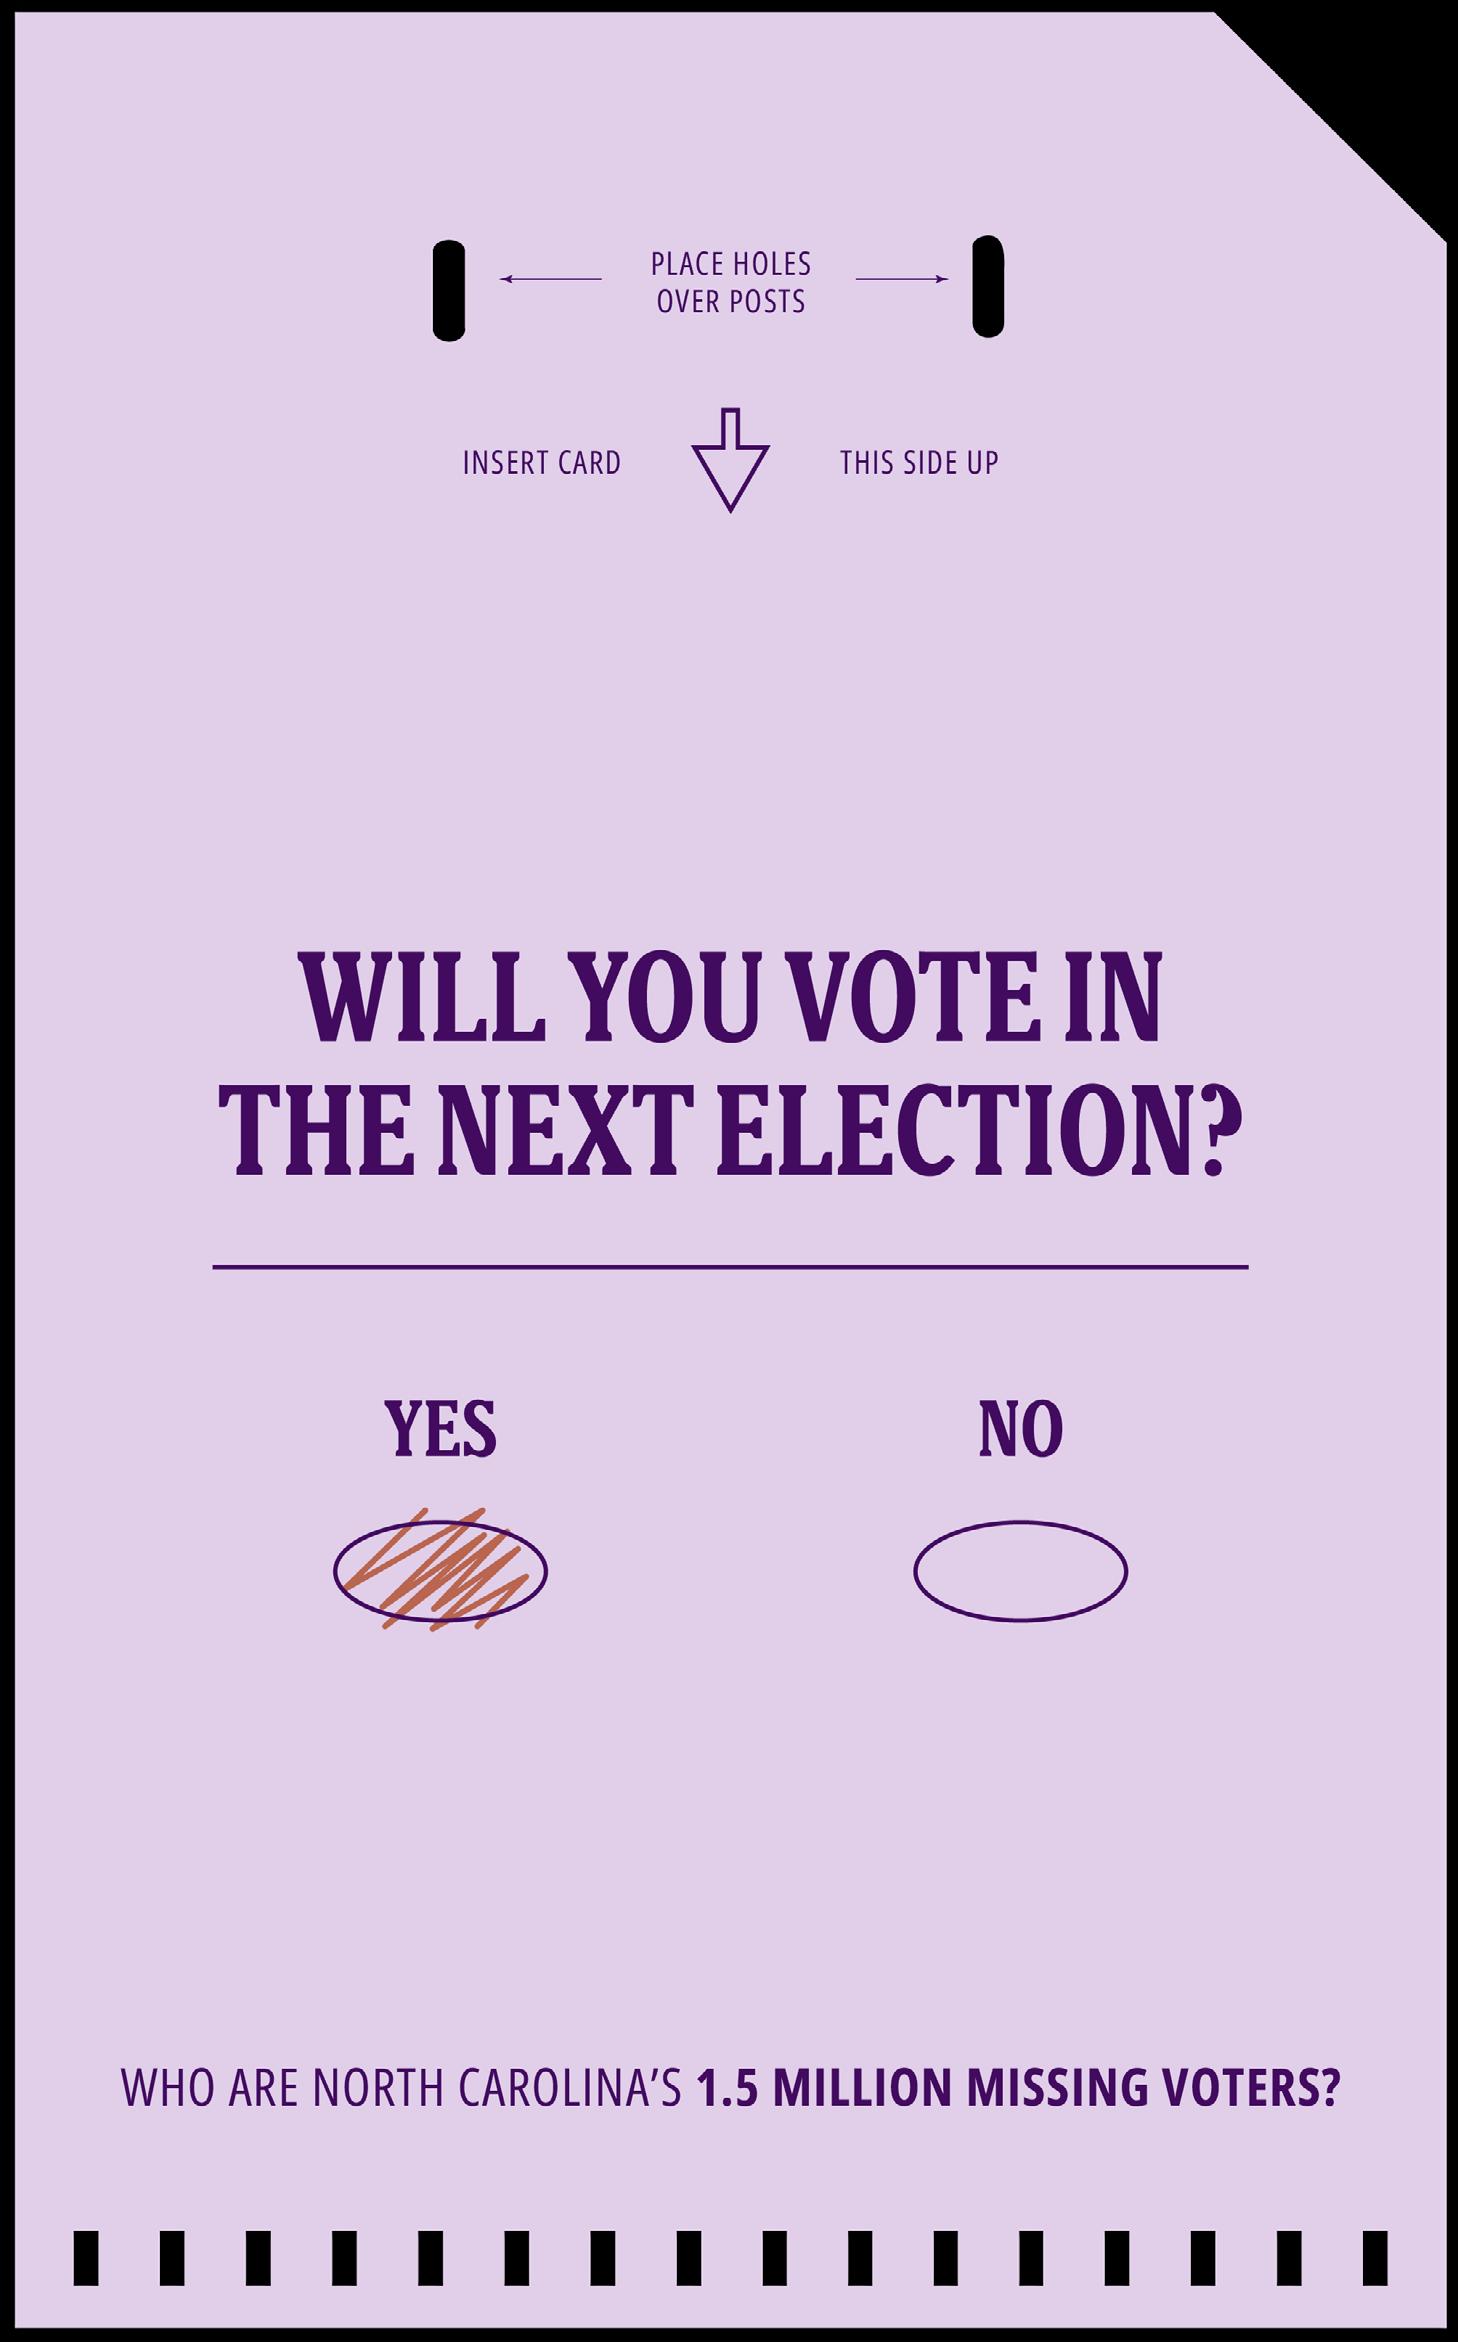
WHO ARE NORTH CAROLINA’S 1.5 MILLION MISSING VOTERS?
Southern Coalition for Social Justice partners with communities of color and economically disadvantaged communities in the South to defend and advance their political, social, and economic rights through the combination of legal advocacy, research, and communications.
www.southerncoalition.org
Dēmos is a non-profit public policy organization working to build a just, inclusive, multiracial democracy and economy. We work hand in hand to build power with and for Black and brown communities, forging strategic alliances with grassroots and state-based organizations.
www.demos.org