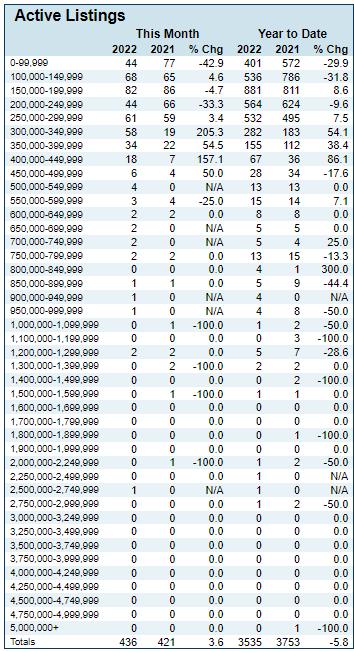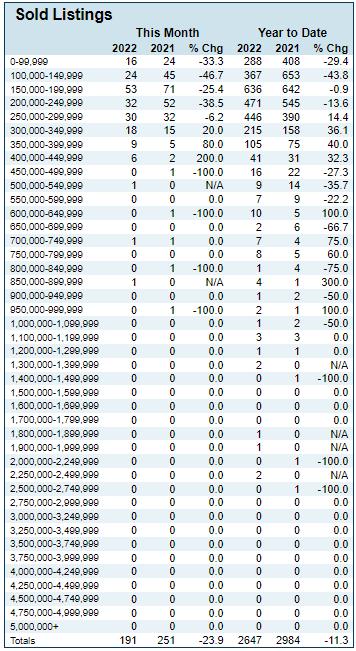
Richmond County SOLD Current Richmond County Market Stats ACTIVE LISTINGS 351 UNDER CONTRACT 234 SOLD LISTINGS DEC. 193 $222,500 AVG. SALE PRICE AVG. LIST PRICE $225,600 AVG. DAYS ON MARKET FOR CLOSED 83


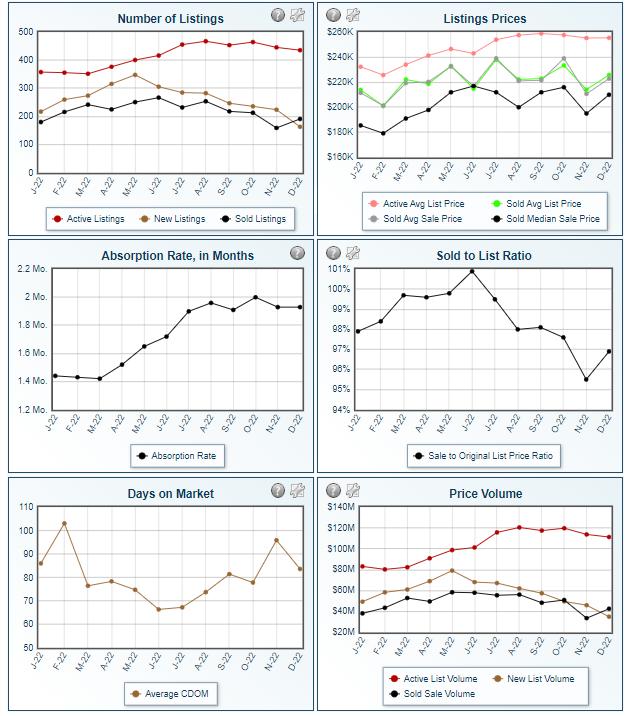
PAGE 06 -Average Sales Price was up 9.2% vs. Dec. '21 to $222,900 - Avg. Days on Market for closed properties is 83 vs. Dec. '21 at 75. - Months Supply of Inventory was up 13.5% vs. Dec. '21 to 1.9 months . December 2022 Recap FLEXMLS Market Update (Richmond County)

Statistic 22-Dec 21-Dec % Chg 2022 YTD 2021 YTD % Chg Absorptio n Rate 1.9 1.7 13.5 1.7 2.0 -13.1 Average List Price $255,518 $224,913 13.6 $222,949 $208,945 6.7 Median List Price $225,000 $189,000 19.1 $199,000 $179,900 10.6 Average Sale Price $222,856 $204,136 9.2 $221,848 $200,260 10.8 Median Sale Price $210,000 $189,900 10.6 $201,000 $179,999 11.7 Average CDOM 83.0 75.0 10.7 79.0 85.0 -7.1 Median CDOM 59.0 54.0 9.3 49.0 53.0 -7.6 PAGE 07 December 2022 Recap FLEXMLS Market Update (Richmond County)


