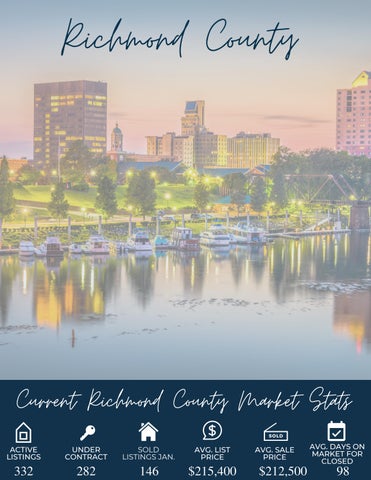
Richmond County SOLD Current Richmond County Market Stats ACTIVE LISTINGS 332 UNDER CONTRACT 282 SOLD LISTINGS JAN. 146 $212,500 AVG. SALE PRICE AVG. LIST PRICE $215,400 AVG. DAYS ON MARKET FOR CLOSED 98
Market Update (Richmond County)
January 2023 Recap
-Average Sales Price was up 0.5% vs. Jan. 22 to $212,500
- Avg. Days on Market for closed properties is 98 vs. 86 in Jan. 22, this is a 14% increase.
- Months Supply of Inventory was up 23.3% vs. Jan. 22 to 1.8 months
.
FLEXMLS
Market Update (Richmond County)
January 2023 Recap
Statistic 23-Jan 22-Jan % Chg 2023 YTD 2022 YTD % Chg Absorption Rate 1.8 1.46 23.3 1.8 1.46 23.3 Average List Price $257,109 $231,822 10.9 $239,340 $227,387 5.3 Median List Price $225,500 $192,000 17.5 $200,000 $189,900 5.3 Average Sale Price $212,537 $211,512 0.5 $212,537 $211,512 0.5 Median Sale Price $203,700 $185,450 9.8 $203,700 $185,450 9.8 Average CDOM 98.0 86.0 14.0 98.0 85.0 15.3 Median CDOM 68.0 58.0 17.2 71.0 59.0 20.3
FLEXMLS