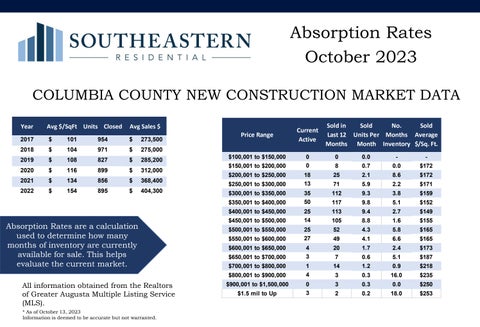
Absorption Rates October 2023 COLUMBIA COUNTY NEW CONSTRUCTION MARKET DATA Year
Avg $/SqFt Units Closed
Avg Sales $
2017
$
101
954
$
273,500
2018
$
104
971
$
275,000
2019
$
108
827
$
285,200
2020
$
116
899
$
312,000
2021
$
134
856
$
368,400
2022
$
154
895
$
404,300
Price Range $100,001 to $150,000 $150,001 to $200,000 $200,001 to $250,000 $250,001 to $300,000 $300,001 to $350,000 $350,001 to $400,000 $400,001 to $450,000
Absorption Rates are a calculation used to determine how many months of inventory are currently available for sale. This helps evaluate the current market.
$450,001 to $500,000 $500,001 to $550,000 $550,001 to $600,000 $600,001 to $650,000 $650,001 to $700,000 $700,001 to $800,000 $800,001 to $900,000
All information obtained from the Realtors of Greater Augusta Multiple Listing Service (MLS). * As of October 13, 2023 Information is deemed to be accurate but not warranted.
$900,001 to $1,500,000 $1.5 mil to Up
Current Active
Sold in Sold No. Sold Last 12 Units Per Months Average Months Month Inventory $/Sq. Ft.
0 0
0
0.0
-
-
8
0.7
0.0
$172
18 13
25
2.1
8.6
$172
71
5.9
2.2
$171
35 50
112
9.3
3.8
$159
117
9.8
5.1
$152
25 14
113
9.4
2.7
$149
105
8.8
1.6
$155
25 27
52
4.3
5.8
$165
49
4.1
6.6
$165
4 3
20
1.7
2.4
$173
7
0.6
5.1
$187
1 4
14
1.2
0.9
$218
3
0.3
16.0
$235
0 3
3
0.3
0.0
$250
2
0.2
18.0
$253