Richmond County SOLD Current Richmond County Market Stats ACTIVE LISTINGS 325 UNDER CONTRACT 320 SOLD LISTINGS FEB. 145 $211,384 AVG. SALE PRICE AVG. LIST PRICE $207,600 AVG. DAYS ON MARKET FOR CLOSED 86
Market Update (Richmond County)
FEBRUARY 2023 Recap
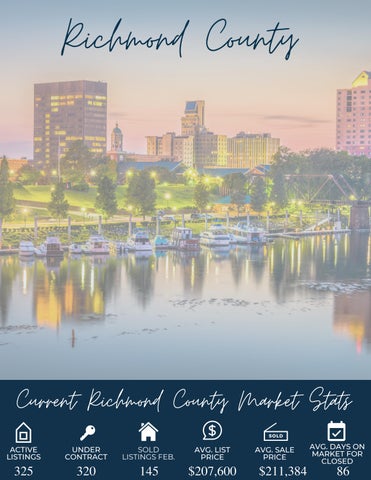
-Average Sales Price was up 4.8% vs. Feb . 22 to $211,384
- Avg. Days on Market for closed properties is 86 vs. 84 in Feb. 22, this is a 2.4% increase.
- Months Supply of Inventory was up 19.7% vs. Feb. 22 to 1.7 months
.
FLEXMLS
Market Update (Richmond County)
FEBRUARY 2023 Recap
Statistic 23-Feb 22-Feb % Chg 2023 YTD 2022 YTD % Chg Absorption Rate 1.7 1.4 19.7 1.8 1.4 25.4 Average List Price $268,124 $225,215 19.1 $233,860 $227,041 3.0 Median List Price $245,000 $220,000 11.4 $199,900 $196,000 2.0 Average Sale Price $211,384 $201,801 4.8 $211,228 $206,226 2.4 Median Sale Price $190,000 $179,900 5.6 $195,000 $180,000 8.3 Average CDOM 86.0 84.0 2.4 91.0 85.0 7.1 Median CDOM 59.0 54.0 9.3 64.0 58.0 10.3
FLEXMLS