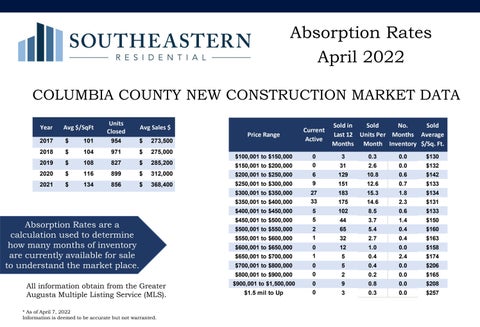
Absorption Rates April 2022 COLUMBIA COUNTY NEW CONSTRUCTION MARKET DATA Year
Avg $/SqFt
Units Closed
Avg Sales $
Price Range
2017
$
101
954
$
273,500
2018
$
104
971
$
275,000
2019
$
108
827
$
285,200
$150,001 to $200,000
2020
$
116
899
$
312,000
$200,001 to $250,000
2021
$
134
856
$
368,400
$250,001 to $300,000
$100,001 to $150,000
$300,001 to $350,000 $350,001 to $400,000 $400,001 to $450,000
Absorption Rates are a calculation used to determine how many months of inventory are currently available for sale to understand the market place.
$450,001 to $500,000 $500,001 to $550,000 $550,001 to $600,000 $600,001 to $650,000 $650,001 to $700,000 $700,001 to $800,000 $800,001 to $900,000
All information obtain from the Greater Augusta Multiple Listing Service (MLS). * As of April 7, 2022 Information is deemed to be accurate but not warranted.
$900,001 to $1,500,000 $1.5 mil to Up
Current Active 0 0
Sold in Sold No. Sold Last 12 Units Per Months Average Months Month Inventory $/Sq. Ft. 3
0.3
0.0
$130
31
2.6
0.0
$132
6 9
129
10.8
0.6
$142
151
12.6
0.7
$133
27 33
183
15.3
1.8
$134
175
14.6
2.3
$131
5 5
102
8.5
0.6
$133
44
3.7
1.4
$150
2 1
65
5.4
0.4
$160
32
2.7
0.4
$163
0 1
12
1.0
0.0
$158
5
0.4
2.4
$174
0 0
5
0.4
0.0
$206
2
0.2
0.0
$165
0 0
9
0.8
0.0
$208
3
0.3
0.0
$257