H1 2023: Business update and roadshow

Somerset Bridge Group – Monthly Performance Report – February 2023
Page 1
Session purpose
Establish a common understanding on where we are, and the levers we can pull to drive performance .
We’ll build on this in future sessions.
Somerset Bridge Group – Monthly Performance Report – February 2023
Page 2


Somerset Bridge Group – Monthly Performance Report – February 2023 Agenda Page 3 1. Our guiding principles 2. GWP drivers 3. Our challenges Converting GWP to profit Reducing loss ratio 4. Our multi-year journey to profitability 5. YTD performance & recent wins Q&A or slido.com #1544605
A reminder of our guiding principles
Somerset Bridge Group – Monthly Performance Report – February 2023
Page 4
Our guiding principles
Values – who we are
Fair & Transparent | Collaborative | Knowledgeable | Innovative | Efficient
Purpose – why we’re here
We strive to be an innovative, customer -focused insurance group; providing an excellent experience through collaboration and consistently delivering value
Vision – where we’re headed Strategy – how we’ll get there
Somerset Bridge trusted to be the provider of choice for all insurance needs, year after year.
Customer first | Sustainable growth | Pricing agility | Operational efficiency | Investing in digital
Somerset Bridge Group – Monthly Performance Report – February 2023
Page 5
Our guiding principles
Values – who we are
Fair & Transparent | Collaborative | Knowledgeable | Innovative | Efficient
Purpose – why we’re here
We strive to be an innovative, customer -focused insurance group; providing an excellent experience through collaboration and consistently delivering value
Vision – where we’re headed Strategy – how we’ll get there
Somerset Bridge trusted to be the provider of choice for all insurance needs, year after year.
Customer first | Sustainable growth | Pricing agility | Operational efficiency | Investing in digital
We’re further developing our multi-year strategy
Somerset Bridge Group – Monthly Performance Report – February 2023
Page 6
Our business: drivers of GWP
GWP = gross written premium
The total premiums we write for our customers
Somerset Bridge Group – Monthly Performance Report – February 2023
Page 7
Drivers of our business


We’re planning on growing GWP 27% in 2023, with growth across all channels.


Somerset Bridge Group – Monthly Performance Report – February 2023
Page 8 Internal £171m Internal £205m Internal £193m GWP Generation External £80m Specialty £40m £325m GWP £180m £25m Specialty 2023 Updated Plan 2023 Plan £280m GWP £35m £158m 2022 Actuals £255m GWP £32m £139m External £50m Specialty £37m External £61m Specialty £23m +10% +27%
Drivers of our business
We’re planning on growing GWP 27% in 2023, with growth across all channels.
Somerset Bridge Group – Monthly Performance Report – February 2023
Page 9 Internal £171m Internal £205m Internal £193m GWP Generation External £80m Specialty £40m £325m GWP £180m £25m Specialty 2023 Updated Plan 2023 Plan £280m GWP £35m £158m 2022 Actuals £255m GWP £32m £139m External £50m Specialty £37m External £61m Specialty £23m +10% +27%
GWP
profit
Challenge: converting our
to
Challenge: converting GWP into profit
Somerset Bridge Group – Monthly Performance Report – February 2023
Page 10
Income & Cost Levers
To generate profit, we can pull a number of levers across our i income and cost base.
Broking income
Income
Commission income
Claims income
Everyone can contribute towards this – w we all have a part to play in identifying and delivering improvements.
Costs
Acquisition costs
Overheads
= Profit
Somerset Bridge Group – Monthly Performance Report – February 2023
Page 11
Income & Cost Levers
Broking income (IPP) is generated when we make policy sales.
Broking income
Commission income
It’s about providing the best product and service for our customers needs, at the right price.
Claims income
Acquisition costs
If we do this, we’ll grow our customer base, and those customers will be more likely to renew, increasing our revenue.
Competitive pricing
New brands & products
Digital servicing

Customer satisfaction
Reduced cancellations
Higher renewals
Overheads
Increasing market presence
Somerset Bridge Group – Monthly Performance Report – February 2023
Page 12
Income & Cost Levers
We generate commission when we deliver the right l loss ratio for our capacity providers. It’s about being innovative and using data to charge the right premium b based on a customers unique risk… …and providing an efficient claims service that p pays out fast to our customers where they ’ re entitled.
Broking income
Commission income
Claims income
Acquisition costs
Strong pricing models
Great external partners
Better data & analytics
Risk management
Fraud checks
Low claims leakage
Overheads
Efficient claims
Somerset Bridge Group – Monthly Performance Report – February 2023
Page 13
Income & Cost Levers
We generate claims income through referral income, and providing our claims services to 3rd parties.
Broking income
Commission income
Claims income
Efficient processes
Low leakage
It’s about identifying and acting upon n new income opportunities and partnerships, and making the most of existing ones.
Acquisition costs
Overheads
Improved tech
New income opportunities
Onboarding the right partners
Somerset Bridge Group – Monthly Performance Report – February 2023
Page 14
Income & Cost Levers
When we make sales, we pay 3rd parties for introducing us the sale. These 3rd parties are our aggregator partners for our Internal business, and b brokers or distribution partners in our External & Specialty business.
Broking income
Commission income
Strong negotiation of commercial deals
Claims income
Acquisition costs
Higher renewal rates
More customers going direct
Demanding more from our partners and keeping these costs down enables us to k keep more of our income.
Overheads
Getting more for our money
Somerset Bridge Group – Monthly Performance Report – February 2023
Page 15
Income & Cost Levers
Our overhead base covers the remainder of our costs. This includes marketing, offices, travel, IT, and salaries.
Broking income
Commission income
Targeted investment
Claims income
Using technology to enhance efficiency
Doing more with our cost base will help to improve our profitability.
Acquisition costs
Challenging costs
More for our money from suppliers
Overheads
This means being targeted in our investment, s saying yes to the 20% of actions that drive 80% of results.
Somerset Bridge Group – Monthly Performance Report – February 2023
Page 16
Income & Cost Levers
Our overhead base covers the remainder of our costs. This includes marketing, offices, travel, IT, and salaries.
Broking income
Commission income
Targeted investment
Claims income
Using technology to enhance efficiency
Doing more with our cost base will help to improve our profitability.
Acquisition costs
Challenging costs
More for our money from suppliers
Overheads
This means being targeted in our investment, s saying yes to the 20% of actions that drive 80% of results.
We invested heavily in our people in 2022, alongside improving our benefits package. We won’t be changing that focus in 2023 where we identify areas in need of investment.
Somerset Bridge Group – Monthly Performance Report – February 2023
Page 17
Challenge: reducing loss ratio
Somerset Bridge Group – Monthly Performance Report – February 2023
Page 18
Underwriting Profitability
A reminder:
When claims costs and our cost base exceed our premiums, we make a loss.
Our focus and challenge:
Optimising our pricing so that we c charge the right price to the right customer, and keeping our expense base efficient so that we write insurance premiums profitably. .
Somerset Bridge Group – Monthly Performance Report – February 2023
Page 19
From… £1,000 premium Loss ratio Expense ratio £1,000 Loss Claims costs Operating costs
Underwriting Profitability
Improve through
Improving L Loss ratio though more agile pricing, best in class claims handling, and increased retention for better drivers.
Operating costs
and…
Controlling our c cost base - ensuring it’s the right size for our business, using tech to improve efficiency, and outsourcing where necessary.
Claims costs
Controlling our acquisition costs and increasing persistency.
Use of tech to streamline operations.
Improved pricing models and enrichments.
Leveraging data from our external partners.
Better segmentation –matching rate to risk.
Use of data and analytics.
Efficient claims processes and fraud prevention.
Somerset Bridge Group – Monthly Performance Report – February 2023
Page 20 £1,000 premium Loss ratio Expense ratio
Underwriting Profitability
Results in the right premium for the right customer. With premium based on the u unique risk factors of our individual customers.
Enhanced efficiency across claims and our cost base. Leading us to p profitability at an underwriting level, increasing our commission income.
Somerset Bridge Group – Monthly Performance Report – February 2023
Page 21 £1,000 premium …to £1,000 premium Loss ratio Expense ratio £1,000 Loss Profit Claims costs Claims costs Operating costs Operating costs
Somerset Bridge Group – Monthly Performance Report – February 2023
Page 22
Where we are: a multi-year strategy to return to profitability
Where we’ve been…
Losses driven by suboptimal underwriting result, reduced GWP, and a fixed cost base.
Somerset Bridge Group – Monthly Performance Report – February 2023
Page 23 £0 -£5m -£10m -£15m -£20m £5m £10m £15m Profit Loss 2021
-£25m
Where we’ve been…
We took steps to s stabilise the business, improving LR by focusing on better performing sectors of the market. Cost efficiencies also helped to improve profitability.
Somerset Bridge Group – Monthly Performance Report – February 2023
Page 24 £0 -£5m -£10m -£15m -£20m £5m £10m £15m Profit Loss 2021
-£25m 2022
Where we are…
A story of c continued discipline across the business. We’ve identified areas of sustainable growth across our divisions and continue to focus on writing profitable business - building a new b baseline for the business.
Q1 2023 Results
$4.7bn GWP
$705m Net Income

$28.6bn Market Cap
Somerset Bridge Group – Monthly Performance Report – February 2023
Page 25 £0 -£5m -£10m -£15m -£20m £5m £10m £15m Profit Loss 2021
-£25m 2022 2023 Budget
Where we’re going…
We expect to return to profitability in 2024, leveraging the investments we’ve made in 2023 to build a s sustainable and p profitable business providing great products to our customers.
Multi year strategic planning process for 2024 onwards has been initiated.
This will help us define our future roadmap and focus areas.
Somerset Bridge Group – Monthly Performance Report – February 2023
Page 26 £0 -£5m -£10m -£15m -£20m £5m £10m £15m Profit Loss 2021
-£25m 2022 2023 Budget 2024 Target
Where we’re going…
Continued focus and investment across our tech and core capabilities, combined with agility in providing new products for our customers – becoming a m market leading insurer.
Somerset Bridge Group – Monthly Performance Report – February 2023
Page 27 £0 -£5m -£10m -£15m -£20m £5m £10m £15m Profit Loss 2021
-£25m 2022 2023 Budget 2024 Target 2025 and beyond
Where we are: year to date performance
Somerset Bridge Group – Monthly Performance Report – February 2023
Page 28
December 2022 update: a recap
Key messages from our
last update.
Trading in a difficult market – resulting in declining volumes
Reduced margin in broker, driving lower profitability
Investing in the business to counter this, and developing new pricing models
Arch has, and will continue to, invest and support the business and it’s people
We expect to see improvement in 2023, but trading conditions will remain challenging
Somerset Bridge Group – Monthly Performance Report – February 2023
Page 29
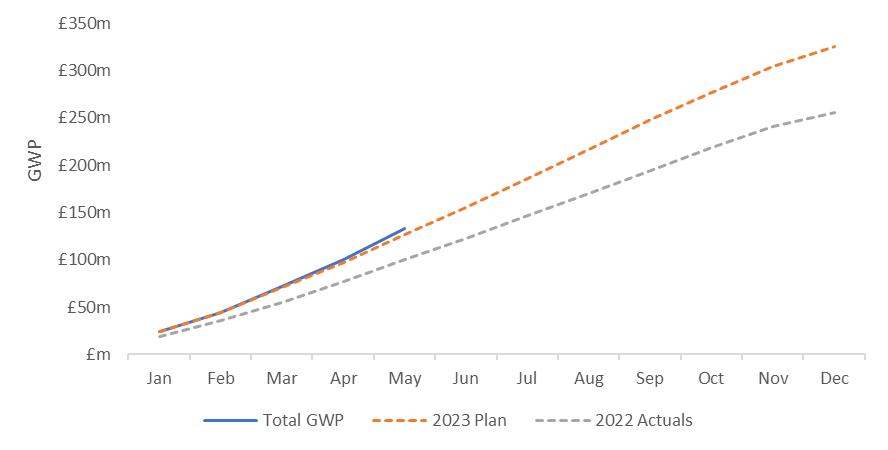
YTD performance: our trajectory
We face challenges in the market as a result of i inflation, but have positioned ourselves for growth and are confident in our trajectory in 2023.
GWP Profitability
On track to hit £325m 2023 GWP (27% YoY growth)
YTD GWP of £134m vs £126m Plan
YTD Loss £1.4m vs. £2.7m Plan
We’ve taken steps to increase our margins, a adding rate to broker fee and t targeting higher margin business to optimise broker income. .
Somerset Bridge Group – Monthly Performance Report – February 2023
Page 30
£255m £325m
YTD performance: metrics that matter
Somerset Bridge Group – Monthly Performance Report – February 2023
Page 31 Claims Leakage 1% vs. 2.6% average Rate increases 20.1% vs. 17% market
out only what we should
ourselves from rising costs Total GWP £134m vs. £126m Plan Scaling our business in targeted segments Total income £29.7m 36% YoY growth
levers to increase our income 20% Internal 52% External 92% Specialty Y o Y G r o w t h 12.6ppts insurer rate 7.5ppts broker fee
Paying
Protecting
Pulling
Where we are: recent wins across the business
Somerset Bridge Group – Monthly Performance Report – February 2023
Page 32
YTD performance: recent wins
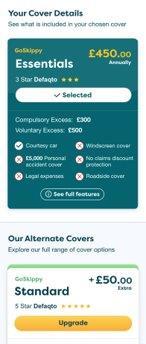
Launch of Tiered products on GoSkippy
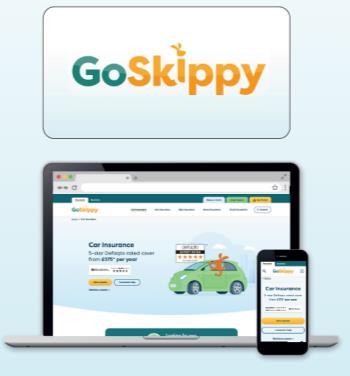

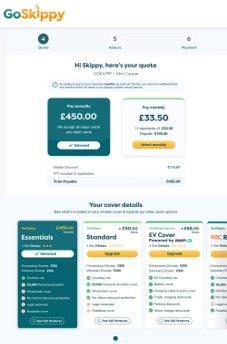
GoSkippy rebrand
Incremental sales increase of 10%
Live on 6 aggregators in 90 days
Overall Traffic: up 22%
Bounce Rate: remains well below industry average
Pages per Session: up 6%
Great example of collaboration across the business!
Somerset Bridge Group – Monthly Performance Report – February 2023
Page 33
From To
YTD performance: recent wins


Somerset Bridge Group – Monthly Performance Report – February 2023
Page 34 Data / Analytics External Launched in Q1 Coming in Q2
YTD performance: recent wins
Specialty
Claims


Leakage audit completed. Best in class result at 1%.
Mild winter = fewer claims in Q1. Still handled 30,000
Cost of living crisis driving fraud. £900k of savings identified from recent bent metal initiative.


Somerset Bridge Group – Monthly Performance Report – February 2023
Page 35
YTD performance: recent wins
People
Bristol office move
Simplified org structure and communication channels

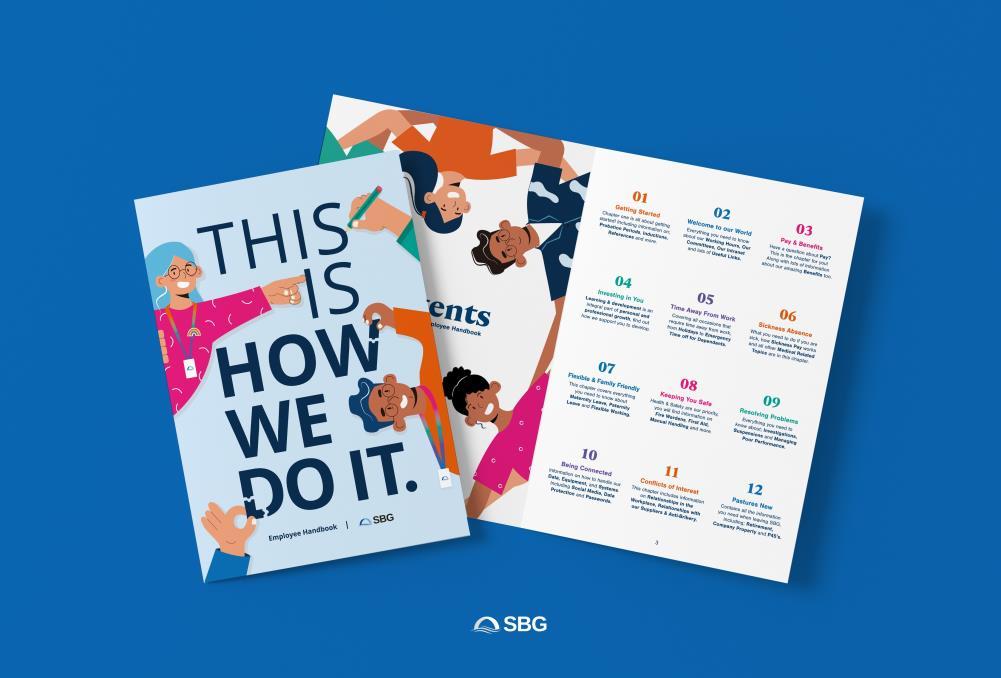
Employee handbook
Engagement survey
Somerset Bridge Group – Monthly Performance Report – February 2023
Page 36
YTD performance: what it means for you
Our mission in 2023:
Pulling the right levers to deliver; an improved LR, GWP growth in the right segments, and converting that growth into profit – establishing a new baseline.
Somerset Bridge Group – Monthly Performance Report – February 2023
Page 37
YTD performance: what it means for you
Our mission in 2023:
Pulling the right levers to deliver; an improved LR, GWP growth in the right segments, and converting that growth into profit – establishing a new baseline.
Key takeaways:
The market remains challenging, particularly with inflation – this affects our competitors too.
We’re growing the business in a targeted way in 2023.
There are levers we can pull across the business to improve our performance, but fundamentally it’s about providing the right product for our customers, at the right loss ratio.
Everything we’ll do this year will be targeted in that direction.
Somerset Bridge Group – Monthly Performance Report – February 2023
Page 38
YTD performance: what it means for you
Our mission in 2023:
Pulling the right levers to deliver; an improved LR, GWP growth in the right segments, and converting that growth into profit – establishing a new baseline.
Key takeaways:
The market remains challenging, particularly with inflation – this affects our competitors too.
We’re growing the business in a targeted way in 2023.
There are levers we can pull across the business to improve our performance, but fundamentally it’s about providing the right product for our customers, at the right loss ratio.
Everything we’ll do this year will be targeted in that direction.
We’re on this journey together, and all need to pull in the same direction.
Somerset Bridge Group – Monthly Performance Report – February 2023
Page 39
The Slido link will close on 23 June.
For any questions after this date please contact Josh Wilson-Brown on Teams, or email ExCo@sbgl.co.uk
#1544605
Somerset Bridge Group – Monthly Performance Report – February 2023
Page 40
slido.com
Q&A
or