23 MIDYEA R SUMMIT COUNTY
REA L ESTATE MA RKET


Our teamof market expertsupdatesThe Slifer Report biannually.To seethelatest numbersand diveevendeeper into the report scanthecodeor visit: SummitCountyRealEstate.com/ /Resources/The-Slifer-Report
SOURCE Soldresidential andlandpropertieswithinSummit Countyfrom January1,2023- June30,2023 Sourceof all datainthisreport is theSummit Associationof RealtorsMultipleListingService Informationdeemedreliablebut not guaranteed Consult your Slifer Smith&FramptonBroker for moreinformation


We?re off to an exciting start in 2023 here in the Colorado high country, as our real estate markets continue to strengthen despite shifting national fundamentals At Slifer Smith & Frampton, we welcome this rebalancing of our market aswestrivetowardsanewand healthier normal

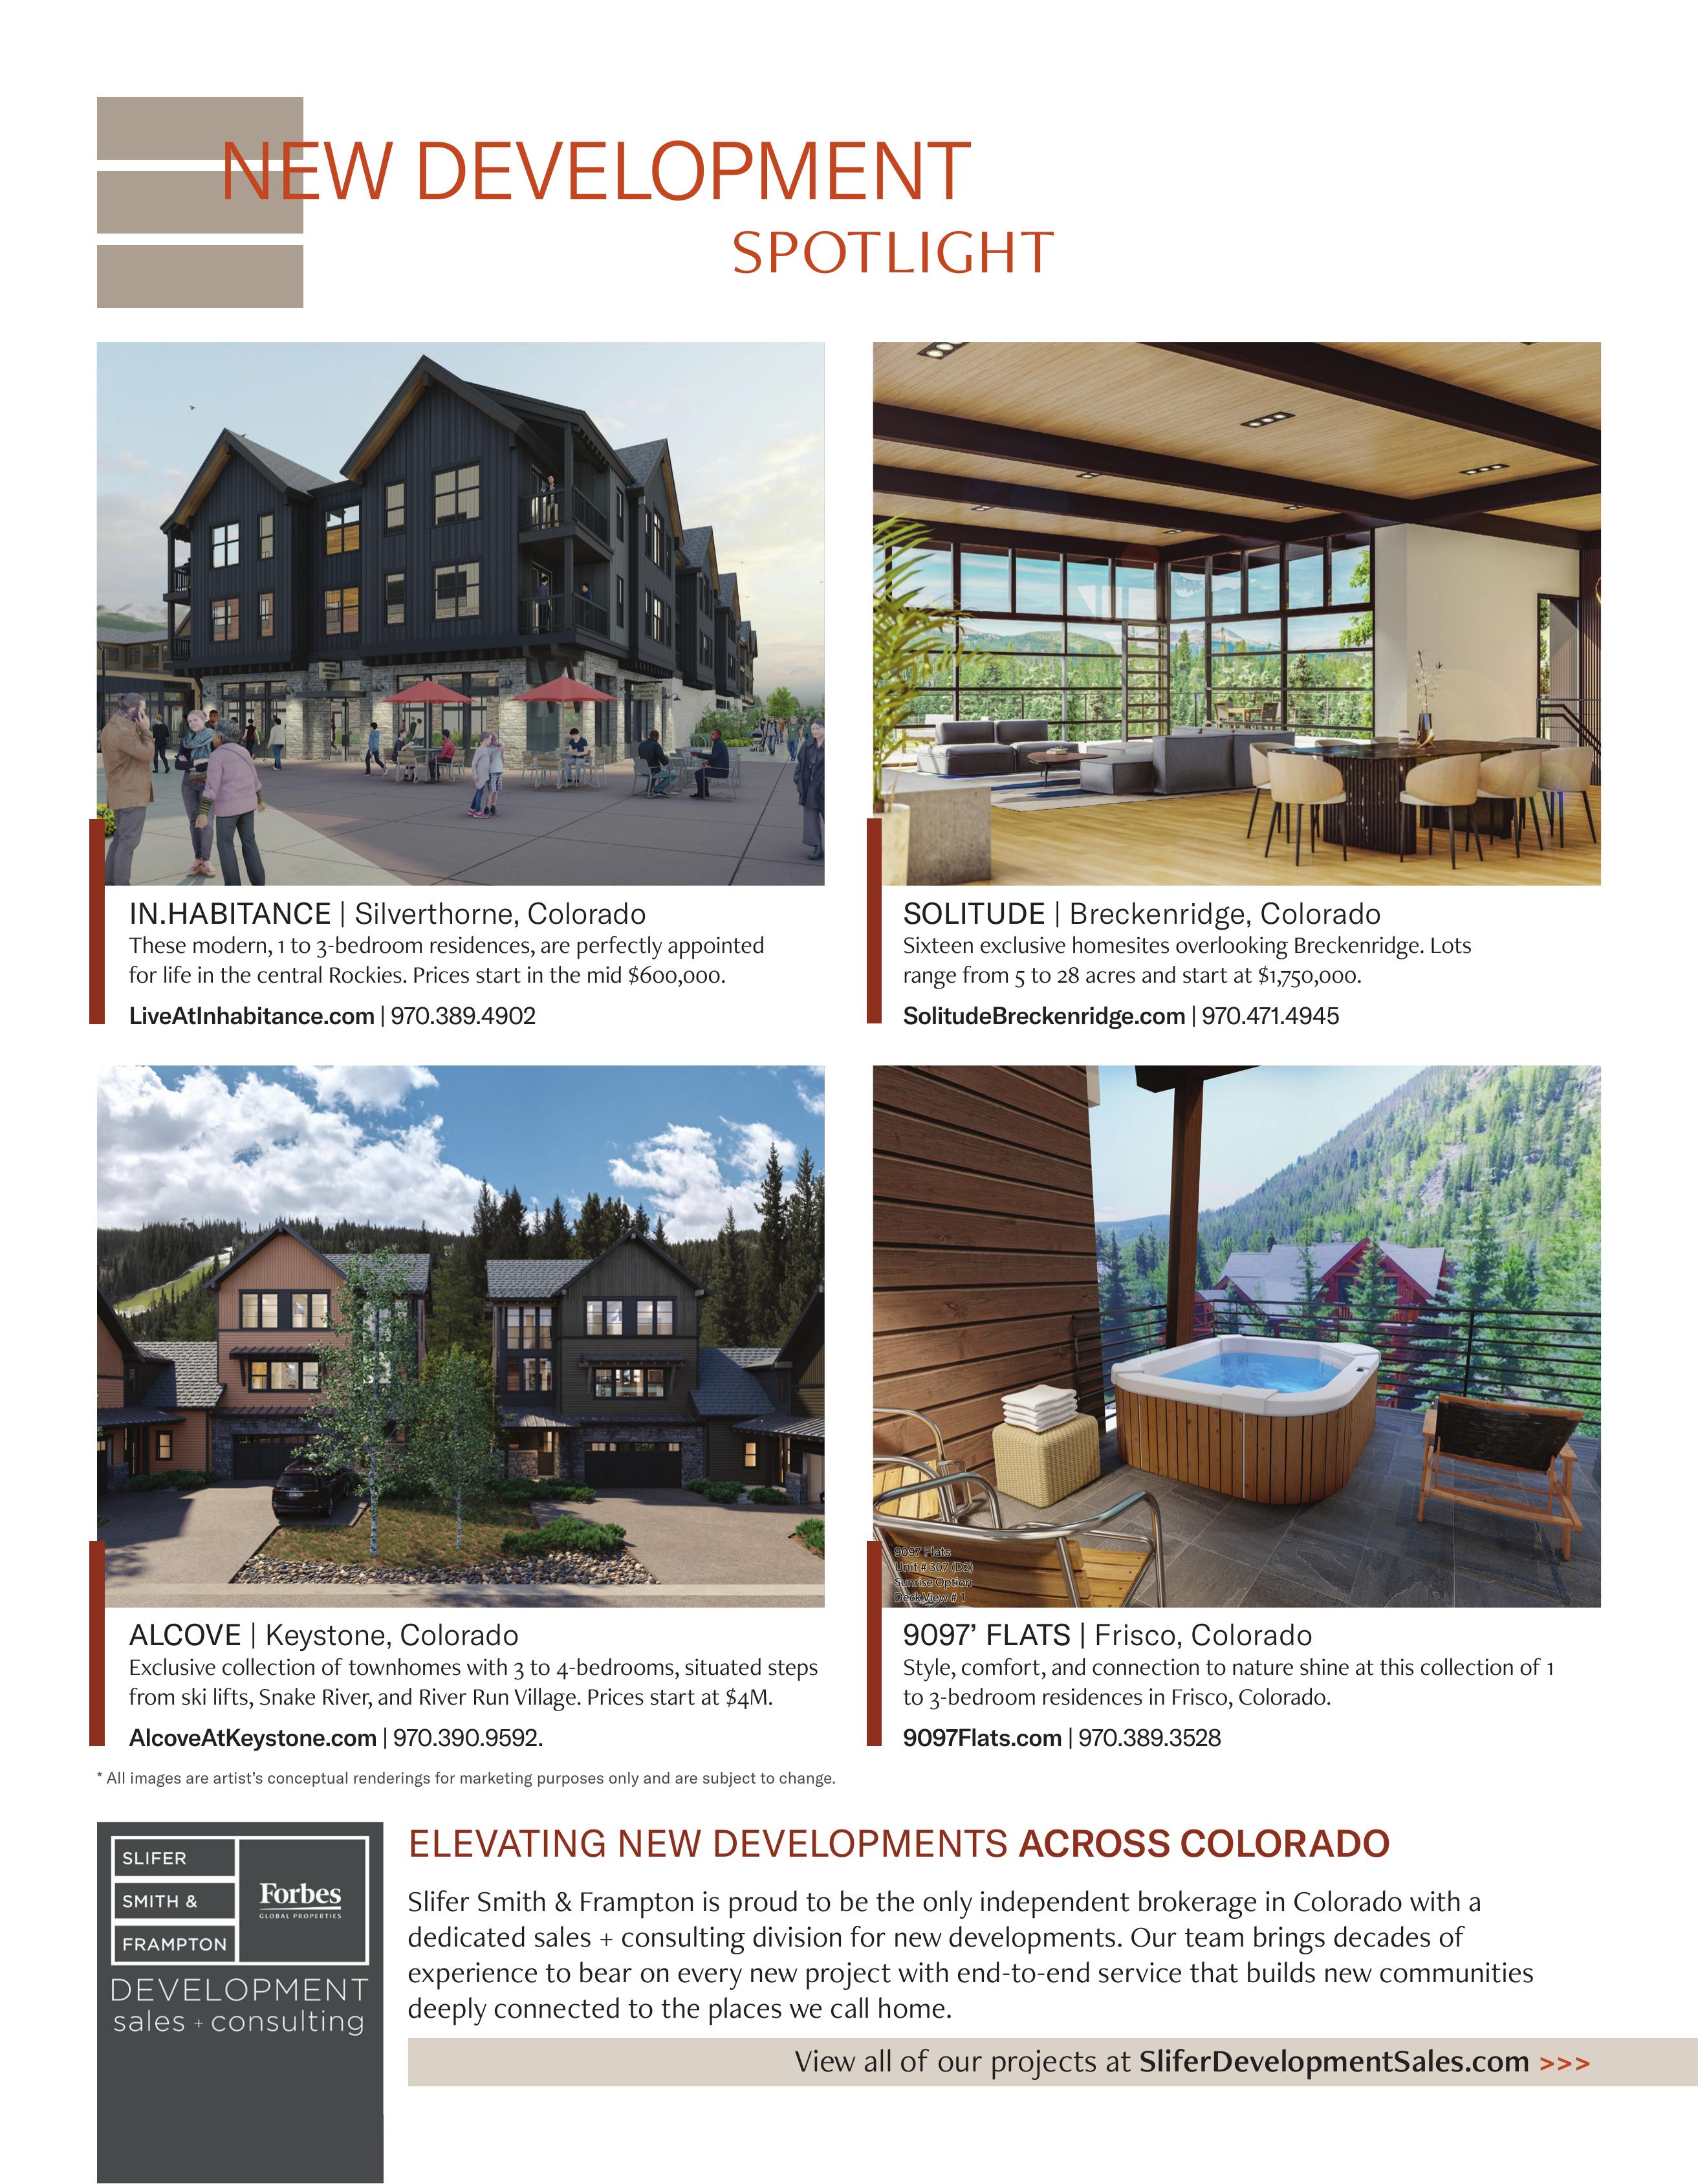
The key to this rebalancing has been a rise in inventory, which has increased by a modest 7%compared to this time last year. Although the gain is small, it is encouraging for buyerswho are looking to find their homes here in Summit County.It'sgreat to seeinventory moving in apositivedirection asour communitiescontinueto seek growth.Weare proud to contribute to this progress through our new development division, which is working on several exciting opportunities in Summit County, including 9097?Flats in Frisco, inhabitance in Silverthorne, and Solitude in Breckenridge Theseopportunitiesnot onlydirectly increaseinventorybut also indirectlycontributeto itsgrowth We arecommittedto continuingthisprogressfor yearsto come
On the other hand, prices remain strong across the county Contrary to some previous ominous predictions, prices have only decreased by 8%year-to-date asof the end of June, compared to the booming highsof 2022. Additionally, our sale-to-list price ratio has normalized from 102%to a still incredibly strong 98%compared to this time last year These conditions are favorable for those considering selling their homes in our communities. Meanwhile, pending sales are increasing throughout Summit County, indicating that buyers are still eager to invest in the Summit County lifestyle,despitehigher pricesand sale-to-list ratiosnearing100%.
Looking ahead to the second half of 2023, market experts, including myself, anticipate that prices will continue to stabilize in Summit County and across the nation Trends suggest that we may see a slight decline in average sales pricesin early 2024 before they begin to grow annually through 2027 Limited inventory and astrong demand for the mountainlifestyleinour communitieswill keep our marketsrobust,despiteprevailingnational challenges
At Slifer Smith & Frampton, we take pride in leading the way in Summit Country real estate, holding the number one position in brokeragesalesoverall and in theluxury market.You mayhaveheard about our recent growth,including a significant expansion last year into the Front Range market, which has helped connect our city and mountain communities like never before The strength of our network across Colorado, combined with our commitment to locally-run, locally-focused real estate, has enabled us to maintain our coveted position as the number one independent real estatecompanyinColorado
I encourage you to explore this midyear edition of The Slifer Report and to delve into the details of your specific market area If you have any questions about the data presented hereor howit relatesto your real estategoals,pleasedon't hesitateto reach out to your Slifer Smith & Frampton broker. We are here to assist you every step of theway.

WE ARE SLIFER SMITH & FRAMPTON
270+ world-class agents across Colorado
120+ dedicated & local support staff
$10B+ sales volume since 2020
#1
Colorado's leading, independent real estate company
100% Colorado owned & operated
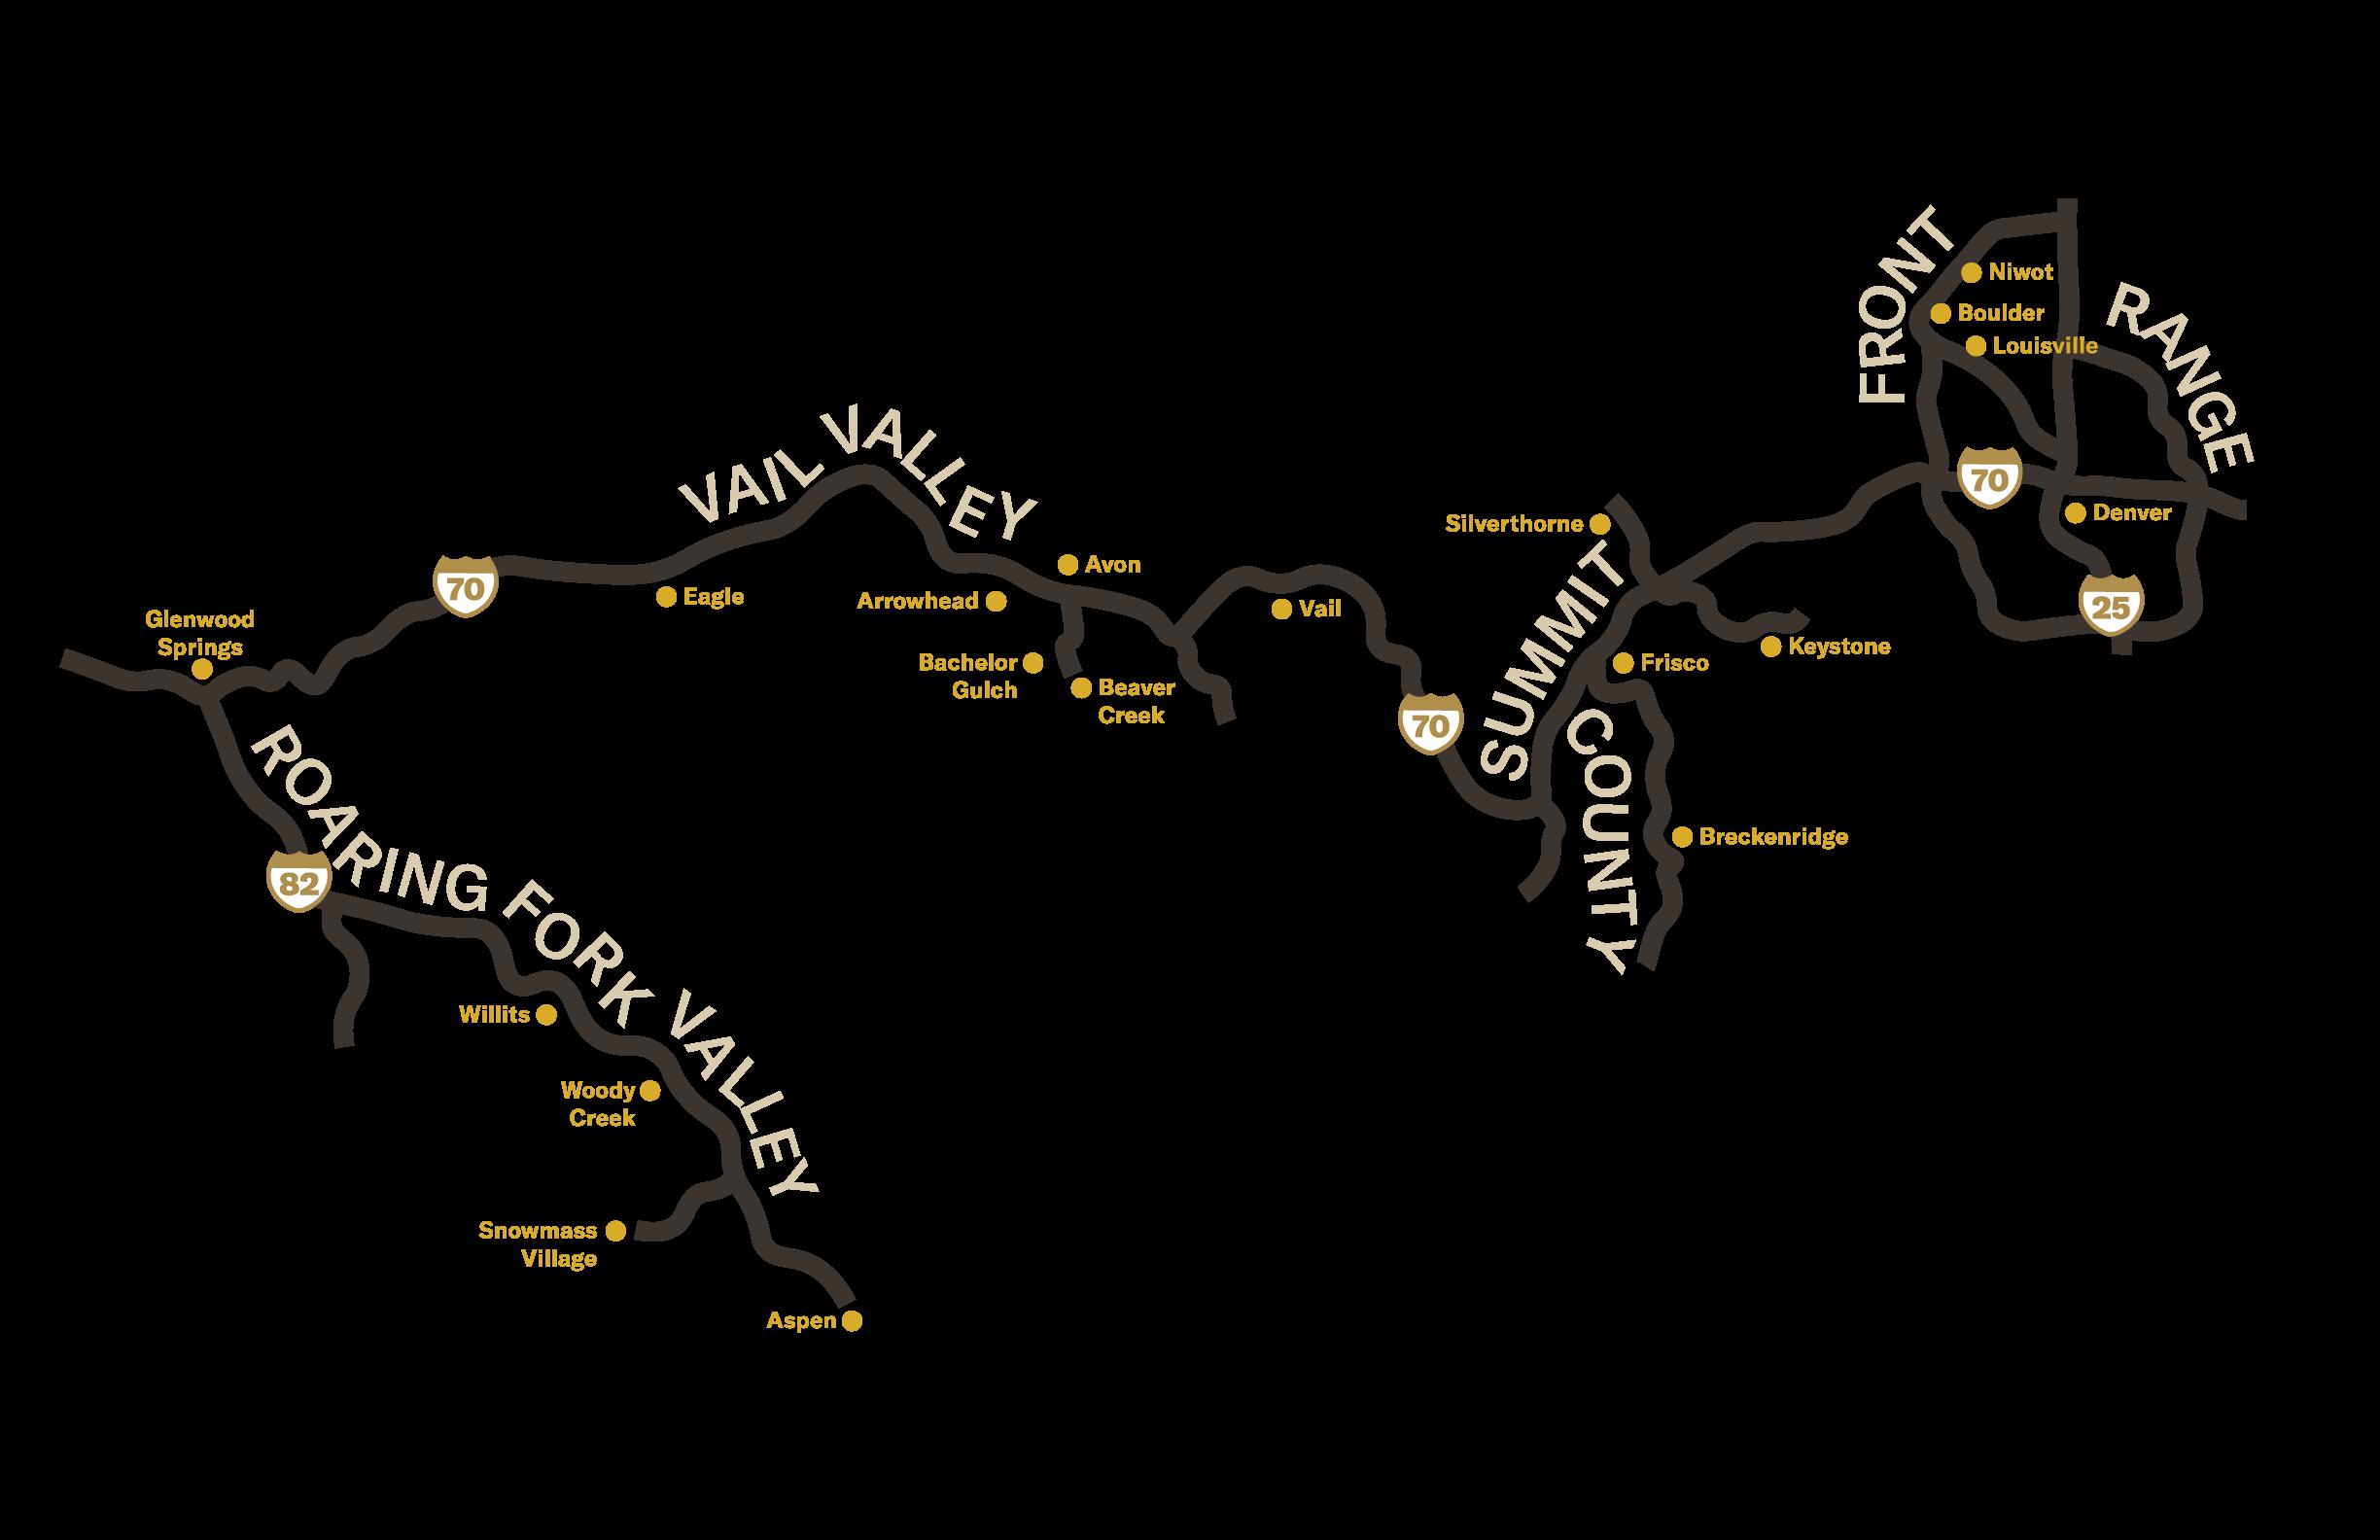
 Roaring Fork Valley 6 LOCATIONS
Vail Valley 12 LOCATIONS
Summit County 5 LOCATIONS
Front Range 5 LOCATIONS
Roaring Fork Valley 6 LOCATIONS
Vail Valley 12 LOCATIONS
Summit County 5 LOCATIONS
Front Range 5 LOCATIONS
Residential Sales Over $2 Million
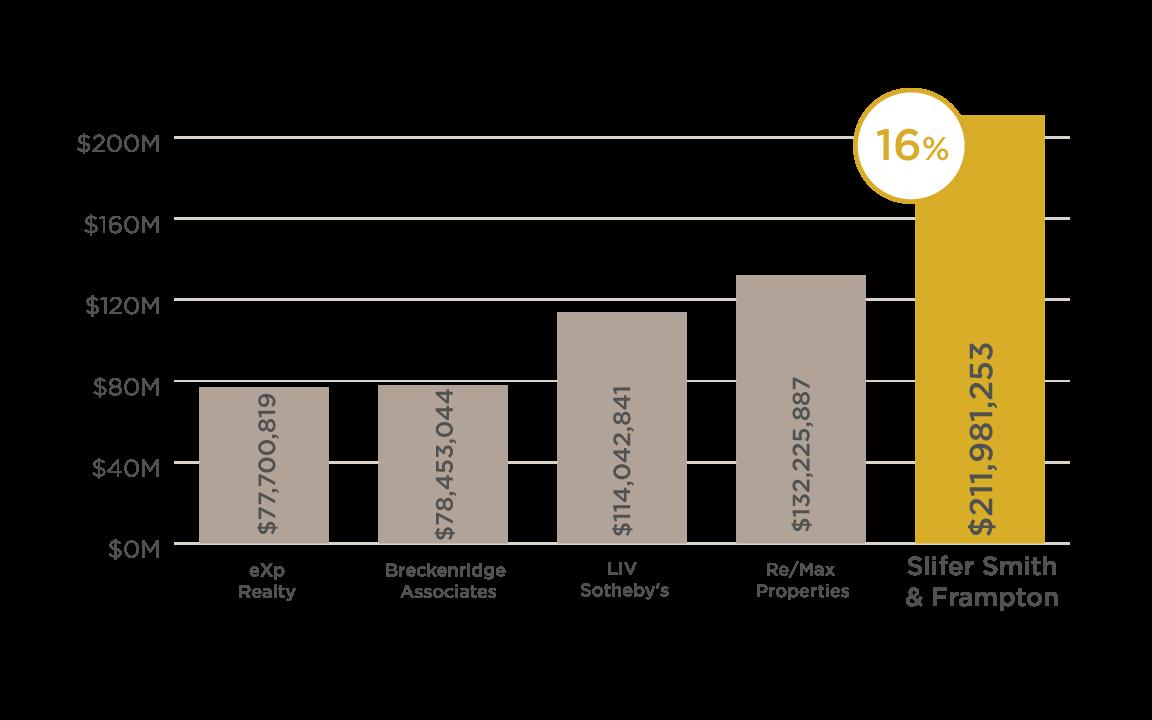
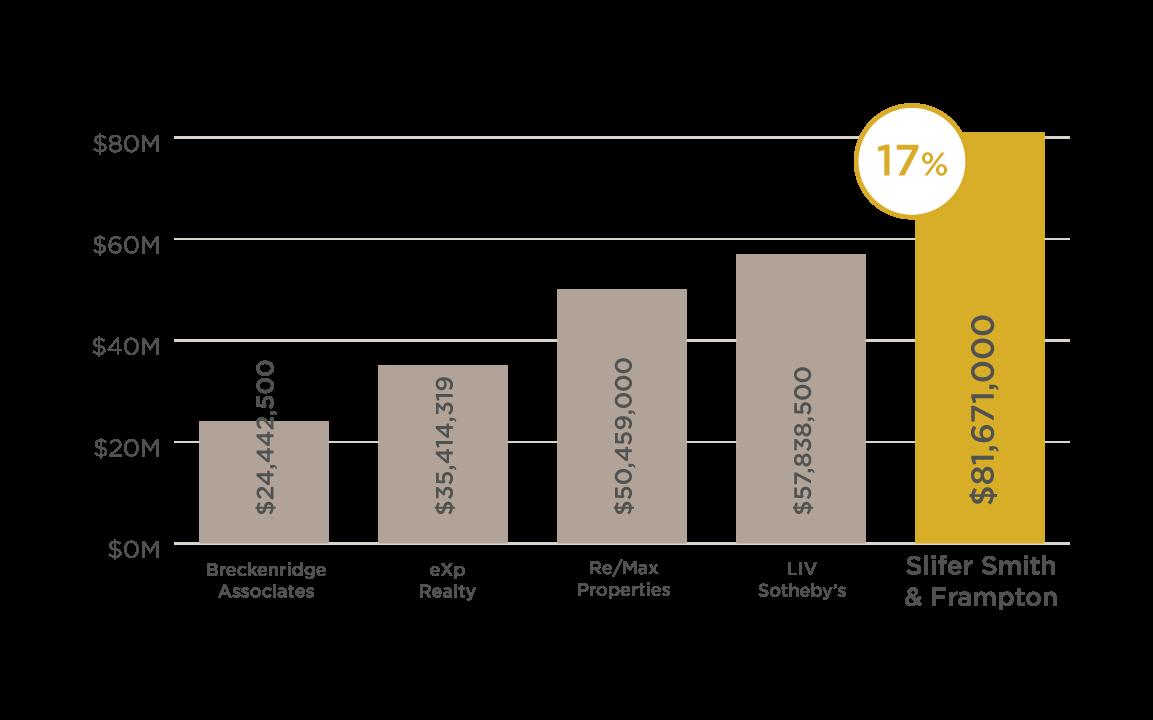
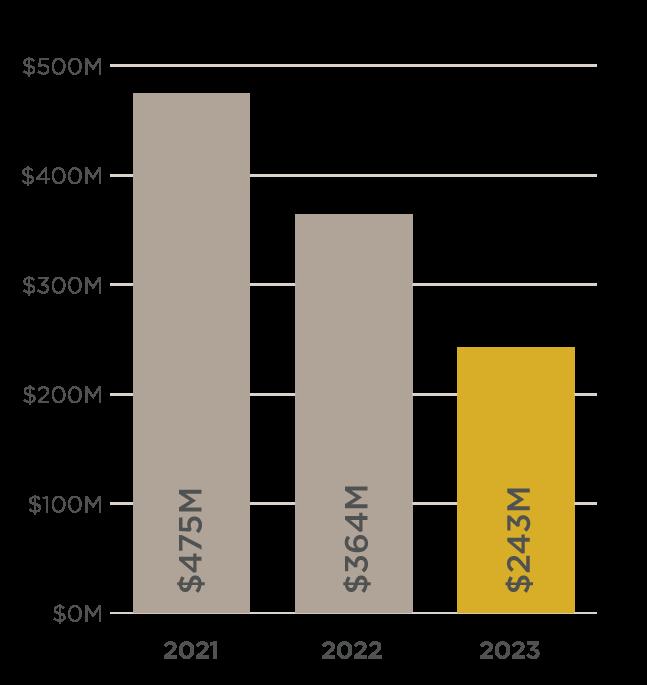
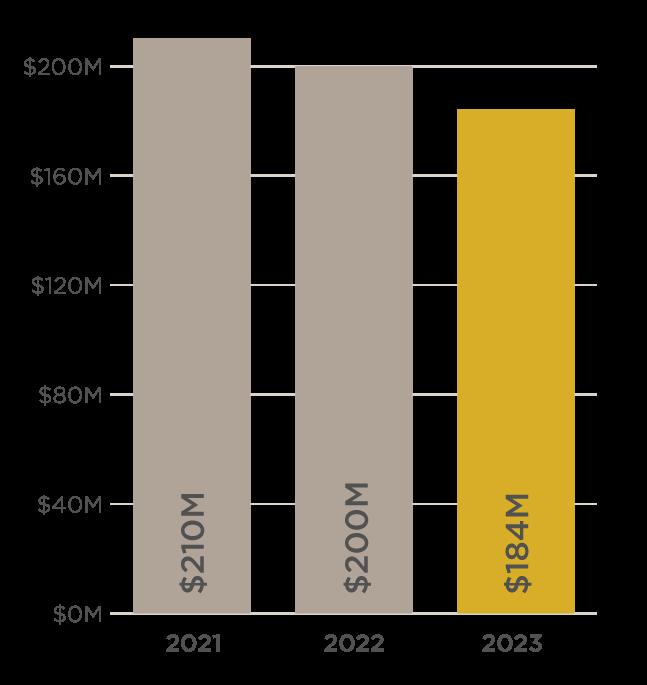
LUXURY SALES VOLUME COMPARISON

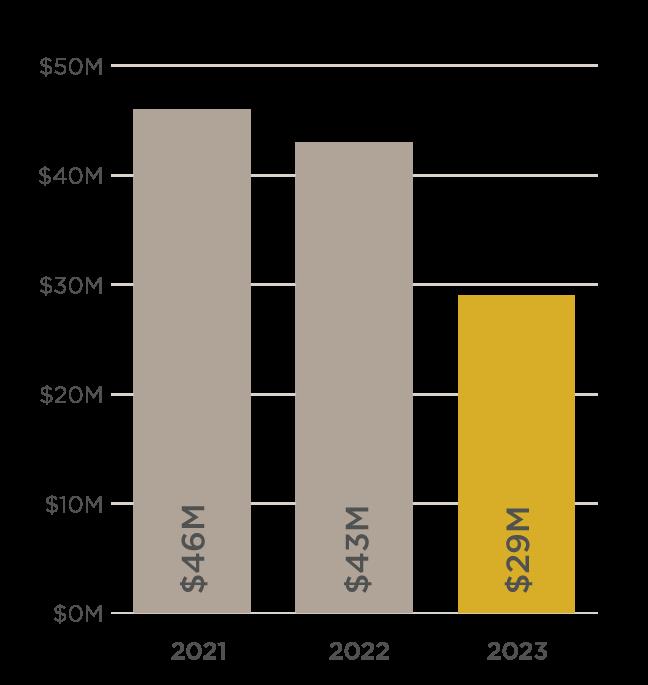
LUXURY SALES VOLUME COMPARISON | SSF MARKET SHARE
RESIDENTIAL & LAND ACTIVE INVENTORY BY MONTH

RESIDENTIAL TRANSACTION COMPARISON
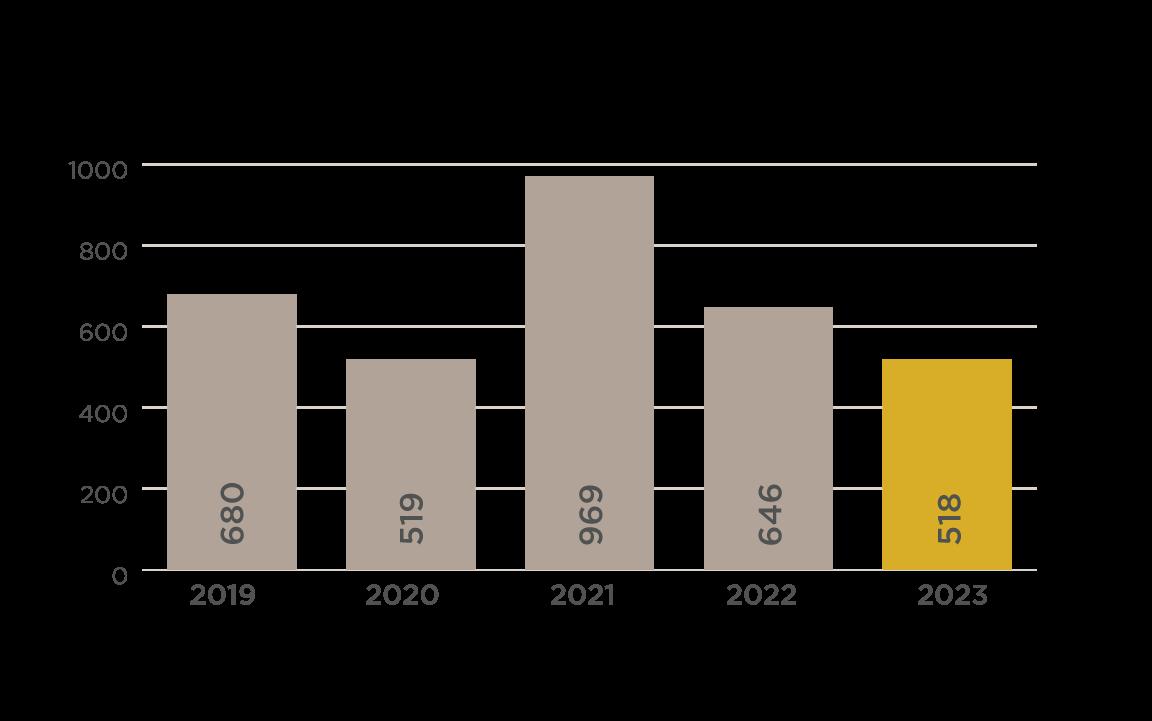
LUXURY TRANSACTION COMPARISON
Residential Sales Over $2 Million
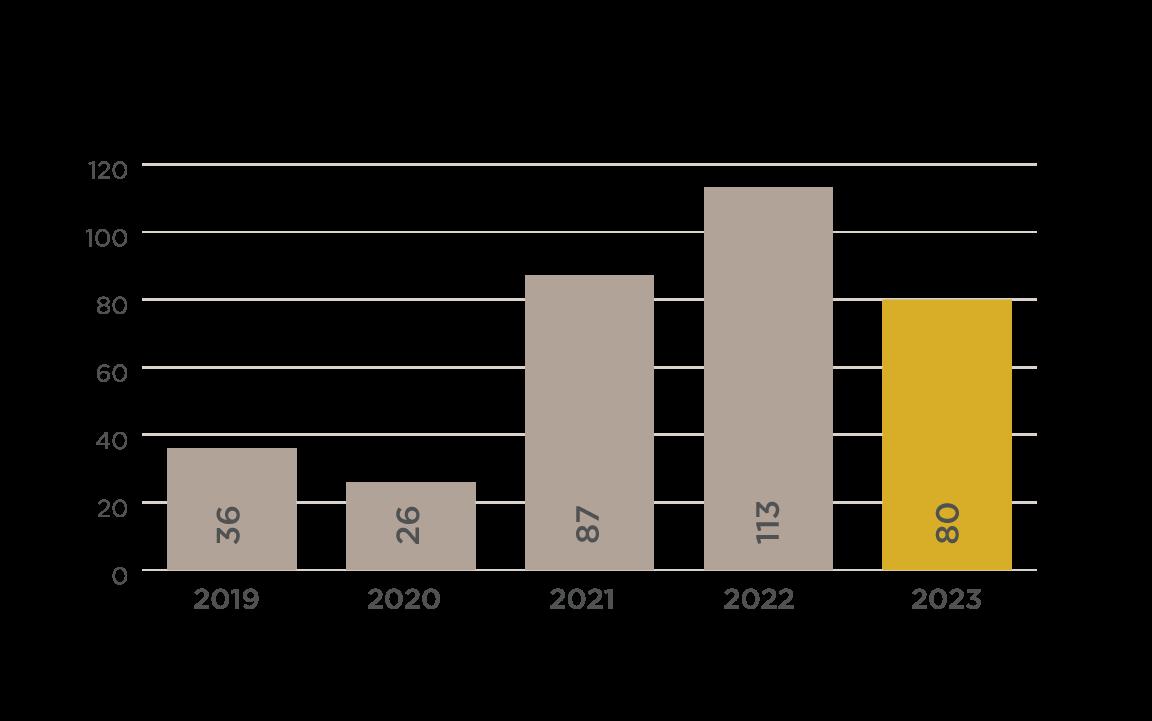
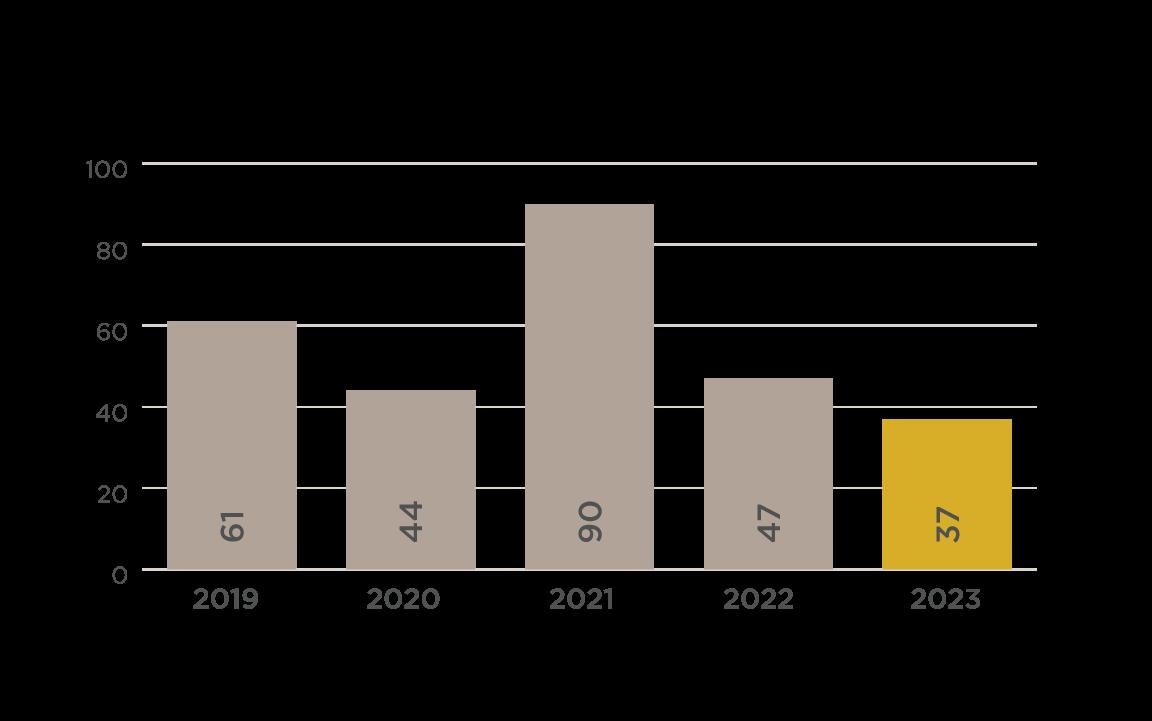
LAND TRANSACTION COMPARISON
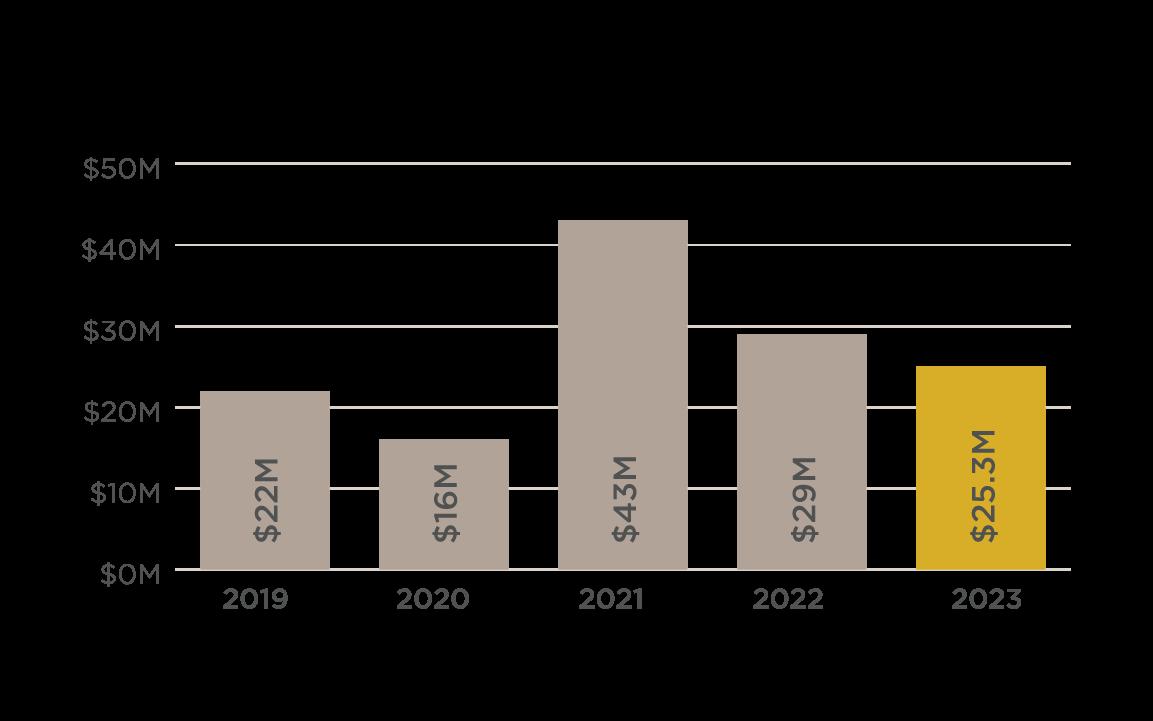
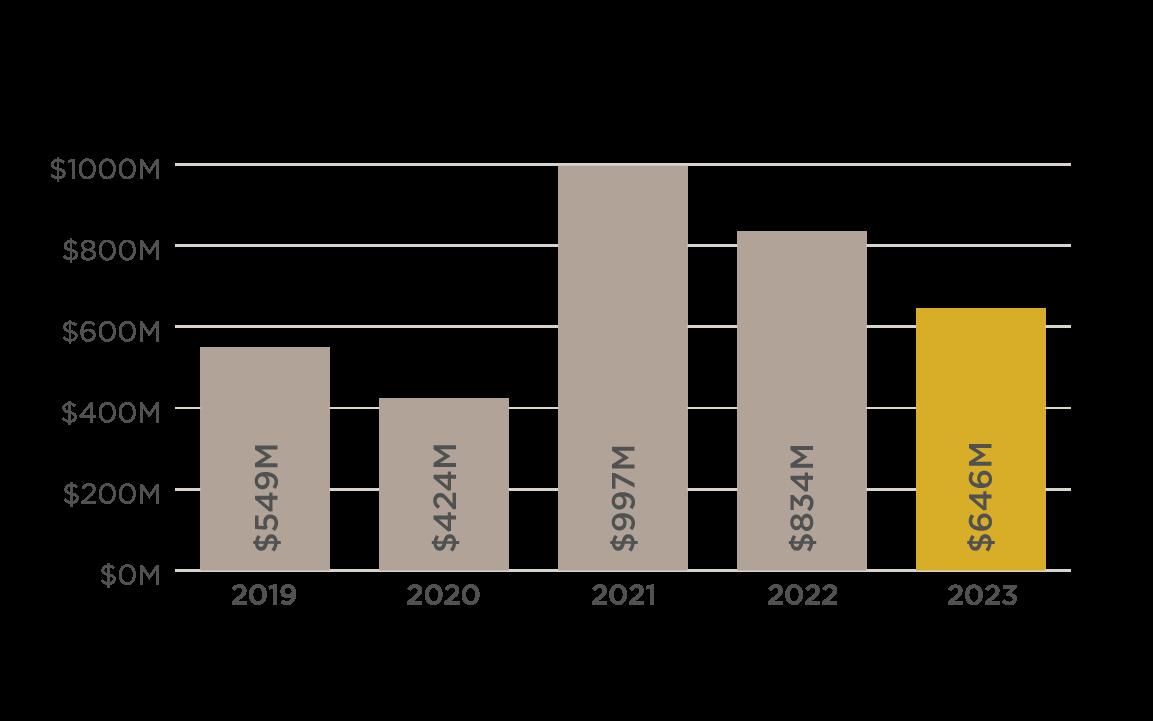
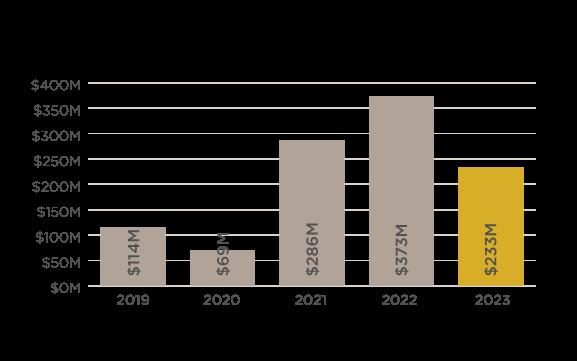
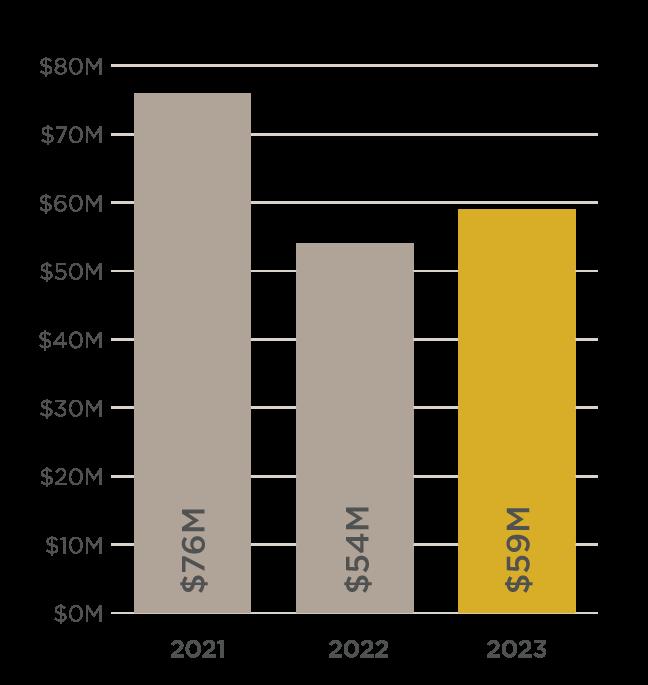
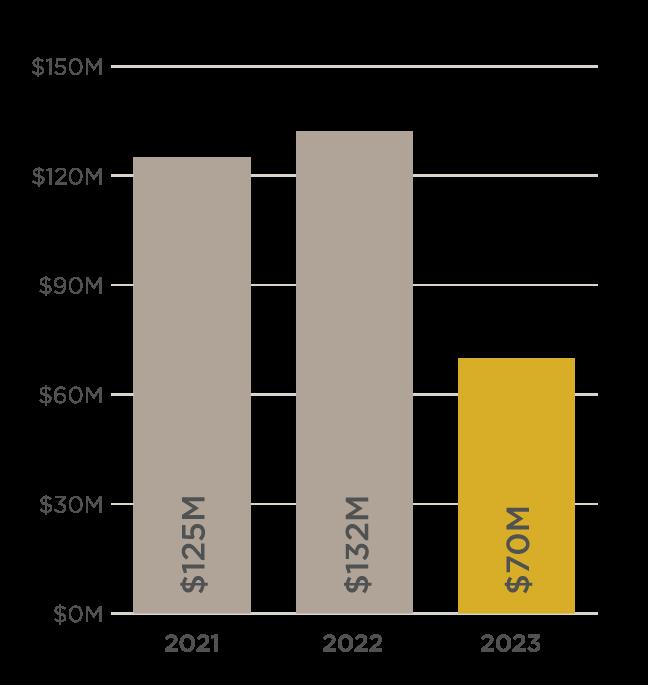
LAND SALES VOLUME COMPARISON
As a founding member Slifer Smith & Frampton is proud to fly the Forbes Global Properties flag across Colorado This powerful, global network of top-tier independent brokerages gives our agents, and our clients, exclusive access to an invaluable network of the world's finest homes and the agents representing them.
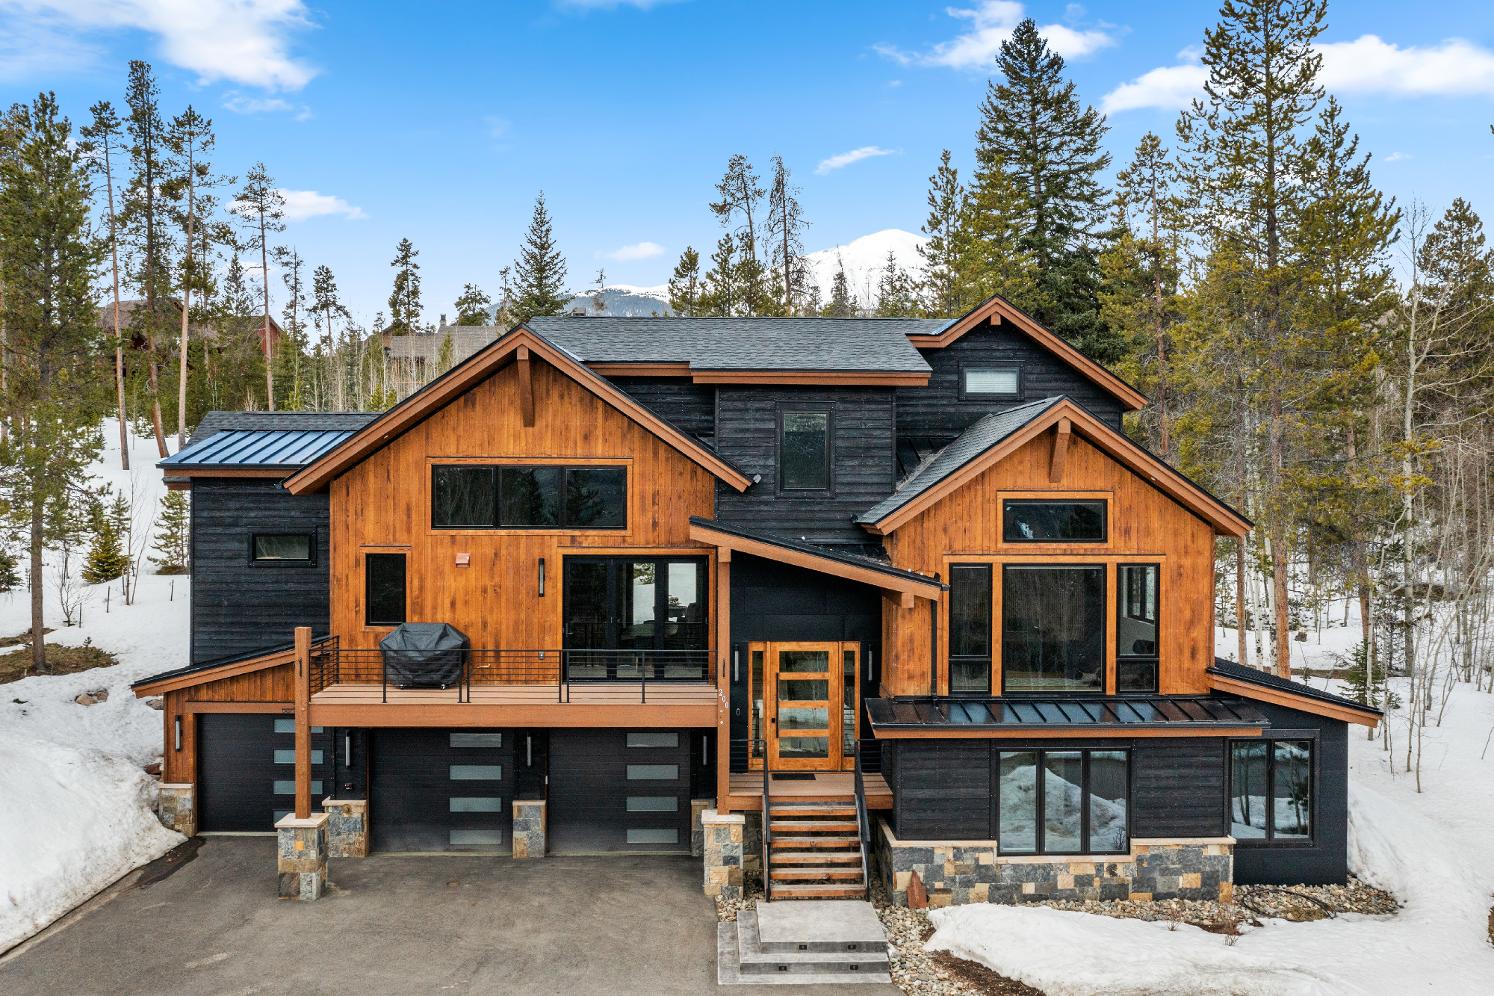
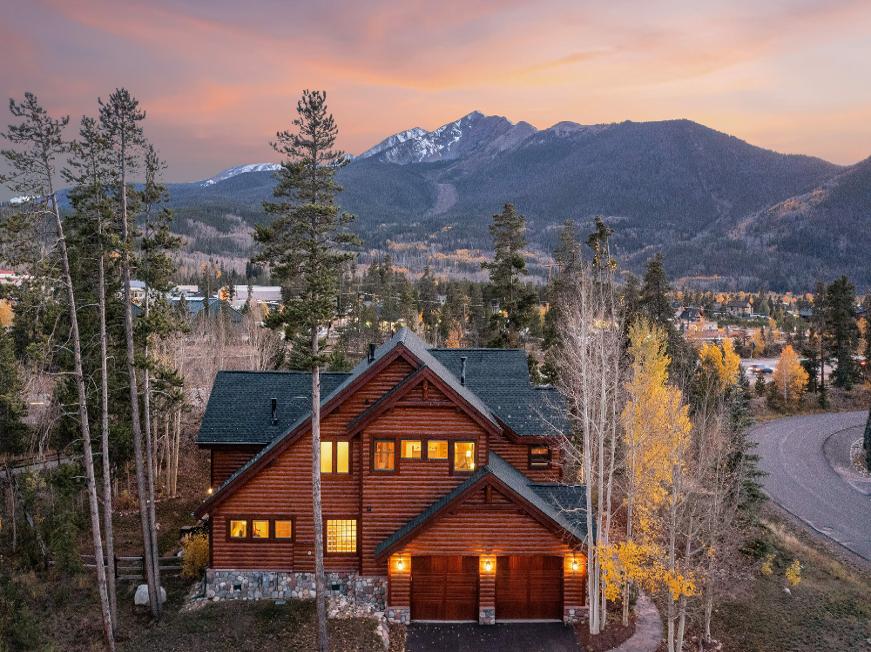
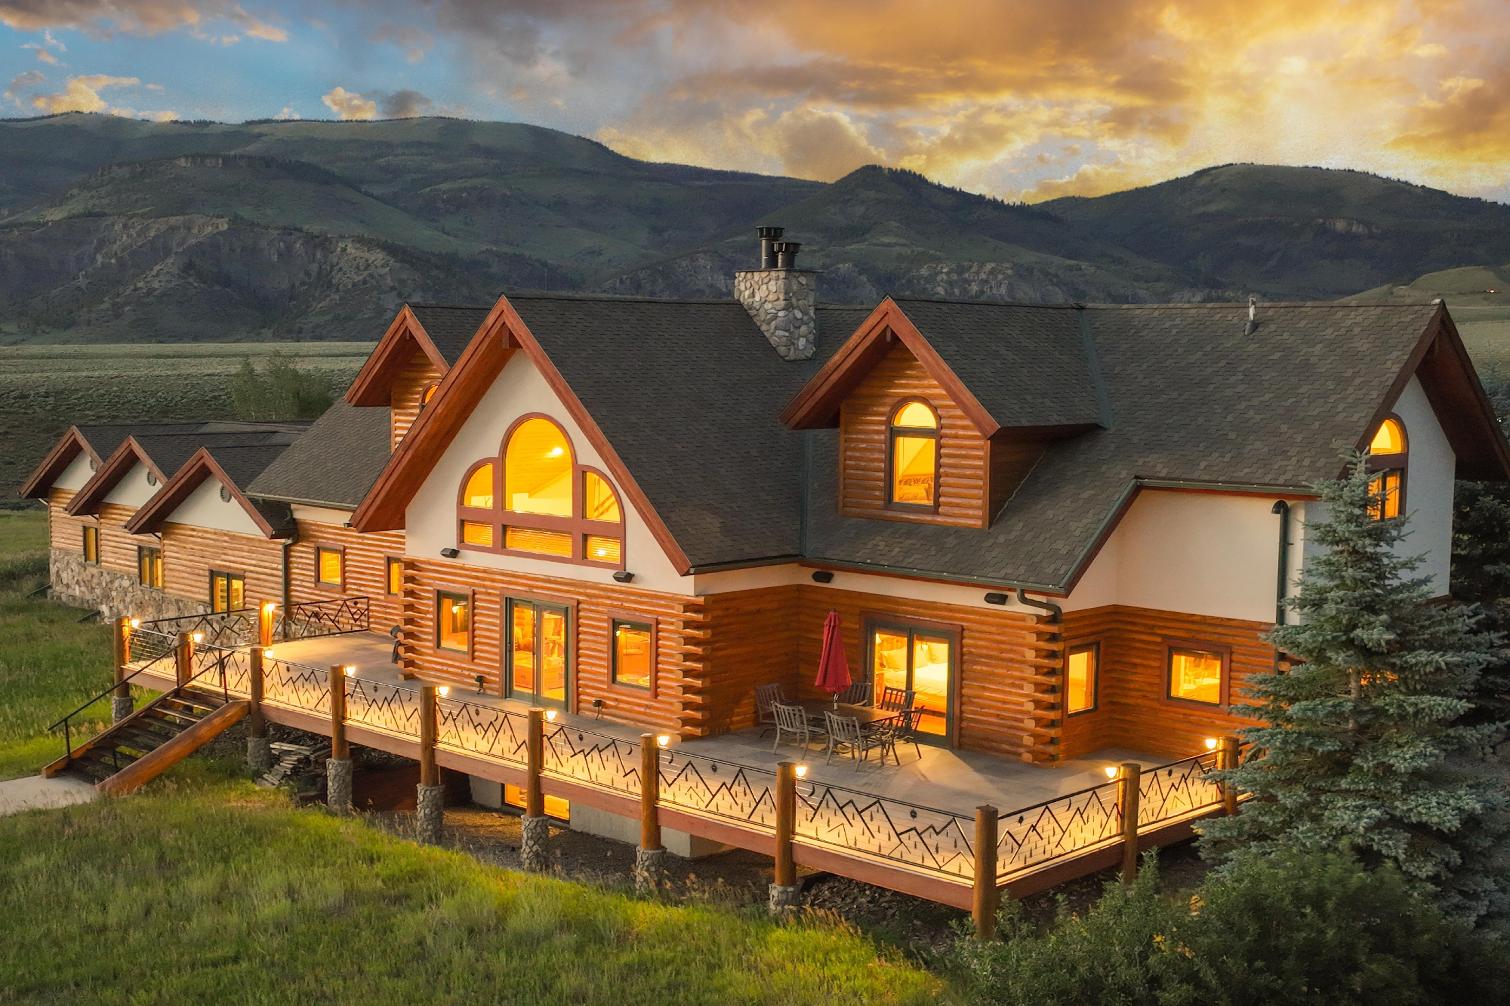
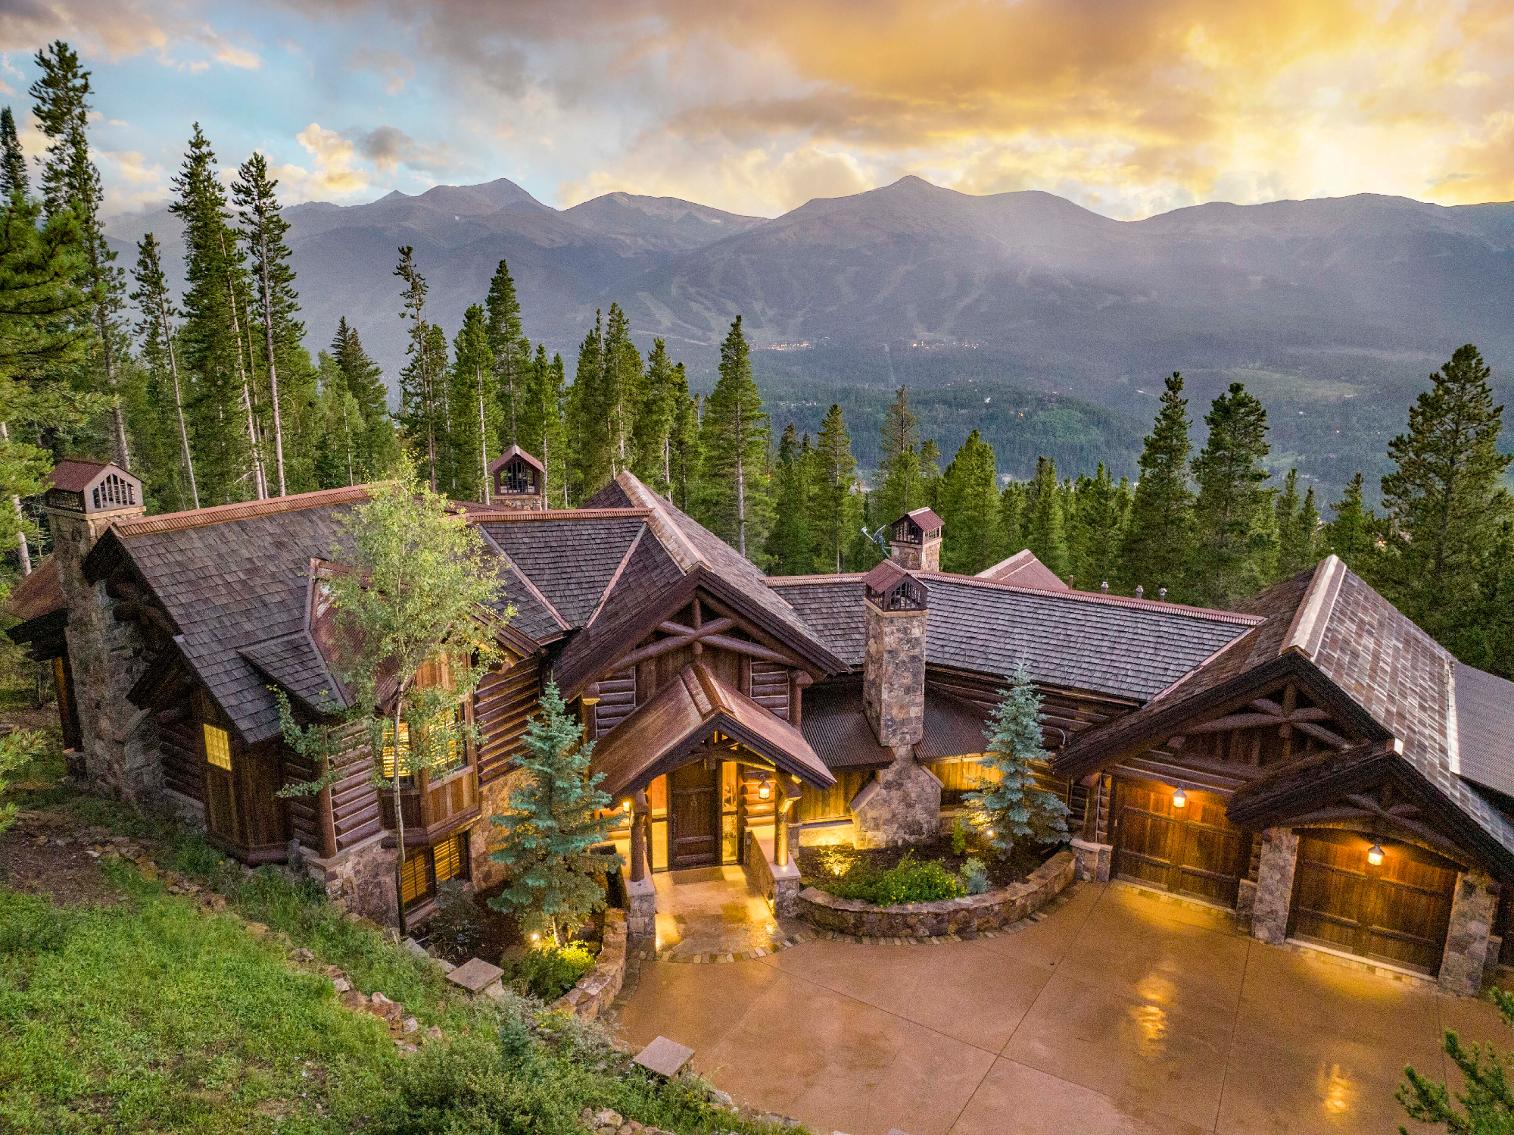
In 20 23 our membership with Forbes Global Properties brought some incredible Summit County homes to a global audience. Here are some of our most notable sales of the year.
BRECKENRIDGE | $5,400,000
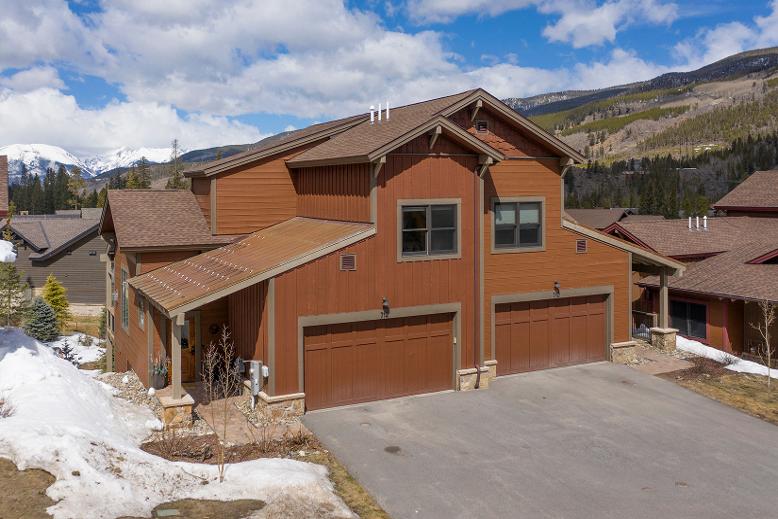

BRECKENRIDGE | $2,300,000
23 NORTH ROAD
Represented Seller
DILLON | $1,925,000
125 SNOWBERRY WAY
Represented Seller
BRECKENRIDGE | $3,700,000

214 ROYAL TIGER ROAD
Represented Buyer & Seller
BRECKENRIDGE | $3,000,000
42 SNOWFLAKE DRIVE, 502
Represented Seller
BRECKENRIDGE | $3,250,000
102 S FRENCH STREET
Represented Buyer & Seller
View incredible properties from around the world anytime at:
ForbesGlobalProperties com
BRECKENRIDGE | $3,000,000
205 S GOLD FLAKE
Represented Buyer & Seller