Part 1
Overview of techniques
1. Overview of techniques
1.1 Introduction
This year MUDP 2020 Values in Urban Design course, introduced a variety of research techniques that were explored to help advance the knowledge of data collection/generation and analysis techniques about urban design in the MUD Programme. These techniques are adaptable and flexible enough to be used for a wide range of research question about urban design. The techniques include well know analyses (environmental urban physics – solar, winds, thermal comfort, energy consumption) and emerging techniques such as 2D and 3D spatial design network analysis (updating space syntax to 3D), social media sentiment analysis, and image segmentation.
The aims are not to teach student coding but to empower the student with tools. As any tool, there is the risk that hammer only see the world as nail.
The intention of this compendium is to provide an overview of the technical capacity that was built through the course across the cohort. The compendium also provides detailed steps and processes of how to deploy these techniques. This compendium is for MUD teachers and supervisors to get an overview of the developed techniques, as well as enable any MUD student to use different techniques whilst undertaking their own research dissertation. This compendium compiles together all the group work undertaken by students during the MUDP2020 course. As part of the core group work, it was essential to develop a robust methods for each of the techniques that was then explored individually. The technques are inclusive of software/platforms to use, data types and data manipulation, how to carry out certain analyses, visualisation, data quantification, limitations of the techniques, alternative strategies etc. The intention of the group work was to create technical know how across the cohort.
In principle it would enable any other student to understand a certain technique without more external search, tapping on the compendium and the know-how of the cohort.
MUDP2020 Values of Urban Design

Purpose
For future MUD teachers/supervisors
• To gauge an understanding of the technical capacity that was built through the course.

• Demonstration of skills and knowledge gained by students
MUDP2020
• Relevance of skills and techniques for research about urban design


(this document)
• To achieve a step-by-step understanding of how to deploy different techniques.
• Developing a relational understanding of the techniques.
5 MUDP2020 Compendium of techniques
Additional techniques
For MUD students
Compendium of Techniques
• Expand knowledge through deploying different techniques in the development of research about urban design. Macro-meso scale network science analysis Parametric urban design on topography Existing area & value analysis Social media data & sentiment analysis Street view imagery & image segmentation analysis • Basic spatial analyses • Environmental Analyses
This section aims to highlight key findings and takeaways from each of the techniques.
Theme 1A: Macro-meso scale network science analysis


Spatial accessibility analysis of transport networks is key to understand the dynamic of neighbourhoods, to cities, to mega-region. Based on human spatial cognition and route choice preference, spatial design network analysis of the morphology of existing road network (HK, SZ, HK-SZ and GBA), existing and future MTR line scenario (HK, SZ and HK-SZ) enable to anticipate the trajectory of metro station and their surroundings, station cluster in relationship to the whole metro system. Using simulation it was found how the expansion of the metro systems will re-distribute regional and sub-regional public transport accessibility, which impact on residents and workplaces distribution and CBD and sub-centre dynamic. This is of interest to urban designer aiming to understand the trajectory neighbourhoods of interest.
Metro network 2022 and 2031 - Flow potential analysis (Betweenness Centrality)

• The 2022 HK and SZ metro analysis identified the key centres, showing the east west organisation of Shenzhen and the importance of Futian and Luohu. In HK, Central-Admiralty and Kowloon form the main Centre.
• When simulating scenario, loops are better at developing a more distributed accessibility than dead end lines.


• SZ and HK metro differ greatly in their morphology, size, number of stations, the difference in distance between station, longer in SZ than in HK. As the HK metro system is more compact in Kowloon and HKI when both systems are connected Kowloon and HKI show higher flow potential which seems realistic given the daily number of trip in both metro system
• If the HK and SZ metro systems are connected it is shown that in the northern metropolis the key cluster will between Futian, Luohu, Lok Ma Shau/Loop, Lo Wu South, Sheung Shui and Fanling
Road network 2022 - Flow potential analysis (Betweenness Centrality)
• The existing roads in Hong Kong with high potential traffic are on the north side of Hong Kong Island and the south side of Kowloon District. In Shenzhen, the roads with high-flow potential are mainly located in Futian and Luohu and Nanshan District
• Overall the analyses give a good account of the road network organisation and identifies key clusters.
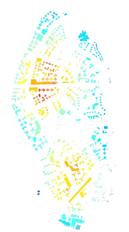
Theme 1B: Parametric urban design on topography
Difference from parametric design on flat ground
• Unlike designs on flat land, designers should consider the many influencing factors contained in the mountain into the design process, such as topography, landform, water distribution, climatic conditions, etc. This process will be more complex than parametric design on flat ground.
• The absolute elevation of the terrain affects the intensity of the city receiving solar radiation, and the relative slope and aspect of the terrain can change the shadow length of the building on it, the building located on the south slope, the shadow becomes shorter and the building on the north slope, the shadow becomes longer, the slope is larger, the more obvious the change.
Advantages and limitations of parametric tools


• Parametric tools are applied to the simulation and research of related urban design. But this does not mean that parametric tools can create a perfect system to predict people’s behaviour in urban design. Intangible factors such as cultural background, social development and economic impact are rarely involved and considered in the parametrization process.
• Parametrization can liberate productivity. Parametric analysis is applicable to various types of terrain and sites. It can deepen the understanding and understanding of the site through early analysis and guide the later site design. The use of parametrization in UD project is more conducive to a basic understanding of this large project site, which are suitable for construction areas and which can be used as environmental protection areas, which can provide designers with early design entry points.
• As students majoring in design, we think rhino-grasshopper workflow is relatively more operable and does not need programming background knowledge like python. Grasshopper pack has a lot of operation commands, which only needs to be connect according to logic, which is very convenient. At the same time, grasshopper can also use programming language to assist design, which is a more powerful platform.


Theme 2: Existing areas & value analysis
Looking for values in existing areas
• The assessment of existing values will allow us to gain a deeper understanding of the impact of urban design on urban life and its inhabitants, which will guide us to further complete our personal interest in specific aspects and explore the relationship between urban design and values.
7 MUDP2020 Compendium of techniques Master of Urban Design (MUD) 2021-22 6 1.2 Key findings
• The assessment of existing sites allows the identification of existing urban problems and conflicts and the identification of directions for optimising the urban environment. By thinking about broader ‘urban design value’ in this way e as co-constructed between place and its stakeholders e we can also better understand the influence of the urban designer in the process of creating value in places. (Chiaradia et al., 2017)
• The use of existing site assessments can be of great help in many urban research topics. For example, urban form, street connectivity, area accessibility, block density, urban vitality, etc.

Conceptualising values
• Value as Net benefit or Value in Exchange : property value, an economic conceptualisation that often implies accurate measurement. Private value accruing to developer and/or property owner.
• Value as meaningful difference or Value in Use: How the space is used? Private value accruing to user of paid for benefits.
• Value as moral or social principles or Value in Common: a sociological conceptualisation. Public value accruing to users who do not pay for benefits, externalities.
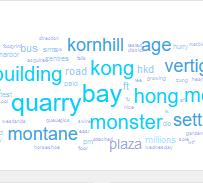
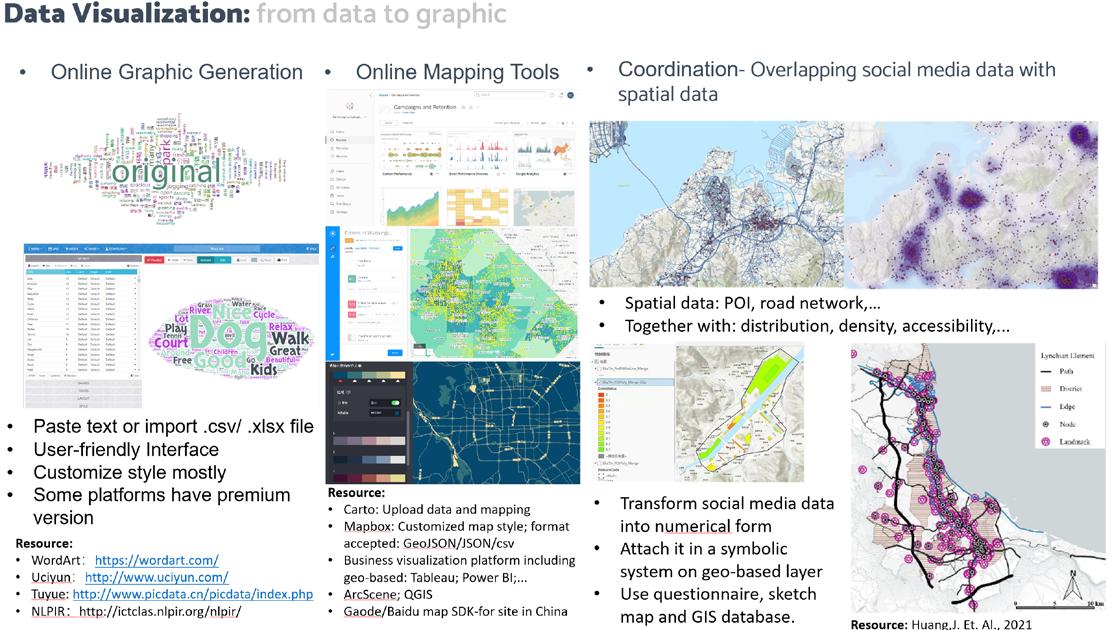
Theme 3: Social media data & sentiment analysis
Use of SVIs
• SVI has already been used to some extent in the field of urban street research. The use of computer technology can help people to process a huge number of street images. Green street coverage, the visual quality of street space, green visibility and even the impact of the natural environment on mental health all benefit from SVI.
• With the development of computer technology and the introduction of a variety of machine learning algorithms, it has become possible to use deep convolutional neural network architecture to line-of-sight accurate deep bottom processing of street view images and to effectively identify multiple elements such as sky, pavement, lanes, buildings and greenery.


Limitations and further studies
• The data source is limited by the fact that the streetscape data is captured on the driveway, while the public spaces that people use on a daily basis are mostly combined with pedestrian spaces, so there are deviations between the viewpoints and the actual viewpoints.
• In addition to the data about street characteristics obtained through SVI segmentation, we also need to obtain other spatial data about urban pollution, urban noise and other urban environmental burdens.
• By combining remote sensing and proximity sensing, it can help people to better understand the shape and quality of cities.
Limitations and further studies
• Different ways of using social media data explored in each individual process highlight the fact that this type of analysis needs to be conducted along with other research methods, such as network analysis, population character, building typology, and more.
• A major challenge of text based social media analysis is related to human versus machine (software) reading analysis. Complications occur throughout the whole process, from the very beginning. For instance, some reviews obtained from Google Maps, were directly translated by Google, mainly from Cantonese or Mandarin into English.
• More intelligent NLP (Natural Language Processing) software is needed for researchers to use. In manually filtering Google Maps comments, we will find many problems, and each problem needs a separate script to identify. This also happened on Weibo, a widely used social platform in China Because many people can make profits by sending irrelevant information, the automatic shielding system often fails to shield some hidden irrelevant information or shield relevant information. Malicious users are an important issue in social media.
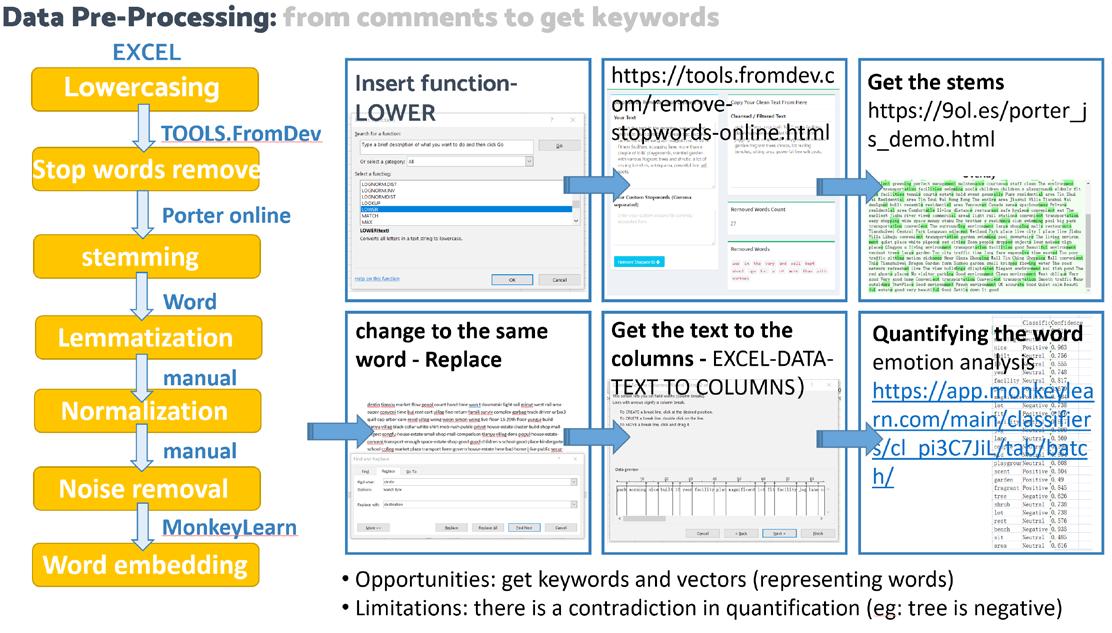
• Before starting the research, pre-processing of text should be carefully considered as well, for instance with text normalization, getting rid of stop words, or repetitive words, etc. – the system might clean the text in a way that important words get omitted which would otherwise influence the analysis result (e.g., sentiment of aspect-qualifier categorization).
• Standards for social media data need to be established. This standard does not need to be particularly strict, because there is a large gap between users of different social media themes. However, if standards are not set, the research on a single social media cannot be applied to other social media. Cross social media research is needed to find the operation logic of different social media, so as to formulate a wide range of standards applicable to different social media.
• Image segmentation analyses do not yet offer a highly accurate identification of different elements, resulting in less accurate statistics of the final image data and correlational analysis.
9 MUDP2020 Compendium of techniques Master of Urban Design (MUD) 2021-22 8
Theme 4: Street-view imagery (SVI) & image segmentation analysis
1.3 Techniques explored by each student in MUDP 2020
MUDP1003 Supervisor and Students
Casey Wong
Bian Ming
Cheng Zixuan
Gao Jinyuan
Li Yifan
Zhu Jiaxuan
MUDP2020 Technique epxlored
Theme 3 Social Media in Urban research
Theme 1B Parametric UD on topography
Theme 3 Social Media in Urban research
Theme 3 Social Media in Urban research
Theme 3 Social Media in Urban research
MUDP1003 Supervisor and Students
Jason Hilgefort
Wei Yumeng
Xiao Di
Zhang Mengdi
Zhao Jixuan
Zhou Ning
MUDP1003 Supervisor and Students
Laurence Liauw
Chen Mengdi
Kong Fanding
Lu Yilin
MUDP2020 Technique epxlored
Theme 3 Social Media in Urban research
Theme 4 Streetview Image in Urban research
Theme 3 Social Media in Urban research
Theme 2 Value evaluation in existing areas
Theme 2 Value evaluation in existing areas
MUDP2020 Technique epxlored
Theme 4 Streetview Image in Urban research
Theme 4 Streetview Image in Urban research
Theme 3 Social Media in Urban research
MUDP1003 Supervisor and Students
Massimiliano Dappero
Wang Yangxi
Xi Ni
Xiao Yiyun
MUDP1003 Supervisor and Students
Sid Khakhar
Ahmed Sazdik
Li Shiyu
MUDP1003 Supervisor and Students
Sunnie Lau
Cui Yuechen
Lin Zhuowei
Shi Yongli
Wen Jing
Yu Chenfei
MUDP1003 Supervisor and Students
Sunny Choi
Wang Xinran
Wu Yingxian
MUDP2020 Technique epxlored
Theme 2 Value evaluation in existing areas
Theme 1A Macro-Meso Network Science
Theme 2 Value evaluation in existing areas
MUDP2020 Technique epxlored
Theme 2 Value evaluation in existing areas
Theme 3 Social Media in Urban research
MUDP2020 Technique epxlored
Theme 1B Parametric UD on topography
Theme 4 Streetview Image in Urban research
Theme 1A Macro-Meso Network Science
Theme 4 Streetview Image in Urban research
Theme 1A Macro-Meso Network Science
MUDP2020 Technique epxlored
Theme 1B Parametric UD on topography
Theme 4 Streetview Image in Urban research
11 MUDP2020 Compendium of techniques Master of Urban Design (MUD) 2021-22 10
MUDP1003 Supervisor and Students
Vera Kleesattel
Liu Weiran
Tundokova Reka
Yin Yue
MUDP1003 Supervisor and Students
Alain Chiaradia
Fan Zitian
Yang Yuan
Yu Xuechun
Zhang Jin
MUDP2020 Technique epxlored
Theme 4 Streetview Image in Urban research
Theme 3 Social Media in Urban research
Theme 4 Streetview Image in Urban research
MUDP2020 Technique epxlored
Theme 1A Macro-Meso Network Science
Theme 2 Value evaluation in existing areas
Theme 2 Value evaluation in existing areas
Theme 1B Parametric UD on topography
This page has been intentionally kept blank.
13 MUDP2020 Compendium of techniques Master of Urban Design (MUD) 2021-22 12
Theme
1A:
Macro-meso scale network science analysis
• Ozuduru, B., Webster, C., Chiaradia, A. & Yucesoy, E., 2020. Associating street-network centrality with spontaneous and planned subcentres. Urban Studies, p. p.0042098020931302.
• Xiao, Y. et al., 2017. Street network accessibility-based methodology for appraisal of land use master plans: An empirical case study of Wuhan, China. Land Use Policy, Volume 69, pp. 193-203.
• Zhang, L., Chiaradia, A. & Zhuang, Y., 2015. A Configurational Accessibility Study of Road and Metro Network in Shanghai, China In: Q. Pan & J. Cao, eds. Recent Developments in Chinese Urban Planning. Cham: Springer GeoJournal Library, 114, 219-245.

• Zou, Y., Zhang, L. & Chiaradia, A., 2021. An adaptation of reference class forecasting for the assessment of large-scale urban planning vision, a SEM-ANN approach to the case of Hong Kong Lantau tomorrow. Land Use Policy, Volume 109, p. 105701
Theme 1B: Parametric urban design on topography
• Zhang, Y & Liu, C., 2021. Parametric Urbanism and Environment Optimization Toward a Quality Environmental Urban Morphology. International journal of Environmental research and Public health.
• Chen, Y et al., 2021. From Separation to Incorporation. A full circle application of computational approaches to performance-based architectural design. Proceedings of the 2021 Digital Futures.
• Osintseva, L et al., 2020. Automated Parametric Building Volume Generation: A Case Study of Urban Blocks. SimAUD 2020.
• Beriao, J, Arrobas P, Duarte, J., Parametric Urban Design: Joining morphology and urban indicators in a single interactive model. City Modelling - Volume 1 eCAADe30
• Whitaker, C, Pniewski, M, Harding, J., Parametric Massing for Effective City Design. Ramboll 3D Reid.
• Wilson, L., 2019. How to generate a thousand master plans: A framework for computational urban design. SimAUD2019
Theme 2: Existing Areas & value analysis
• Chiaradia, A. Waters, F. 2020. The Creative Transformation of Island East and Development of Taikoo Place. Places Impact Report, Swire Properties Limited
• Sieh, L, Chiaradia, A, Jones, S. 2021. Urban Design Research in Practice: The Value Gradient Map. 2021. Urban Design Group Journal.
• Chiaradia, A, Jones, S, Sieh, L. 2021: TOD, Towards a value assessment tool: A multi-scale value gradient map.
• Chiaradia, A., Sieh, L. & Plimmer, F., 2017. Learning Values in Urban Design, A Studio Based approach. Design Studies, Volume 49, pp. 66-100.
Theme 3: Social media Data& sentiment analysis
• Mayr, P & Weller, K.. Think before you collect. Setting up a data collection approach for social media studies.
• Ilieva, R, McPhearson, T. Oct 2018. Social-media data for urban sustainability. Nature Sustainability Volume 1.
• Marti P et al., 2019. Social Media Data: Challenges, Opportunities, and Limitations in Urban Studies. Computers, Environment and Urban Systems 74 (2019) 161-174
• Chen T et al., 2019. Identifying Urban Spatial Structure and Urban Vibrancy in Highly Dense Cities using Geo-referenced Social Media Data. Habitat International 89 (2019) 102005
• Sim, J, Miller, P, Swarup, S., Oct 2020. Tweeting the High Line Life: A Social Media Lens on Urban Green Spaces. Sustainability 2020 12, 8895;
Theme 4: Street-view Imagery (SVIs) & image segmentation analysis

• Cinnamon, J.; Jahiu, L. Panoramic Street-Level Imagery in Data-Driven Urban Research: A Comprehensive Global Review of Applications, Techniques, and Practical Considerations. ISPRS Int. J. Geo-Inf. 2021, 10, 471. https:// doi.org/10.3390/ijgi10070471
• Shen, Q., Zeng, W., Ye, Y., Arisona, S.M., Schubiger, S., Burkhard, R. & Qu, H., 2017. StreetVizor: Visual exploration of human-scale urban forms based on street views. IEEE Transactions on Visualization and Computer Graphics, 24(1), 1004-1013.

• Kang, Y., Zhang, F., Gao, S., Lin, H. and Liu, Y., (2020) A review of urban physical environment sensing using street view imagery in public health studies, Annals of GIS, 26:3, 261-275, DOI: 10.1080/19475683.2020.1791954
1.5 Snapshot of data collection/generation and analysis
Theme 1A: Macro-meso scale network science analysis

In general, QGIS, ArcGIS pro, ArcGIS and rhinoceros can complete network analysis, yet only with rhinoceros and ArcGIS we could complete the analysis due to issue with our computers.
Issues with QGIS
You can refer to the QGIS handout: SPATIAL DESIGN NETWORK ANALYSIS sDNA in QGIS. Problems may arise caused by the installation path which is not the original path, or the path appears in Chinese, or the Chinese software installation package.

Issues with ArcGIS
Pirated software may have problems loading the toolbox (Fig 2), and the official software will prompt errors when running. These may be caused by the installation path which is not the original path, or the path appears in Chinese, or the Chinese software installation package.
Some solutions can refer to the following Web links: https://mp.weixin.qq.com/s/GuI4hjF1-kudboNrMiCLug https://mp.weixin.qq.com/s/RJvS4JvWA22jvflppvKC3g
Network at Interchange Stations
Make sure there is a short line connection at the transfer station, as shown in the figure below,there is only one station, but the transfer should be reached by walking, so each crossing line needs stub for connection.
MUDP2020 Compendium of techniques Master of Urban Design (MUD) 2021-22 14 1.4 Research paper using the techniques
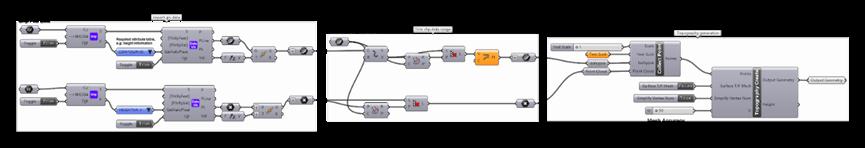
The software used in this design study is Rhino and Grasshopper. Rhino is a 3D modeling software that is widely used in industrial design, architectural design and urban design. Grasshopper is a parametric built-in plugin for the Rhino platform. Its advantages are fast interaction efficiency with rhino modeling platform and user-friendly programming, its limitation is that it requires a certain grasshopper programming foundation.

ArcGIS can also be used to perform this series of analyses and calculations. ArcGIS has powerful geographic data management and analysis capabilities, but the disadvantage is that ArcGIS has a lower degree of freedom. For designers, Grasshopper allows designers to modify analysis algorithms and drawing methods, and Grasshopper is more efficient and intuitive for 3D analysis.


Used software: ArcGIS pro-Population density, Floor area ratio, Open space ratio, Ground space index, Block Size city scale, Building height, Road space, POI. sDNA-analyze the accessibility of 3D pedestrian network. Grasshopper- Accessible density, Area density, Vehicle network analysis, Pedestrian network analysis. Google map- Movement and place analysis There also have other software applications that can be used for urban design analysis. For example, in term of networks analysis, we use the ArcGIS to analysis Network density and sDNA to analysis the accessibility and permeability of network.
There are also other techniques could be used in analysis spatial network, for instance previous technique Space Syntax developed by UCL (1970s), and GIS also could analysis the network. Urban Network Analysis (UNA) developed by MIT is also useful, unlike previous software tools that operate with two network elements (nodes and edges), the UNA tools include a third network element - buildings - which are used as the spatial units of analysis for all measures. Hence, when considering the impact of typology of building on the network accessibility in a super block context TSW, there are some new findings we could explore.


17 MUDP2020 Compendium of techniques Master of Urban Design (MUD) 2021-22 16 Theme 1B: Parametric urban design on topography
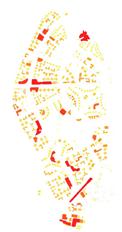
Theme 2: Existing areas & value analysis
In terms of social media data, manual extraction of less data can be achieved. But when researchers want to get enough data, machines are often more suitable. There are three ways to extract data: manual, API Wrappers like Stevesie, data extraction software like octopus.
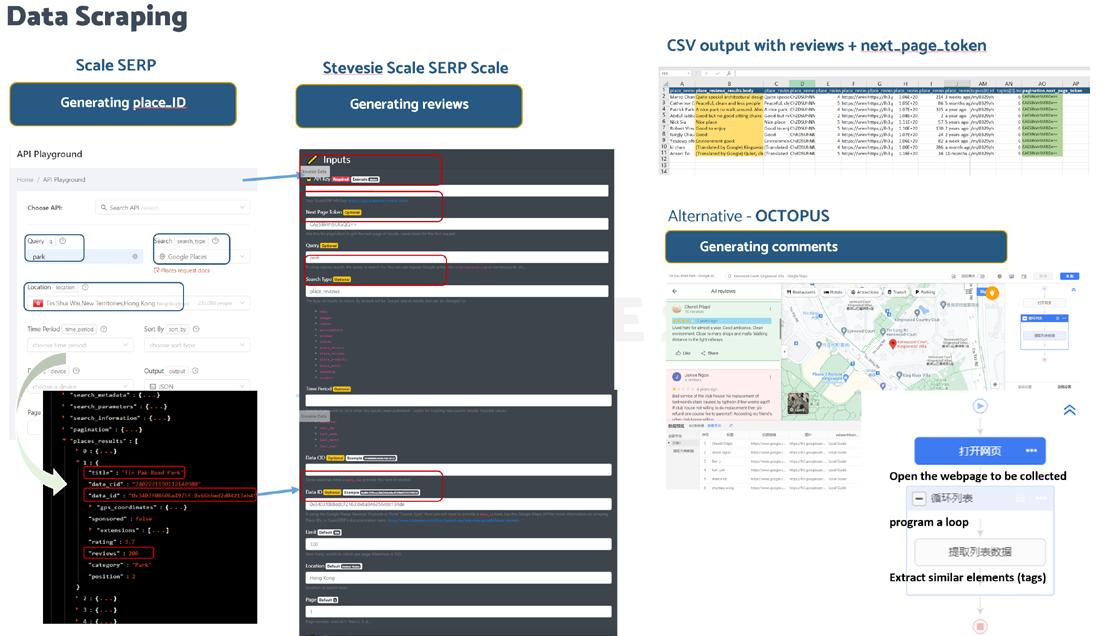
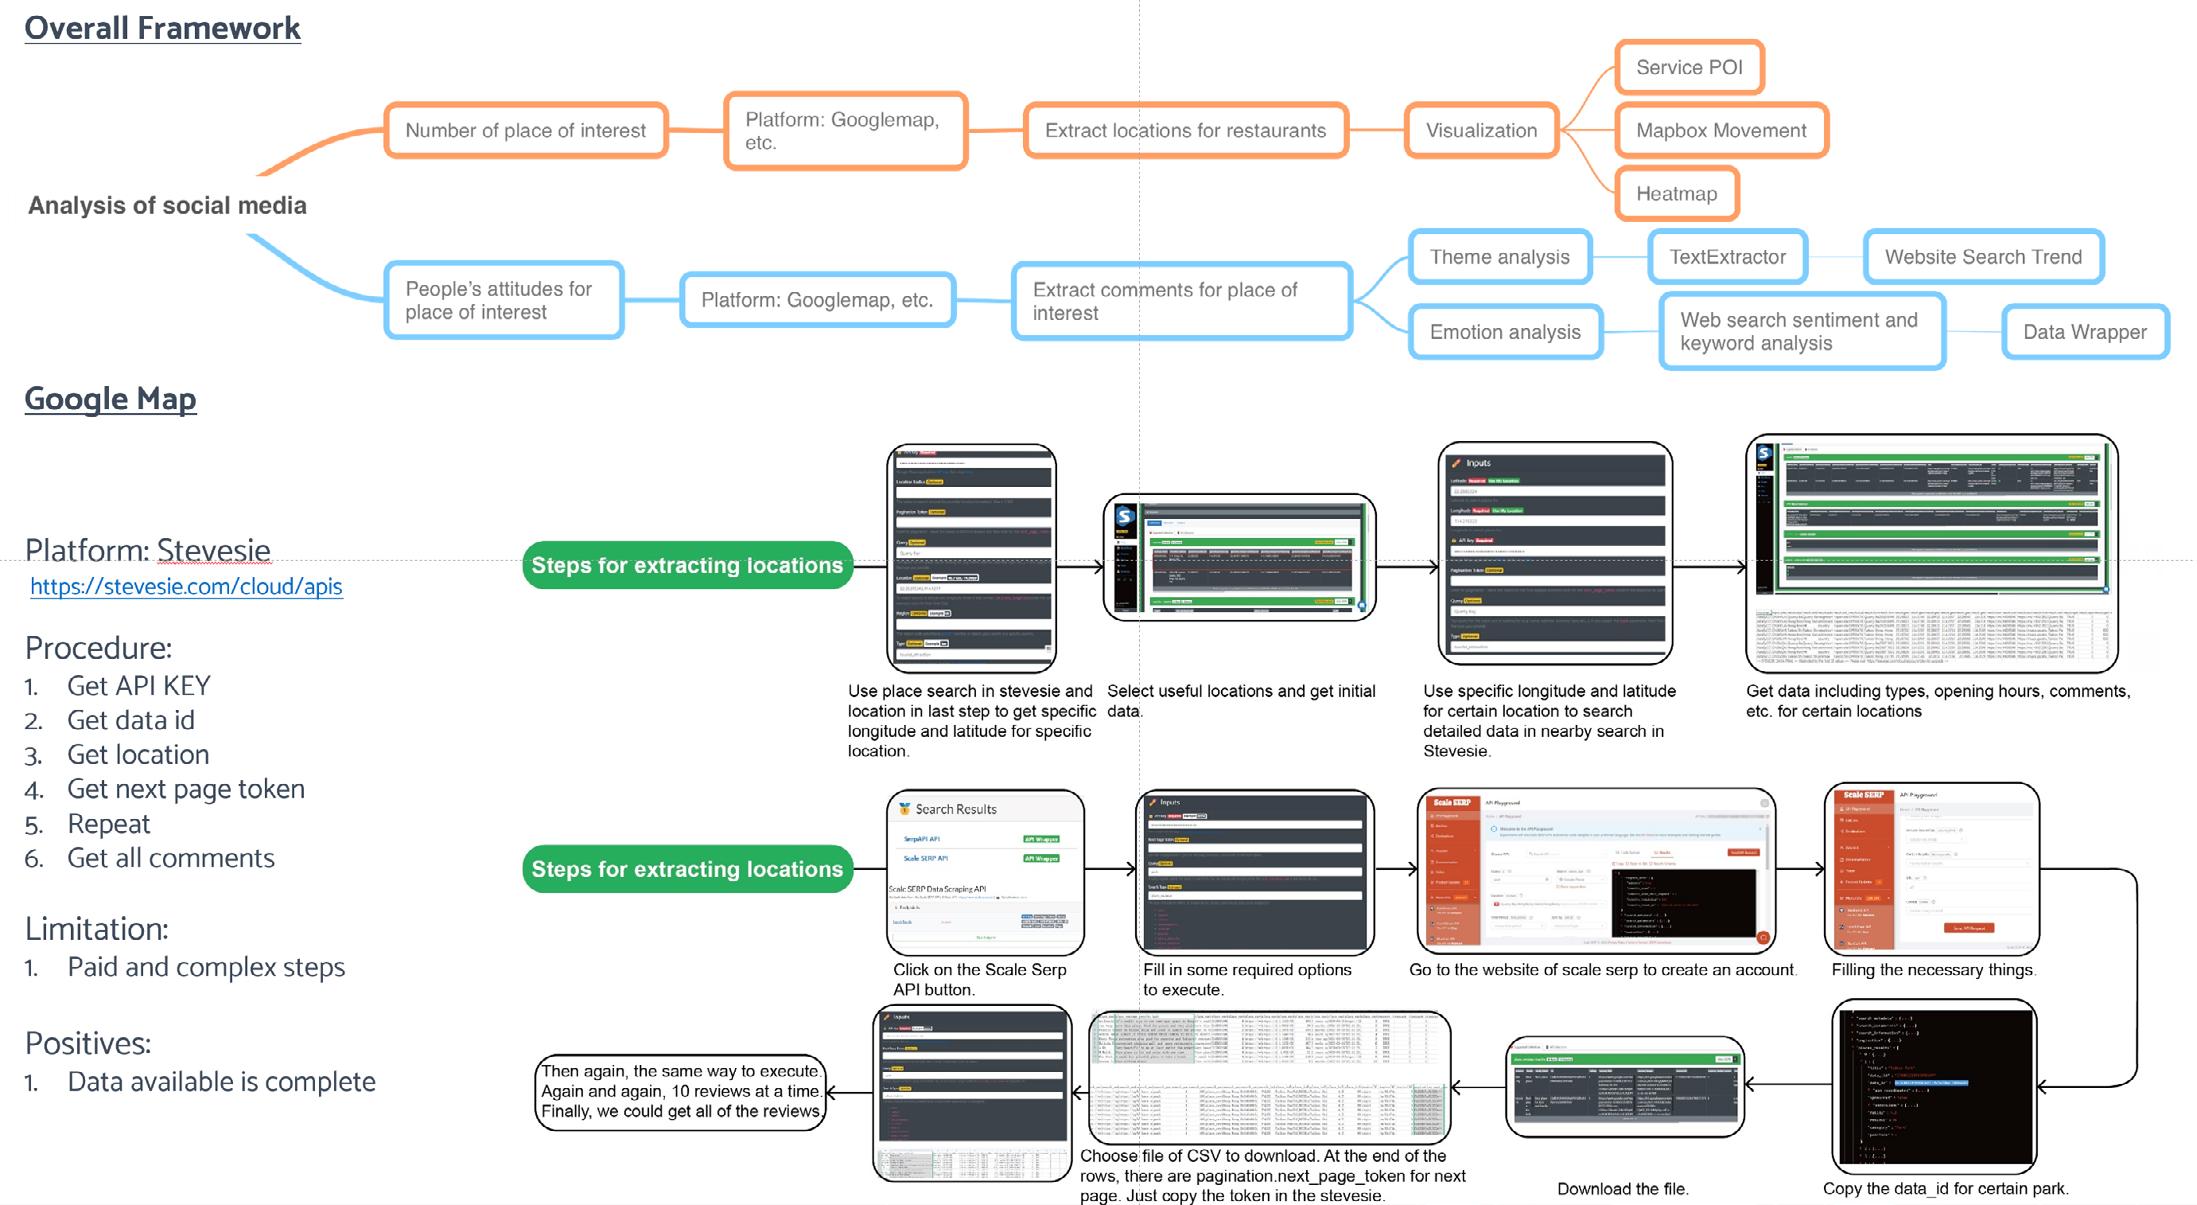
Manually extracting data can achieve the extraction of less data, but it encounters difficulties when faced with a large amount of data. Python/coding, API Wrappers and data extraction software can all extract large amounts of data. But python/coding requires a certain programming foundation and is not suitable for everyone. So we explored the other two directions. Both API Wrappers and data extraction software can obtain more comprehensive data, and API Wrappers are easier to use, so we finally chose Stevesie as the first choice, and the free data extraction software Octopus as another option.
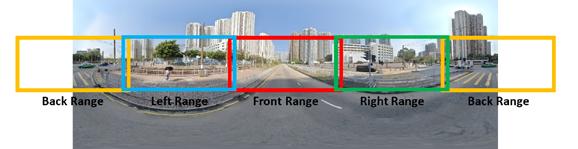
The most open and easily accessible street view resources should be Google Street View. In the Google Street View interface people are able to change their position and rotate their visual field freely to simulate the real feeling of street view. However, Google Street View is web-based and unable to be downloaded and processed directly.
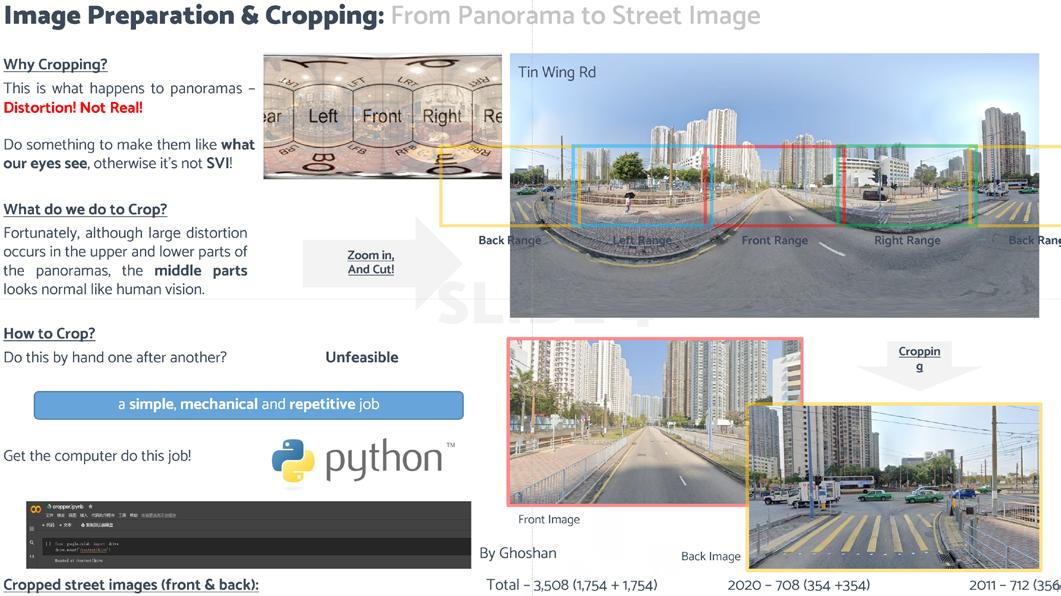
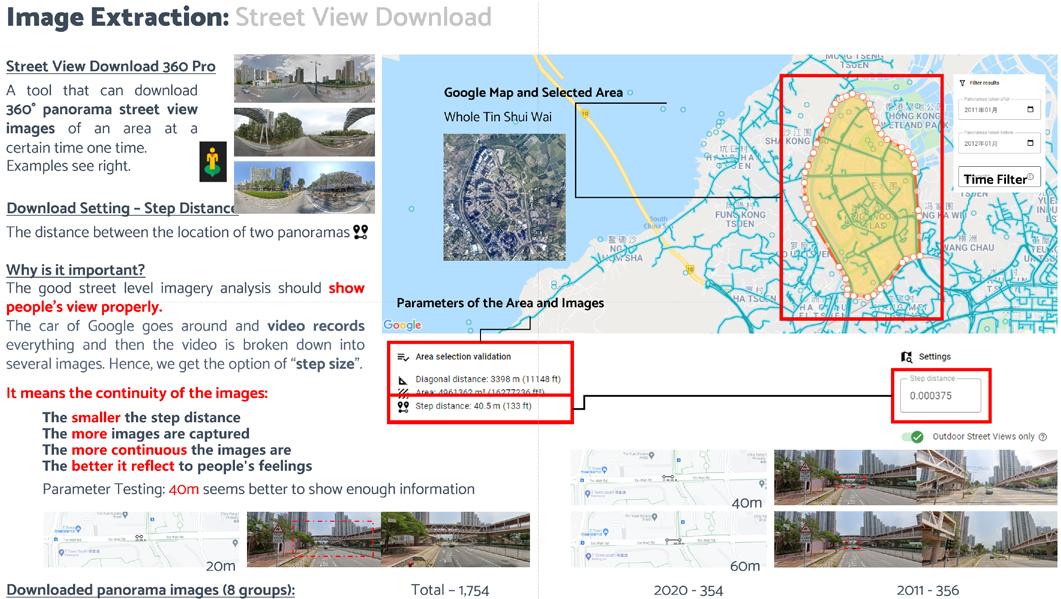
The group chooses to use Street View Download 360 Pro, an app for downloading 360° panoramas (example see Figure 4 2) from Google Street View, to extract the necessary images. With the area download tool it is easy to get all panoramas within an area during a certain period at one time. Moreover, the exif metadata are added to the image such as geolocation, elevation, date taken, camera rotation, etc. This may facilitate some future analysis.
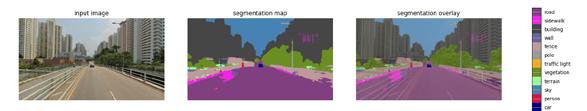
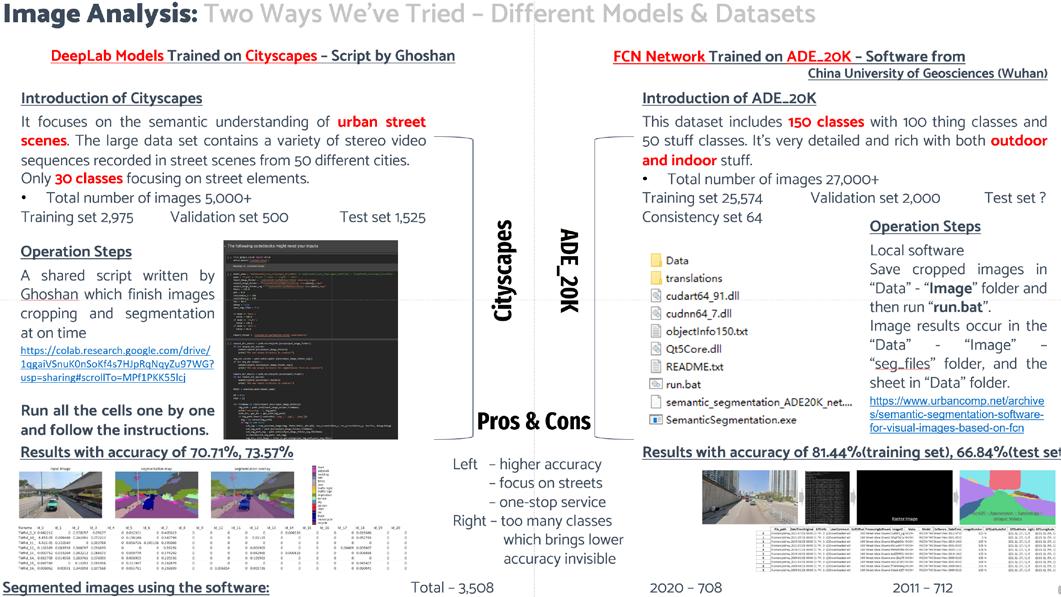
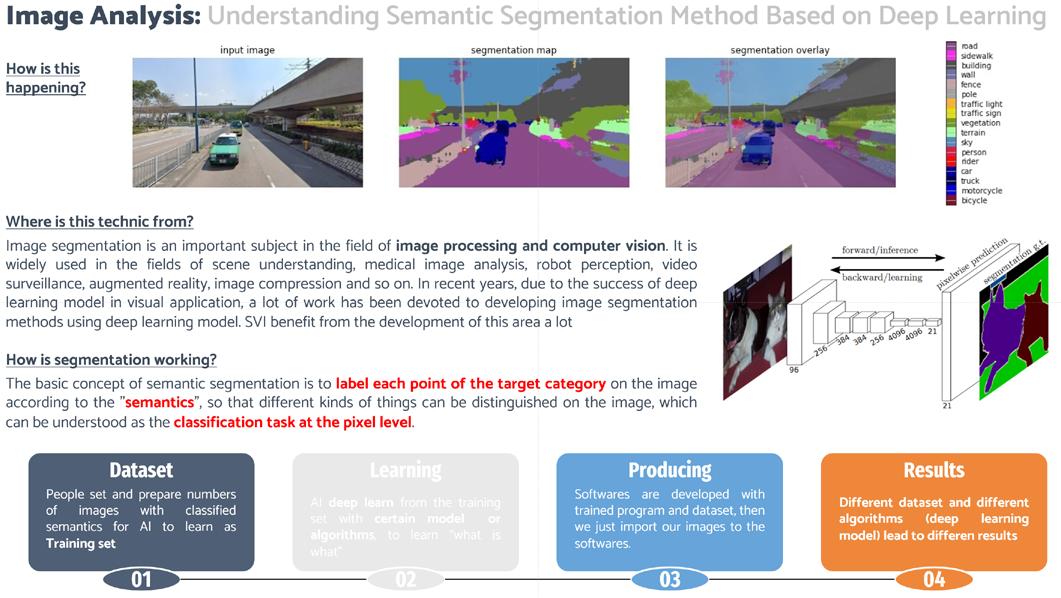
The basic concept of semantic segmentation is to label each point of the target category on the image according to the "semantics", so that different kinds of things can be distinguished on the image, which can be understood as the classification task at the pixel level (Xiaobaixueshijue, 2021).
19 MUDP2020 Compendium of techniques Master of Urban Design (MUD) 2021-22 18 Theme 3: Social media data & sentiment analysis
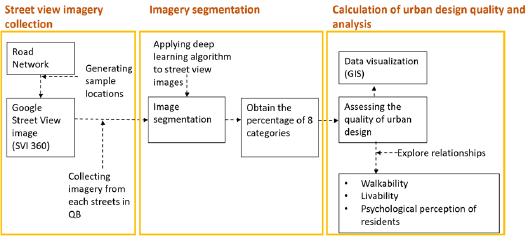
Theme 4: Street-view imagery (SVI) & image segmentation analysis