
2025
Child and Family Poverty Report
Child poverty is disappearing from media headlines and public policy agendas—but not from our communities.

February, 2026
Table of Contents
Key Highlights
Executive Summary
Part I: Setting the Context
Introduction: Child Poverty Remains a Policy Failure.
Measuring Poverty in New Brunswick.
Part II: The Affordability Shock: Trends in Child Poverty
Child Poverty Trends: Rates, Costs, and the Affordability Crisis.
Geography of Child Poverty: Uneven Burdens Across Communities.
Part III: Who Is Most Affected?
Poverty in Early Childhood (Under Age 6).
One-Parent Families and Gendered Poverty.
Indigenous Child Poverty.
Racialized and Immigrant Child Poverty.
Part IV: What Is Driving Hardship Now?
Housing Unaffordability.
Vacant vs Occupied Units.
Tenant Protections and Rent Caps.
Rental Wages.
Minimum Wage Hours Needed to Afford Rent.
Income Inadequacy and the Depth of Poverty.
Welfare Incomes and Social Assistance.
Food Insecurity.
Part V: Inequality, Income Supports, and Structural Reform
Inequality in New Brunswick.
The Impact of Government Transfers.
The Canada Child Benefit (CCB).
Looking Ahead: Guaranteed Basic Income.
Key Highlights
2023 tax filer data reveals that roughly 1 in 5 Canadian children lived in poverty (CFLIM-AT).
In 2023, child poverty in New Brunswick remained alarmingly high. According to the CFLIMAT, 21.9% (32,140) of children lived in poverty—unchanged from 2022.
The MBM child poverty rate increased sharply, rising from 11.3% to 14.9%—an increase of 3.6 percentage points.
The main cause of increasing income inadequacy in 2023 was the rising and unaffordable cost of essentials.
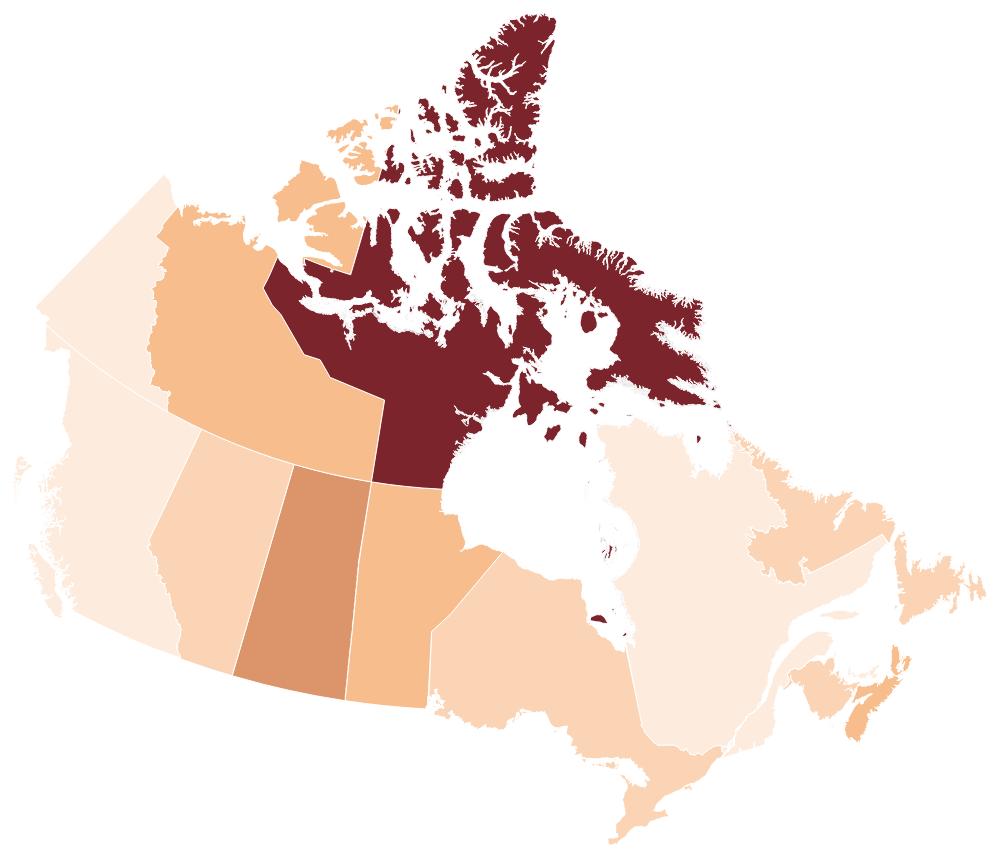
New Brunswick had the country’s sixth-highest child poverty rate (fourth if only considering the provinces and not the territories).
Child poverty rates (CFLIM-AT) in New Brunswick are unevenly distributed across its eight cities, from highs above 30% in Campbellton, Saint John, and Bathurst, to a low of 15% in Dieppe.
The highest decile of New Brunswick families with children held 22.9% of total income, while the lowest decile held 1.6%.
Nearly 1 in 4 children under age 6 (24.4%, CFLIM-AT) are living in poverty in New Brunswick.
In 2023, the after-tax median income for a low-income couple with two children in New Brunswick was $15,514 below the CFLIM-AT poverty line. The gap has remained persistent with no substantive decrease since 2015.
47.8% of children in one-parent families lived in poverty, compared to 11.3% of children in couple families according to the CFLIM-AT.
From 2020 to 2025, rent prices in New Brunswick surged by approximately 44%, erasing two decades of relative stability.
Rental turnover is a major driver of rising housing costs and contributes to instability for renters, particularly families with children.
Government transfers reduced New Brunswick's CFLIM-AT child poverty rate from 37.7% to 21.9%. The Canada Child Benefit lifted 14,310 children out of poverty.
Executive Summary
In 1989, the House of Commons unanimously resolved to eliminate child poverty in Canada by the year 2000. Almost four decades later, that promise remains unfulfilled. In New Brunswick, child poverty persists at unacceptably high levels, shaped by rising living costs, and longstanding structural barriers.
In 2023, an estimated 32,140 children in New Brunswick (21.9%) lived in poverty according to the Census Families Low Income Measure, After-Tax. While the poverty rate remained unchanged from 2022 to 2023, this stability masks a more troubling reality. The cost of living has risen sharply, particularly for housing, food, and energy, pushing families deeper into hardship and increasing the gap between those below the poverty line and what is required to meet basic needs. This is reflected in the increase in Canada’s Official Poverty Line (Market Basket Measure) from 11.3% to 14.9%.
This year’s Child and Family Poverty Report highlights growing affordability pressures. Housing costs are the most significant driver. Since 2020, average rents in New Brunswick have increased by approximately 44%, fundamentally altering the province’s affordability landscape and placing enormous pressure on families with children.
Child poverty is also unevenly distributed geographically. Rates vary dramatically between cities, neighbourhoods, and even adjacent census tracts. Certain groups of children are disproportionately affected. Nearly half of children in one-parent families live in poverty, children under age six experience higher poverty rates, and Indigenous children—particularly those living on reserve—continue to face significantly higher levels of poverty.
Government transfers, including the Canada Child Benefit (CCB), play a critical role in reducing child poverty. However, the impact of the CCB has eroded, reducing poverty less than it did in 2021. Child poverty rates have not had real or lasting improvement in recent years. While child poverty rates decreased during the pandemic, the impact of the supports was temporary, like the benefits themselves.
The evidence makes clear that child poverty is not the result of individual failure. It reflects affordability pressures, income inadequacy, and systemic inequities that can be addressed through policy action. One option is a Guaranteed Basic Income (GBI) program, ensuring that low-income households have enough income to meet certain living expenses. A GBI would be part of a comprehensive poverty reduction strategy that complements existing public services.
Ending child poverty is not only a moral imperative—it is an economic and social necessity. New Brunswick has the evidence, tools, and responsibility to ensure that every child grows up with stability, dignity, and opportunity.
Part I: Setting the Context
Introduction: Child Poverty Remains a Policy Failure
It has been almost four decades since the Canadian House of Commons unanimously resolved to eliminate child poverty by the year 2000.[1] That promise remains unfulfilled. Thousands of children and families in New Brunswick continue to live with inadequate income, unstable housing, and persistent material hardship, outcomes that are neither inevitable nor acceptable in a society with the resources to prevent them.
“This House seek(s) to achieve the goal of eliminating poverty among Canadian children by the year 2000.”
- House of Commons, November 24, 1989
The Human Development Council (HDC) is a member of Campaign 2000, a cross-Canada coalition working to end child and family poverty.[2] Each year, Campaign 2000 and its provincial partners release report cards that track progress—or the lack of it—toward poverty reduction. Child and Family Poverty Reports are a stark reminder of the government’s failure to achieve the target it set in 1989. Considerable work is required to lift children and families out of poverty and create a society where every child can thrive.
For many years, poverty reduction progress in New Brunswick was slow or stalled. Child poverty rates fell sharply in 2020 during the COVID-19 pandemic, largely due to temporary federal and provincial income supports. That period demonstrated that when governments invest in income security, poverty can be reduced quickly and substantially.
However, those temporary supports were discontinued by 2021. Since then, child poverty has risen again, driven not only by the withdrawal of transfers, but by a sharp deterioration in affordability. In New Brunswick, the cost of basic necessities—particularly housing, food, and energy—has increased faster than the incomes of low-income households.
Affordability is a pressing concern for households in New Brunswick. Housing costs, in particular, have emerged as one of the most powerful drivers of financial instability for families with children. For households living below the poverty line, rising costs force difficult choices: paying for shelter or groceries, heat or transportation, childcare or medication. These pressures undermine children’s health, development, and educational outcomes, and they place a growing strain on community services and public systems.
The United Nations Convention on the Rights of the Child affirms that every child has the right to an adequate standard of living.[3] Yet in New Brunswick, high levels of child poverty and affordability challenges make clear that current social and economic policies are failing too many families.
“Poverty is the condition of a person who lacks the resources, means, opportunities, and power necessary to acquire and maintain economic self-sufficiency or to integrate into and participate in society.”[4]
Measuring Poverty in New Brunswick
The Market Basket Measure (MBM) and the Census Families Low Income Measure, After-Tax (CFLIM-AT) are two income inadequacy measurement tools used in Canada.
The federal government and the Government of New Brunswick recognize the MBM as Canada’s official poverty line.[5] The MBM is a consumption-based, absolute measure of poverty. It is based on a basket of goods that reflects the income a family requires to afford basic needs, such as food, shelter, and clothing. MBM data is derived from the Canadian Income Survey (CIS).
The CIS is drawn from a sample of the population and is not reliable for small geographies such as cities, neighbourhoods, or sub-populations. This limits data analysis in provinces like New Brunswick, where local disparities are pronounced.
To address these challenges, Campaign 2000 and its partners use the CFLIM-AT as the primary poverty measure in annual child poverty reporting.[6] The data source for the CFLIM-AT is the T1 Family File (T1FF), which provides a comprehensive picture of income and poverty using tax records rather than survey estimates. The CFLIM-AT is a relative measure of low income that reflects inequality. It identifies individuals and families as low income if their after-tax income falls below 50% of the national median income, adjusted for family size.
The CFLIM-AT is used by Campaign 2000 because it is:
Comparable across regions and over time
Based on reliable tax filer data
Sensitive to income inequality
Suitable for smaller geographic analysis
This distinction matters. In New Brunswick, the MBM consistently reports fewer children living in poverty than the CFLIM-AT. For example, in 2023 according to the MBM, 14.9% (21,000) of children lived in poverty in New Brunswick. The CFLIM-AT reported 21.9% (32,140) of children living in poverty that same year—11,140 more than the MBM. That corresponds to 11,140 children not captured by the MBM who “would still be experiencing the harms and negative outcomes associated with poverty. Policies and programs must ensure that their welfare is also addressed.”[7]
Table 1 MBM Poverty Rates vs CFLIM-AT Poverty Rates By Age in New Brunswick
Note: For more explanation on the difference between the CFLIM-AT and the MBM see the 2023 Child and Family Poverty Report Card at sjhdc.ca. The HDC is using the 2018 Base MBM in keeping with C2000.
Source: Statistics Canada. (2025). T1 Family File. Table 11-10-0018-01; Statistics Canada. (2025). Canadian Income Survey, 2023. Table 11-10-0135-01.
In keeping with Campaign 2000’s national approach, this report primarily uses the CFLIM-AT as its core measure of child and family poverty in New Brunswick.
Part II: The Affordability Shock: Trends in Child Poverty
Child Poverty
In 2023, child poverty in New Brunswick remained alarmingly high. According to the CFLIM-AT, 21.9% of children lived in poverty—unchanged from 2022.
Figure 1 Percentage of Children in Poverty in New Brunswick, CFLIM-AT and MBM (2018 Base), 2000-2023
Source: Statistics Canada. (2025). T1 Family File. Table 11-10-0018-01; Statistics Canada. (2025). Canadian Income Survey, 2023. Table 11-10-0135-01.
At first glance, this stability might suggest that child poverty is no longer worsening. However, the MBM child poverty rate increased sharply, rising from 11.3% to 14.9%—an increase of 3.6 percentage points.
This divergence likely reflects the different purposes of the two poverty measures. The CFLIM-AT tracks relative income inequality, identifying families whose incomes fall far below the national median. The MBM is sensitive to the rising costs of necessities and is updated annually based on inflation.
Between 2022 and 2023, New Brunswick experienced rapid increases in the costs of basic needs, particularly food, rent, and electricity, all key components of the MBM basket.
Table 2 Cost Increases in NB 2022-2023
CPI Component % Increase 2022-2023
Source: Statistics Canada (2026). Table 18-10-0005-01 Consumer Price Index, annual average, not seasonally adjusted
Many low-income families’ incomes did not keep pace with these rising costs. As a result, more children fell below the MBM poverty threshold. The main cause of increasing income inadequacy in 2023 was the rising and unaffordable cost of essentials. Many families already living in poverty experienced deeper deprivation, while more households were pulled into poverty by the affordability crisis.
“The main cause of increasing income inadequacy in 2023 was the rising and unaffordable cost of essentials.”
Unlike New Brunswick, Canada as a whole did not experience as large a divergence betweenMBM and CFLIM-AT trends. Nationally, both measures rose modestly between 2022 and 2023. Poverty according to the MBM rose faster in New Brunswick than in Canada overall. This highlights the unique affordability pressures facing New Brunswick families and the growing urgency of policy responses that address the real cost of living.
“Poverty according to the MBM rose faster in New Brunswick than in Canada overall.”
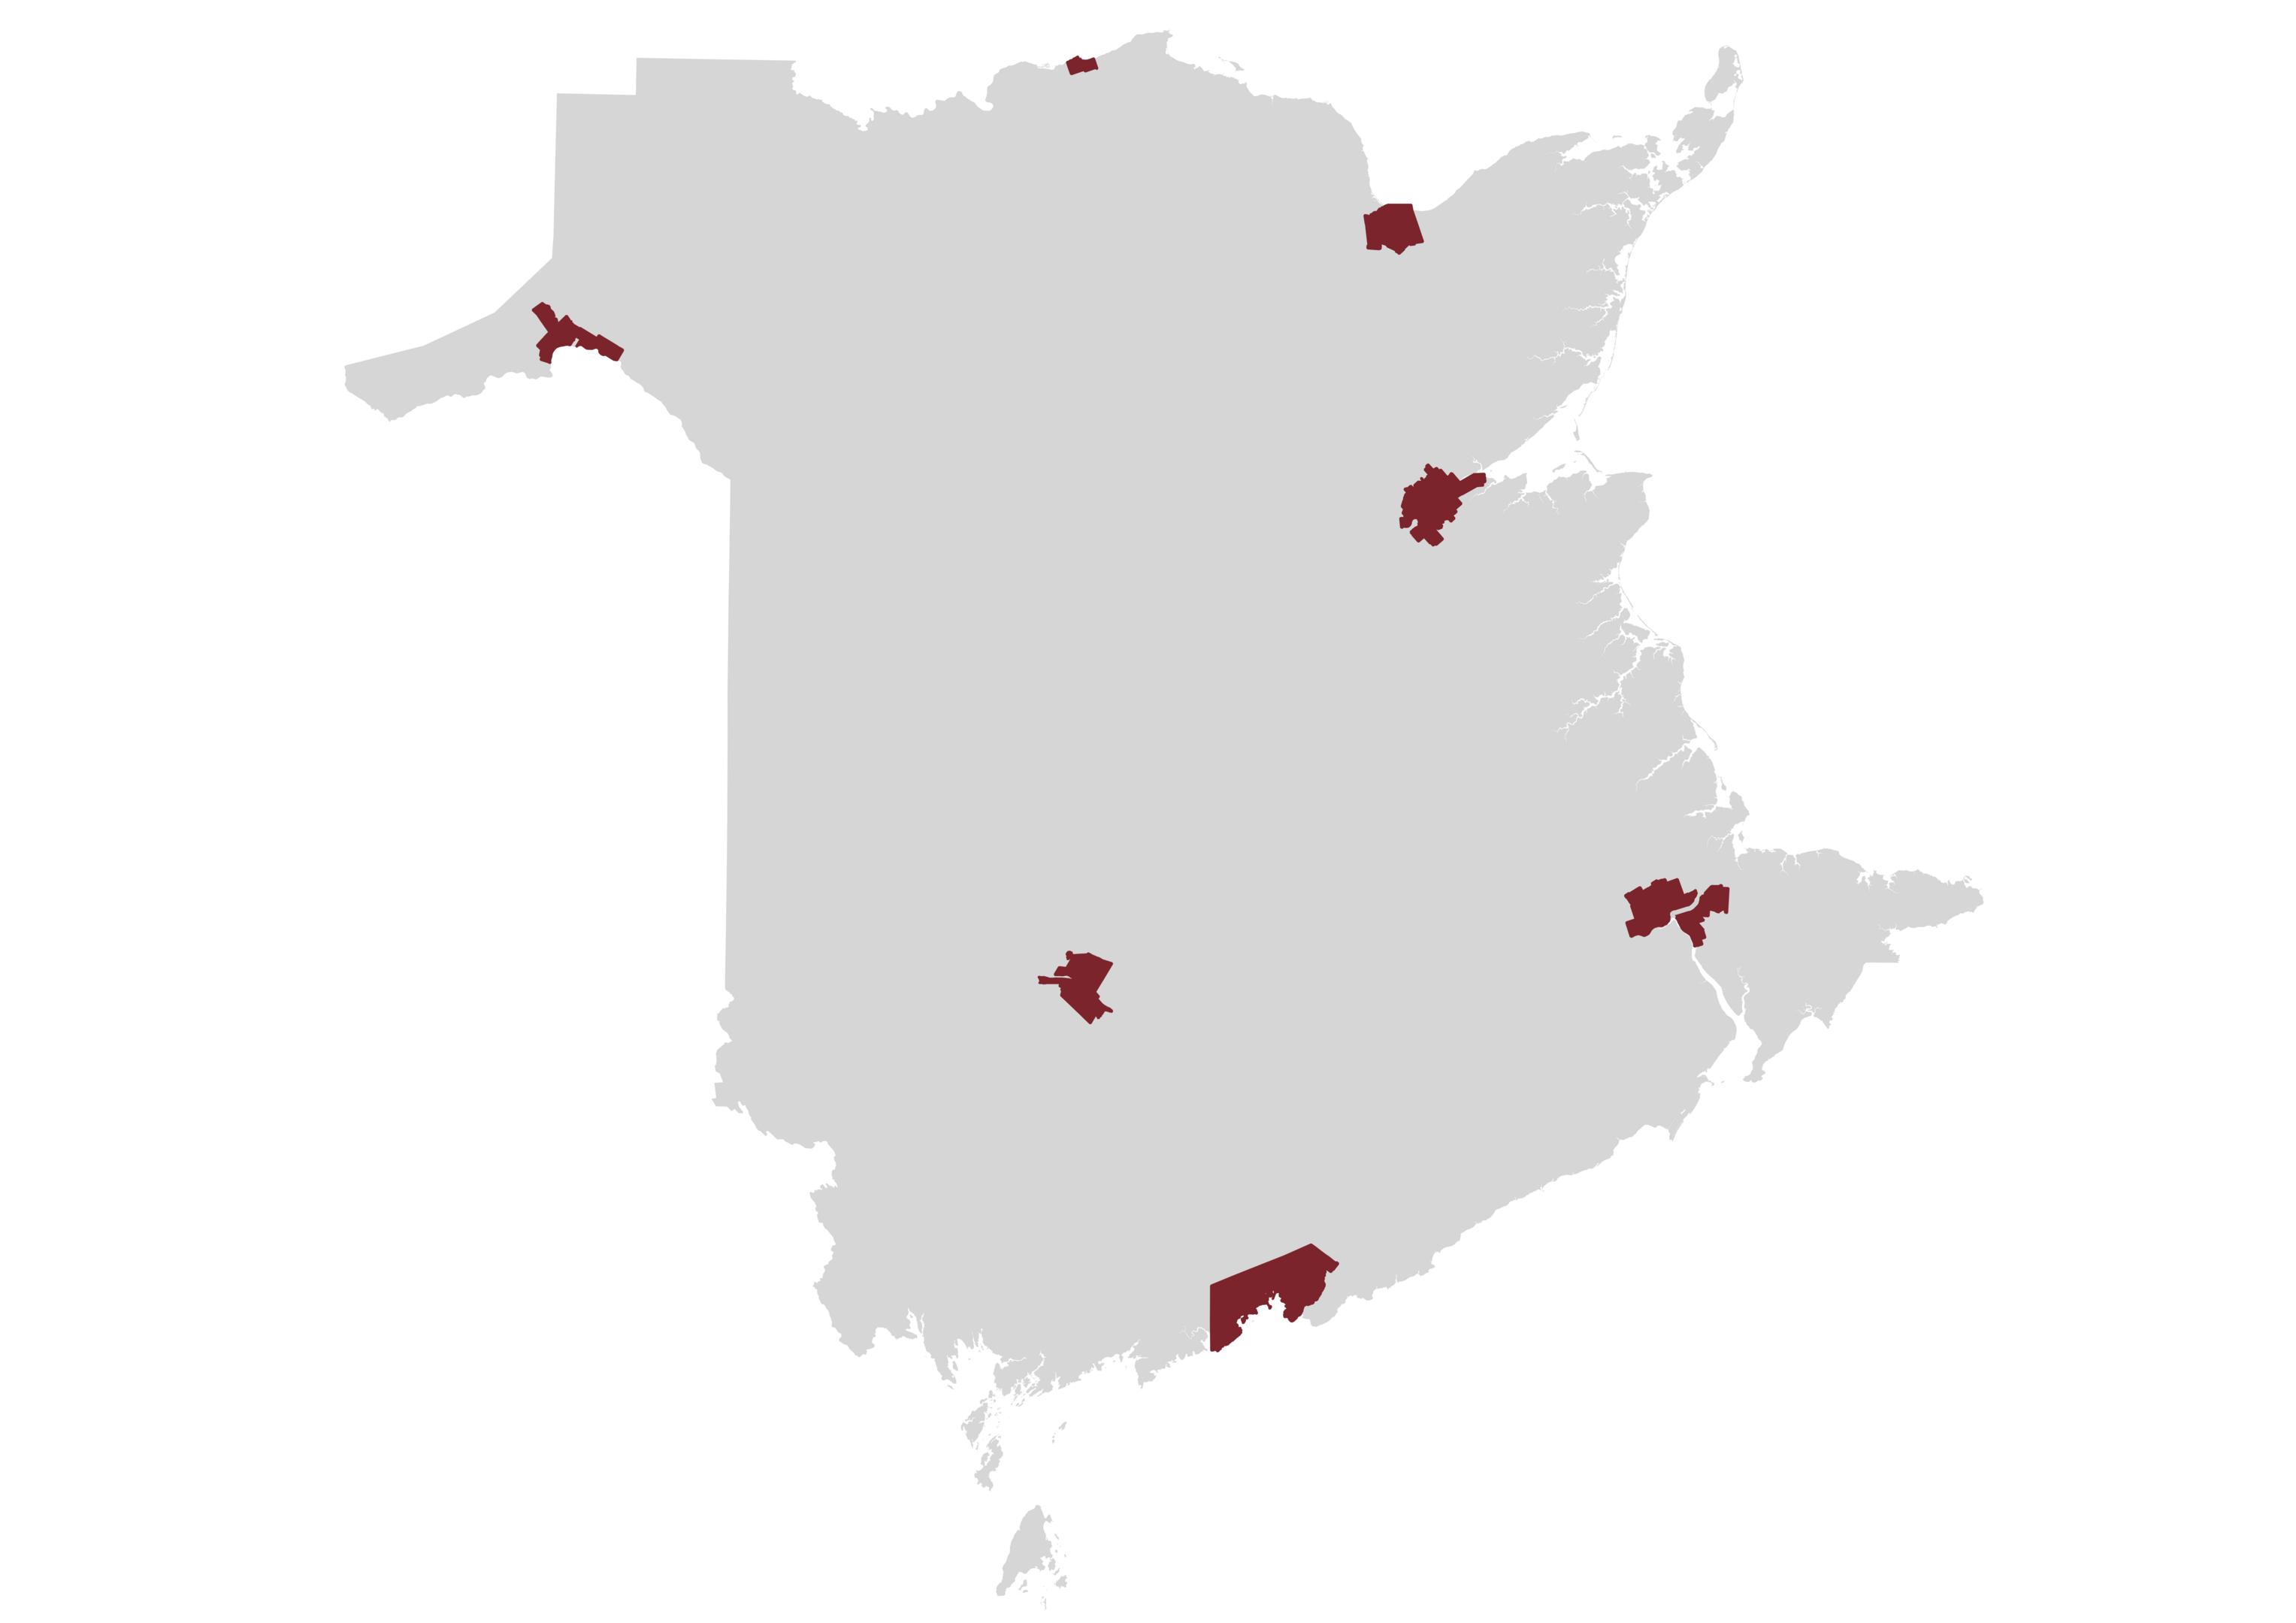
Geography of Child Poverty: Uneven Burdens Across Communities
Child poverty in New Brunswick is not evenly distributed. It varies by region, city, and neighbourhood, revealing deep structural inequities across the province.
In 2023 nearly 1 in 5 Canadian children lived in poverty. New Brunswick had the sixth-highest child poverty rate in the country (fourth among provinces), exceeding the national average.
.
Figure 2. 2023 CFLIM-AT Poverty Rates and % Change from 2022
2023 CFLIM-AT Poverty Rate
% Change From 2022
Source: Statistics Canada. (2025). T1 Family File. Table 11-10-0018-01.
Within New Brunswick, geographic disparities are particularly stark across the province’s eight cities:
Campbellton has the highest child poverty rate at 41.2%.
Bathurst followed with a rate of 33.3%.
Saint John was slightly lower than Bathurst at 30.7%.
Dieppe has the lowest child poverty rate at 15%.
Figure 3 CFLIM-AT Poverty Rates for Cities in New Brunswick
Population: 7,047
Overall: 29.8% 0-17: 41.2% 18-64: 29.4%
: 24.6%
Population: 16,437
Overall: 20%
0-17: 23.8%
18-64: 19.7%
: 18.8%
Population: 63,116
Overall: 19.6%
0-17: 23.3%
18-64: 21.3%
65+: 11.3%
Population: 69,895 Overall: 23.4%
: 30.7%
Population: 12,157
Overall: 25 5%
0-17: 33 3%
18-64: 26 3% 65+: 20 1%
Population: 17,692
Overall: 18.2%
: 22.9% 18-64: 18.2%
: 15%
Population: 79,470
Population: 28,114
: 13 1%
: 15%
: 13 1%
: 10.6%
: 23.3%
: 16.8%
Overall: 22% 0-17: 25.8% 18-64: 22.8% 65+: 14.9%
Source: Statistics Canada. (2025). T1 Family File Table I-13 - Individual data - After-tax low income status of tax filers and dependents (census family low income measure, CFLIM-AT) for couple and lone parent families by family composition, 2023; Statistics Canada. (2023). Census Profile. 2021 Census of Population. Statistics Canada Catalogue no.98-316-X2021001.
These differences are not inevitable. They reflect longstanding patterns of economic restructuring, uneven access to services, housing market pressures, and policy choices that shape opportunity across communities.
The Census Metropolitan Areas (CMAs) of Moncton, Fredericton, and Saint John also reveal sharp contrasts between central cities and surrounding suburban municipalities. For example, the child poverty rate in Dieppe is nearly half that of Moncton. Saint John’s child poverty rate is more than three times higher than the rate in Quispamsis.
Bathurst
Campbellton
Dieppe
Fredericton
Edmundston
Miramichi
Moncton
Saint John
Figure 4 Overall, Child, Working-Age, and Senior Poverty Rates - Moncton CMA
Moncton
Overall: 22%
0-17: 25.8%
18-64: 22.8%
65+: 14.9%
Riverview
Overall: 11.3%
0-17: 15.5%
18-64: 11%
65+: 8.4%
Dieppe
Overall: 13.1%
0-17: 15%
18-64: 13.1%
65+: 10.6%
17.3%
20.6%
17.6%
13.1%
Source: Statistics Canada. (2025). T1 Family File Table I-13 - Individual data - After-tax low income status of tax filers and dependents (census family low income measure, CFLIM-AT) for couple and lone parent families by family composition, 2023.
Figure 5 Overall, Child, Working-Age, and Senior Poverty Rates - Fredericton CMA
Fredericton
19.6%
23.3%
21.3%
11.3%
New Maryland
Overall: 6.3%
0-17: 9.4%
18-64: 5.9% 65+: 4.3%
16.3%
19.6%
16.9%
10.9%
Source: Statistics Canada. (2025). T1 Family File Table I-13 - Individual data - After-tax low income status of tax filers and dependents (census family low income measure, CFLIM-AT) for couple and lone parent families by family composition, 2023.
Grand BayWestfield
Overall: 8.2%
0-17: 10.3%
18-64: 8%
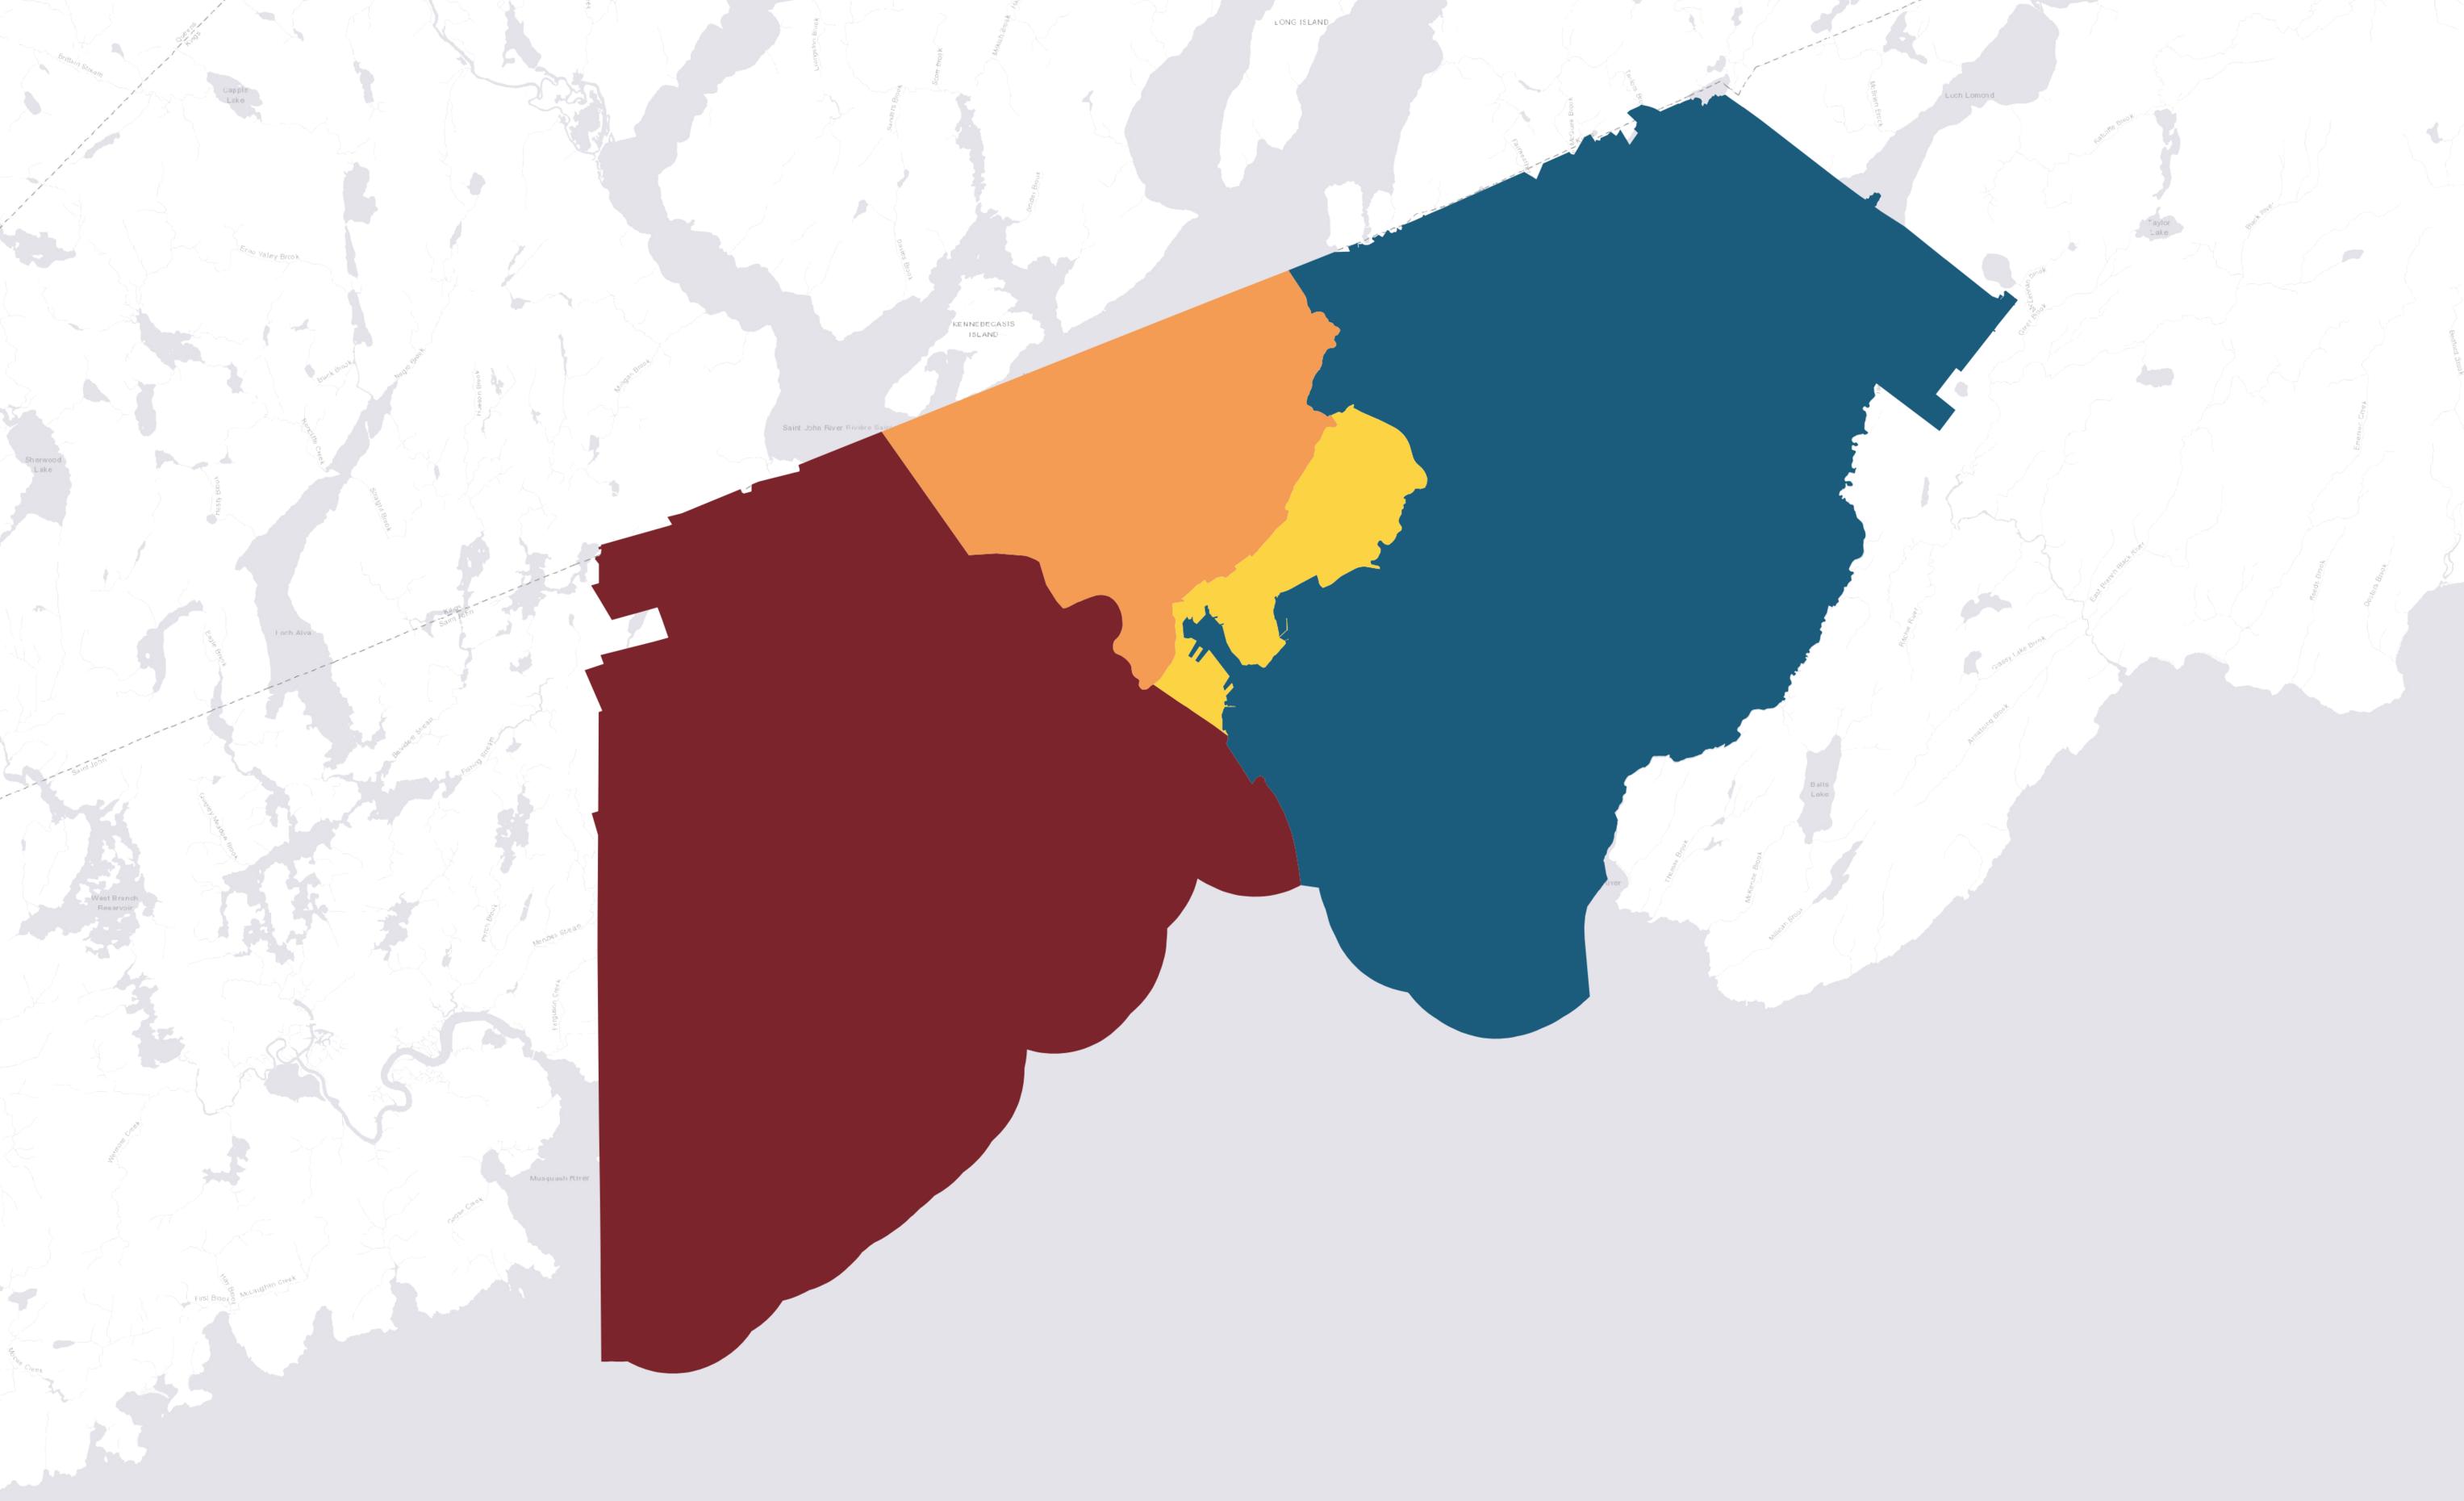
65+: 6.8% Figure 6 Overall, Child, Working-Age, and Senior Poverty Rates - Saint John CMA
Rothesay
Overall: 9.6% 0-17: 13.3%
18-64: 9.6% 65+: 6.2%
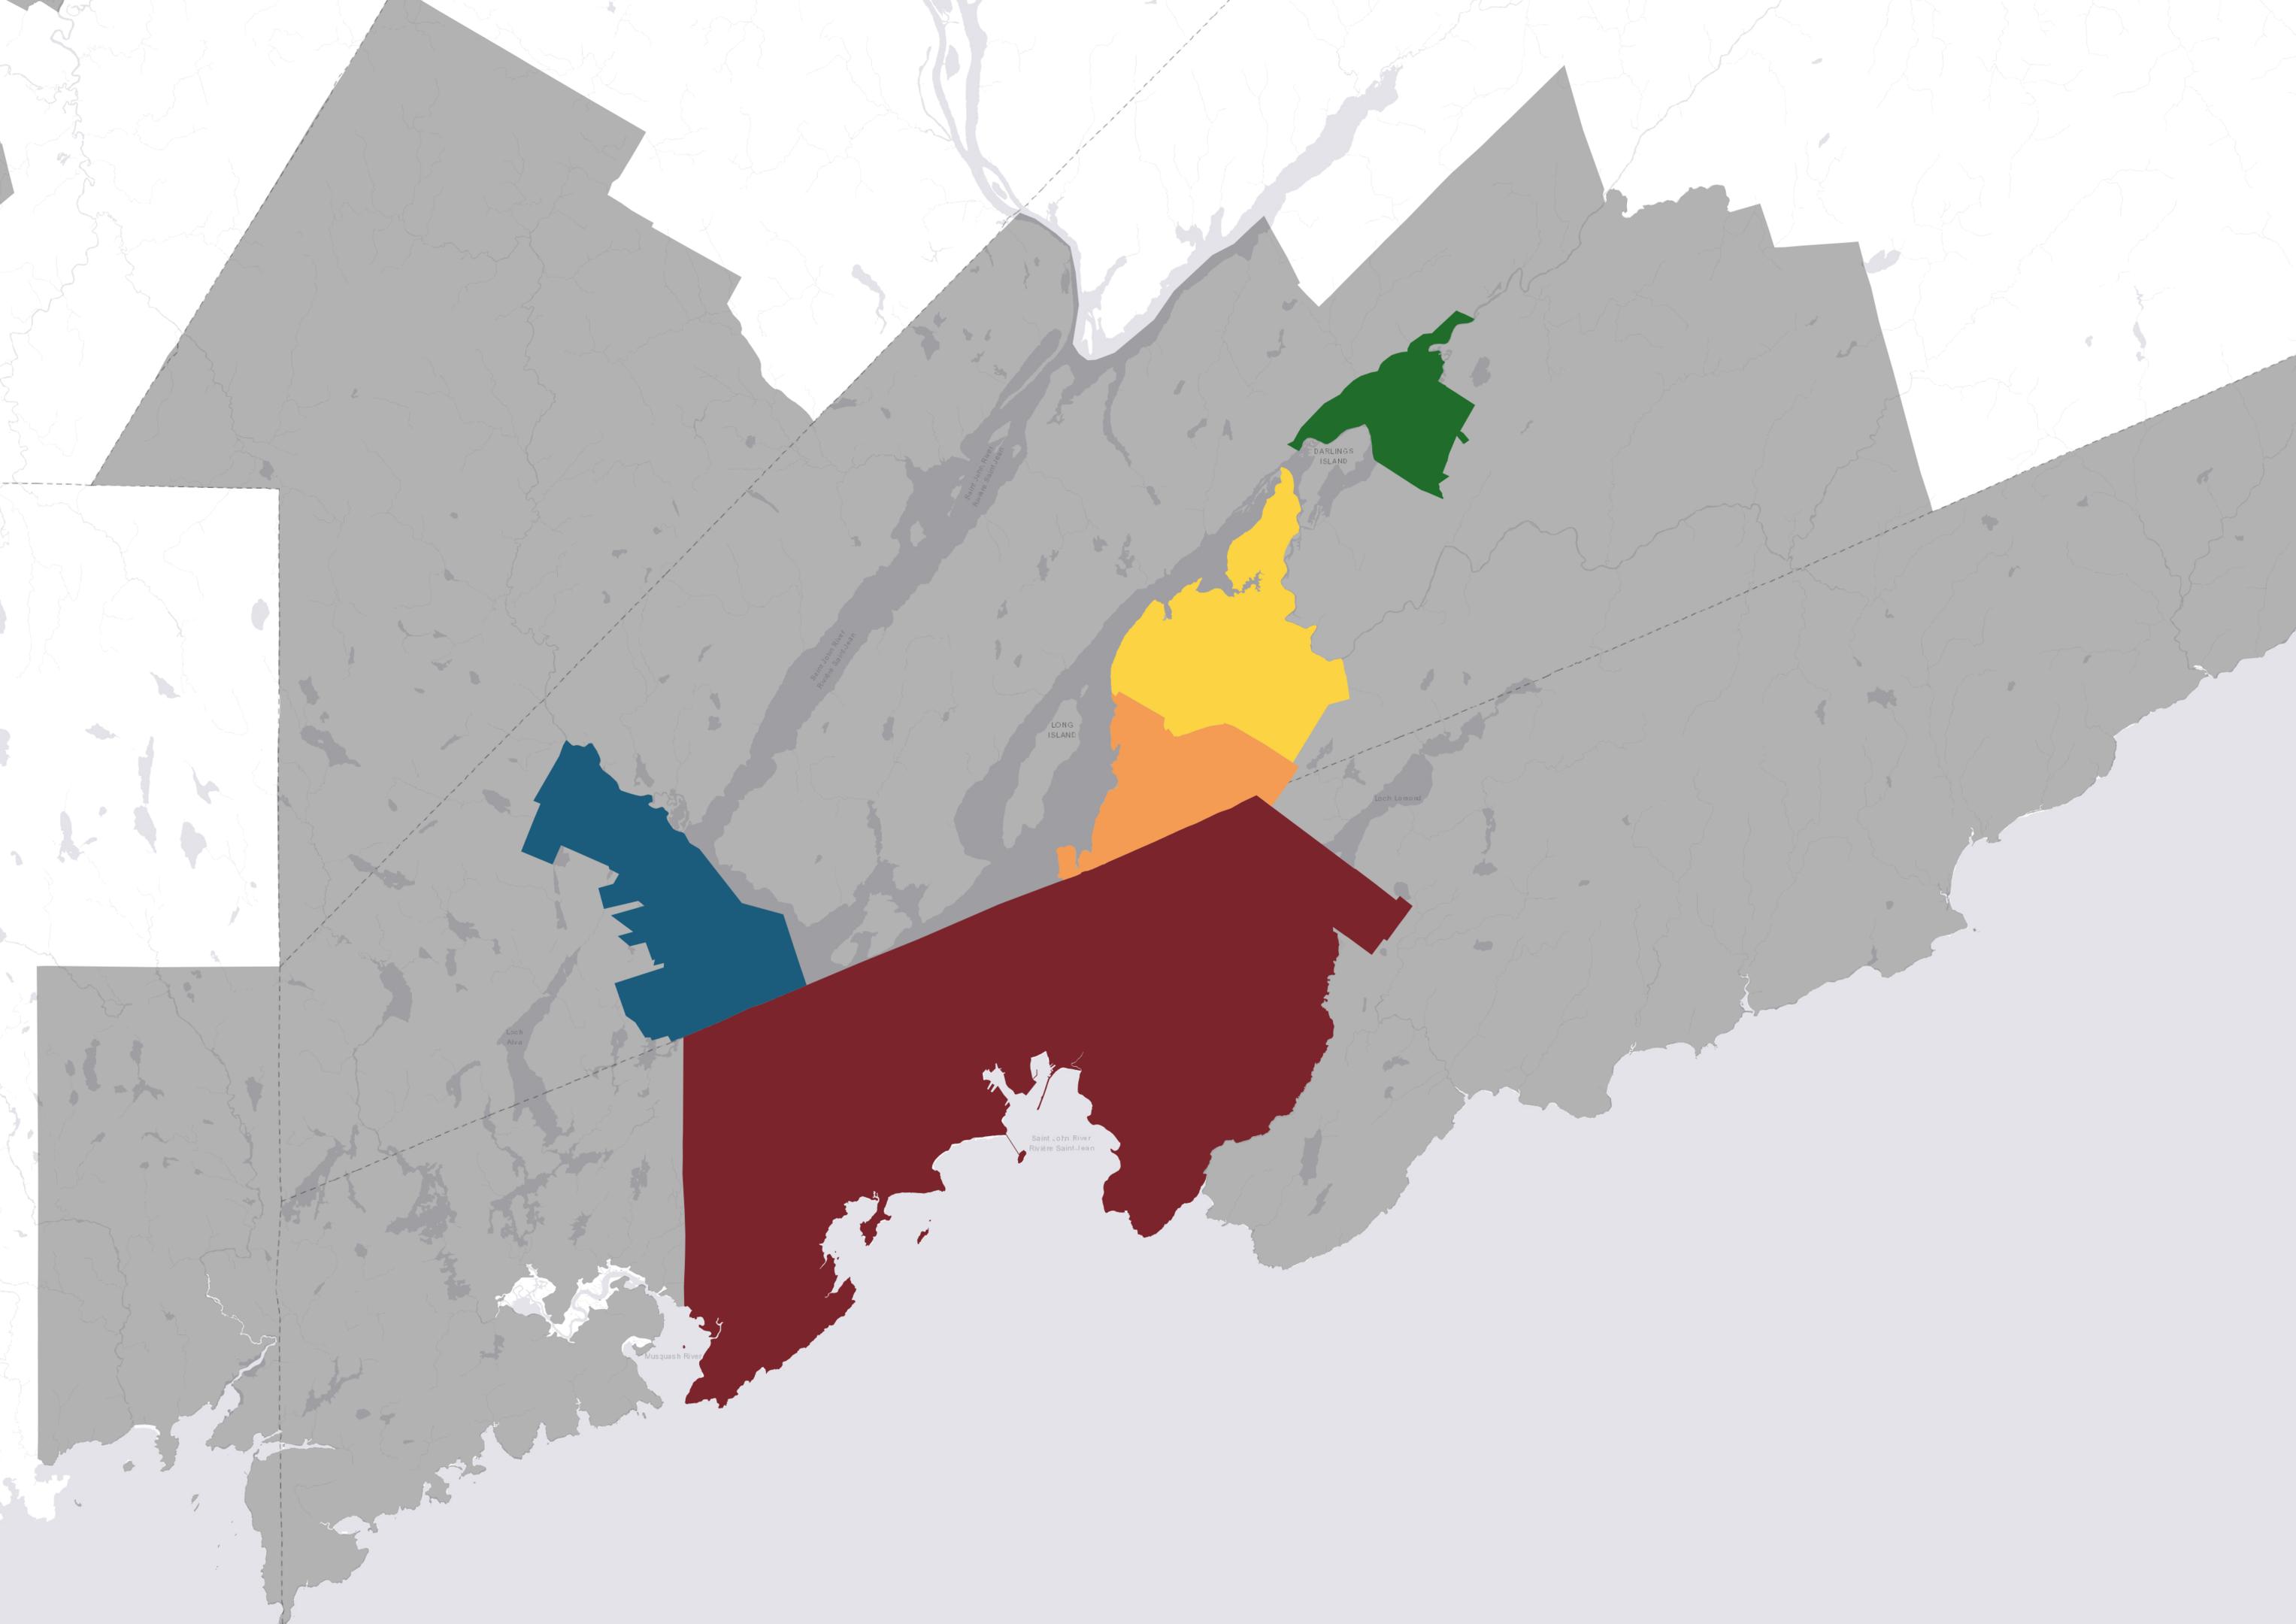
Hampton
11.4%
15.6%
11.5%
7.8%
Quispamsis
Overall: 7.8% 0-17: 10%
18-64: 7.5% 65+: 6.4%
Saint John
Overall: 23.4%
30.7%
23.3%
16.8%
17.3%
22.3% 18-64: 17.2%
12.8%
Source: Statistics Canada. (2025). T1 Family File Table I-13 - Individual data - After-tax low income status of tax filers and dependents (census family low income measure, CFLIM-AT) for couple and lone parent families by family composition, 2023.
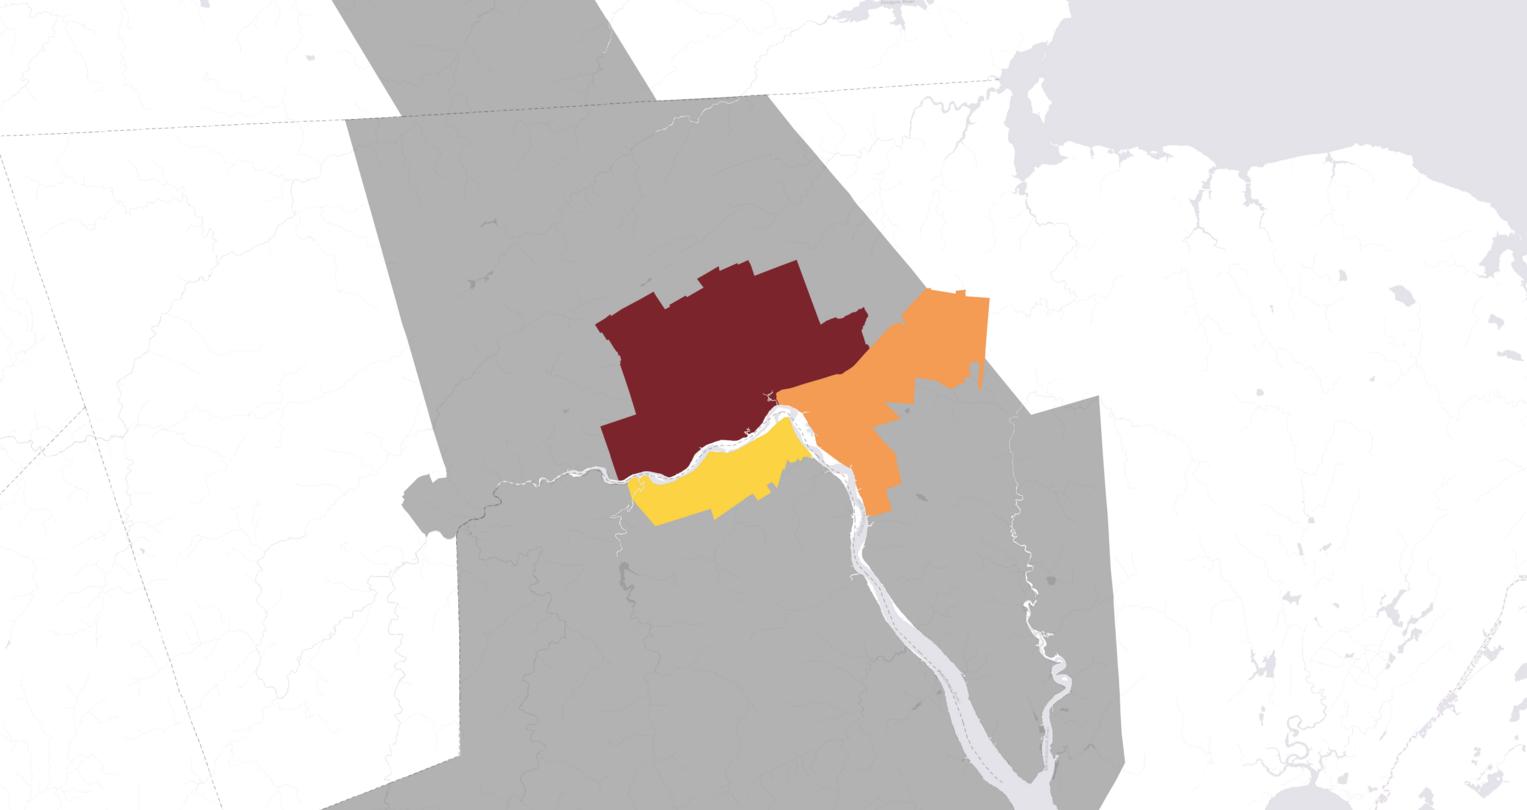
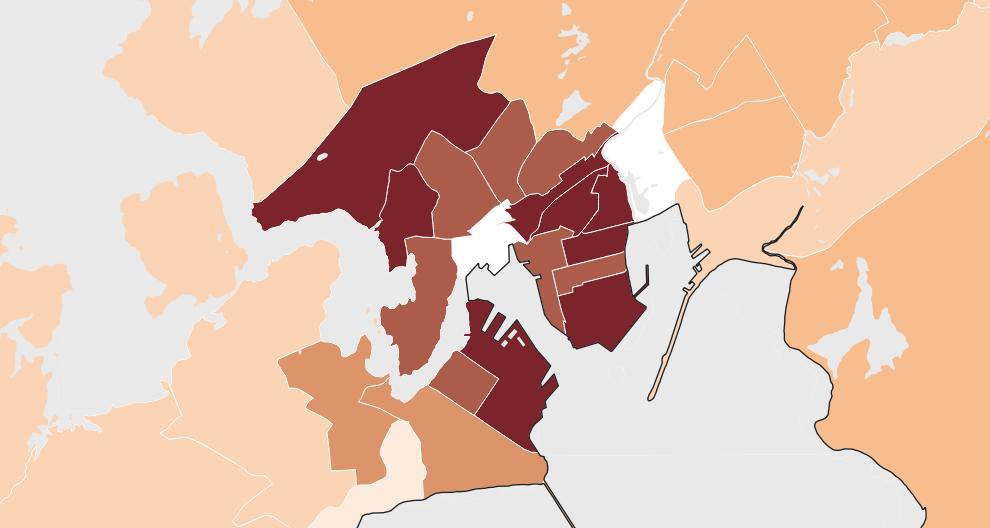
Within the city of Saint John itself, child poverty varies widely across municipal wards. The percentages of children in poverty in Wards 2 and 3 were approximately double New Brunswick’s overall child poverty rate!
Figure 7 Overall, Child, Working-Age, and Senior Poverty Rates - Saint John's Municipal Wards
Ward 2
Overall: 30%
0-17: 40.7%
18-64: 30%
65+: 18.3%
Ward 1
Overall: 13%
0-17: 17.3%
18-64: 12.7%
65+: 10.2%
Ward 4
Overall: 14.9% 0-17: 19.7% 18-64: 14.4%
12.3%
Ward 3
Overall: 34.8%
0-17: 44.8%
18-64: 34.3%
65+: 28.2%
Source: Statistics Canada. (2025). T1 Family File Table I-13 - Individual data - After-tax low income status of tax filers and dependents (census family low income measure, CFLIM-AT) for couple and lone parent families by family composition, 2023; Statistics Canada. (2025). Table F-19 Family data - Census families by family type and family composition including before and after-tax median income of the family, 2023.
Even more dramatic variation emerges at the neighbourhood scale. Across census tracts in New Brunswick’s CMAs, child poverty rates ranged from 7.1% to as high as 75%. In practical terms, this means that some children in New Brunswick are growing up in communities where poverty is ten times more common than in nearby neighbourhoods only a short distance away. Generally, higher poverty rates are concentrated in central city areas, while suburban neighborhoods tend to have lower rates.
“Some communities experience child poverty at rates ten times higher than neighbouring areas only minutes away.”
Grand BayWestfield
Rothesay
Saint John Quispamsis
Child
2023, CFLIM-AT
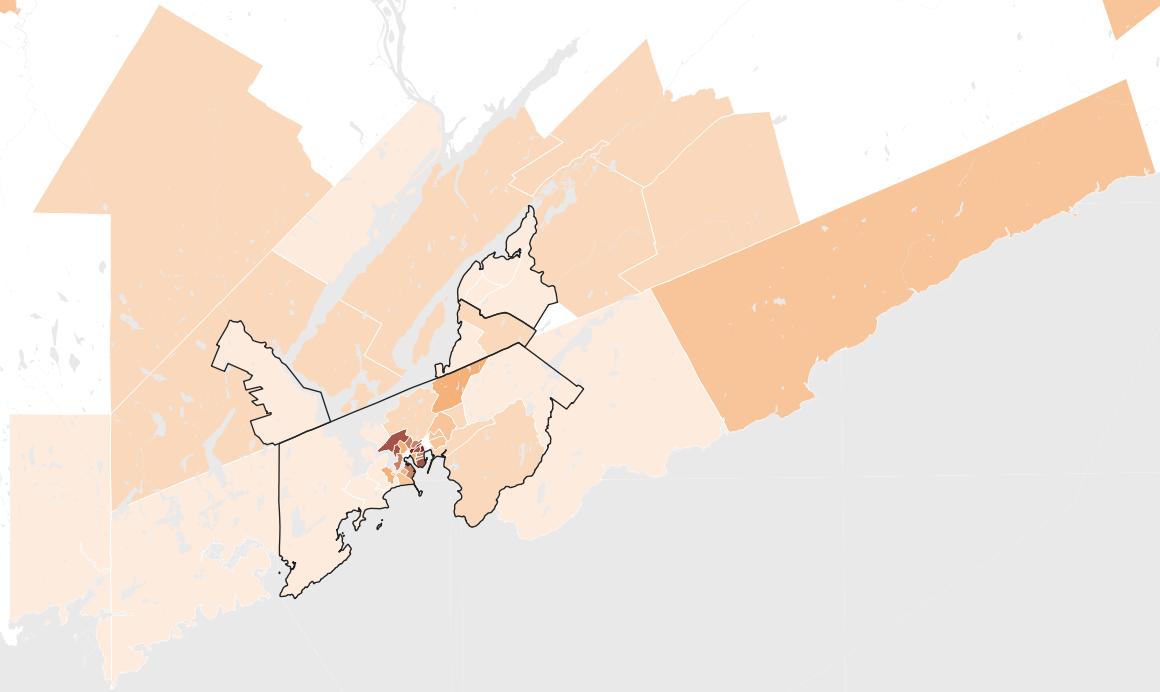
Figure 8.1 Child Poverty Rates by Census Tract in the Saint John CMA Enlarged
Figure 8 Child Poverty Rates by Census Tract in the Saint John CMA Child Poverty Rate, 2023, CFLIM-AT
Source: Statistics Canada. (2024). T1 Family File Table I-13 - Individual data - After-tax low income status of tax filers and dependents (census family low income measure, CFLIM-AT) for couple and lone parent families by family composition, 2023.
Figure 9 Child Poverty Rates by Census Tract in the Moncton CMA
Child Poverty Rate, 2023, CFLIM-AT
Figure 9.1 Child Poverty Rates by Census Tract in the Moncton CMA Enlarged
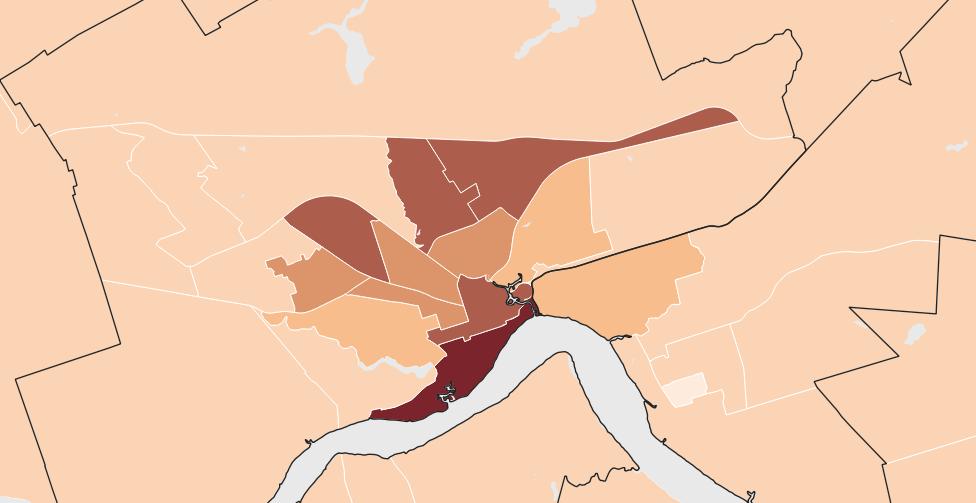
Child Poverty Rate, 2023, CFLIM-AT
10%
- 30%
- 40%
- 50%
Source: Statistics Canada. (2024). T1 Family File Table I-13 - Individual data - After-tax low income status of tax filers and dependents (census family low income measure, CFLIM-AT) for couple and lone parent families by family composition, 2023.
Moncton
Dieppe
Riverview
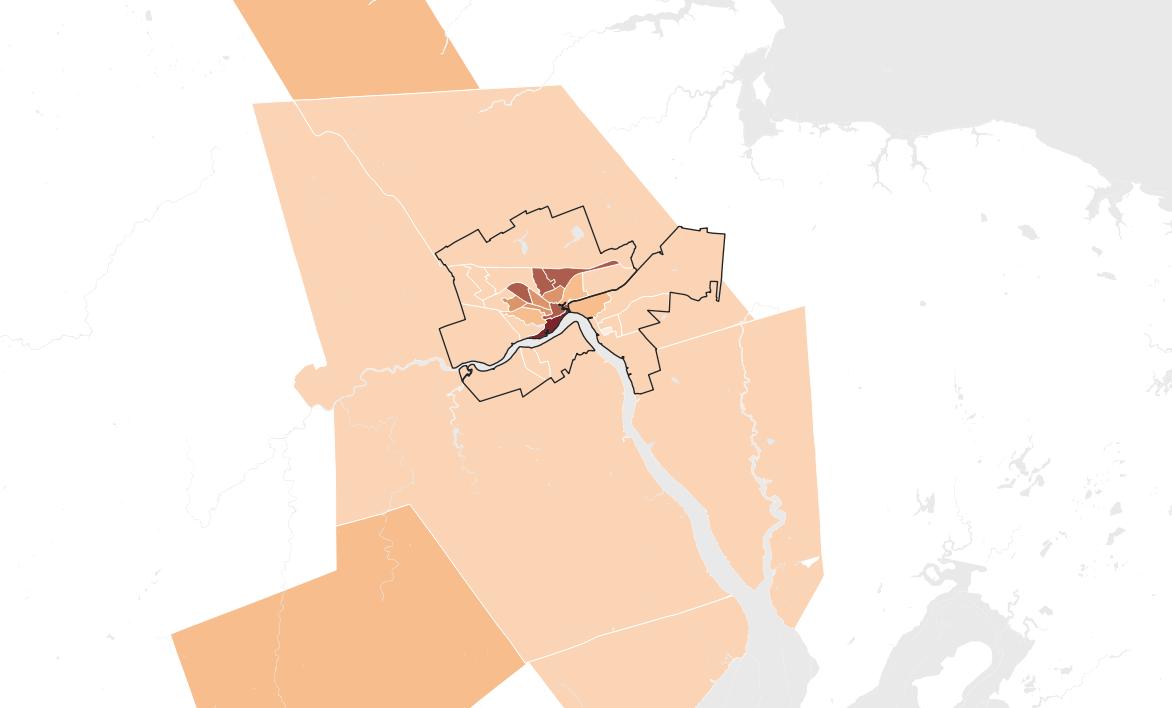
Figure 10 Child Poverty Rates by Census Tract in the Fredericton CMA
Child Poverty Rate, 2023, CFLIM-AT
Figure 10.1 Child Poverty Rates by Census Tract in the Fredericton CMA Enlarged
Child Poverty Rate, 2023, CFLIM-AT
10%
- 20%
- 30%
- 50%
Source: Statistics Canada. (2024). T1 Family File Table I-13 - Individual data - After-tax low income status of tax filers and dependents (census family low income measure, CFLIM-AT) for couple and lone parent families by family composition, 2023.
Fredericton
New Maryland
Part III: Who Is Most Affected?
Poverty in Early Childhood (Under Age 6)
Poverty experienced at any age is harmful, but when it occurs in the earliest stages of a child’s development, it can be especially detrimental. Early childhood poverty is associated with chronic stress, poorer health outcomes, and long-term developmental impacts.[8] It is widely recognized as an adverse childhood experience that can shape a child’s trajectory throughout life.[9]
In New Brunswick, the poverty rate for children under the age of six is higher than the overall child poverty rate. In 2023, 24.4% of children in this cohort lived in poverty, compared with 21.9% of all children.
Figure 11 Poverty Rates for Children Under 6, CFLIM-AT, 2023
Source: Statistics Canada. (2024). T1 Family File, Custom Tabulation.
Raising young children is expensive, particularly in the early years when families face high costs for childcare, housing, and basic needs. New Brunswick has reduced childcare fees and committed to implementing $10-a-day childcare by March 2026.[10] However, significant barriers remain. 17% of children live in “childcare deserts,” where there are less than 3 spaces per 10 children.[11]
Improving the affordability and accessibility of childcare is an effective way to support families with young children and reduce early childhood poverty.
One-Parent Families and Gendered Poverty
Child poverty rates are significantly higher in households headed by one parent. In 2023, the poverty rate for children in one-parent families in New Brunswick was 47.8% (18,780 children), compared with 11.3% (11,930 children) for children in couple families.
Female-led one-parent families experience some of the most severe forms of income inadequacy. They face systemic inequities such as the gender pay gap, limited access to affordable childcare, and concentration in lower-wage sectors, including retail, hospitality, and food service.
Income inequality by family type is apparent across the income distribution. Female one-parent families have the lowest average incomes in the lowest, median, and highest deciles.
200000 Figure 12 Average after-tax incomes of couple, female one-parent, and male one-parent families in the lowest, fifth, and highest deciles, 2023
Source: Statistics Canada. (2024). T1 Family File, Custom Tabulation.
Reducing child poverty in New Brunswick will require targeted supports that reflect the realities faced by lone-parent families, including stronger income supports, affordable childcare, and housing stability.
Indigenous Child Poverty
Indigenous children experience disproportionately high poverty rates in New Brunswick. According to the 2021 Census, 23.9% (2,040) of Indigenous children lived in poverty, compared with 15.3% (19,215) of non-Indigenous children.[12]
Using a limited sample of tax filer data from 2023, the estimated child poverty rate for children living on reserves in New Brunswick is 51.2%.
Figure 13 Child Poverty Rate on Reserves in the Provinces, CFLIM-AT, 2023
SK (18 reserves with data)
MB (32 reserves with data)
AB (18 reserves with data)
NB (10 reserves with data)
NS (8 reserves with data)
PQ (17 reserves with data)
ON (52 reserves with data)
NL (3 reserves with data)
BC (64 reserves with data)
PEI (1 reserves with data)
Source: Statistics Canada. (2025). T1 Family File. Table I-13 - Individual data - After-tax low income status of tax filers and dependents (census family low income measure, CFLIM-AT) for couple and lone parent families by family composition, 2023.
The lasting impacts of colonialism, systemic racism, and intergenerational trauma contribute to these inequities. Poverty for Indigenous children extends beyond inadequate income. It is compounded by barriers such as substandard housing, poorer health outcomes, and unequal access to essential services and opportunities.[13]
As a consequence of poverty and inequality, Indigenous children are overrepresented in the child welfare system. Subsequently, many experience disconnection from culture, language, and community.[14]
Addressing Indigenous child poverty requires sustained, rights-based action developed in partnership with First Nations communities, and rooted in reconciliation, equity, and selfdetermination.
Racialized and Immigrant Child Poverty
Racialized children and children of recent immigrants face elevated risks of poverty, reflecting broader patterns of labour market discrimination, unequal access to resources, and barriers to economic security.
These issues were examined in greater detail in the 2022 Child and Family Poverty Report Card. [15] In the current edition, no new disaggregated data were available to support a meaningful update. For this reason, the data from the 2022 report is provided in Appendix 1.
Part IV: What Is Driving Hardship Now?
Housing Unaffordability
For many years, New Brunswick experienced relatively stable rent increases compared with the rest of Canada. Between 2000 and 2019, annual rent increases averaged no more than 1.4%, with a typical rise of about 1.0% per year.[16] During this period, New Brunswick’s housing affordability trends were more favourable than those seen nationally.
However, the last five years have marked a drastic shift. From 2020 to 2025, rent prices in New Brunswick surged by approximately 44%, erasing two decades of relative stability. Housing costs have become one of the most powerful drivers of affordability struggles for families with children.
“From 2020 to 2025, rent prices in New Brunswick surged by approximately 44%, erasing two decades of relative stability.” Jan-2…Dec-2000Nov-2001Oct-2002Sep-2003Aug-2004Jul-2005Jun-2006May-2007Apr-2008Mar-2009Feb-2010Jan-2011Dec-2011Nov-2012Oct-2013Sep-2014Aug-2015Jul-2016Jun-2017May-2018Apr-2019Mar-2020Feb-2021Jan-2022Dec-2022Nov-2023Oct-2024Sep-2025
Source: Statistics Canada. (2025). Table 18-10-0004-01 Consumer Price Index, monthly, not seasonally adjusted
Historically low vacancy rates and a shortage of affordable rentals have made the housing market increasingly competitive. For low-income households, rising rents leave little room in already stretched budgets, increasing the risk of displacement and housing insecurity.
Figure 14 Change in Rent Costs in New Brunswick by Month (Consumer Price Index)
Vacant vs Occupied Units
Affordability pressures are especially severe for households entering the rental market or seeking new accommodation. Advertised rents for vacant units are significantly higher than the average rents paid in occupied units.
In many communities, asking rents are up to 20% higher. In Saint John, asking rents for twobedroom apartments were 24% higher—the largest gap among New Brunswick’s CMAs.
Table 3 Occupied vs Asking Rents for CMAs in New Brunswick
Rental Unit Type
Source: Canadian Mortgage and Housing Corporation (2025). CMHC Rental Market Survey, Private Apartment Average Rents ($); Statistics Canada (2025). Table 46-10-0092-01 Asking rent prices, by rental unit type and number of bedrooms, experimental estimates
Tenant Protections and Rent Caps
Tenant protections in New Brunswick remain limited. In 2025, the provincial government introduced a 3% rent cap, to be reviewed annually.[17] While this may moderate rent increases for long-term renters, it does not remove the incentive for landlords to end tenancies and increase the rent beyond 3% under a new lease. Rental turnover is a major driver of rising housing costs and contributes to instability for renters, particularly families with children. Stronger tenant protections and a more comprehensive approach to affordability are urgently needed to ensure housing stability.
“Rental turnover is a major driver of rising housing costs and contributes to instability for renters, particularly families with children.”
Rental Wages
One way to understand housing affordability is to translate rent costs into the hourly wage required to afford housing without spending more than 30% of income on rent. This is known as the “rental wage.”[18] The calculation helps emphasize the gap between wages and the cost of housing.
Across New Brunswick’s CMAs, rental wages far exceed the provincial minimum wage. The lowest rental wage is for occupied one-bedroom apartments in Saint John at $19.44 per hour, rising sharply to $23.27 for available units.
Table 4 Rental Wages of Occupied vs Available Units for CMAs in New Brunswick
Rental Unit Type
Rental Wage for Occupied Units Oct-2025
Rental Wage for Asking Rents of Available Units
Source: Canadian Mortgage and Housing Corporation (2025). CMHC Rental Market Survey, Private Apartment Average Rents ($); Statistics Canada (2025). Table 46-10-0092-01 Asking rent prices, by rental unit type and number of bedrooms, experimental estimates
For many communities, rental wages are close to or above the provincial living wage. In 2025, 41% of employees in New Brunswick earned less than the living wage, meaning a substantial share of the workforce cannot afford average rents without severe cost burdens.[19] Moreover, this analysis does not account for groups with more constrained incomes, such as seniors living on limited fixed pensions or individuals and families relying on Social Assistance.
Minimum Wage Hours Needed to Afford Rent
Another way to measure affordability is to calculate how many hours a minimum wage worker must work to afford rent. Housing becomes unaffordable when a person must work more than 40 hours per week simply to stay below the 30% affordability threshold.
Table 5 Number of Work Hours Required Per Week at Minimum Wage to Afford Housing (spend less than 30% of income on rent) for Occupied vs Available Units for CMAs in New Brunswick
Rental Unit Type
CMA
Minimum Wage Work Hours Per Week for Occupied Units Oct-2025 Minimum Wage Work Hours Per Week for Available Units Q3 2025
Source: Canadian Mortgage and Housing Corporation (2025). CMHC Rental Market Survey, Private Apartment Average Rents ($); Statistics Canada (2025). Table 46-10-0092-01 Asking rent prices, by rental unit type and number of bedrooms, experimental estimates
These figures demonstrate that current rents are out of reach for many working households, and even more unattainable for families relying on fixed incomes.
Income Inadequacy and the Depth of Poverty
Poverty is not only about how many families fall below the poverty line, but also about how far below it they live. This is known as the depth of poverty—the gap between a family’s after-tax income and the poverty threshold.
"Poverty is not only about how many families fall below the poverty line, but also about how far below it they live."
In 2023, the after-tax median income for a low-income couple with two children in New Brunswick was $15,514 below the poverty line. In 2020, this gap was $9,642, reflecting the temporary impact of pandemic-era income supports. Once those supports ended, the gap widened again. As inflation and living costs rise faster than incomes, poverty becomes deeper and harder to escape.
"In 2023, the after-tax median income for a low-income couple with two children in New Brunswick was $15,514 below the poverty line."
Figure 15 Depth of Poverty for Low-Income Families in New Brunswick, CFLIM-AT, 2023
Source: Statistics Canada. (2025). T1 Family File. Table 11-10-0020-0; Statistics Canada. (2025). Technical Reference Guide for the Annual Income Estimates for Census Families, Individuals and Seniors. T1 Family File, Final Estimates, 2023.
Low-income families typically have incomes of about two-thirds of the poverty line. During the pandemic, the poverty gap narrowed as a result of temporary income support. By 2023, however, the gap had widened again and, for some family types, had grown larger than it was in 2015. For lone-parent families with one or two children, the depth of poverty is now at its highest level in a decade. Rising living costs and inadequate incomes are erasing years of progress in reducing the severity of poverty among low-income lone-parent families.
"Rising living costs and inadequate incomes are erasing years of progress in reducing the severity of poverty among low-income lone-parent families."
Welfare Incomes and Social Assistance
The Government of New Brunswick provides financial assistance through its Social Assistance program.[20] Eligibility and benefit levels depend on household composition and employability. Despite periodic increases, Social Assistance rates remain inadequate relative to the real cost of living.
In February 2024, the province introduced a temporary $200 monthly Household Supplement to help cover rising shelter and food costs.[21] While this represents a positive step, it is not a substitute for adequate base rates.
Table 6 Social Assistance Rate Schedule Effective April 2025
1 person
2 persons, at least 1 is less than 19
2 adults
($724 designated)
Source: Government of New Brunswick's Department of Social Development Policy Manual.
Welfare incomes include provincial assistance payments as well as federal and provincial child benefits and tax credits. Even with recent increases, total welfare incomes remain well below both the MBM and CFLIM-AT poverty thresholds.
Table 7 Total Welfare Incomes in 2024 and Percent Change 2023 to 2024, Current Dollars
Total Income 2024 Change From 2023
Total Income 2024 Change From 2023 Total Income 2024 Change From 2023
Note: See Welfare in Canada, 2024 from Maytree for definitions of BFE, AISH, MBFE, MSPD, AIM, and MAN.
Source: Laidley, J., & Oliveira, T. (2025). Welfare in Canada, 2024. Maytree.
Table 8 Adequacy of Welfare Incomes in New Brunswick
Adequacy Indicator
MBM (official poverty line) Moncton
Welfare income minus MBM
threshold
Welfare income as % of MBM LIM (Relative Low-Income)
Welfare income minus LIM
Note: 2024 after-tax LIM thresholds are estimates based on increasing the 2023 thresholds to account for inflation.
Source: Laidley, J., & Oliveira, T. (2025). Welfare in Canada, 2024. Maytree.
Recent national analysis confirms that the income inadequacy documented in New Brunswick reflects a broader pattern across Canada. A 2024 review by Maytree finds that total welfare incomes remain well below the Official Poverty Line in every province, leaving families unable to meet basic needs even when federal benefits are taken into account.[22] This national evidence reinforces the findings of this report that rising housing costs, combined with inadequate income supports, are deepening hardship for families with children and increasing the depth of poverty. To improve the well-being of families experiencing poverty, benefit levels must be increased to reflect today’s economy. Social policies must help people get ahead, not just get by.
Food Insecurity
According to the 2023 Canadian Income Survey, 29.5% of New Brunswick households experienced food insecurity—an increase of 3.9% from 2022. Nearly 240,000 people are living in food insecure households in the province.[23] New Brunswick also recorded the highest provincial child food insecurity rate in Canada (tied with Newfoundland and Labrador). 39.9% of New Brunswick children (57,000) lived in food-insecure households.[24]
Food insecurity is especially prevalent among low-income households and families with children. Rising food costs from 2020 to 2025 have left more households wondering how they will secure their next meal and caused an increased reliance on food banks.
In response to affordability pressures, the federal government announced the new Canada Groceries and Essentials Benefit, which replaces the GST Credit and provides a 25% higher benefit amount for five years.[25]
Part V: Inequality, Income Supports, and Structural Reform
Inequality in New Brunswick
Child poverty cannot be separated from broader patterns of inequality. The top 10% of incomeearning families with children held a greater share of income than the bottom 4 deciles combined. The average after-tax income of the top decile was approximately $218,581, compared with $15,702 for the lowest decile.
Figure 16 Percent share of family income by decile, 2023
Source: Statistics Canada. (2025). T1 Family File, Custom Tabulation.
The share of total income going to the lowest decile did not change between 2022 and 2023. In contrast, the second through seventh deciles all saw increases in their income shares, while the highest decile’s share fell from 25.7% to 22.9%. Overall, the distribution of family income became slightly more equal in 2023 compared to 2022. However, despite these modest improvements, the MBM poverty rate still increased, indicating that affordability pressures and inadequate incomes continue to be a major concern for many families.
The Impact of Government Transfers
Government transfers remain one of the most effective tools available to reduce child poverty. Supports such as the Canada Child Benefit, Canada Groceries and Essentials Benefit, and provincial supplements significantly lower poverty rates for families with children.
Figure 17 New Brunswick Child Poverty Rates With and Without Government Transfers, CFLIMAT, 2023
Child Poverty Rate With Government Transfers
Child Poverty Rate Without Government Transfers
Source: Statistics Canada. (2025). T1 Family File, Custom Tabulation.
The Canada Child Benefit (CCB)
The Canada Child Benefit is one of Canada’s most impactful poverty-reduction programs. This government transfer alone reduces the provincial child poverty rate by approximately 10%. However, the CCB has lost effectiveness over time. In 2021, it reduced the child poverty rate by 12 percentage points.
Figure 18 New Brunswick Child Poverty Rates With and Without the Canada Child Benefit, CFLIM-AT, 2023
Child Poverty Rate With CCB
Child Poverty Rate Without CCB
Source: Statistics Canada. (2025). T1 Family File, Custom Tabulation.
Looking Ahead: Guaranteed Basic Income
(32,140 children)
(46,450 children)
In recent years, Guaranteed Basic Income (GBI) proposals have gained renewed attention in Canada, as governments confront persistent poverty alongside rising housing and food costs. GBI is generally understood as an unconditional cash transfer that ensures households have sufficient resources to meet basic needs and reduces the depth of poverty experienced by families living far below the poverty line.[26]
Unlike Universal Basic Income, which provides payments to all residents regardless of income, a GBI model can be targeted to support low-income households.[27]
Funds for the GBI can be reallocated from certain income supports, while complementing existing social, health, and education resources to strengthen Canada’s social safety net.[28]
Guaranteed Basic Income: Targeted income supports those who need it most. Amounts are reduced as income increases.
Universal Basic Income: Income is provided to everyone regardless of earnings. Taxes are used to offset payments among higher-income earners after the fact.
Evidence from pilot projects and income security research suggests that stronger income floors can improve health outcomes, reduce financial stress, and increase stability for families.[29] At the same time, questions remain about program design, cost, and interaction with existing supports.
Momentum for renewed discussion is emerging across Canada. One current proposal is Bill S206, which would require the federal government to develop a national framework for a basic income program.[30] Several provinces, including Prince Edward Island and Newfoundland and Labrador, have also created regional models for GBI programs.[31][32]
For New Brunswick, the immediate priority remains alleviating the affordability crisis through increasing housing stability, adequate Social Assistance rates, and strengthened child benefits. Over the longer term, however, structural reforms that ensure no child grows up without access to basic necessities should remain part of the policy conversation.
A Guaranteed Basic Income is not a substitute for affordable housing, childcare, or public services, but it may represent one component of a more comprehensive poverty reduction strategy.
Recommendations
The primary level(s) of government responsible for each action is indicated in parentheses (Federal, Provincial, Municipal).
Restore Housing Stability for Families with Children
Housing affordability has become the single most significant driver of hardship for families. Stabilizing housing costs is essential to reducing child poverty.
Strengthen tenant protections to reduce displacement and excessive turnover-driven rent increases. As an example, in Quebec, new tenants are disclosed the rent paid by the previous occupants, and can contest unreasonable cost increases. (Provincial)
Implement as-of-right zoning by-laws in cities and neighbouring suburban municipalities. Applications of as-of-right zoning by-laws include residential areas where single family homes are allowed as well as accessory dwellings, mobile homes, and buildings up to 6 or 4 units. (Municipal)
Increase subsidies and incentives to non-profit housing developers to purchase, renovate, and build affordable housing. (Provincial & Municipal)
Ensure Income Supports Reflect the Real Cost of Raising Children
Income support must prevent deep poverty, not merely manage it.
For income-tested support programs with strict cutoffs, ensure that the thresholds align with the Low Income Measure After-Tax. Thresholds should also be adjusted for household size. (Federal & Provincial)
Reform income-tested benefits to reduce the depth of poverty and avoid sharp cut-offs that penalize families as incomes increase. (Federal & Provincial)
Address Low Wages and Gendered Income Inequality
Low wages and wage gaps contribute directly to child poverty.
Approve annual increases to the minimum wage that move it closer to a living wage. Periodically evaluate the cost of living outside of the Consumer Price Index to ensure that the adjustments to the minimum wage reflect the reality of low-wage workers. (Provincial)
Implement pay transparency legislation to reduce gender-based wage discrimination. (Provincial)
Expand Affordable Childcare for Families Most at Risk
Affordable childcare is essential infrastructure for poverty reduction.
Prioritize affordable childcare spaces for low-income and lone-parent households. (Federal & Provincial)
Ensure that provincial budget cuts do not prevent hitting the target of reaching an average $10-a-day childcare cost by April 2026. (Federal & Provincial)
Target Supports to Children Facing the Deepest Poverty
Universal programs alone are not sufficient to address persistent and concentrated child poverty.
Develop targeted, place-based initiatives in collaboration with Indigenous communities and other disproportionately affected groups to help address intergenerational poverty and structural inequities. Factors include exclusionary zoning, service gaps, inadequate income supports, and barriers to stable employment. (Federal, Provincial & Municipal)
Explore Structural Income Security Reforms, Including Guaranteed Basic Income
Structural reform is necessary to reduce persistent and intergenerational poverty.
Canada, in consultation with the provinces and territories, should consider guaranteed basic income as a means to ensure no child grows up without access to basic necessities. (Federal & Provincial)
Ensure that any income security reform is one component of a more comprehensive poverty reduction strategy and not a substitute for affordable housing, childcare, or public services. (Federal & Provincial)
References
[1] Hooper, C. (2010). Federal Poverty Reduction Plan: Working in Partnership Towards Reducing Poverty in Canada. House of Commons. https://www.ourcommons.ca/Content/Committee/403/HUMA/Reports/RP4770921/humarp07/h umarp07-e.pdf
[2] Campaign 2000. (2026). History. https://campaign2000.ca/about-us/our-story/
[3] UNICEF Canada. (2023). UNICEF Report Card 18: Canadian Companion, Child Poverty in Canada: Let’s Finish This. UNICEF Canada. https://www.unicef.ca/sites/default/files/202312/UNICEFReportCard18CanadianCompanion.pdf
[4] Government of New Brunswick. (2010). Economic and Social Inclusion Act. https://laws.gnb.ca/en/document/cs/E-1.105
[5] Government of Canada. (2022). Dictionary, Census of Population, 2021: Market Basket Measure (MBM). Statistics Canada. https://www12.statcan.gc.ca/censusrecensement/2021/ref/dict/az/definition-eng.cfm?ID=pop165.
[6] Statistics Canada. (2025). After-tax low income status of tax filers and dependants based on Census Family Low Income Measure (CFLIM-AT), by family type and family type composition. https://doi.org/10.25318/1110001801-eng. Note: data for smaller geographies not publicly available is provided by Campaign 2000 and sometimes available through the Community Data Program at https://communitydata.ca/.
[7] Campaign 2000. (2024). 2024 Report Card on Child and Family Poverty in Canada: Ending Child Poverty: The Time Is Now. https://campaign2000.ca/wp-content/uploads/2024/11/EndingChild-Poverty-The-Time-is-Now-2023-Report-Card-on-Child-and-Family-Poverty-in-Canada-Nov18-2024.pdf
[8] Hughes, M., & Tucker, W. (2018). Poverty as an Adverse Childhood Experience. North Carolina Medical Journal, 79(2). DOI: 10.18043/ncm.79.2.124
[9] Ibid.
[10] Government of New Brunswick. (2021). Canada-New Brunswick Canada-Wide Early Learning and Child Care Agreement: New Brunswick Action Plan 2021-2023. Government of New Brunswick; Government of Canada. https://www2.gnb.ca/content/dam/gnb/Departments/ed/pdf/ELCC/action-plan-2021-2023.pdf
[11] David Macdonald. (2025). Cash cow: Assessing child care space creation progress. Canadian Centre for Policy Alternatives. https://www.policyalternatives.ca/news-research/cash-cowassessing-child-care-space-creation-progress/
[12] Statistics Canada. (2024). Target group profile of the Indigenous identity population, Census, 2021. Community Data Program (CDP). https://communitydata.ca/data/target-group-profileindigenous-identity-population-census-2021
[13] Government of Canada. (2023). An update on the socio-economic gaps between Indigenous Peoples and the non-Indigenous population in Canada: Highlights from the 2021 Census. https://www.sac-isc.gc.ca/eng/1690909773300/1690909797208
[14] Gough, P., Trocmé, N., Brown, I., Knoke, D., & Blackstock, C. (2005). Pathways to the overrepresentation of Aboriginal children in care. Centre of Excellence for Child Welfare. https://cwrp.ca/sites/default/files/publications/AboriginalChildren23E.pdf
[15] Atcheson, H., & Driscoll, C. (2023). New Brunswick’s 2022 Child Poverty Report Card. Human Development Council. https://sjhdc.ca/wp-content/uploads/2023/02/NB-Child-Poverty-ReportCard-2022-1.pdf
[16] Statistics Canada. (2026). Table 18-10-0005-01 Consumer Price Index, annual average, not seasonally adjusted. https://doi.org/10.25318/1810000501-eng
[17] Government of New Brunswick. (n.d.). Rent increases. https://www.gnb.ca/en/topic/familyhome-community/housing-property/increase.html
[18] Lee, M., & Macdonald, D. (2025). Making Rent: The CCPA’s rental wage update 2024. Canadian Centre for Policy Alternatives. https://www.policyalternatives.ca/newsresearch/making-rent-the-ccpas-rental-wage-update-2024/
[19] Human Development Council. (2025). Labour in New Brunswick Data Snapshot. https://sjhdc.ca/wpcontent/uploads/2025/06/Low-Wage-Employees-Infographic.pdf
[20] Government of New Brunswick. Social Assistance Program. https://www2.gnb.ca/content/gnb/en/services/services_renderer.10295.Social_Assistance_Progra m.html
[21] Government of New Brunswick. (2024). Social Development Annual Report 2023-2024. https://www.legnb.ca/content/house_business/61/1/tabled_documents/2024-1211%20Social%20Development,%202023-2024.pdf
[22] Laidley, J., & White, A. (2025). From data to action: Policy implications of Welfare in Canada, 2024. Maytree. https://maytree.com/wp-content/uploads/Welfare_in_Canada_2024_brief.pdf
[23] Statistics Canada. (2025). Table 13-10-0835-01 Food insecurity by selected demographic characteristics. https://doi.org/10.25318/1310083501-eng
[24] Ibid.
[25] Department of Finance Canada. (2026). The new Canada Groceries and Essentials Benefit. Government of Canada. https://www.canada.ca/en/department-finance/news/2026/01/the-newcanada-groceries-and-essentials-benefit.html
[26] Pate, K. (n.d.). Guaranteed Livable Basic Income. https://senpate.sencanada.ca/en/currentwork/s-206/
[27] Simpson, W., Stevens, H., Stevens, L., & Emery, H. (2022). A Guaranteed Basic Income for Canadians: Off the Table or Within Reach? The School of Public Policy Publications, 15(1), 1-23. http://dx.doi.org/10.11575/sppp.v15i1.75092
[28] Ammar, N., & Laurin, M. (2025). A Distributional Analysis of a National Guaranteed Basic Income - Update. Office of the Parliamentary Budget Officer. https://www.pbodpb.ca/en/publications/RP-2425-029-S--distributional-analysis-national-guaranteed-basicincome-update--analyse-distributive-un-revenu-base-garanti-echelle-nationale-mise-jour
[29] Pate, K. (n.d.). Guaranteed Livable Basic Income: Spend Less on Poverty, Invest More in People. Senate of Canada. https://senpate.sencanada.ca/media/rtffck1n/spend-less-investmore_glbi_full-booklet_2025-03-05.pdf
[30] Parliament of Canada. (n.d.). S-206, 45th Parliament, 1st session: An Act to develop a national framework for a guaranteed livable basic income. LEGISinfo. https://www.parl.ca/legisinfo/en/bill/45-1/s-206
[31] Boadway, R., Corak, M., David, K., Emery, H., Forget, E., Halpenny, C., Koebel, K., Robidoux, B., Simpson, W., & Stevens, H. (2023). A Proposal for a Guaranteed Basic Income Benefit in Prince Edward Island. https://www.gbireport.ca/
[32] Basic Income NL. (n.d.). A Basic Income for Newfoundland and Labrador: Opportunities, Options, and Analysis. https://www.basicincomenl.ca/
Appendix 1 Racialized Child Poverty
“Racialized” refers to people that are non-Caucasian or non-white. It is used increasingly to replace the term “visible minorities.” Census data from 2021 reveals a high poverty rate for children in racialized populations; 30.7% (3,360) of racialized children (aged 0-14) in New Brunswick are living in poverty. The rate of racialized children in poverty in the province is twice the national rate for racialized children of 15.1%.
Heightened poverty rates for children and families in racialized groups result from systemic and structural racism. These refer to racial discrimination that is pervasive and deeply embedded within systems, laws, policies, and programs. They perpetuate the marginalization and oppression of racialized people in society.
The overrepresentation of racialized children in poverty is particularly evident among subsets of this population. In 2021, Arab children had the highest poverty rates (56.1%), followed by Korean children (43.1%), Latin American children (32%), Black children (31.5%), and Chinese children (31.5%).
"1 in 3 racialized children lived in poverty in New Brunswick."
Figure 19 Percent of children (0-14) in poverty for select racialized groups
Source: Statistics Canada. (2022). Census 2021, Custom Tabulation.
Many of New Brunswick’s racialized children are newcomers. According to the 2021 Census, 34.9% (2,175) of immigrant children aged 0-17 lived in poverty.
Source: Statistics Canada. (2022). Census 2021. Table 98-10-0314-01.
Appendix 2 Child Poverty Rates by Postal City
Table 9 Child Poverty Rates by Postal City, CFLIM-AT 2023
Postal City ALLARDVILLE
BATHURST
BELLEDUNE
BERESFORD
BLOOMFIELD KINGS CO
BOUCTOUCHE
BURNT CHURCH FIRST NATION BURTON BURTTS CORNER
CAMPBELLTON CAP-PELE
CARAQUET
CHIPMAN
CLAIR
COCAGNE
COLPITTS SETTLEMENT
DALHOUSIE
DIEPPE
DOAKTOWN
DURHAM BRIDGE EDMUNDSTON
Postal City EEL
GRAND BAY-WESTFIELD
Postal City
NACKAWIC
NEGUAC
ANORTON
OROMOCTO
PERTH-ANDOVER
PETITCODIAC
PLASTER ROCK
QUISPAMSIS
RICHIBUCTO
RIVERVIEW
RIVIÈRE-VERTE
ROTHESAY
RUSAGONIS
SACKVILLE
SAINT JOHN
SAINT-ANDRÉ
SAINT-BASILE
SAINT-LOUIS-DE-KENT
SAINT-QUENTIN
SAINTE-ANNEDE-MADAWASKA
SAINTE-MARIE-DE-KENT
TOBIQUE FIRST NATION TRACADIE-SHEILA
Note: Locations with less than 50 children in low income are excluded form the data.
Source: Statistics Canada. (2024). T1 Family File Table I-13 - Individual data - After-tax low income status of tax filers and dependents (census family low income measure, CFLIM-AT) for couple and lone parent families by family composition, 2023.
Prepared by Liam Fisher, Heather Atcheson, and Randy Hatfield with the Human Development Council, a social planning council that coordinates and promotes social development in New Brunswick. Copies of the report are available from:

HUMAN DEVELOPMENT COUNCIL
In partnership with: