
Chapter 2--Basic Descriptive Statistics: Percentages, Ratios and Rates, Frequency Distributions
Student: ___________________________________________________________________________
1. The purpose of univariate descriptive statistics is to
A. summarize relationships between many variables.
B. display the essential meaning of variables measured at the interval-ratio level.
C. combine nominal and discrete variables.
D. summarize a single variable.
2. To calculate a proportion, the number of cases in any category (f) is divided by
A. the total number of categories (k).
B. the number of cases in all categories (N).
C. the cases in that category (f).
D. the number of cases in adjacent categories (k-1).
3. Which of the following is an impossible value for a percentage?
A. 0.0%
B. 47.458923%
C. 110.00%
D. 0.05%
4. Forty of every two hundred students attend all of their classes. What percentage of the student body is this?
A. 5%
B. 50%
C. 2%
D. 20%
5. Twenty-three of the 50 states rejected a proposed constitutional amendment to make the house fly the National Insect. What percentage is this?
A. 23%
B. 25%
C. 46%
D. 54%
6. To be converted to a percentage, the proportion must be multiplied by
A. 10.
B. 100.
C. 1000.
D. any of these
7. The sum of the proportions for all categories of a variable will be
A. 100.00.
B. 10.00.
C. 1.00.
D. 0.10.
8. When working with a very small number of cases, it is usually preferable to report
A. percentages.
B. proportions.
C. fractions.
D. actual frequencies.
9. The ratio of men to women in a karate class is 3.3:1. If there are 100 women, how many men are there?
A. 33
B. 66
C. 133
D. 330
10. A class has 20 men and 10 women. The ratio of women to men is
A. 2 to 1.
B. 1 to 2.
C. 20%.
D. .2.
11. To find the ratio of smokers to non-smokers, you would
A. divide the number of non-smokers by the number of smokers.
B. add them together and divide by the number of smokers.
C. divide the number of smokers by the number of non-smokers.
D. multiply the number of smokers by the total number of people.
In Table 2.1, what percentage of Community A are Republicans?
A. (103/264) ´ 100 = 39.02
B. (103/17) ´ 100 = 605.88
C. (264/328) ´ 100 = 80.49
D. (103/135) ´ 100 = 76.30
In Table 2.1, what is the ratio of Socialists to Democrats in Community B?
A. 11:21
B. 11:64
C. 64:11
D. 9:11
In Table 2.1, which is the correct fraction for determining the proportion of Independents in community B?
A. 15/17
B. 15/264
C. 64/15
D. 15/64
15.
In Table 2.1, which community has the higher proportion of Independents?
A. Community A
B. Community B
C. Neither
D. This proportion can't be determined from the information given.
In Table 2.1, what percentage of Democrats lives in community B?
A. (21 / 64) ´ 100 = 32.8
B. (21/328) ´ 100 = 6.4
C. (21/156) ´ 100 = 13.5
D. (64/264) ´ 100 = 24.2
In Table 2.1, what is the ratio of Independents to Socialists in Community A?
A. 15:11
B. 17:9
C. 9:17
D. 17:264
18. The crude birth rate of a city that has 250 births in a year and a population of 7500 would be found by using which of the following?
A. crude birth rate = (250/7500) ´ 1000
B. crude birth rate = 7500/250
C. crude birth rate = (1000/7500) ´ 250
D. crude birth rate = (250/1000) ´ 7500
19. The homicide rate for a city is reported as 23.89. This means that
A. for every homicide, there were 23.89 victims.
B. for every 100,000 people in the population there were 23.89 homicides.
C. the homicide rate is rising.
D. there was an average of 23.89 homicides each month.
20. A city of 1567 people had 34 auto thefts last year. The auto theft rate for this city
A. cannot be determined from the information given.
B. is falling.
C. is (34/1567) ´ 100,000.
D. is (100,000 ´ 1567)/34.
21. City A (population = 1567 people) had 34 auto thefts last year. City B (population = 34,567) had 40 auto thefts in the same time period and City C (population = 156,980) had 70 auto thefts. Which city had the highest RATE of auto theft?
A. City A
B. City B
C. City C
D. More information is needed to answer this question.
22. Proportions and percentages, ratios and rates are all ways of expressing
A. concise distributions of a variable.
B. data without leaving out any details.
C. relative frequencies.
D. raw frequencies.
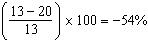
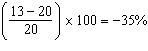
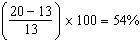
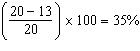
23. A nation had a birth rate of 20 in 1990. The rate fell to 13 in 2000. What was the percentage change?
D.
24. A police department reports that the number of reported rapes in their jurisdiction increased by 100% over the past decade. This means that the number of reported rapes today is
A. double the number 10 years ago.
B. actually about the same as 10 years ago.
C. equal to the number 10 years ago plus 50%.
D. triple the number 10 years ago.
25. A small town of 1,709 residents had one homicide in the past year. The homicide rate for this town
A. cannot be determined from the information given.
B. is (1/1709) ´ 100,000.
C. is rising.
D. is (1709:1) ´ 1,000.
26. Frequency distributions may be compiled for variables measured at which level?
A. nominal
B. ordinal
C. interval-ratio
D. all of these
27. The class intervals below represent ages of respondents. Which set of intervals is both exhaustive and mutually exclusive?
A. 18-19
19-20
20-21
B. 18-19
20-21
22-23
C. 18-20
22-24
26-28
D. 18-19
21-22
24-25
28. The midpoints of intervals for frequency distributions constructed with interval-ratio variables are found by
A. adding the upper and lower class limits for each interval and then dividing by 2.
B. multiplying the upper and lower class limits for each interval.
C. dividing the range by 10.
D. None of these. Class intervals for interval-ratio variables do not have midpoints.
29. Cumulative frequencies and cumulative percentages allow a researcher to
A. be sure the column totals are correct.
B. tell at a glance how many cases fall above or below a given category.
C. show the accuracy of his or her findings.
D. all of these
30. When constructing a frequency distribution, the number of class intervals, in general, should be
A. more than 20.
B. about 10.
C. only 2.
D. the same as the number of cases.
31. If 60 cases range in score from 4 to 84 and you want 10 intervals in a frequency distribution, approximately what will be the width of each interval?
A. 4
B. 8
C. 12
D. 60 32. When constructing frequency distributions for variables measured at the interval-ratio level, approximate interval size (or interval width) can be found by
A. dividing sample size (N) by 10.
B. multiplying the number of categories by the lowest score.
C. dividing the range by the sample size (N).
D. dividing the range (R) by the number of categories (k).
A possible problem with Table 2.2 is that
A. class intervals overlap.
B. class intervals are too large.
C. class intervals are unequal in size.
D. class intervals are exhaustive.
In Table 2.2, what percentage of cases is in the 18-23 age group?
A. (5/36) ´ 100 = 13.51%
B. (18/23) ´ 100 = 78.26%
C. (36/5) ´ 100 = 7.4%
D. (5/21) ´ 100 = 23.81%
In Table 2.2, what is the ratio of 30-40 year olds to 18-23 year olds?
In Table 2.2, what proportion of cases are 18-23?
If we added a cumulative percentage column to Table 2.2 and began our calculations with the 18-23 interval, the entry in the 30-40 interval would be
A. 10%.
B. 33.3%.
C. 37%.
D. 100%.
38. A frequency distribution should reflect a balance of
A. detail and conciseness.
B. time and money.
C. questions and answers.
D. elegance and symmetry.
39. As a very general rule, frequency distributions should have ____ categories.
A. less than 5
B. more than 20
C. no more than 5
D. about 10
40. Open-ended intervals
A. are always preferable to unequal intervals.
B. should never be used in actual research.
C. can be useful when there are a few very high or very low scores in a distribution.
D. should only be used with ordinal-level variables.
41. A possible problem with open-ended or unequal intervals is that they
A. do not permit the computation of midpoints.
B. are useful only for nominal-level variables.
C. can be used only with variables that have few scores.
D. cannot be used for interval-ratio level variables.
42. You are the Dean of students at a college and the President has asked for some information about how the student body has changed over the years. You have collected the following information regarding the number of students in various categories for two different graduating classes:
What will you say to the president when she asks:
a. What percentage of the graduating class was female in 1987?____ 2007?____
b. What percentage of the glass was going to graduate school in 2007?____ Has this percentage gone up or down since 1987 and by how much? (Hint: Compute the percentage change to measure the amount of change between the two times)____
c. What proportion of the graduating class attended the commencement ceremony in 2007?____ Has this proportion gone up or down since 1987 and by how much?____
d. What proportion of the class majored in the humanities in 1987?____ 2007?____
e. What percent of students received financial aid in 1987?____ 2007?____
f. Relatively speaking, how many student finished in just four years in 1987?____ 2007?____ How has this percentage changed between the two years?____
g. What proportion of students were married in 1987?____ 2007?_
h. Write a paragraph describing the changes in the graduating classes of 1981 and 2001. What changes seem especially important? Why?
43. Below are the scores of 25 students on a midterm test. Organize this information into a frequency distribution using a ten point grading scale for class intervals. Include columns for percentages and cumulative percentages. Write a brief description of the distribution.
44. The frequency distribution below displays the distribution of age for a sample drawn from a community. Finish the table by completing the columns for percentages, and cumulative percentages.