September 2022 DPR Realty

Mortgage Rate Projections


Source: Freddie Mac Freddie Mac 30-Year Fixed Rate, January 2022 to Today 3.22 3.45 3.56 3.55 3.55 3.69 3.92 3.89 3.76 3.85 4.16 4.42 4.67 4.72 5.00 5.11 5.10 5.27 5.30 5.25 5.10 5.09 5.23 5.78 5.81 5.70 5.30 5.51 5.54 5.30 4.99 5.22 5.13 5.55 5.66 1/6 1/13 1/20 1/27 2/3 2/10 2/17 2/24 3/3 3/10 3/17 3/24 3/31 4/7 4/14 4/21 4/28 5/5 5/12 5/19 5/26 6/2 6/9 6/16 6/23 6/23 7/7 7/14 7/21 7/28 8/4 8/11 8/18 8/25 9/1 Mortgage Rates
Mortgage Rate Projections AugustQuarter2022 FreddieMac FannieMae MBA NAR ofAverageAllFour 2022 Q4 5.4 4.8 5.2 6.0 5.4% 2023 Q1 5.2 4.7 5.1 6.0 5.3% 2023 Q2 5.2 4.5 5.0 6.0 5.2% 2023 Q3 5.0 4.4 4.9 - 4.8%
After the end-of-summer lull, and as mortgage rates stabilize, we may see a return of buyers and a relatively strong fall housing market.-LisaSturtevant, Housing Economist

Home Price Appreciation


- Mark Zandi, Chief Economist, Moody’s Analytics
I don’t think national housing prices will decline in a meaningful way . . . but there will be some price declines across the country.
Source: CoreLogic Appreciation Slowing, Not Depreciating % Year-Over-Year Home Price Increases for 2022 19.1 20 20.9 20 20.2 18.3 15.8201510-50525 January February March MayApril June Depreciation July
Annual home price growth slowed for the third consecutive month in July but remained elevated at 15.8%. As 30-year, fixed-rate mortgages neared 6% this summer, some prospective homebuyers pulled back, helping ease overheated and unsustainable price growth. . . . Looking ahead, CoreLogic expects to see a more balanced housing market, with year-over-year appreciation slowing to 3.8% by July 2023. - CoreLogic, Latest Home Price Insights Report
Many Experts Raise Home Price Forecasts January Forecasts for 2022 Home Price Appreciation Compared to the Latest Forecasts Source January 2022 Appreciation Forecast Latest Appreciation2022Forecast Fannie Mae 7.6% 16.0% Freddie Mac 6.2% 12.8% NAR 5.1% 11.5% Zelman 3.0% 10.0% MBA 5.1% 9.9% HPES 6.3% 9.3%
Home Price Forecasts for 2022 11.3% 16.0% 12.8% 11.5% 10.0% 9.9% 9.6% 9.3% Average of All 7 Forecasts Fannie Mae Freddie Mac NAR Zelman MBA CoreLogic HPES
26.3% -5.4% -42.2%-10.0%-20.0%-30.0%-40.0%-50.0%0.0%10.0%20.0%30.0% Source: Calculated Risk Inventory Is Still Historically Low Week Ending September 2nd Same Week in 2021 Same Week in 2020 Same Week in 2019
Affordability


Source: NAR Affordability at Historically Low Level Housing Affordability Index, 1990 to Today 108 110 122 131 128 125 126 127 133 131 122 128 126 131 124 113 108 115 138 169 172 186 197 176 164 166 167 158 160 170 15498.52001901801701601501401301201101009080706050 1990 1991 1992 1993 1994 1995 1996 1997 1998 1999 2000 2001 2002 2003 2004 2005 2006 2007 2008 2009 2010 2011 2012 2013 2014 2015 2016 2017 2018 2019 2020 2021 Today Years thedominateddistressedwhenpropertiesmarket197 98.5
Compared to one year ago, the monthly mortgage payment rose to $1,944 from $1,265, an increase of 53.7%. - NAR
Monthly Mortgage Payments Increasing
Monthly Mortgage Payments $1,020 $1,265 $1,944 2020Apr May Jun Jul Aug Sept Oct Nov Dec 2021Jan Feb Mar Apr May Jun Jul Aug Sept Oct Nov Dec 2022Jan Feb Mar Apr May June
Source: NAR
(2000-2021)
a Median Income (P&I
Jan11.6%2013
25.4%Today302520151050 25%
income)
July24.7%2006
with a
June18.1%2018
Down Payment on a Median-Priced
a 30-Year
Jan19.6%2000
Assumes Fixed Rate Mortgage 20% Home with payment to
Source: NAR
Mortgage Payment to Income Ratio
Source: NAR Median Household Income vs. Qualifying Income $91,952 $104,351 $90,650 $84,114 $98,498 $93,312 $102,000 $68,496 $84,672 $141,552 U.S. Northeast Midwest South West Median Income in 1st Column Qualifying Income in 2nd Column
TodayCanBuyersThingsThreeDo 1. Expand search area and criteria 2. Explore financingalternativeoptions 3. Look for grants, gift funds, downpaymentresource.cometc.
- Ali Wolf, Chief Economist, Zonda
We are in a place where strategy discussions and planning are critically important to make sure we can thrive during these challenging times. Stay nimble, stay informed, and remember: Housing is traditionally one of the first sectors to slow as the economy shifts but is also one of the first to rebound.
Fall Buyer & Seller Guides: Now Available


ResourcesSlide(s)Description
3 Mortgage
504129257476/https://www.linkedin.com/feed/update/urn:li:activity:6971118
q3https://cdn.nar.realtor/sites/default/files/documents/forecast2022.pdfforecasts/forecasts/mortgagehttps://www.mba.org/docs/defaulthttps://www.fanniemae.com/media/44466/displayratesquarterlyhttps://www.freddiemac.com/research/forecast/20220720--forecast-market-slowdown-will-continue-high--and-prices-exacerbate-source/research-and--finance-forecast-aug---2022-us-economic-outlook-07-27-2022.pdf
5 Sturtevant Quote
8, 9 Appreciation Graph & CoreLogic Quote
Link(s) Rates Graph
4 Mortgage Rate Projections
7 Zandi Quote
markethttps://www.housingwire.com/articles/the-nations-housing--is-on-a-correction-course/ insightshttps://www.corelogic.com/intelligence/u-s-home-price--september-2022/
http://www.freddiemac.com/pmms/https://freddiemac.gcs-web.com/node/25841/pdf
10
Link(s)
Price Forecasts Graph
11
https://www.fanniemae.com/research and commentary/mortgagehttps://www.mba.org/newshttps://pulsenomics.com/surveys/#homehttps://zelmanandassociates.comhttps://www.nar.realtor/researchhttps://www.freddiemac.com/research/forecast?page=0insights/forecast/forecast-monthly-archiveandstatistics(subscriptionnecessary)-price-expectationsandresearch/forecastsand-finance-forecast-archives
Experts Raise Home Price Forecasts
2022.pdfforecasts/forecasts/mortgagehttps://www.mba.org/docs/defaulthttps://www.zelmanassociates.com/https://pulsenomics.com/surveys/#homeinstories/corelogichttps://www.corelogic.com/intelligence/findq3https://cdn.nar.realtor/sites/default/files/documents/forecastratesquarterlyhttps://www.freddiemac.com/research/forecast/20220720https://www.fanniemae.com/media/44461/display-forecastmarketslowdownwillcontinuehigh-and-prices-exacerbate-2022useconomicoutlook07272022.pdf--hpi-posted-record-year-over-year-growth-2021/-price-expectations(subscriptionrequired)source/researchand-finance-forecast-aug-
ResourcesSlide(s)Description
17, 18 Payment to Income Graphs
14
12
15 NAR
Link(s)
monthlyaffordabilityhttps://www.nar.realtor/blogs/economists-outlook/housing--conditions-fade-as-mortgage-rates-push--payments-higher-in-june-2022 Quote
20 Wolf Quote
Inventory Graph
septemberhttps://www.calculatedriskblog.com/2022/09/housing--5th-update-inventory.html
monthlyaffordabilityhttps://www.nar.realtor/blogs/economists-outlook/housing--conditions-fade-as-mortgage-rates-push--payments-higher-in-june-2022 Graph
ResourcesSlide(s)Description
Affordability Graph
housinghttps://www.builderonline.com/data-analysis/single-family--demand-will-remain-solid-for-the-next-decade_o?
monthlyaffordabilityhttps://www.nar.realtor/blogs/economists-outlook/housing--conditions-fade-as-mortgage-rates-push--payments-higher-in-june-2022
16 Mortgage Payments
2022https://cdn.nar.realtor/sites/default/files/documents/haimonthlyaffordabilityhttps://www.nar.realtor/blogs/economists-outlook/housing--conditions-fade-as-mortgage-rates-push--payments-higher-in-june-2022-06--housing-affordability-index-2022-08-11.pdf
Updates

50-56 Inventory
ResourcesSlide(s)Description
statistics/pendinghttps://www.nar.realtor/research-and-statistics/housing--home-sales index/#newscorelogichttps://www.spglobal.com/spdji/en/indices/indicators/sp--case-shiller-20-city-composite-home-price-nsa--research
37 Total Home Sales
44-46 Case Shiller
https://www.nar.realtor/topics/existing-home-sales http://www.census.gov/newhomesaleshttp://www.census.gov/construction/nrs/pdf/newressales.pdf https://www.nar.realtor/topics/existinghttp://www.census.gov/construction/nrs/pdf/newressales.pdf-home-sales
insights/https://www.corelogic.com/intelligence/u-s-home-pricehttp://www.census.gov/construction/nrs/pdf/newressales.pdfhttps://www.nar.realtor/topics/existing-home-sales
38, 39 Pending Home Sales
Link(s)
reports/realtorshttps://www.nar.realtor/research-and-statistics/research--confidence-index
29 Confidence Index
33-36 New Home Sales
47 CoreLogic Price Forecast
30-32, 40, 42, 43, 50-54 Existing Home Sales
indexhttps://www.showingtime.com/blog/july-2022-showing--results/
http://www.freddiemac.com/research/forecast/http://www.freddiemac.com/pmms/pmms_archives.html
https://www.nar.realtor/researchcommentaryresources/researchhttps://www.mba.org/newsinsights/forecast.htmlhttp://www.fanniemae.com/portal/researchhttp://www.freddiemac.com/research/forecast/--research-and--and-economics/forecasts-and--and-statistics
ResourcesSlide(s)Description
resources/newsroomhttps://www.mba.org/news-research-and-https://www.mba.org/news-research-and-resources/research-and-economics/single-family-research/mortgage-credit-availability-index
66, 67 Mortgage AvailabilityCredit
62 Mortgage Rate Projections
Link(s)
60, 61, 63, 64 Mortgage Rates
58 Showing Activity
Home Sales

42 30 26 26 26 27 31 32 33 42 46 49 44 36 24 26 27 29 31 31 36 38 41 41 36 29 27 26 24 22 22 21 21 21 21 20 18 17 17 17 17 17 17 18 18 19 19 18 17 17 16 14 14 Mar-22 Apr May June July Aug Sept Oct Nov Dec Jan-19 Feb Mar Apr May June July Aug Sept Oct Nov Dec Jan-20 Feb Mar Apr May June July Aug Sept Oct Nov Dec Jan-21 Feb Mar Apr May June July Aug Sept Oct Nov Dec Jan-22 Feb Mar Apr May June July Source: NAR Average Days on the Market July 2022
Source: NAR Existing Home Sales Since January 2014 6,800,0006,300,0005,800,0005,300,0004,800,0004,300,0003,800,000Jan2014 2015Jan 2016Jan 2017Jan 2018Jan 2019Jan 2020Jan 2021Jan 2022Jan
Source: NAR
Existing
Home Sales Year-Over-Year, by Region -20.2% -16.2% -14.4% -19.6% -30.4% U.S. Northeast Midwest South West
Source: NAR Existing Home Sales In Thousands 6005004003002001000 January February March April May June July August September October November December 2020 2021 2022
Source: Census New Home Sales In Thousands 9080706050403020100 January February March April May June July August September October November December 2020 2021 2022
Source: Census New Home Sales Annualized in Thousands 1060960860760660560460360jun-14 Jan-15 Jan-16 Jan-17 Jan-18 Jan-19 Jan-20 Jan-21 Jan-22
0% 3% 13% 10% 10% 5% Under $150K $150-$199K $200-299K $300-$399K $400-$499K $500-$749K Over Source:$750KCensus New Home Sales Percent of Distribution by Price Range * Less Than 500 Units or Less Than 0.5 Percent * *
Source: Census New Homes Selling Fast Median Months from Completion to Sold 3.2 3.6 3.6 3.4 3.5 3.6 3.4 3.2 3.5 3.1 3.2 3.0 3.4 3.4 3.4 3.3 3.6 4.2 4.3 4.5 4.5 4.2 4.0 3.6 3.2 3.7 5.1 4.9 4.5 4.1 4.5 3.6 3.1 2.5 2.9 3.2 2.8 2.7 3.5 3.5 2.8 2.9 2.3
Source: Census Total Home Sales In443Thousands436567 587 593 676 646 631 604 577 557 574 422 423 524 517 557 575 495 January February March April May June July August September October November December 2021 2022
Source: NAR Pending Home Sales 14013012011010090807060January2012 January2013 January2014 January2015 January2016 January2017 January2018 January2019 January2020 January2021 January2022 100 = Historically Healthy Level
Pending Home Sales
Year-Over-Year by Region 100 = Historically Healthy Level -19.9% -15.4% -13.4% -20.0% -30.1% U.S. Northeast Midwest South West
Source: NAR
Distressed Sales (Foreclosures and Short Sales) represented Less Than 1% of Sales in June. 35%30%25%20%15%10%5%0% 2012Jan 2013Jan 2014Jan 2015Jan 2016Jan 2017Jan 2018Jan 2019Jan 2020Jan 2021Jan 2022Jan 4%
Distressed
Source: NAR
Percentage of Property Sales
Home Prices
10.8% 8.1% 7.0% 14.7% 8.1% U.S. Northeast Midwest South WestSource: NAR Sales Price of Existing Homes Year-Over-Year, by Region
% in Sales
Source: NAR
Change
Year-Over-Year, by Price Range $0-100K $100-250K $250-500K $500-750K $750K-1M $1M+ % -27.8% -31.3% -17.8% -9.8% -8.3% -12.6% -27.8% -31.3% -17.8% -9.8% -8.3% -12.6%
Source: S&P Case-Shiller Change in Home Prices Year-Over-Year0%5%10%15%20%Jun2012Jan2013Jan2014 2015Jan 2016Jan 2017Jan 2018Jan 2019Jan 2020Jan 2021Jan 2022Jan
Change in Home Prices
Year-Over-Year, 20 City Composite
Source: S&P Case-Shiller 2014Jan Feb Mar Apr May Jun Jul Aug Sept Oct Nov Dec 2015Jan Feb Mar Apr May Jun Jul Aug Sept Oct Nov Dec 2016Jan Feb Mar Apr May Jun Jul Aug Sept Oct Nov Dec 2017Jan Feb Mar Apr May Jun Jul Aug Sept Oct Nov Dec 2018Jan Feb Mar Apr May Jun Jul Aug Sept Oct Nov Dec 2019Jan Feb Mar Apr May Jun Jul Aug Sept Oct Nov Dec 2020Jan Feb Mar Apr May Jun Jul Aug Sept Oct Nov Dec 2021Jan Feb Mar Apr May June July Aug Sept Oct Nov Dec 2022Jan Feb Mar Apr May June
Source: S&P Case-Shiller Change in Home Prices Year-Over-Year, 20 City Composite 20.0% 19.6% 19.1% 18.5% 18.3% 18.6% 18.9% 20.3% 21.1% 21.2% 20.5% 18.6% July Aug Sept Oct Nov Dec Jan 2022 Feb Mar Apr May June
Source: CoreLogic
July 2022 15.8% 3.8% Current Forecast
Year-Over-Year % Change in Price
Housing Inventory

Month-Over-Month, August 2022
Change in Inventory
Source: realtor.com

Source: NAR Months Inventory of Homes for Sale 2011 - Today 9.58.57.56.55.54.53.52.51.5January2011 January2012 January2013 January2014 January2015 January2016 January2017 January2018 January2019 January2020 January2021 January2022
Source: NAR Months Inventory of Homes for Sale Since 2019 3.8 3.6 3.8 4.2 4.3 4.3 4.2 4.0 4.0 3.9 3.7 3.0 3.1 3.1 3.3 4.0 4.6 3.9 3.1 3.0 2.7 2.5 2.3 1.9 1.9 2.0 2.1 2.3 2.5 2.5 2.6 2.6 2.4 2.4 2.1 1.7 1.6 1.7 1.9 2.2 2.6 2.9 3.36.05.55.04.54.03.53.02.52.01.5 Jan-19 Feb Mar Apr May June July Aug Sept Oct Nov Dec Jan-20 Feb Mar Apr May June July Aug sept Oct Nov Dec Jan-21 Feb Mar Apr May June July Aug Sept Oct Nov Dec Jan-22 Feb Mar Apr May June July
Source: NAR
Homes for Sale Last 12 Months 2.6 2.4 2.4 2.1 1.7 1.6 1.7 1.9 2.2 2.6 2.9 3.36543210 Aug Sept Oct Nov Dec 22-Jan Feb Mar Apr May June July
Inventory
Months of
Source: NAR Year-Over-Year Inventory Levels -10%-15%-20%-25%-30%-5%0%5%10% January2014 January2015 January2016 January2017 January2018 January2019 January2020 January2021 January2022 % 7. 5. 3. 6. 6. 5. 5. 4. 6. 5. 5. -0 -0 -0 2. -0 1. 0. -4 -1 -3 -4 -1 -3 -2 -1 -1 -3 -9 -5 -5 -1 -6 -1 -9 -6 -7 -6 -6 -9 -8 -7 -9 -6 -6 -1 -9 -1 -9 -8 -7 -6 -6 0. 0. 2. 1. 2. 4. 6. 4. 2. 2. 1. 2. 0. -1 -2 -2 -4 -5 -9 -1 -9 -1 -1 -1 -1 -2 -1 -1 -1 -2 -2 -2 -2 -2 -2 -2 -1 -1 -1 -1 -9 -1 -1 -1 -1 -9 -1 -4 2. 0.
Source: NAR
Last 12 Months -13.8% -12.8% -9.8% -13.3% -18.0% -17.9% -15.5% -9.5% 10.4% -4.1% 2.4% 0.0% Aug Sept Oct Nov Dec Jan 2022 Feb Mar Apr May June JuneJuly
Year-Over-Year Inventory Levels
Source: Census New Home Monthly Inventory Seasonally Adjusted, Last 12 Months 6.5 6.1 6.9 6.2 5.6 5.7 6.0 7.0 8.4 8.4 9.2 10.9 Aug Sept Oct Nov Dec Jan 22 Feb Mar Apr May June Jul
Source: Census New Home Monthly Inventory Non-Seasonally Adjusted 3.9 4.4 3.7 4.3 5.0 5.8 5.9 6.9 6.5 7.6 7.3 6.4 5.6 5.5 5.9 7.6 7.6 9.1 11.2 Jan Feb Mar Apr May June July Aug Sept Oct Nov Dec 20222021
Buyer Demand

Year-Over-Year Increase in Showing Activity, July 2022
“The slowdown in showings tracks with the overall market rebalancing that’s taking place across the country. Conditions for buyers are less competitive than they were last year at this time, while a general increase in available inventory in most markets has not only given buyers more options to consider, but more time to consider them.”
Michael Lane, Vice President & General Manager, Showing Time
-16.8% -9.9% -13.5% -24.2% -44.0% U.S. Northeast Midwest South West
Source: ShowingTime
Home Showing Activity Slows as Buyer Demand Continues Rebalancing from Historic Highs
Mortgage Rates

6.05.55.04.54.03.53.02.52.0 Source: Freddie Mac Mortgage Rates 30-Year Fixed Rate, January 2018–Today 5.66%
6.05.55.04.54.03.53.02.52.0 1/7/16 2/4 3/3 4/7 5/5 6/2 7/7 8/4 9/1 10/6 11/3 12/1 1/5/2017 2/2 3/2 3/30 4/27 5/25 6/22 7/20 8/17 9/14 10/12 11/9 12/7 1/4/2018 2/1 3/1 4/5 5/4 6/7 7/5 8/2 9/6 10/4 11/1 12/6 1/3/2019 1/31 3/7 4/4 5/2 6/6 7/3 8/1 9/5 10/3 11/7 12/5 1/2/2020 2/6 3/5 4/2 5/7 6/4 7/2 8/6 9/3 10/1 11/5 12/3 1/7/2021 2/4 3/4 4/1 5/6 6/3 7/1 8/5 9/2 10/7 11/4 12/2 1/6/2022 2/3 3/3 4/7 5/5 6/2 7/7 8/4 9/1 Source: Freddie Mac Mortgage Rates 30-Year Fixed Rate, January 2016–Today 5.66%
Mortgage Rate Projections August 2022 Quarter FreddieMac FannieMae MBA NAR AverageofAllFour 2022 4Q 5.4 4.8 5.2 6.0 5.35% 2023 1Q 5.2 4.7 5.1 6.0 5.25% 2023 2Q 5.2 4.5 5.0 6.0 5.18% 2023 3Q 5.0 4.4 4.9 - 4.77%
6.05.55.04.54.03.53.02.52.0 2018 2/1 3/1 4/5 5/3 6/7 7/5 8/2 9/6 10/4 11/1 12/6 2019 1/31 3/7 4/4 5/2 6/6 7/3 8/1 9/5 10/3 11/7 12/5 2020 2/6 3/5 4/2 5/7 6/4 7/2 8/6 9/3 10/1 11/5 12/3 2021 2/4 3/4 4/1 5/6 6/3 7/1 8/5 9/2 10/7 11/4 12/2 2022 2/3 3/3 4/7 5/5 6/2 7/7 8/4 9/1 5.4 5.2 5.2 5.0 2022 Q4 2023 Q1 2023 Q2 2023 Q3 Source: Freddie Mac Mortgage Rates 30-Year Fixed Rate January 2018 – Today Actual Interest Rates Where Are They Going?
Rate 3.7 3.6 3.5 3.8 4.2 4.0 3.9 3.9 4.3 4.5 4.6 4.8 4.4 4 3.7 3.7 3.5 3.2 3.0 2.8 2.9 3.0 2.9 3.1 3.8 5.3 5.5 5.4 5.2 5.2 5.0 5.0 5.54.53.52.53456 - Actual - Projected 2016 2017 2018 2019 2020 2021 2023 2022
Source: Freddie Mac Mortgage Rates
30-Year Fixed Rate 2016Q1 2016Q2 2016Q3 2016Q4 2017Q1 2017Q2 2017Q3 2017Q4 2018Q1 2018Q2 2018Q3 2018Q4 2019Q1 2019Q2 2019Q3 2019Q4 2020Q1 2020Q2 2020Q3 2020Q4 2021Q1 2021Q2 2021Q3 2021Q4 2022Q1 2022Q2 2022Q3 2022Q4 2023Q1 2023Q2 2023Q3 2023Q4
MortgageAvailabilityCredit

Source: MBA Mortgage Credit Availability Index (MCAI) July 2022 190180170160150140130120110100 2013Apr 2014Jan 2015Jan 2016Jan 2017Jan 2018Jan 2019Jan 2020Jan 2021Jan 2022Jan
Historic Data for the Mortgage Credit Availability Index (MCAI) 9008007006005004003002001000 2004June 2005June 2006June 2007June 2008June 2009June 2010June 2011June 2012June 2013June 2014June 2015June 2016June 2017June 2018June 2019June 2020June 2021June 2022June 2022July Housing Bubble: 868.7 108.8
Lending Standards Still Under Control
Source: MBA
Single
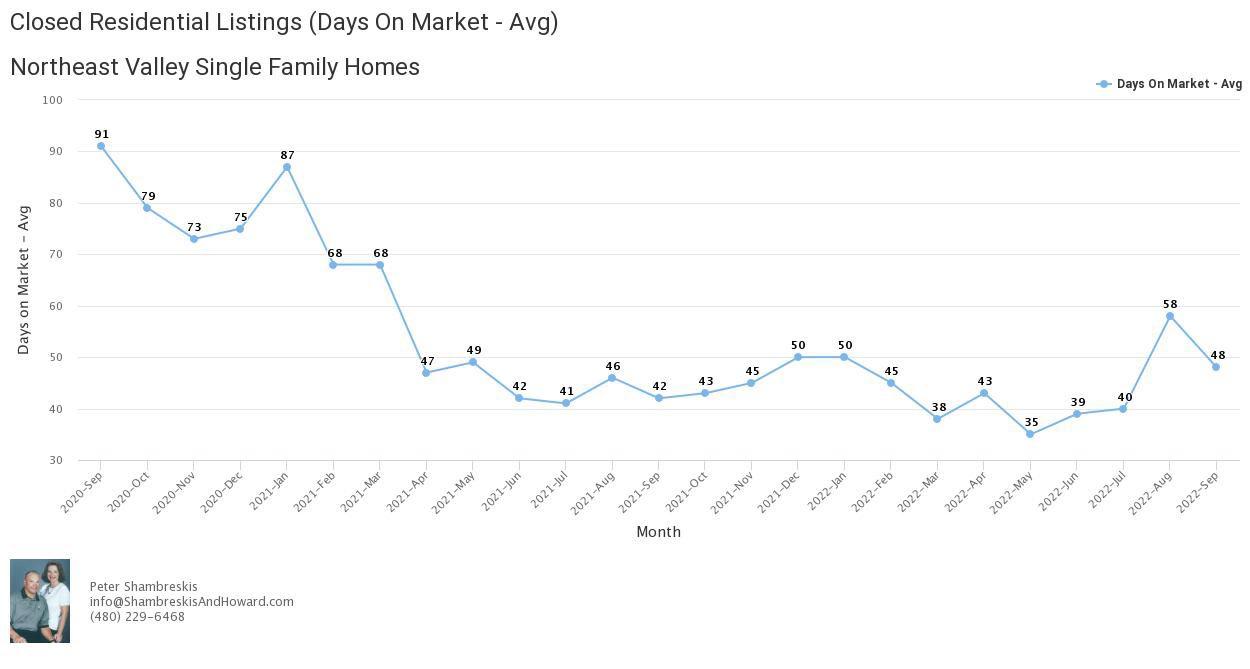
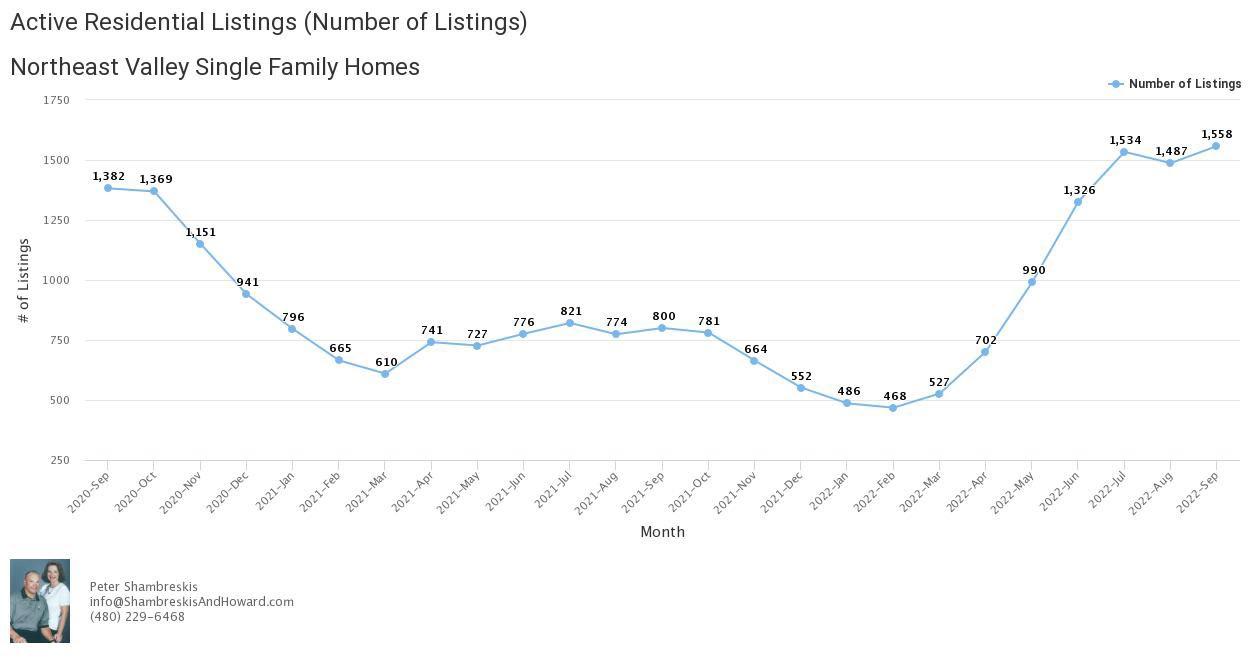
in Carefree, Cave Creek, Fort McDowell, Fountain Hills, Paradise Valley, Rio Verde and Scottsdale, Arizona
Housing Market Statistics for Northeast Valley Family Homes

for Sold Northeast Valley Single Family Homes
Average Price per Sq Ft

for Sold Northeast Valley Single Family Homes
Average Days on Market
Number of Active Listings for Northeast Valley Single Family Homes
Average Price per Sq Ft for Active Northeast Valley Listings

Peter Shambreskis, REALTOR®, ABR, CRS, GRI, SFR 480-229-6468 Corinne Howard, REALTOR®, ePRO, GRI, SFR, SRS info@ShambreskisAndHoward.com480-229-6467www.ShowScottsdaleHomes.com CONTACT US TO DISCUSS YOUR LOCAL ARIZONA REAL ESTATE MARKET