
DPR Realty

When the economic uncertainty dust settles, those buyers and sellers who were on the sideline will jump back in the housing game. Demographic trends support elevated purchase demand in the years to come, so it’s a question of when, not if, for the housing market.

- Mark Fleming, Chief Economist, First American
IN

TIMES OF UNCERTAINTY PEOPLE FOLLOW THE CERTAIN
Will Mortgage Rates Keep Rising?


Mortgage Rates Rise for the
Consecutive Week
Freddie Mac 30-Year Fixed Rate, January 2022–Today
Source:Freddie Mac
6th
3.22 3.45 3.56 3.55 3.55 3.69 3.92 3.89 3.76 3.85 4.16 4.42 4.67 4.72 5.00 5.11 5.10 5.27 5.30 5.25 5.10 5.09 5.23 5.78 5.81 5.70 5.30 5.51 5.54 5.30 4.99 5.22 5.13 5.55 5.66 5.89 6.02 6.29 6.7% 1/6 1/13 1/20 1/27 2/3 2/10 2/17 2/24 3/3 3/10 3/17 3/24 3/31 4/7 4/14 4/21 4/28 5/5 5/12 5/19 5/26 6/2 6/9 6/16 6/23 6/23 7/7 7/14 7/21 7/28 8/4 8/11 8/18 8/25 9/1 9/8 9/15 9/22 9/29
Sam Khater, Chief Economist, Freddie Mac:
The uncertainty and volatility in financial markets is heavily impacting mortgage rates. Our
indicates that
Source: Freddie Mac September 29, 2022
survey
the range of weekly rate quotes for the 30-year fixed-rate mortgage has more than doubled over the last year. Primary Mortgage Market Survey® U.S. Weekly Averages As Of 09/29//2022 30-Yr FRM 15-Yr FRM 5/1-Yr ARM 6.70% ^0.41 1-Wk 5.96% ^0.52 1-Wk 5.30% ^0.33 1-Wk ^3.69 1-yr ^3.68 1-yr ^2.82 1-yr 0.9 Fees/Points 1.3 Fees/Points 0.4 Fees/Points Mortgage Rates Rise for the 6th Consecutive Week
The aim of Fed tightening is to curtail demand in an effort to tame inflation, & when it comes to the housing market, the Fed’s actions are working. Home sales, both new and existing, are falling, builders have cut back production in response to rapidly declining affordability . . . and annual house price growth has slowed from the peak of nearly 21% in March of this year to 16.7% in July.
Odeta Kushi, Deputy Chief Economist, First American
-
While even two months ago rates above 7% may have seemed unthinkable, at the current pace, we can expect rates to surpass that level in the next three months.
-
George Ratiu, Senior Economist, realtor.com
There is no doubt that the increasing mortgage rate will make homebuying even more challenging, . . . buyers may still find opportunities, as these changes coincide with the time of the year when buyers have historically found the best market conditions to obtain more bargaining power.
-
Jiayi Xu, Economist, realtor.com
While mortgage rates are expected to continue to drift higher over the coming months, much of the rapid increase in rates is likely behind us. . . . Nationally, while month-over-month house prices may decline, annual house price declines are not expected, given the ongoing supply-demand imbalance and continued strength in the labor market.
Mark Fleming, Chief Economist, First American
-
What’s Ahead for Home Prices?

The root issue of what drives house prices almost always is supply and demand
. . . - David Ramsey, Personal Finance Personality
Supply & Demand Ratio Changing Quickly
Year-Over-Year Comparisons
Source: ShowingTime, realtor.com
-12.2% 26.9% -25.0% -15.0% -5.0% 5.0% 15.0% 25.0% 35.0% Showings Active ListingsActive Listings
What Are Experts Saying Right Now?
Ivy Zelman projects U.S. house prices will fall 4% in 2023, and then another 5% decline in
2024. - Ivy Zelman, CEO, Zelman & Associates
Not surprisingly, deals are not getting done, with sales of new and existing homes declining for over half a year. Given that demand is cooling due to high borrowing costs, incomes falling behind inflation and the still-limited supply pipeline, it is becoming increasingly clear that prices have to decline to restore market liquidity and balance.
George Ratiu, Senior Economist, realtor.com
-
While the markets considered overvalued may need to adjust to the not-so-new reality of higher mortgage rates, housing market fundamentals still support a moderation of annualized house price appreciation rather than a sharp decline.
-
Mark Fleming, Chief Economist, First American
We’re not at risk of a collapse today in the financial system like we were before. It’s true - housing may be a little frothy. So housing prices may come down or they may plateau but not to the extent it happened.
-
John Paulson, Billionaire Hedge Fund Manager Who Called 2008 Crash
Home Price Forecast
2023
Home Price Forecasts for 2023
1.8% 4.4% 4.0% 2.8% 2.6% 1.2% -4.0% Average of All 6 Forecasts Fannie Mae
Freddie
Mac MBA HPES NAR Zelman
Zelman
Latest Forecasts from Each Entity
Appreciation/Depreciation
Source: Zillow
Forecast 8/2023 Number of Metropolitan Statistical Areas (MSAs) Forecast for Levels of Price Change 57 151 258 152 22 116 111 26 4 0 > 5% Appreciation 3 to 5% Appreciation 1 to 3% Appreciation < 1% Appreciation No Change < 1% Depreciation 1 to 3% Depreciation 3 to 5% Depreciation > 5% Depreciation > 10% Depreciation Appreciation Forecasted for 618 MSAs Depreciation Forecasted for 257 MSAs (Only 30 Greater Than 3% Depreciation)
Appreciation/Depreciation
Number of Analysts Forecasting Levels of Price Change
Source: HPES
Forecast 2023
2 20 28 17 1 4 3 6 5 5 2 5 to 10% Appreciation 3 to 5% Appreciation 1 to 3% Appreciation < 1% Appreciation No Change < 1% Depreciation 1 to 3% Depreciation 3 to 5% Depreciation 5 to 10% Depreciation > 10% Depreciation Appreciation Forecasted Depreciation Forecasted > 10% Appreciation
Forecasts
Through
Percent of Analysts Forecasting Appreciation or Depreciation
Source: HPES
2024
2026
Appreciation Forecasted Depreciation Forecasted No Change Forecasted 86% 2024 91.4% 2025 96.8% 2026

Why Equity Is the Shining Star of the Housing Market


U.S. households own $41 trillion in owneroccupied real estate, just over $12 trillion in debt, and the remaining ~$29 trillion in equity. The national "LTV" in Q2 2022 was 29.5%, the lowest since 1983. . . . Homeowners had an average of $320,000 in inflation-adjusted equity in their homes in Q2 2022, an alltime high.
-
Odeta Kushi, Deputy Chief Economist, First American
For many households, home equity is the only source of wealth creation. As a result, recent record gains in equity and record declines in loan-to-value ratios will provide many owners with a financial buffer in case economic conditions worsen. In addition, record equity continues to provide fuel for housing demand, particularly if households are relocating to more affordable areas.
Selma Hepp, Interim Lead of the Office of the Chief Economist, CoreLogic
-
Homeowner Equity Gains

Year-Over-Year, Q2 2022
Source: CoreLogicCoreLogic 2022 Q2 Home Equity Report
Average equity gain for U.S. homeowners with mortgages
Year-Over-Year total increase in equity for U.S. homeowners with mortgages
Year-Over-Year percentage increase in equity for U.S. homeowners with mortgages
Source: CoreLogic
27.8%
$3.6T
$60.2K
“The total average equity per borrower has now reached almost
$300,000
, the highest in the data series.”
Percent Change in Home Prices

Q1
Q2
Source: FHFA
Since
1991,
2022
Median Asking Rent Since 1988
$1,350
$1,300
$1,250
$1,200
Source: Census $300 $350 $400 $450 $500 $550 $600 $650 $700 $750 $800 $850 $900 $950 $1,000 $1,050 $1,100 $1,150
$1,400 1988 1989 1990 1991 1992 1993 1994 1995 1996 1997 1998 1999 2000 2001 2002 2003 2004 2005 2006 2007 2008 2009 2010 2011 2012 2013 2014 2015 2016 2017 2018 2019 2020 2021 2022 Q2
Homeownership Changes Lives


Security & Stability
Health Benefits
& Home Improvements
Education Civic Participation


Sources: Unison, Fortune Builders
Privacy Personalization
Financial
Economic
https://blog.firstam.com/economics/author/mark-fleming
https://twitter.com/awealthofcs/status/15747420239654461
44
https://fortune.com/2022/09/26/housing-market-real-estateprices-interest-mortgage-rate-highest-since-2002/ https://www.cnbc.com/video/2022/09/27/30 year fixed rate mortgage-jumps-over-7percent.html?&qsearchterm=mortgage%20rates https://www.cnn.com/2022/09/08/homes/mortgage rates september-8/index.html
Rates Graph
https://freddiemac.gcs-web.com/node/25916/pdf http://www.freddiemac.com/pmms/
https://freddiemac.gcs-web.com/node/25961/pdf
https://twitter.com/odetakushi/status/157265138813566976
Quote, Housing Market
https://twitter.com/odetakushi/status/157265139009024819
Resources Slide(s) Description Link(s) 2 Fleming Quote,
Uncertainty
5 Headlines
6 Mortgage
7 Khater Quote
8 Kushi
0
2
Ratiu Quote, Rates
Quote
Fleming Quote, Forecasting
Link(s)
https://www.cnn.com/2022/09/29/homes/mortgage-ratesseptember-29/index.html
https://www.realtor.com/news/trends/column-homebuyershave-hard-the-bad-news-heres-the-good/
https://www.firstam.com/news/2022/overvalued-marketsincreasing-20220927.html
Quote https://www.youtube.com/watch?v=NDDwGqTVAdU
& Demand Graph
https://www.showingtime.com/blog/august-2022-showingindex-results/ https://news.move.com/2022-09-29-Realtor-com-RSeptember-Housing-Report-Fall-Home-Shoppers-FindMore-Options-Amid-Still-High-Listing-Prices
Zelman Quote
Ratiu Quote, Prices
https://macrohive.libsyn.com/ivy-zelman-on-the-coming-ushousing-crisis
https://themreport.com/daily-dose/09-27-2022/costhomeownership-prohibitively-high
Resources Slide(s) Description
9
10 Xu
11
13 Ramsey
14 Supply
16
17
Fleming Quote, Housing Market
https://blog.firstam.com/economics/where-is-housingovervalued
Paulson Quote https://twitter.com/NickTimiraos/status/15744587862149488 65
Price Forecasts Graph
https://www.fanniemae.com/media/44466/display https://www.freddiemac.com/research/forecast/20220720quarterly-forecast-market-slowdown-will-continue-highrates-and-prices-exacerbate https://cdn.nar.realtor/sites/default/files/documents/forecastq4-2022-us-economic-outlook-09-28-2022.pdf https://pulsenomics.com/surveys/#home-price-expectations https://www.zelmanassociates.com/ (subscription required) https://www.mba.org/docs/default-source/research-andforecasts/forecasts/mortgage-finance-forecast-sep-2022.pdf
Appreciation/Depreciation
Forecast Graph, MSA
Appreciation/Depreciation
Forecast Graphs
https://www.zillow.com/research/data/
https://pulsenomics.com/surveys/#home-price-expectations
Resources Slide(s) Description Link(s) 18
19
21
22
23, 24
Quote, Equity
in
Prices
https://twitter.com/odetakushi/status/156933889283026534
https://twitter.com/odetakushi/status/156933890660435968
https://www.corelogic.com/intelligence/homeowner-equityinsights/
https://www.fhfa.gov/DataTools/Tools/Pages/House-PriceIndex-(HPI).aspx
Asking Rent Graph http://www.census.gov/housing/hvs/files/currenthvspress.pd
Homeownership Changes
https://contentimages.oprod.unison.com/images/press/2021-Unison-SOTAHReport.pdf https://www.fortunebuilders.com/benefits-ofhomeownership/
Resources Slide(s) Description Link(s) 27 Kushi
4
5 28-30 Home Equity Report
31 Change
Home
Since 1991 Map
32 Median
f 33
Lives
Updates

Confidence Index
Link(s)
https://www.nar.realtor/research-and-statistics/researchreports/realtors-confidence-index
Existing Home Sales
https://www.nar.realtor/topics/existing-home-sales
Sales http://www.census.gov/construction/nrs/pdf/newressales.pdf http://www.census.gov/newhomesales
Home Sales
Pending Home Sales
Shiller
CoreLogic Price Forecast
http://www.census.gov/construction/nrs/pdf/newressales.pdf https://www.nar.realtor/topics/existing-home-sales
https://www.nar.realtor/research-and-statistics/housingstatistics/pending-home-sales
https://www.spglobal.com/spdji/en/indices/indicators/spcorelogic-case-shiller-20-city-composite-home-price-nsaindex/#news-research
https://www.corelogic.com/intelligence/u-s-home-priceinsights/
https://www.nar.realtor/topics/existing-home-sales http://www.census.gov/construction/nrs/pdf/newressales.pdf
Resources Slide(s) Description
42
43-45, 53, 55, 56, 62-67
46-49 New Home
50 Total
51, 52
57-59 Case
60
62-69 Inventory
Activity
Link(s)
https://www.showingtime.com/blog/august-2022-showingindex-results/
Mortgage Rates http://www.freddiemac.com/pmms/pmms_archives.html http://www.freddiemac.com/research/forecast/
Mortgage Rate Projections
http://www.freddiemac.com/research/forecast/ http://www.fanniemae.com/portal/researchinsights/forecast.html https://www.mba.org/news-research-andresources/research-and-economics/forecasts-andcommentary https://www.nar.realtor/research-and-statistics
Mortgage Credit Availability
https://www.mba.org/news-research-andresources/newsroom https://www.mba.org/news-research-andresources/research-and-economics/single-familyresearch/mortgage-credit-availability-index
Resources Slide(s) Description
71 Showing
73, 74, 76, 77
75
79, 80
Home Sales

Average Days on the Market
42 30 26 26 26 27 31 32 33 42 46 49 44 36 24 26 27 29 31 31 36 38 41 41 36 29 27 26 24 22 22 21 21 21 21 20 18 17 17 17 17 17 17 18 18 19 19 18 17 17 16 14 14 16 Mar-22 Apr May June July Aug Sept Oct Nov Dec Jan-19 Feb Mar Apr May June July Aug Sept Oct Nov Dec Jan-20 Feb Mar Apr May June July Aug Sept Oct Nov Dec Jan-21 Feb Mar Apr May June July Aug Sept Oct Nov Dec Jan-22 Feb Mar Apr May June July Aug Source: NAR
August 2022
Existing Home Sales
Since January 2014
Source: NAR
3,800,000 4,300,000 4,800,000 5,300,000 5,800,000 6,300,000 6,800,000 Jan 2014 Jan 2015 Jan 2016 Jan 2017 Jan 2018 Jan 2019 Jan 2020 Jan 2021 Jan 2022
Existing Home Sales
Year-Over-Year, by Region
Source: NAR
-19.9% -13.7% -15.9% -19.3% -29.0% U.S. Northeast Midwest South West
Existing Home Sales
In Thousands
Source: NAR
0 100 200 300 400 500 600 January February March April May June July August September October November December 2020 2021 2022
New Home Sales
In Thousands
Source: Census
0 10 20 30 40 50 60 70 80 90 January February March April May June July August September October November December 2020 2021 2022
New Home Sales
Annualized in Thousands
Source: Census
360 460 560 660 760 860 960 1060 jun-14 Jan-15 Jan-16 Jan-17 Jan-18 Jan-19 Jan-20 Jan-21 Jan-22
New
Sales
Percent of Distribution by Price Range
0% 6% 15% 13% 12% 7% Under $150K $150-$199K $200-299K $300-$399K $400-$499K $500-$749K Over $750K Source: Census
Home
* Less Than 500 Units or Less Than 0.5 Percent * *
New
Selling Fast
Median Months from Completion to Sold
Source: Census
Homes
3.2 3.6 3.6 3.4 3.5 3.6 3.4 3.2 3.5 3.1 3.2 3.0 3.4 3.4 3.4 3.3 3.6 4.2 4.3 4.5 4.5 4.2 4.0 3.6 3.2 3.7 5.1 4.9 4.5 4.1 4.5 3.6 3.1 2.5 2.9 3.2 2.8 2.7 3.5 3.5 2.8 3.0 2.4 1.7
Total
Source: Census
Home Sales In Thousands 443 436 567 587 593 676 646 631 604 577 557 574 422 423 524 517 557 575 495 531 January February March April May June July August September October November December 2021 2022
Pending Home Sales
Source: NAR
60 70 80 90 100 110 120 130 140 January 2012 January 2013 January 2014 January 2015 January 2016 January 2017 January 2018 January 2019 January 2020 January 2021 January 2022 100 = Historically Healthy Level
Pending Home Sales
by Region
Source: NAR
Year-Over-Year
100 = Historically Healthy Level -24.2% -19.0% -21.1% -24.2% -31.3% U.S. Northeast Midwest South West
Percentage of Distressed Property Sales
Distressed Sales (Foreclosures and Short Sales) represented Less Than 1% of Sales in August
Source: NAR
0% 5% 10% 15% 20% 25% 30% 35% Jan 2012 Jan 2013 Jan 2014 Jan 2015 Jan 2016 Jan 2017 Jan 2018 Jan 2019 Jan 2020 Jan 2021 Jan 2022 4%
Home Prices
Sales Price of Existing Homes
by
7.7% 1.5% 6.6% 12.4% 7.1% U.S. Northeast Midwest South West Source: NAR
Year-Over-Year,
Region
% Change in Sales
Year-Over-Year, by Price Range
Source: NAR
$0-100K $100-250K $250-500K $500-750K $750K-1M $1M+ % -22.1% -26.0% -14.0% -2.2% -3.2% -5.3% -22.1% -26.0% -14.0% -2.2% -3.2% -5.3%
Change in Home Prices
Year-Over-Year
Source:S&P Case-Shiller
0% 5% 10% 15% 20% Jun 2012 Jan 2013 Jan 2014 Jan 2015 Jan 2016 Jan 2017 Jan 2018 Jan 2019 Jan 2020 Jan 2021 Jan 2022
Change in Home Prices
Year-Over-Year, 20 City Composite
Source: S&P Case-Shiller Jan 2014 Feb Mar Apr May Jun Jul Aug Sept Oct Nov Dec Jan 2015 Feb Mar Apr May Jun Jul Aug Sept Oct Nov Dec Jan 2016 Feb Mar Apr May Jun Jul Aug Sept Oct Nov Dec Jan 2017 Feb Mar Apr May Jun Jul Aug Sept Oct Nov Dec Jan 2018 Feb Mar Apr May Jun Jul Aug Sept Oct Nov Dec Jan 2019 Feb Mar Apr May Jun Jul Aug Sept Oct Nov Dec Jan 2020 Feb Mar Apr May Jun Jul Aug Sept Oct Nov Dec Jan 2021 Feb Mar Apr May June July Aug Sept Oct Nov Dec Jan 2022 Feb Mar Apr May June July
Change in Home Prices
Source:S&P Case-Shiller
Year-Over-Year, 20 City Composite 19.6% 19.1% 18.5% 18.3% 18.6% 18.9% 20.3% 21.1% 21.2% 20.5% 18.7% 16.1% Aug Sept Oct Nov Dec Jan 2022 Feb Mar Apr May June July
Year-Over-Year % Change in Price
August 2022
Source:CoreLogic
13.5% 3.2% Current Forecast
Housing Inventory

Change in Inventory
Month-Over-Month, September 2022

Source: realtor.com
Months Inventory of Homes for Sale
Source: NAR
2011 - Today 1.5 2.5 3.5 4.5 5.5 6.5 7.5 8.5 9.5 January 2011 January 2012 January 2013 January 2014 January 2015 January 2016 January 2017 January 2018 January 2019 January 2020 January 2021 January 2022
Months Inventory of Homes for Sale
Source: NAR
Since 2019 3.8 3.6 3.8 4.2 4.3 4.3 4.2 4.0 4.0 3.9 3.7 3.0 3.1 3.1 3.3 4.0 4.6 3.9 3.1 3.0 2.7 2.5 2.3 1.9 1.9 2.0 2.1 2.3 2.5 2.5 2.6 2.6 2.4 2.4 2.1 1.7 1.6 1.7 1.9 2.2 2.6 2.9 3.2 3.2 1.5 2.0 2.5 3.0 3.5 4.0 4.5 5.0 5.5 6.0 Jan-19 Feb Mar Apr May June July Aug Sept Oct Nov Dec Jan-20 Feb Mar Apr May June July Aug sept Oct Nov Dec Jan-21 Feb Mar Apr May June July Aug Sept Oct Nov Dec Jan-22 Feb Mar Apr May June July Aug
Months Inventory of Homes for Sale
Source: NAR
Last 12 Months 2.4 2.4 2.1 1.7 1.6 1.7 1.9 2.2 2.6 2.9 3.2 3.2 0 1 2 3 4 5 6 Sept Oct Nov Dec 22-Jan Feb Mar Apr May June July Aug
Year-Over-Year Inventory Levels
Source: NAR
-30% -25% -20% -15% -10% -5% 0% 5% 10% January 2014 January 2015 January 2016 January 2017 January 2018 January 2019 January 2020 January 2021 January 2022 % 7. 5. 3. 6. 6. 5. 5. 4. 6. 5. 5. -0 -0 -0 2. -0 1. 0. -4 -1 -3 -4 -1 -3 -2 -1 -1 -3 -9 -5 -5 -1 -6 -1 -9 -6 -7 -6 -6 -9 -8 -7 -9 -6 -6 -1 -9 -1 -9 -8 -7 -6 -6 0. 0. 2. 1. 2. 4. 6. 4. 2. 2. 1. 2. 0. -1 -2 -2 -4 -5 -9 -1 -9 -1 -1 -1 -1 -2 -1 -1 -1 -2 -2 -2 -2 -2 -2 -2 -1 -1 -1 -1 -9 -1 -1 -1 -1 -9 -1 -4 2. 0. 0.
Year-Over-Year Inventory Levels
12 Months
Source: NAR
Last
-13.8% -12.8% -9.8% -13.3% -18.0% -17.9% -15.5% -9.5% 10.4% -4.1% 2.4% 0.0% 0.0% Aug Sept Oct Nov Dec Jan 2022 Feb Mar Apr May June July AugustJune July Aug
New
Monthly Inventory
Adjusted,
Months
Source: Census
Home
Seasonally
Last 12
6.1 6.9 6.2 5.6 5.7 6.0 7.0 8.4 8.3 9.2 10.4 8.1 Sept Oct Nov Dec Jan 22 Feb Mar Apr May June Jul Aug
New
Monthly Inventory
Non-Seasonally Adjusted
Source: Census
Home
3.9 4.4 3.7 4.3 5.0 5.8 5.9 6.9 6.5 7.6 7.3 6.4 5.7 6 7 8.4 8.3 9.2 10.4 8.1 Jan Feb Mar Apr May June July Aug Sept Oct Nov Dec 2021 2022
Buyer Demand

End of Summer Sees Continued Slowdown of Home Showing Activity
Year-Over-Year Increase in Showing Activity, August 2022
Michael Lane, Vice President & General Manager, Showing Time
“The more moderate pace at which home showings are slowing down and the increase in markets that saw more showings per listing this month are signs that the market may be starting to find a new balance. Buyers will continue to see less competition for homes and have more time to tour homes they like and consider their options.”
Source: ShowingTime
-12.2% -4.3% -8.5% -22.2% -37.0% U.S. Midwest South West Northeast
Mortgage Rates

Rates
2.0 2.5 3.0 3.5 4.0 4.5 5.0 5.5 6.0 6.5 7.0 Source: Freddie Mac Mortgage
30-Year Fixed Rate, January 2018–Today 6.70%
2.0 2.5 3.0 3.5 4.0 4.5 5.0 5.5 6.0 6.5 7.0 1/7/16 2/4 3/3 4/7 5/5 6/2 7/7 8/4 9/1 10/6 11/3 12/1 1/5/2017 2/2 3/2 3/30 4/27 5/25 6/22 7/20 8/17 9/14 10/12 11/9 12/7 1/4/2018 2/1 3/1 4/5 5/4 6/7 7/5 8/2 9/6 10/4 11/1 12/6 1/3/2019 1/31 3/7 4/4 5/2 6/6 7/3 8/1 9/5 10/3 11/7 12/5 1/2/2020 2/6 3/5 4/2 5/7 6/4 7/2 8/6 9/3 10/1 11/5 12/3 1/7/2021 2/4 3/4 4/1 5/6 6/3 7/1 8/5 9/2 10/7 11/4 12/2 1/6/2022 2/3 3/3 4/7 5/5 6/2 7/7 8/4 9/1 Source: Freddie Mac Mortgage Rates 30-Year Fixed Rate, January 2016–Today 6.70%
Mortgage Rate Projections October 2022 Quarter Freddie Mac Fannie Mae MBA NAR Average of All Four 2023 1Q 5.2 5.7 5.3 6.5 5.68% 2023 2Q 5.2 5.6 5.3 6.4 5.63% 2023 3Q 5.0 5.6 5.1 6.3 5.50% 2023 4Q 5.0 5.5 5.0 6.1 5.40%
Mortgage
2.0 2.5 3.0 3.5 4.0 4.5 5.0 5.5 6.0 6.5 7.0 2018 2/1 3/1 4/5 5/3 6/7 7/5 8/2 9/6 10/4 11/1 12/6 2019 1/31 3/7 4/4 5/2 6/6 7/3 8/1 9/5 10/3 11/7 12/5 2020 2/6 3/5 4/2 5/7 6/4 7/2 8/6 9/3 10/1 11/5 12/3 2021 2/4 3/4 4/1 5/6 6/3 7/1 8/5 9/2 10/7 11/4 12/2 2022 2/3 3/3 4/7 5/5 6/2 7/7 8/4 9/1 5.2 5.2 5.0 5.0 2023 Q1 2023 Q2 2023 Q3 2023 Q4 Source: Freddie Mac
Rates 30-Year Fixed Rate January 2018 – Today Actual Interest Rates Where Are They Going?
Mortgage Rates
30-Year Fixed Rate
Source: Freddie Mac
2016 Q1 2016 Q2 2016 Q3 2016 Q4 2017 Q1 2017 Q2 2017 Q3 2017 Q4 2018 Q1 2018 Q2 2018 Q3 2018 Q4 2019 Q1 2019 Q2 2019 Q3 2019 Q4 2020 Q1 2020 Q2 2020 Q3 2020 Q4 2021 Q1 2021 Q2 2021 Q3 2021 Q4 2022 Q1 2022 Q2 2022 Q3 2022 Q4 2023 Q1 2023 Q2 2023 Q3 2023 Q4 Rate 3.7 3.6 3.5 3.8 4.2 4.0 3.9 3.9 4.3 4.5 4.6 4.8 4.4 4 3.7 3.7 3.5 3.2 3.0 2.8 2.9 3.0 2.9 3.1 3.8 5.3 5.5 5.4 5.2 5.2 5.0 5.0 2.5 3 3.5 4 4.5 5 5.5 6 - Actual - Projected 2016 2017 2018 2019 2020 2021 2023 2022
Mortgage Credit Availability

Mortgage Credit Availability Index (MCAI)
August 2022
Source: MBA
100 110 120 130 140 150 160 170 180 190 Apr 2013 Jan 2014 Jan 2015 Jan 2016 Jan 2017 Jan 2018 Jan 2019 Jan 2020 Jan 2021 Jan 2022
Mortgage Credit Availability Index (MCAI)
August 2022
Source: MBA
100 110 120 130 140 150 160 170 180 190 Apr 2013 Jan 2014 Jan 2015 Jan 2016 Jan 2017 Jan 2018 Jan 2019 Jan 2020 Jan 2021 Jan 2022 108.3
Housing Market Statistics for Northeast Valley Single Family Homes

in Carefree, Cave Creek, Fort McDowell, Fountain Hills, Paradise Valley, Rio Verde and Scottsdale, Arizona
for
Average Price per Sq Ft
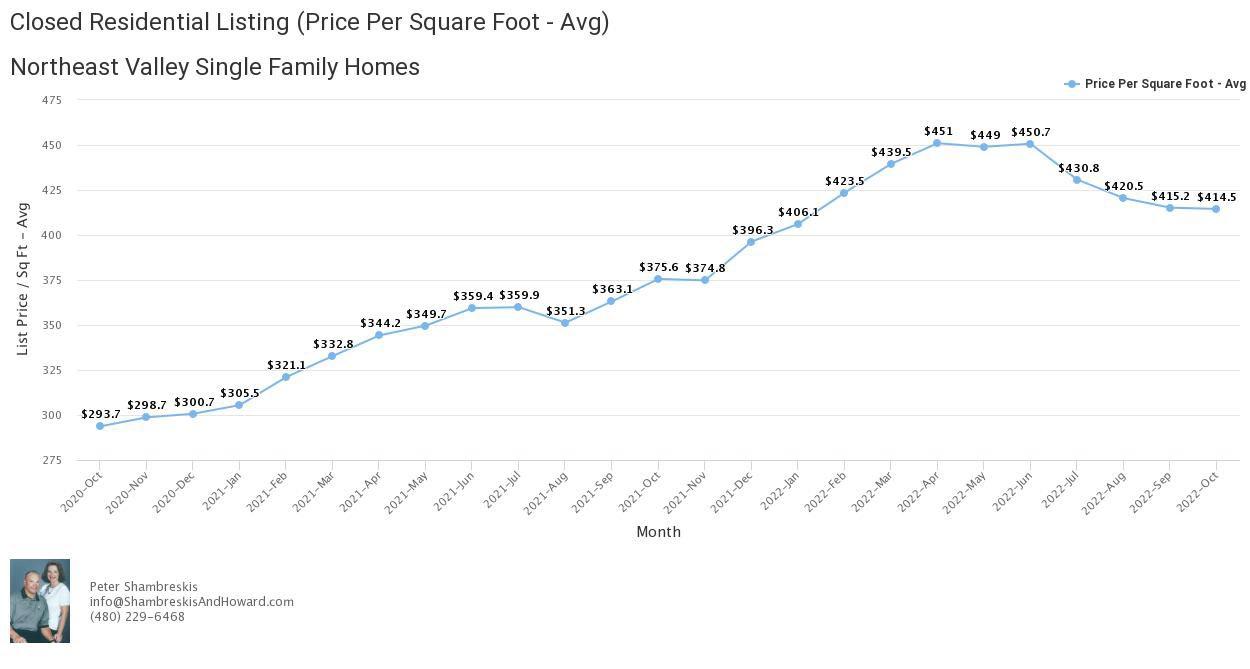
Valley Single Family Homes
Sold Northeast
Average Days on Market
for Sold Northeast Valley Single Family Homes

Number of Active Listings
for Northeast Valley Single Family Homes

Average Price per Sq Ft for Active Northeast Valley Listings


Peter Shambreskis, REALTOR®, ABR, CRS, GRI, SFR 480-229-6468 Corinne Howard, REALTOR®, ePRO, GRI, SFR, SRS 480-229-6467 info@ShambreskisAndHoward.com www.ShowScottsdaleHomes.com CONTACT US TO DISCUSS YOUR LOCAL ARIZONA REAL ESTATE MARKET