August 2022 DPR Realty

What’s Happening in the Current Housing Market?


Source: Freddie Mac Freddie Mac 30-Year Fixed Rate, January 2022–Today 3.22 3.45 3.56 3.55 3.55 3.69 3.92 3.89 3.76 3.85 4.16 4.42 4.67 4.72 5.00 5.11 5.10 5.27 5.30 5.25 5.10 5.09 5.23 5.78 5.81 5.70 5.30 5.51 5.54 5.30 4.99 1/6 1/13 1/20 1/27 2/3 2/10 2/17 2/24 3/3 3/10 3/17 3/24 3/31 4/7 4/14 4/21 4/28 5/5 5/12 5/19 5/26 6/2 6/9 6/16 6/23 6/30 7/7 7/14 7/21 7/28 8/4 Weekly Mortgage Rates Continue To Fluctuate
What Is Recession?a The National Bureau of Economic Research (NBER) defines a recession as: “. . . a significant decline in economic activity spread across the economy, lasting more than a few months, normally visible in real GDP, real income, employment, industrial production, and wholesale-retail sales.” Source: NBER
Source : Compound Is a Recession 2 Consecutive Quarters of Negative Growth? (1949–2022) Real GDP: Number of Consecutive Negative Quarters Start Quarter End Quarter Recession 2 Q1 1949 Q2 1949 Yes 3 Q3 1953 Q1 1954 Yes 2 Q4 1957 Q1 1958 Yes 2 Q4 1969 Q1 1970 Yes 3 Q3 1974 Q1 1975 Yes 2 Q2 1980 Q3 1980 Yes 2 Q4 1981 Q1 1982 Yes 2 Q4 1990 Q1 1991 Yes 4 Q3 2008 Q2 2009 Yes 2 Q1 2020 Q2 2020 Yes 2 Q1 2022 Q2 2022 ?
Source: WSJ Is There a Recession Around the Corner? Percentage of Economists Surveyed Who Believe We Will See a Recession in the Next 12 Months 12% 16% 18% 28% 44% 49% July 2021 October 2021 January 2022 April 2022 June 2022 July 2022
How Would Housing Be Impacted by a Recession?

Sources: CoreLogic, The Balance A Recession Does Not Mean Falling Prices Home Price Change During Last 6 Recessions 6.1% 3.5% -1.9% 6.6% -19.7% 6.0% 1980 1981 2001 2020 20081991
-4.25 -5.00 -2.25 -0.63 -1.13 -1.00 1980 1981 1991 2001 2008 2020 Source: Freddie Mac, Mortgage Specialists A Recession Means Falling Mortgage Rates Mortgage Rates in the Last 6 Recessions from Peak to Trough
Source: Freddie Mac, Mortgage Specialist Mortgage Rates & Recessions 20181614121086420 4/2/1971 4/2/1972 4/2/1973 4/2/1974 4/2/1975 4/2/1976 4/2/1977 4/2/1978 4/2/1979 4/2/1980 4/2/1981 4/2/1982 4/2/1983 4/2/1984 4/2/1985 4/2/1986 4/2/1987 4/2/1988 4/2/1989 4/2/1990 4/2/1991 4/2/1992 4/2/1993 4/2/1994 4/2/1995 4/2/1996 4/2/1997 4/2/1998 4/2/1999 4/2/2000 4/2/2001 4/2/2002 4/2/2003 4/2/2004 4/2/2005 4/2/2006 4/2/2007 4/2/2008 4/2/2009 4/2/2010 4/2/2011 4/2/2012 4/2/2013 4/2/2014 4/2/2015 4/2/2016 4/2/2017 4/2/2018 4/2/2019 4/2/2020 4/2/2021 4/2/2022 30-year Fixed Rate Recessions 16% 11.75%to 18% to 13% 11% to 8.75% 7.375% to 6.75% 6% 4.875%to 3.75%2.75%to
- Fortune
Over the past five recessions, mortgage rates have fallen an average of 1.8 percentage points from the peak seen during the recession to the trough. And in many cases, they continued to fall after the fact as it takes some time to turn things around even when the recession is technically over.

Why the Housing Market Won’t Crash


Source: NAR Not Enough Homes for Sale Total housing inventory registered at the end of June was 1,260,000 units. Unsold inventory sits at a 3.0-month supply at the current sales pace. 4.8 4.5 4.6 4.7 4.6 4.3 4.5 6.5 8.9 10.4 8.8 9.4 8.3 5.9 4.9 5.2 4.8 4.4 3.9 4.0 3.9 3.1 2.3 3.0 1999 2000 2001 2002 2003 2004 2005 2006 2007 2008 2009 2010 2011 2012 2013 2014 2015 2016 2017 2018 2019 2020 2021 Today
Source: Census Monthly New Residential Construction June 2022, in Thousands of Units Building Permits Housing Starts Under Construction at End of Period 1,9001,8501,8001,7501,7001,6501,6001,5501,5001,4501,400 Jul Aug Sep Oct Nov Dec Jan22 Feb Mar Apr May Jun Seasonally adjusted annual rate of 1,685,000 Seasonally adjusted annual rate of 1,583,000 1,9001,8001,7001,6001,5001,400 Jul Aug Sep Oct Nov Dec Jan22 Feb Mar Apr May Jun 1,8001,7001,6001,5001,4001,3001,2001,1001,000 Jul Aug Sep Oct Nov Dec Jan22 Feb Mar Apr May Jun Seasonally adjusted annual rate of 1,559,000 Housing Units Completed Seasonally adjusted annual rate of 1,365,000 1,7001,6001,5001,4001,3001,2001,1001,000 Jul Aug Sep Oct Nov Dec Jan22 Feb Mar Apr May Jun
Source: MBA Lending Standards Still Under Control Historical Data for the Mortgage Credit Availability Index (MCAI) 9008007006005004003002001000 2004June 2005June 2006June 2007June 2008June 2009June 2010June 2011June 2012June 2013June 2014June 2015June 2016June 2017June 2018June 2019June 2020June 2021June 2022June Housing Bubble: 868.7 119.6
Source: ATTOM Data Solutions Foreclosure Activity by Year U.S. Properties with Foreclosure Filings: ATTOM 2021 Year-End Report 533K 718K 1.3M 2.3M 2.8M 2.9M 1.9M 1.8M 1.4M 1.1M 1.1M 933K 677K 624K 493K 214K 151K 2005 2006 2007 2008 2009 2010 2011 2012 2013 2014 2015 2016 2017 2018 2019 2020 2021 Over 1 Million
Source: ATTOM Data Solutions First-Half Foreclosure Activity by Year U.S. Properties with Foreclosure Filings: January–June 1,332,991 1,528,364 1,654,634 1,170,402 1,045,801 801,359 613,874 597,589 535,829 428,400 362,275 296,458 165,530 65,082 164,581 2008 2009 2010 2011 2012 2013 2014 2015 2016 2017 2018 2019 2020 2021 2022
29.4%18.5%6.7%11.2%15.8%17.2% Source: MBA Loans upon Exiting Forbearance Program Made their monthly payments during their forbearance period Loan deferral Past broughtpaymentsduewerecurrentLoanpaidoffModificationNomitigationlossplan Cumulative forbearance exits for the period from June 1, 2020 through June 30, 2022 1.2% Short sales,repaymentdeeds-in-lieu,plans36.4% were paid in full 45.2% were work outs or repayment plans 18.4% were still in trouble
Foreclosure activity across the United States continued its slow, steady climb back to pre-pandemic levels in the first half of 2022. . . . While overall foreclosure activity is still running significantly below historic averages, the dramatic increase in foreclosure starts suggests that we may be back to normal levels by sometime in early 2023. - Rick Sharga, Executive VP of Market Intelligence, ATTOM
Neutral Market (6-7 Months)Source:NAR Months’ Inventory of Homes for SaleSellers’Market (< 6 Months) Buyers’Market (> 7 Months) Today 20062007 2008 2010131211109876543210 1999
What’s Ahead for the Rest of 2022?

Mortgage Rate Projections JulyQuarter2022 FreddieMac FannieMae MBA NAR ofAverageAllFour 2022 4Q 5.4 5.4 5.2 5.3 5.33% 2023 1Q 5.2 5.3 5.0 5.3 5.20% 2023 2Q 5.2 5.1 5.0 5.4 5.18% 2023 3Q 5.0 5.0 4.9 - 4.97%
There could be “a potential silver lining” for the market, he added, as stabilizing mortgage rates and rising inventory “may bring some buyers back to the market during the second half of the year.” Kan,
Economist, MBA
- CNBC, Quoting Joel
Home Price Forecasts for 2022 10.3% 16.0% 12.8% 11.5% 10.0% 9.6% 9.3% 2.7% Average of All 7 Forecasts Fannie Mae Freddie Mac NAR Zelman CoreLogic HPES MBA
I don’t think national housing prices will decline in a meaningful way, . . . but there will be some price declines across the country. - Mark Zandi, Chief Economist, Moody’s Analytics
Source: NAR Existing Home Sales Seasonally Adjusted Annual Rate, in Millions 5.5 5.3 5.3 5.6 6.1 5.1 2017 2018 2019 2020 2021 June 2022
Total Home Sales Forecast 6.9 6.8 7.3 6.0 5.8 6.4 Freddie Mac Fannie Mae MBA January 2022 Forecast July 2022 Forecast In Millions
Source: NAR, GlobeNewsWire 3 Reasons To Buy a Home Today Fewer MultipleOfferAprilScenarios2022 average of 5.5 offers May 2022 average of 4.2 offers June 2022 average of 3.4 offers Fewer Homes Selling Above Asking Price Supply of Homes for Sale Is Growing Months’ Supply61%April2022 askingoversold 2022May askingoversold55% June2022 askingoversold51% 2.2 2.6 3.0 April2022 2022May June2022


Infographic

Fall Buyer & Seller Guides: September 2, 2022


ResourcesSlide(s)Description Link(s) 3 Mortgage Rate Graph https://freddiemac.gcshttp://www.freddiemac.com/pmms/-web.com/node/25666/pdf 4 What Is a Recession? ion,and%20wholesale%2Dretail%20sales.%E2%80%9Drecession/#:~:text=NBER%20has%20its%20own%20definithttps://www.forbes.com/advisor/investing/what-is-a5 Recession & GDP Table 73https://twitter.com/charliebilello/status/15526997756188958 6 Recession Survey archivehttps://www.wsj.com/articles/economic-forecasting-survey--11617814998(subscriptionrequired) 8 Recession & Pricing Graph instories/corelogichttps://www.corelogic.com/intelligence/findthehttps://www.thebalance.com/therecessionshttps://www.corelogic.com/blog/2019/03/housing--and-recoveries.aspx-history-of-recessions-in--united-states-3306011--hpi-posted-record-year-over-year-growth--2021/ 9, 10 Recession & Rates rateshttps://mtghttp://www.freddiemac.com/pmms/-specialists.com/2022/05/11/recession-interest--and-real-estate/
14 New Construction
ResourcesSlide(s)Description
resources/newsroomhttps://www.mba.org/news-research-and-https://www.mba.org/news-and-research/newsroom/news/2022/07/12/mortgage-credit-availability-decreased-in-june
16 Foreclosure Activity Graph
markettrends/foreclosures/attomhttps://www.attomdata.com/news/market--year-end-2021-u-s-foreclosure--report/
mortgagehttps://fortune.com/2019/06/19/next-recession-assets--rates/ Graph statistics/existinghttps://www.nar.realtor/research-and-statistics/housing--home-sales Graphs dfhttps://www.census.gov/construction/nrc/pdf/newresconst.p
markettrends/foreclosures/attomhttps://www.attomdata.com/news/market--midyear-2022-u-s-foreclosure--report/
18 Loans Upon Exiting Forbearance
11 Fortune Quote
Link(s)
loansresearch/newsroom/news/2022/07/18/sharehttps://www.mba.org/news-and--of-mortgage--in-forbearance-decreases-to-081-in-june
17 First-Half Foreclosure Activity Graph
13 Inventory
15 Lending Standards Graph
q2https://cdn.nar.realtor/sites/default/files/documents/forecastforecasts/forecasts/mortgagehttps://www.mba.org/docs/defaulthttps://www.fanniemae.com/media/44131/displayratesquarterlyhttps://www.freddiemac.com/research/forecast/20220720--forecast-market-slowdown-will-continue-high-andpricesexacerbate-source/research-and-financeforecastjuly2022.pdf--2022-us-economic-outlook-04-27-2022.pdf
declineshttps://www.cnbc.com/2022/07/27/mortgage-demand--further-even-as-interest-rates-drop-a-bit.html
23 CNBC/Kan Quote
https://www.nar.realtor/topics/existingnar.realtor-home-sales
ResourcesSlide(s)Description Link(s) 19 Sharga Quote
markettrends/foreclosures/attomhttps://www.attomdata.com/news/market-midyear-2022-u-s-foreclosure--report/
22 Mortgage Rate Projections
20 Buyers’ vs. Sellers’ Market Graph
ResourcesSlide(s)Description Link(s) 24 Home Price Forecasts
25 Zandi Quote markethttps://www.housingwire.com/articles/the-nations-housing--is-on-a-correction-course/ 26 Existing Home Sales Graph 2022https://cdn.nar.realtor/sites/default/files/documents/ehsstatistics/existinghttps://www.nar.realtor/research-and-statistics/housing--home-sales-05--overview-2022-06-21.pdf
forecasts/forecasts/mortgagehttps://www.mba.org/docs/defaulthttps://www.zelmanassociates.com/https://pulsenomics.com/surveys/#homeinstories/corelogichttps://www.corelogic.com/intelligence/findq3https://cdn.nar.realtor/sites/default/files/documents/forecastratesquarterlyhttps://www.freddiemac.com/research/forecast/20220720https://www.fanniemae.com/media/44131/display--forecast-market-slowdown-will-continue-high-andpricesexacerbate--2022-us-economic-outlook-07-27-2022.pdf-hpi-posted-record-year-over-year-growth--2021/priceexpectations(subscriptionrequired)-source/research-and-financeforecastjuly2022.pdf
Retractrelease/2022/05/19/2447085/0/en/Existinghttps://www.globenewswire.com/news5https://www.nar.realtor/newsroom/existinghttps://www.nar.realtor/topics/existingrealtorshttps://cdn.nar.realtor/sites/default/files/documents/2022realtorshttps://cdn.nar.realtor/sites/default/files/documents/2022-05--confidence-index-06-21-2022.pdf06-confidence-index-report-07-20-2022.pdf-home-saleshomesalesslid-4-in-June-HomeSales-2-4-in-April.html
29 Infographic ahttps://www.mykcm.com/2022/07/29/three-reasons-to-buy--home-in-todays-shifting-market-infographic/
ResourcesSlide(s)Description Link(s) 27 Home Sales Forecast
28 Reasons To Buy
commentary/mortgagehttps://www.mba.org/newsinsights/forecast/forecasthttps://www.fanniemae.com/researchhttps://www.freddiemac.com/research/forecast?page=0-and--monthly-archiveandresearch/forecastsand-finance-forecast-archives
Updates

41-43,
61-65 Existing
53,
index/#newscorelogichttps://www.spglobal.com/spdji/en/indices/indicators/sp--case-shiller-20-city-composite-home-price-nsa--research
CoreLogic Price Forecast insights/https://www.corelogic.com/intelligence/u-s-home-price-
https://www.nar.realtor/topics/existinghttp://www.census.gov/construction/nrs/pdf/newressales.pdf-home-sales Home Sales statistics/pendinghttps://www.nar.realtor/research-and-statistics/housing--home-sales Shiller
49, 50 Pending
55-57 Case
45-47 New
48 Total
Inventory http://www.census.gov/construction/nrs/pdf/newressales.pdfhttps://www.nar.realtor/topics/existing-home-sales
ResourcesSlide(s)Description
61-67
40
58
Link(s) Confidence Index reports/realtorshttps://www.nar.realtor/research-and-statistics/research--confidence-index 51, 54, Home Sales https://www.nar.realtor/topics/existing-home-sales Home Sales http://www.census.gov/newhomesaleshttp://www.census.gov/construction/nrs/pdf/newressales.pdf Home Sales
ResourcesSlide(s)Description Link(s) 69 Showing Activity indexhttps://www.showingtime.com/blog/june-2022-showing--results/ 71, 72, 74, 75 Mortgage Rates http://www.freddiemac.com/research/forecast/http://www.freddiemac.com/pmms/pmms_archives.html 73 Mortgage Rate Projections
77, 78 Mortgage AvailabilityCredit
resources/newsroomhttps://www.mba.org/news-research-and-https://www.mba.org/news-research-and-resources/research-and-economics/single-family-research/mortgage-credit-availability-index
https://www.nar.realtor/researchcommentaryresources/researchhttps://www.mba.org/newsinsights/forecast.htmlhttp://www.fanniemae.com/portal/researchhttp://www.freddiemac.com/research/forecast/--research-and--and-economics/forecasts-and--and-statistics
Home Sales

42 30 26 26 26 27 31 32 33 42 46 49 44 36 24 26 27 29 31 31 36 38 41 41 36 29 27 26 24 22 22 21 21 21 21 20 18 17 17 17 17 17 17 18 18 19 19 18 17 17 16 14 Mar-19 Apr May June July Aug Sept Oct Nov Dec Jan-19 Feb Mar Apr May June July Aug Sept Oct Nov Dec Jan-20 Feb Mar Apr May June July Aug Sept Oct Nov Dec Jan-21 Feb Mar Apr May June July Aug Sept Oct Nov Dec Jan-22 Feb Mar Apr May June Source: NAR Average Days on the Market June 2022
Source: NAR Existing Home Sales Since January 2014 6,800,0006,300,0005,800,0005,300,0004,800,0004,300,0003,800,000Jan2014 2015Jan 2016Jan 2017Jan 2018Jan 2019Jan 2020Jan 2021Jan 2022Jan
Source: NAR Existing Home Sales Year-Over-Year, by Region -14.2% -11.8% -9.6% -14.1% -21.3% U.S. Northeast Midwest South West
Source: NAR Existing Home Sales In Thousands 6005004003002001000 January February March April May June July August September October November December 2020 2021 2022
Source: Census New Home Sales In Thousands 9080706050403020100 January February March April May June July August September October November December 2020 2021 2022
Source: Census New Home Sales Annualized in Thousands 1060960860760660560460360jun-14 Jan-15 Jan-16 Jan-17 Jan-18 Jan-19 Jan-20 Jan-21 Jan-22
0% 6% 18% 10% 13% 2% Under $150K $150-$199K $200-299K $300-$399K $400-$499K $500-$749K Over Source:$750KCensus New Home Sales Percent of Distribution by Price Range * Less Than 500 Units or Less Than 0.5 Percent * *
Source: Census New Homes Selling Fast Median Months from Completion to Sold 3.2 3.6 3.6 3.4 3.5 3.6 3.4 3.2 3.5 3.1 3.2 3.0 3.4 3.4 3.4 3.3 3.6 4.2 4.3 4.5 4.5 4.2 4.0 3.6 3.2 3.7 5.1 4.9 4.5 4.1 4.5 3.6 3.1 2.5 2.9 3.2 2.8 2.7 3.5 3.5 2.7 2.5
Source: Census Total Home Sales In443Thousands436567 587 593 676 646 631 604 577 557 574 422 423 524 517 558 575 January February March April May June July August September October November December 2021 2022
Source: NAR Pending Home Sales 14013012011010090807060January2012 January2013 January2014 January2015 January2016 January2017 January2018 January2019 January2020 January2021 January2022 100 = Historically Healthy Level
Source: NAR Pending Home Sales Year-Over-Year by Region 100 = Historically Healthy Level -20.0% -17.6% -13.4% -19.2% -30.9% U.S. Northeast Midwest South West
Source: NAR Percentage of Distressed Property Sales Distressed Sales (Foreclosures and Short Sales) represented Less Than 1% of Sales in June. 35%30%25%20%15%10%5%0% 2012Jan 2013Jan 2014Jan 2015Jan 2016Jan 2017Jan 2018Jan 2019Jan 2020Jan 2021Jan 2022Jan 4%
Home Prices

13.4% 10.1% 10.2% 16.8% 9.6% U.S. Northeast Midwest South WestSource: NAR Sales Price of Existing Homes Year-Over-Year, by Region
Source: NAR % Change in Sales Year-Over-Year, by Price Range $0-100K $100-250K $250-500K $500-750K $750K-1M $1M+ % -26.5% -31.1% -10.8% 5.2% 6.3% 2.0% -26.5% -31.1% -10.8% 5.2% 6.3% 2.0%
Source: S&P Case-Shiller Change in Home Prices Year-Over-Year0%5%10%15%20%Jun2012Jan2013Jan2014 2015Jan 2016Jan 2017Jan 2018Jan 2019Jan 2020Jan 2021Jan 2022Jan
Source: S&P Case-Shiller 2014Jan Feb Mar Apr May Jun Jul Aug Sept Oct Nov Dec 2015Jan Feb Mar Apr May Jun Jul Aug Sept Oct Nov Dec 2016Jan Feb Mar Apr May Jun Jul Aug Sept Oct Nov Dec 2017Jan Feb Mar Apr May Jun Jul Aug Sept Oct Nov Dec 2018Jan Feb Mar Apr May Jun Jul Aug Sept Oct Nov Dec 2019Jan Feb Mar Apr May Jun Jul Aug Sept Oct Nov Dec 2020Jan Feb Mar Apr May Jun Jul Aug Sept Oct Nov Dec 2021Jan Feb Mar Apr May June July Aug Sept Oct Nov Dec 2022Jan Feb Mar Apr May Change in Home Prices Year-Over-Year, 20 City Composite
Source: S&P Case-Shiller Change in Home Prices Year-Over-Year, 20 City Composite 19.1% 20.0% 19.6% 19.1% 18.5% 18.3% 18.6% 18.9% 20.3% 21.1% 21.2% 20.5% June July Aug Sept Oct Nov Dec Jan 2022 Feb Mar Apr May
Source: CoreLogic Year-Over-Year % Change in Price June 2022 18.3% 4.3% Current Forecast
Housing Inventory

Source: realtor.com Change in Inventory Month-Over-Month, June 2022

Source: NAR Months Inventory of Homes for Sale 2011 - Today 9.58.57.56.55.54.53.52.51.5January2011 January2012 January2013 January2014 January2015 January2016 January2017 January2018 January2019 January2020 January2021 January2022
Source: NAR Months Inventory of Homes for Sale Since 2019 3.8 3.6 3.8 4.2 4.3 4.3 4.2 4.0 4.0 3.9 3.7 3.0 3.1 3.1 3.3 4.0 4.6 3.9 3.1 3.0 2.7 2.5 2.3 1.9 1.9 2.0 2.1 2.3 2.5 2.5 2.6 2.6 2.4 2.4 2.1 1.7 1.6 1.7 1.9 2.2 2.6 3.06.05.55.04.54.03.53.02.52.01.5 Jan-19 Feb Mar Apr May June July Aug Sept Oct Nov Dec Jan-20 Feb Mar Apr May June July Aug sept Oct Nov Dec Jan-21 Feb Mar Apr May June July Aug Sept Oct Nov Dec Jan-22 Feb Mar Apr May June
Source: NAR Months Inventory of Homes for Sale Last 12 Months 2.6 2.6 2.4 2.4 2.1 1.7 1.6 1.7 1.9 2.2 2.6 3.06543210 July Aug Sept Oct Nov Dec 22-Jan Feb Mar Apr May June
Source: NAR Year-Over-Year Inventory Levels -10%-15%-20%-25%-30%-5%0%5%10% January2014 January2015 January2016 January2017 January2018 January2019 January2020 January2021 January2022 % 7. 5. 3. 6. 6. 5. 5. 4. 6. 5. 5. -0 -0 -0 2. -0 1. 0. -4 -1 -3 -4 -1 -3 -2 -1 -1 -3 -9 -5 -5 -1 -6 -1 -9 -6 -7 -6 -6 -9 -8 -7 -9 -6 -6 -1 -9 -1 -9 -8 -7 -6 -6 0. 0. 2. 1. 2. 4. 6. 4. 2. 2. 1. 2. 0. -1 -2 -2 -4 -5 -9 -1 -9 -1 -1 -1 -1 -2 -1 -1 -1 -2 -2 -2 -2 -2 -2 -2 -1 -1 -1 -1 -9 -1 -1 -1 -1 -9 -1 -4 2.
Source: NAR Year-Over-Year Inventory Levels Last 12 Months -14.9% -13.8% -12.8% -9.8% -13.3% -18.0% -17.9% -15.5% -9.5% 10.4% -4.1% 2.4% July Aug Sept Oct Nov Dec Jan 2022 Feb Mar Apr May JuneJune
Source: Census New Home Monthly Inventory Seasonally Adjusted, Last 12 Months 6.0 6.5 6.1 6.9 6.2 5.6 5.7 6.0 7.0 8.6 8.4 9.3 jul Aug Sept Oct Nov Dec Jan 22 Feb Mar Apr May June
Source: Census New Home Monthly Inventory Non-Seasonally Adjusted 3.9 4.4 3.7 4.3 5.0 5.8 5.9 6.9 6.5 7.6 7.3 6.4 5.6 5.5 5.9 7.9 7.5 9.4 Jan Feb Mar Apr May June July Aug Sept Oct Nov Dec 20222021
Buyer Demand

Source: ShowingTime Buyer Demand Cools as Showings Decline from Record-Breaking Highs Year-Over-Year Increase in Showing Activity, June 2022 Michael Lane, Vice President & General Manager, Showing Time “Most markets are experiencing a slowdown in buyer activity, especially compared to the historically high traffic seen last year… While summer is a slower time of year for real estate compared to spring, the dip we’re seeing compared to last June suggests this slowing is more about a re-balancing of an overheated market than just marking the end of the home shopping season.” -18.7% -10.9% -16.7% -25.9% -44.1% U.S. Northeast Midwest South West
Mortgage Rates

6.05.55.04.54.03.53.02.52.0 Source: Freddie Mac Mortgage Rates 30-Year Fixed Rate, January 2018–Today 4.99%
6.05.55.04.54.03.53.02.52.0 1/7/16 2/4 3/3 4/7 5/5 6/2 7/7 8/4 9/1 10/6 11/3 12/1 1/5/2017 2/2 3/2 3/30 4/27 5/25 6/22 7/20 8/17 9/14 10/12 11/9 12/7 1/4/2018 2/1 3/1 4/5 5/4 6/7 7/5 8/2 9/6 10/4 11/1 12/6 1/3/2019 1/31 3/7 4/4 5/2 6/6 7/3 8/1 9/5 10/3 11/7 12/5 1/2/2020 2/6 3/5 4/2 5/7 6/4 7/2 8/6 9/3 10/1 11/5 12/3 1/7/2021 2/4 3/4 4/1 5/6 6/3 7/1 8/5 9/2 10/7 11/4 12/2 1/6/2022 2/3 3/3 4/7 5/5 6/2 7/7 8/4 Source: Freddie Mac Mortgage Rates 30-Year Fixed Rate, January 2016–Today 4.99%
Mortgage Rate Projections July 2022 Quarter FreddieMac FannieMae MBA NAR AverageofAllFour 2022 4Q 5.4 5.4 5.2 6.0 5.50% 2023 1Q 5.2 5.3 5.0 6.0 5.38% 2023 2Q 5.2 5.1 5.0 6.0 5.33% 2023 3Q 5.0 5.0 4.9 - 4.97%
6.05.55.04.54.03.53.02.52.0 2018 2/1 3/1 4/5 5/3 6/7 7/5 8/2 9/6 10/4 11/1 12/6 2019 1/31 3/7 4/4 5/2 6/6 7/3 8/1 9/5 10/3 11/7 12/5 2020 2/6 3/5 4/2 5/7 6/4 7/2 8/6 9/3 10/1 11/5 12/3 2021 2/4 3/4 4/1 5/6 6/3 7/1 8/5 9/2 10/7 11/4 12/2 2022 2/3 3/3 4/7 5/5 6/2 7/7 8/4 5.4 5.2 5.2 5.0 2022 Q4 2023 Q1 2023 Q2 2023 Q3 Source: Freddie Mac Mortgage Rates 30-Year Fixed Rate January 2018 – Today Actual Interest Rates Where Are They Going?
Source: Freddie Mac Mortgage Rates 30-Year Fixed Rate 2016Q1 2016Q2 2016Q3 2016Q4 2017Q1 2017Q2 2017Q3 2017Q4 2018Q1 2018Q2 2018Q3 2018Q4 2019Q1 2019Q2 2019Q3 2019Q4 2020Q1 2020Q2 2020Q3 2020Q4 2021Q1 2021Q2 2021Q3 2021Q4 2022Q1 2022Q2 2022Q3 2022Q4 2023Q1 2023Q2 2023Q3 2023Q4 Rate 3.7 3.6 3.5 3.8 4.2 4.0 3.9 3.9 4.3 4.5 4.6 4.8 4.4 4 3.7 3.7 3.5 3.2 3.0 2.8 2.9 3.0 2.9 3.1 3.8 5.3 5.5 5.4 5.2 5.2 5.0 5.0 5.54.53.52.53456 - Actual - Projected 2016 2017 2018 2019 2020 2021 2023 2022
MortgageAvailabilityCredit

Source: MBA Mortgage Credit Availability Index (MCAI) June 2022 190180170160150140130120110100 2013Apr 2014Jan 2015Jan 2016Jan 2017Jan 2018Jan 2019Jan 2020Jan 2021Jan 2022Jan
Source: MBA Lending Standards Still Under Control Historic Data for the Mortgage Credit Availability Index (MCAI) 9008007006005004003002001000 2004June 2005June 2006June 2007June 2008June 2009June 2010June 2011June 2012June 2013June 2014June 2015June 2016June 2017June 2018June 2019June 2020June 2021June 2022June Housing Bubble: 868.7 119.6
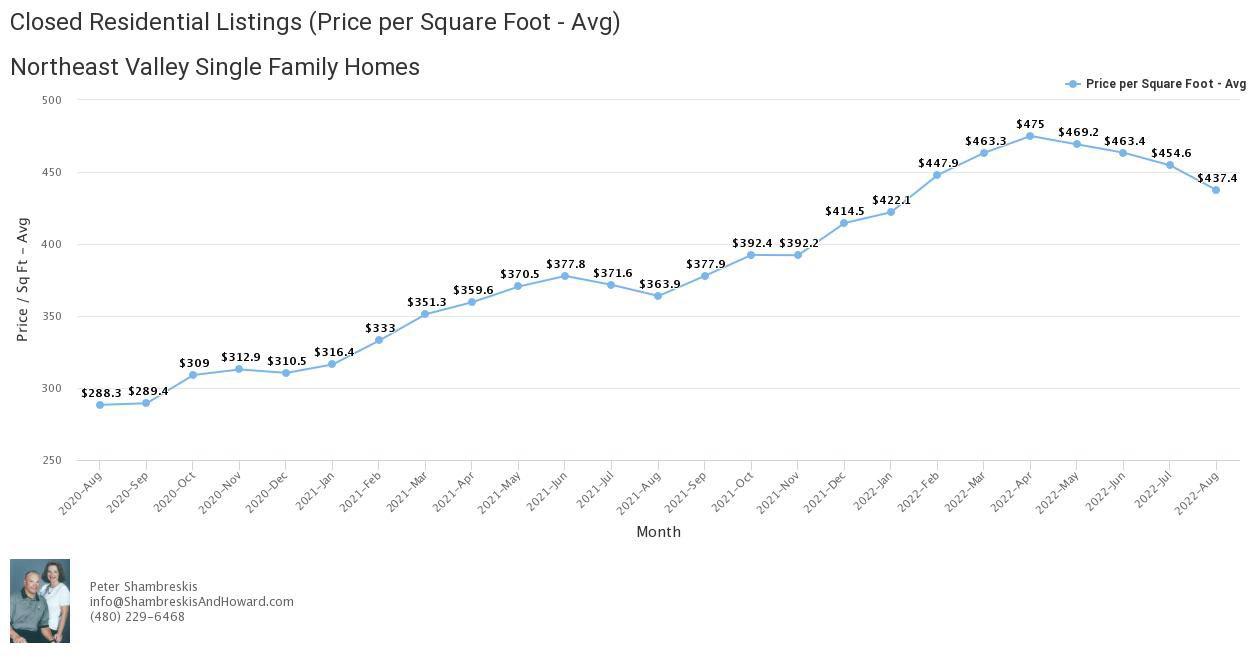
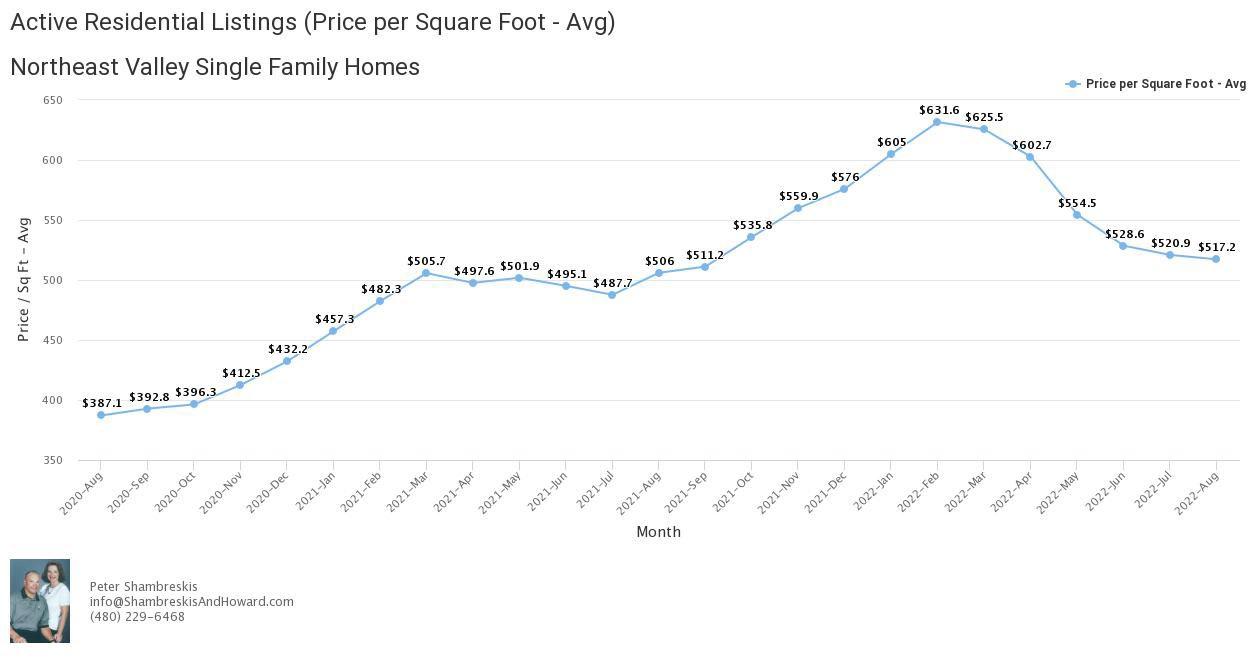
Housing Market Statistics for Northeast Valley Single Family Homes in Carefree, Cave Creek, Fort McDowell, Fountain Hills, Paradise Valley, Rio Verde and Scottsdale, Arizona

Average Price per Sq Ft for Sold Northeast Valley Single Family Homes
Average Days on Market for Sold Northeast Valley Single Family Homes

Number of Active Listings for Northeast Valley Single Family Homes

Average Price per Sq Ft for Active Northeast Valley Listings
Peter Shambreskis, REALTOR®, ABR, CRS, GRI, SFR 480-229-6468 Corinne Howard, REALTOR®, ePRO, GRI, SFR, SRS info@ShambreskisAndHoward.com480-229-6467www.ShowScottsdaleHomes.com CONTACT US TO DISCUSS YOUR LOCAL ARIZONA REAL ESTATE MARKET