NIHONBASHI FINAL REPORT

GEORGIA INSTITUTE OF TECHNOLOGY
APRIL, 2022

GEORGIA INSTITUTE OF TECHNOLOGY
APRIL, 2022
Eco-Urban Lab - School of City and Regional Planning & School of Architecture
College of Design - Georgia Institute of Technology
In Collaboration With:
Global Carbon Project (GCP)
Mitsui Fudosan - University of Tokyo Smart Cities Laboratory
Graduate School of System Design and Management, Keio University
Department of Urban Engineering, School of Urban Engineering, The University of Tokyo
School of City and Regional Planning and School of Architecture
College of Design
Georgia Institute of Technology
Instructor
Perry P J Yang
Professor and Director of Eco Urban Lab
Urban Design Studio
Muhammad Arsam
Regan Buchanan
Lu Chen
Stephen Conschafter
Maddy Clowse
Sebastian Foxley
Editor
Natalie Manitius
Rossana Franco-Pinilla
Mirna Garcia
Maggie Nicholson
Natalie Manitius
Tasha Snedaker
Olivia Wineski
The University of Tokyo
Akito Murayama
Associate Professor, Department of Urban Engineering, School of Engineering, The University of Tokyo, Japan
Takahiro Yoshida
Project Assistant Professor, Department of Urban Engineering, School of Engineering, The University of Tokyo, Japan
Keio University
Yoshiki Yamagata
Professor, Graduate School of System Design and Management, Keio University, Japan
Eri Natsume
Researcher, Graduate School of System Design and Management, Keio University, Japan
Mitsui Fudosan
Hideo Suda
Space & Environment Institute, Mitsui Fudosan Co., Ltd., Japan
Koichi Oota
Solution Partner Division, Mitsui Fudosan Co., Ltd., Japan
External Reviewers
Professor Alan Balfour
Mr. Yoshi Koshiyama
Dr. Yingying Kang
ESRI
Ms. Keera Morrish
Mr. Jason Karian
Guest Speakers
Ms. Soowan Chang
Mr. Mike Cutno
Cover Photo: By @wen_xiao via Unsplash
This proposal is the output of the urban design studio of the graduate school educational program, and does not reflect the intentions of local stakeholders.


The 3C’s: carbon neutrality, climate resiliency, & post-Covid-19 conscious
Our studio’s mission is to enhance the Nihonbashi neighborhood through:
1. Celebrating the progress and history of the neighborhood
2. Engaging stakeholders across social, cultural, and geographic distances
3. Ensuring that future development supports climate resiliency and livable and peoplefocused communities
4. Adding open spaces that support synergy between blue and green systems
5. Designing streetscapes and transit that makes movement enjoyable and accessible
6. Helping the neighborhood become more resilient to shocks such as Covid-19 or natural disasters
7. Anticipating trends and needs of population changes with land use
8. Harnessing smart technologies to enhance quality of life and economic opportunity, as well as our designs and processes
9. Catalyzing Tokyo’s pursuit of carbon neutrality by using Nihonbashi as an example.
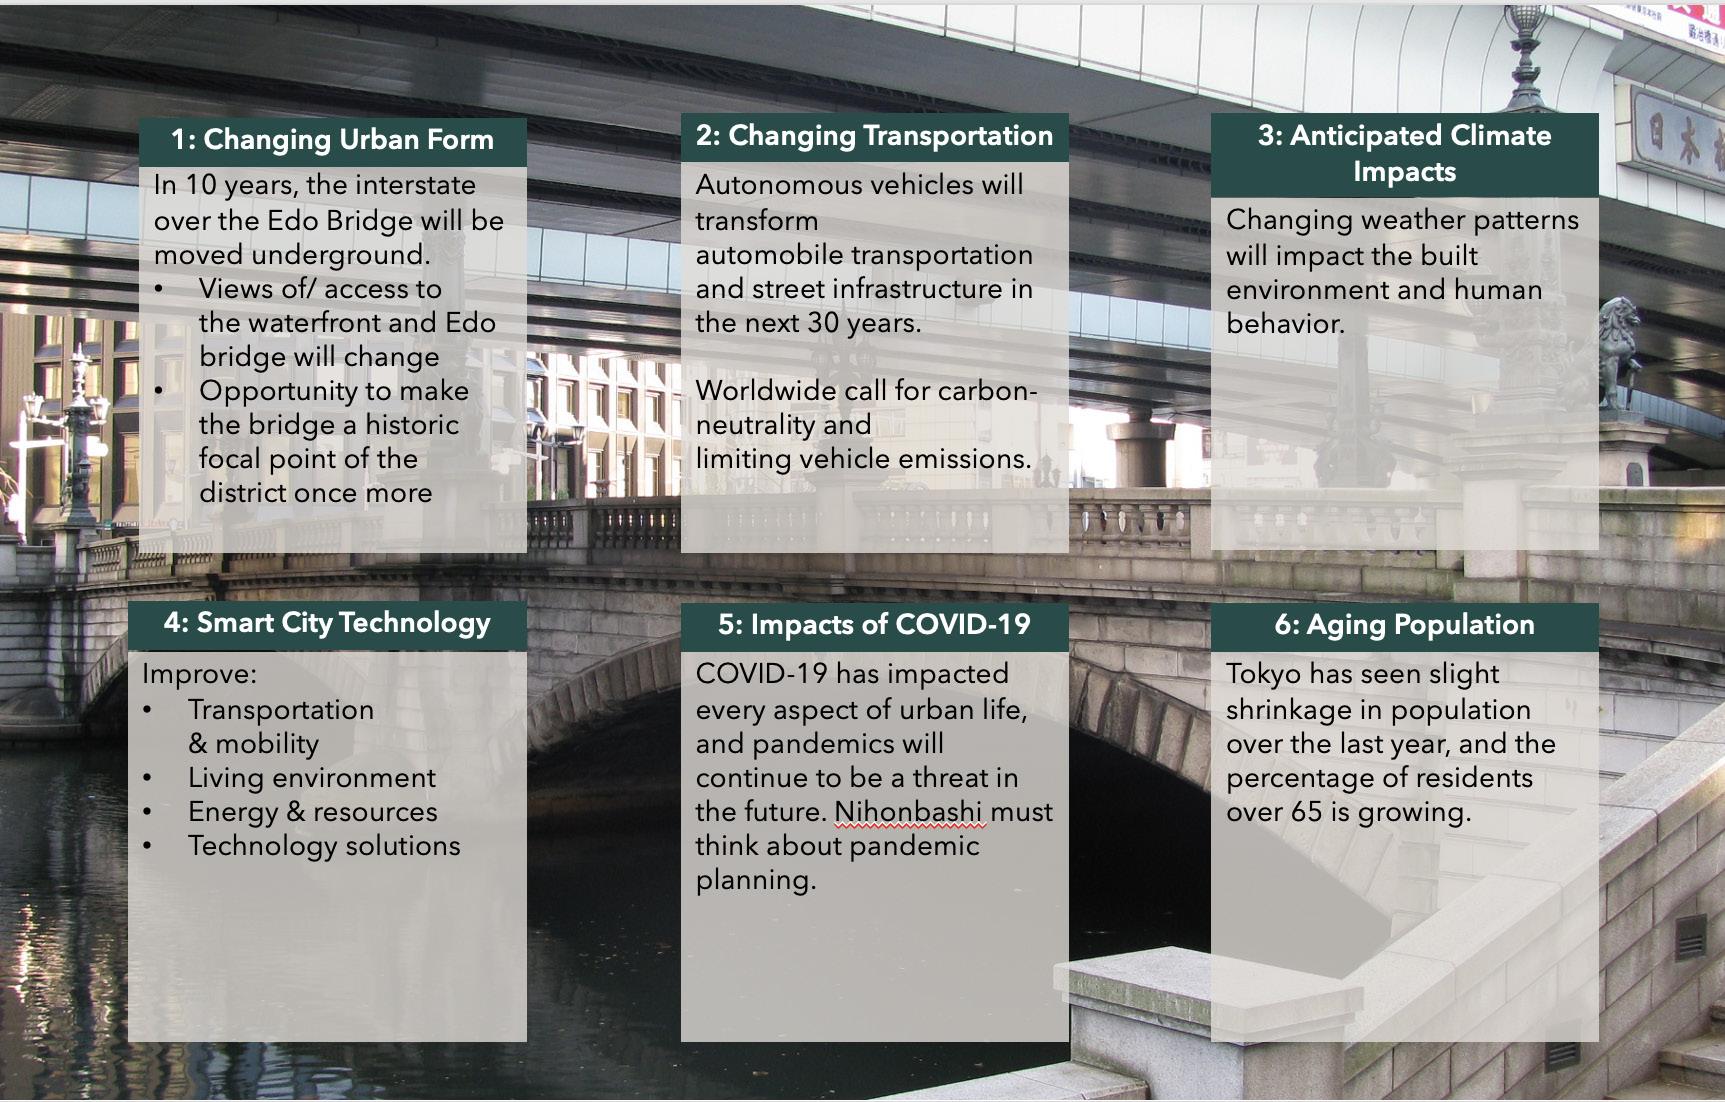
The following projections guided the Georgia Tech urban design studio’s planning and design proposals.
 Maggie Nicholson
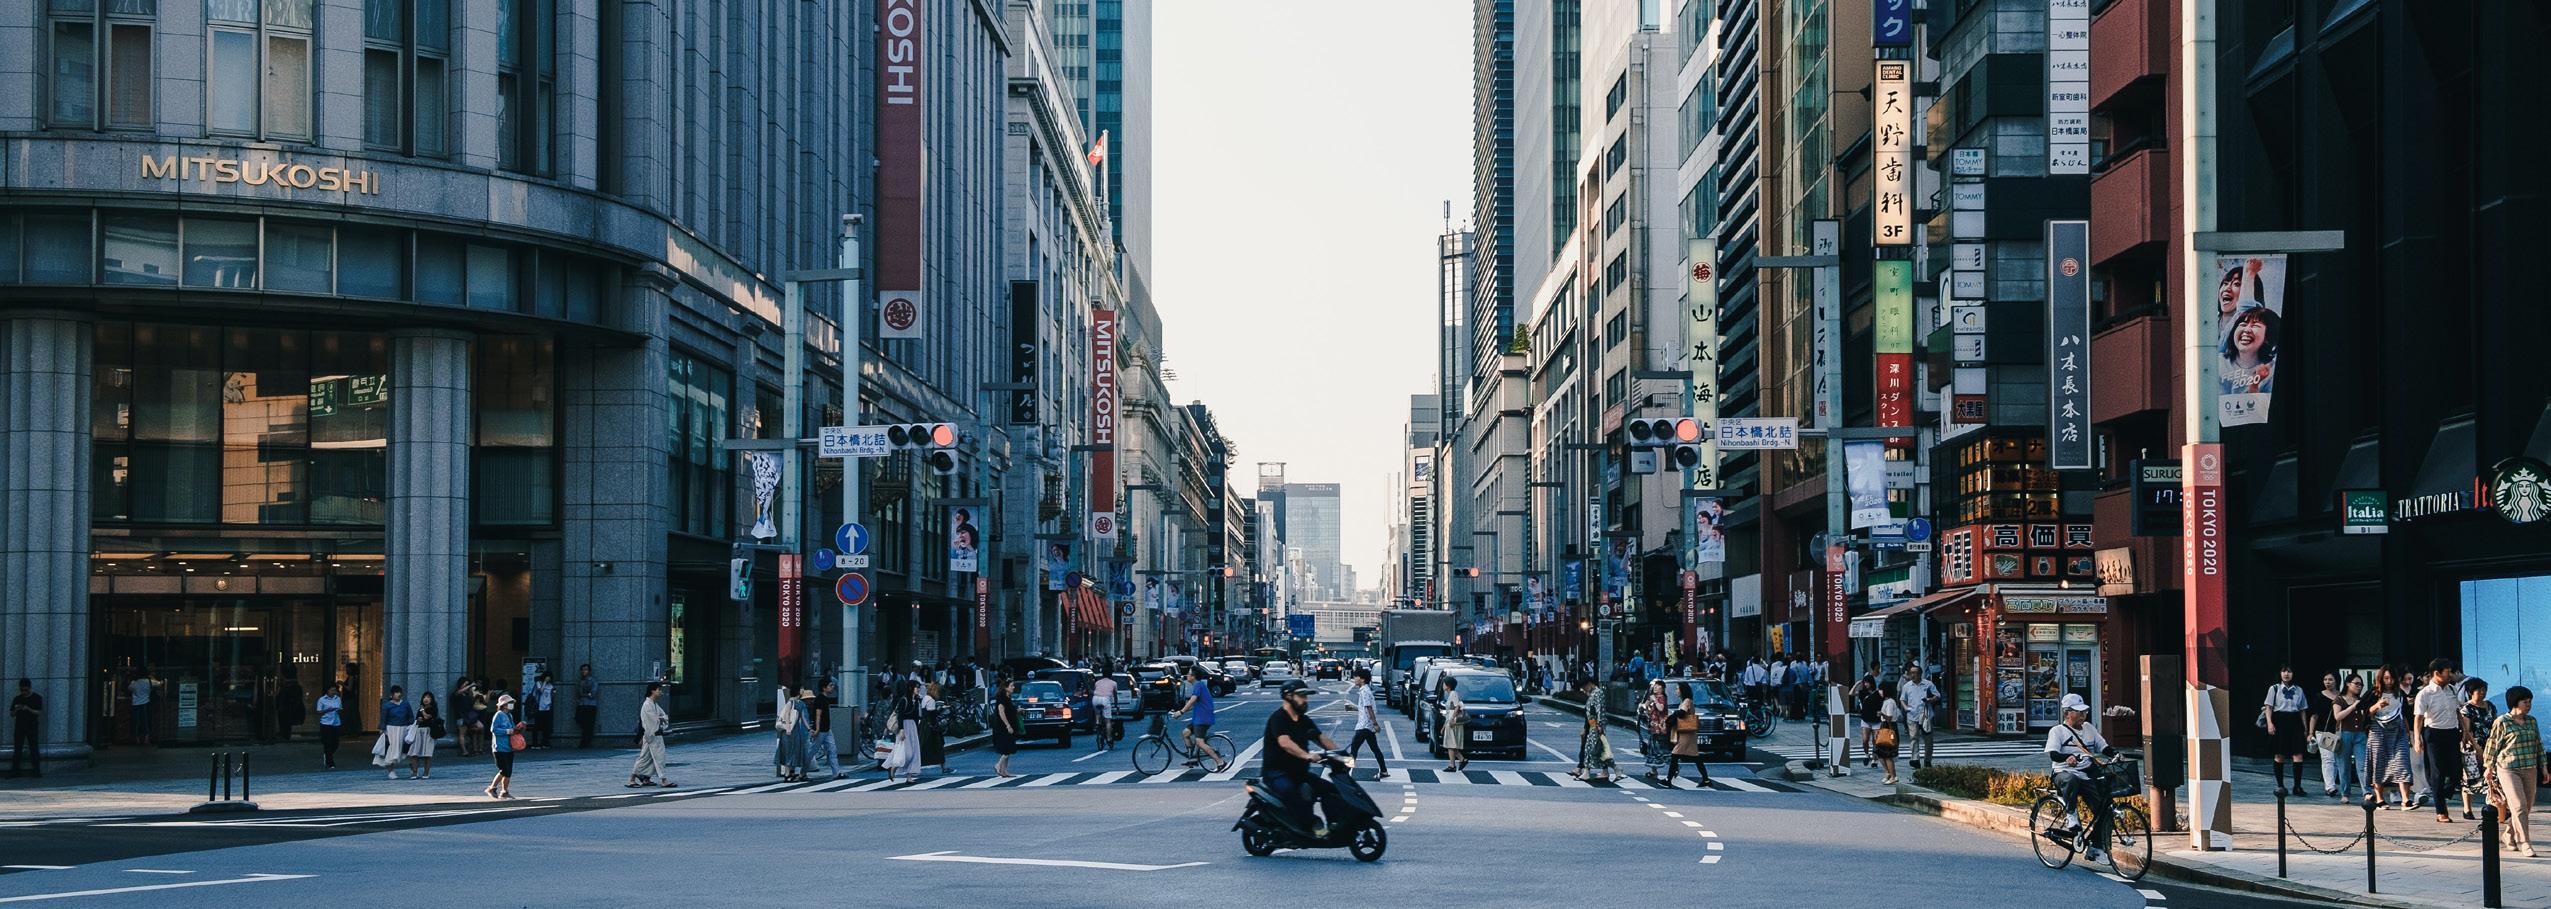
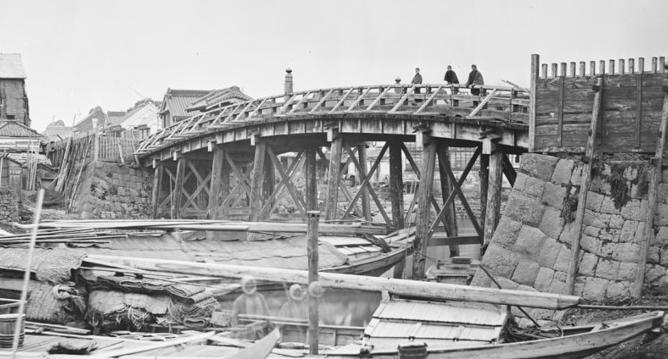
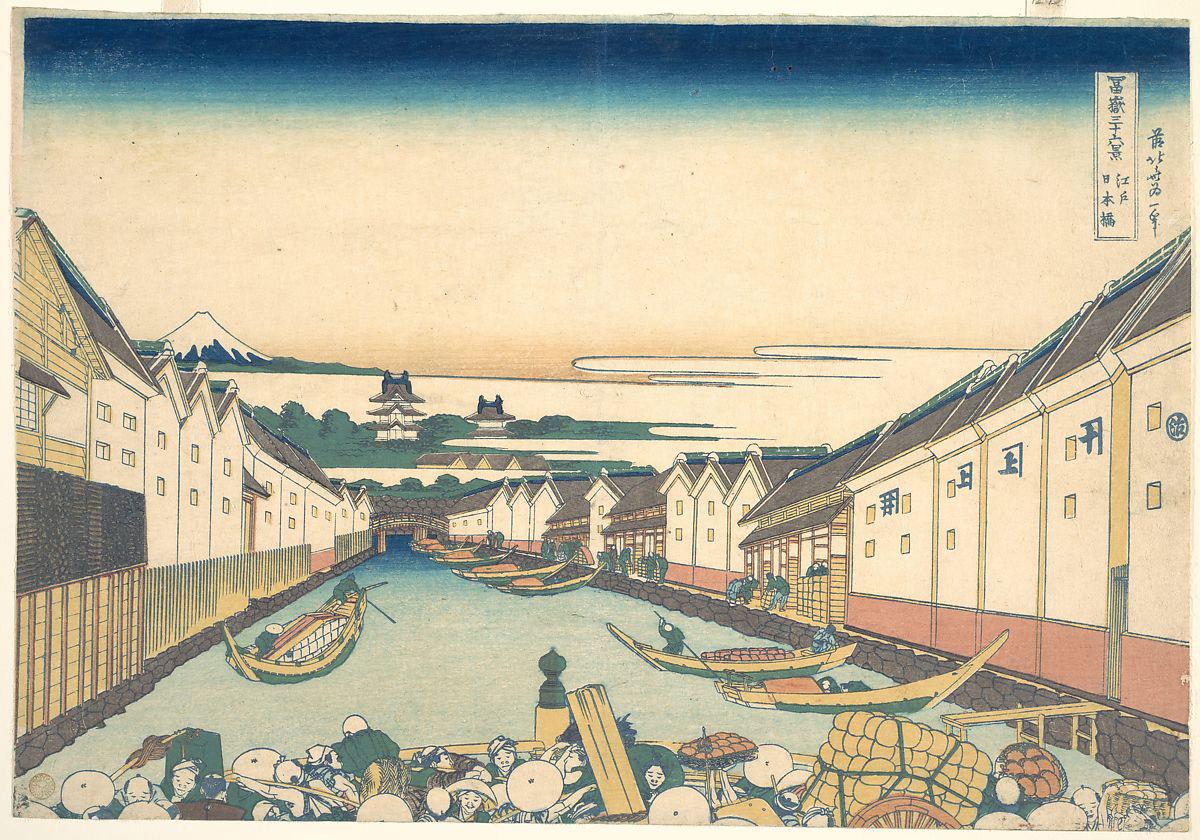
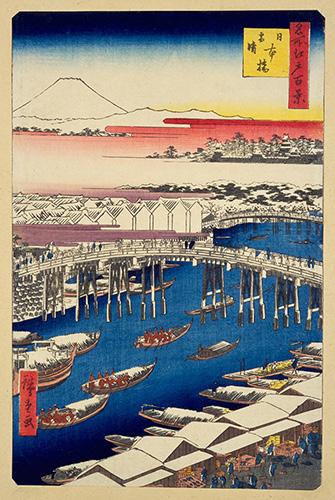
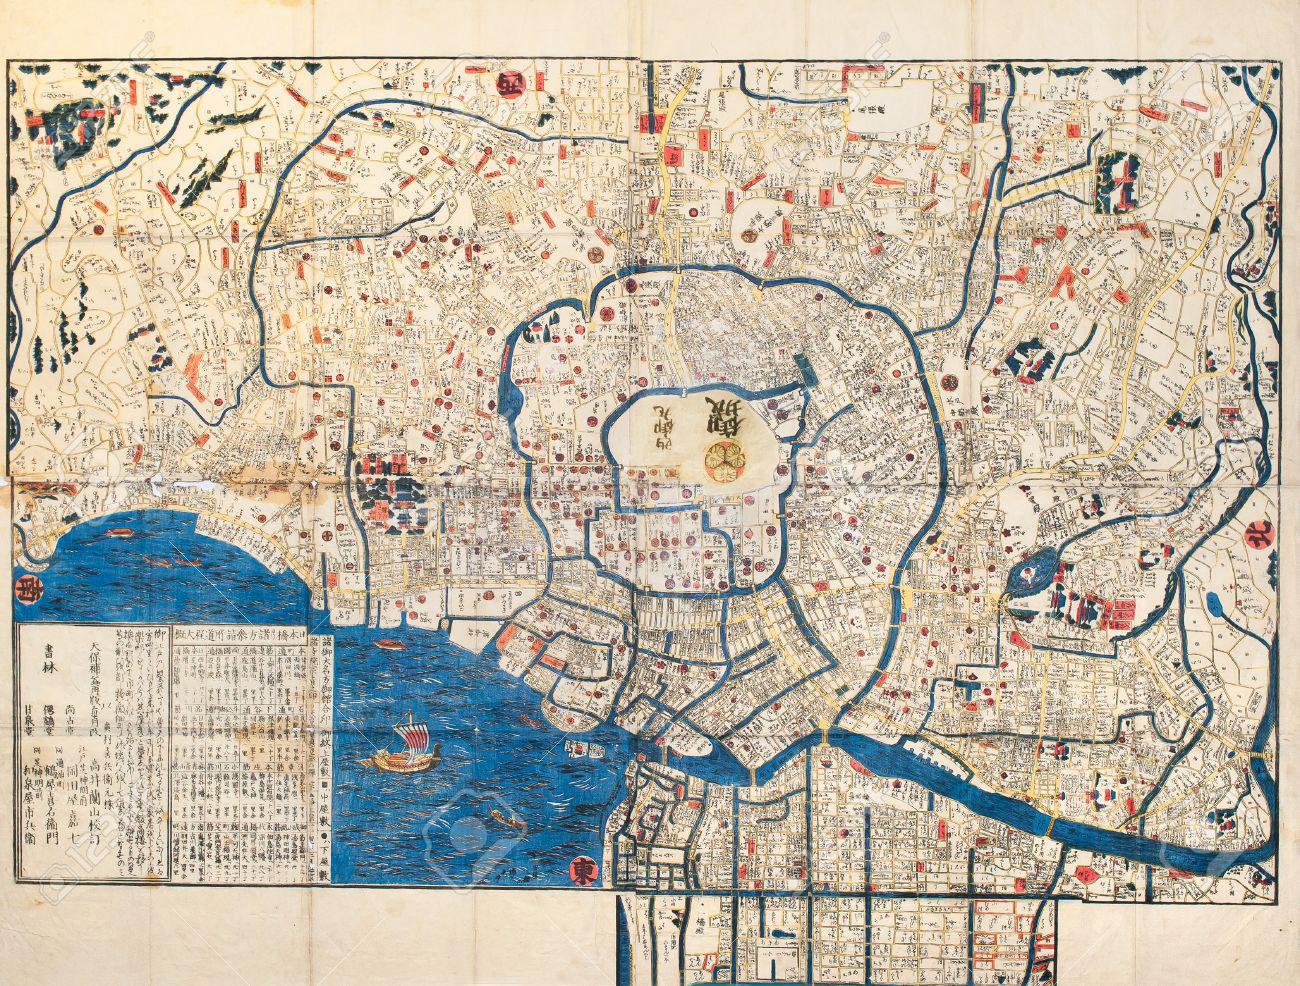
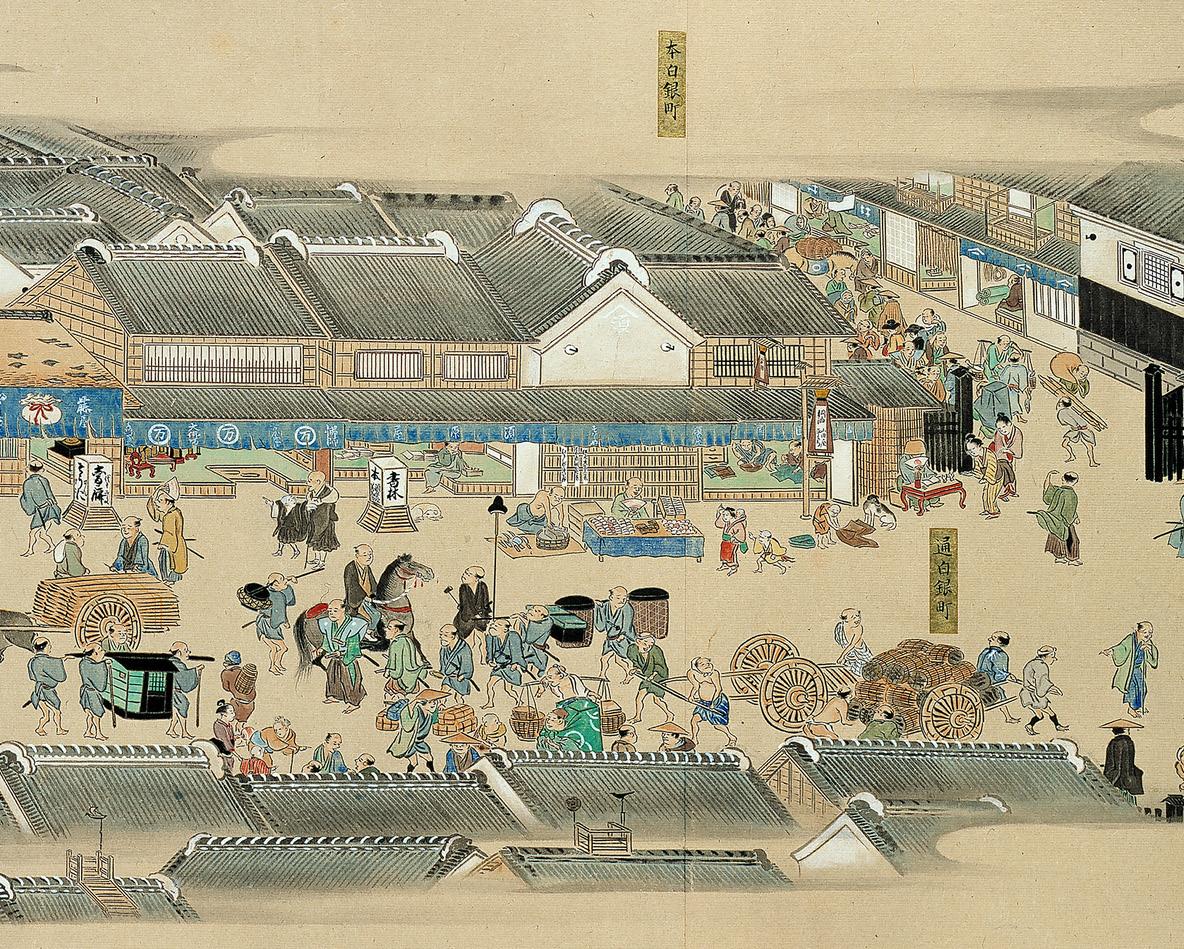
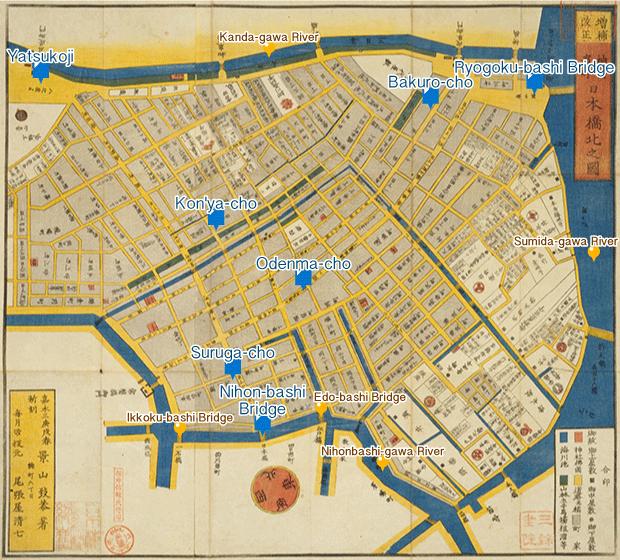
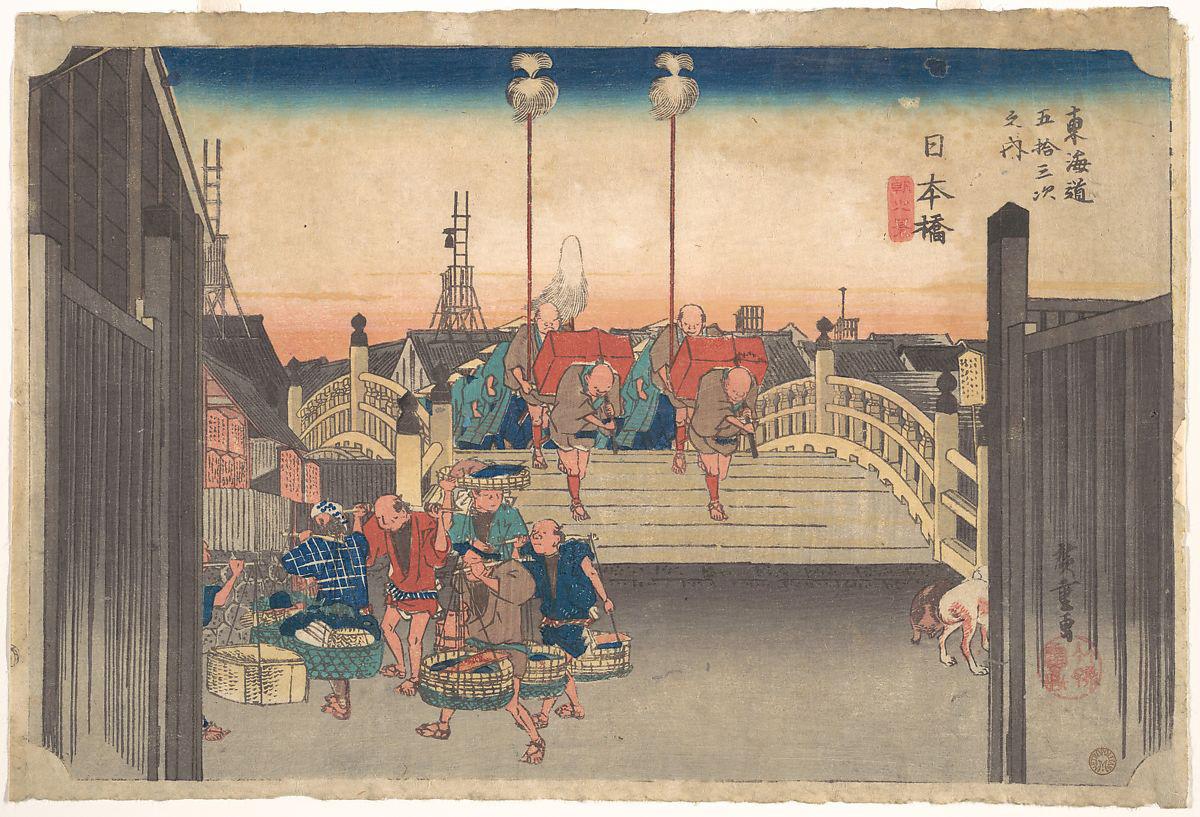
Historic Nihonbashi was once swirling with water. The ancient flows of several rivers along its low, alluvial plains resulted in a canny water management strategy involving canals and bridges. These traditional water systems supported a lively exchange of goods and ideas, local and national transport, Edo Castle’s security strategy, and local cultural identity. Nihonbashi’s fish, produce, craft, and textile markets centered on its canal network, while its infamous Nihonbashi bridge (or “Bridge of Japan”) was instrumental in cultivating Japan’s national road network and postal service. The original wooden bridge was constructed with the establishment of the Tokugawa or Edo shogunate, Japan’s final period of traditionalism. With the Nihonbashi Bridge as Japan’s zero-mile post – the first or last station of the Tokaido - the ward naturally evolved as Tokyo’s mercantile district with the constant ebb and flow of travelers.
After the 1868 Meiji Restoration, the government renamed Edo (meaning “bay entrance”) as Tokyo (“eastern capital”) and relocated the emperor here from the historic capital of Kyoto. As Tokyo westernized through the late 1800s, European visitors compared the new capital to their own continent’s great water city – Venice. Just as Venice exudes European cultural prowess, Nihonbashi’s canal waterfront was the collective manifestation of Japanese intellectual, social, and artistic achievement built upon the island nation’s customs, traditions, and way of life forever surrounded by and immersed with water.
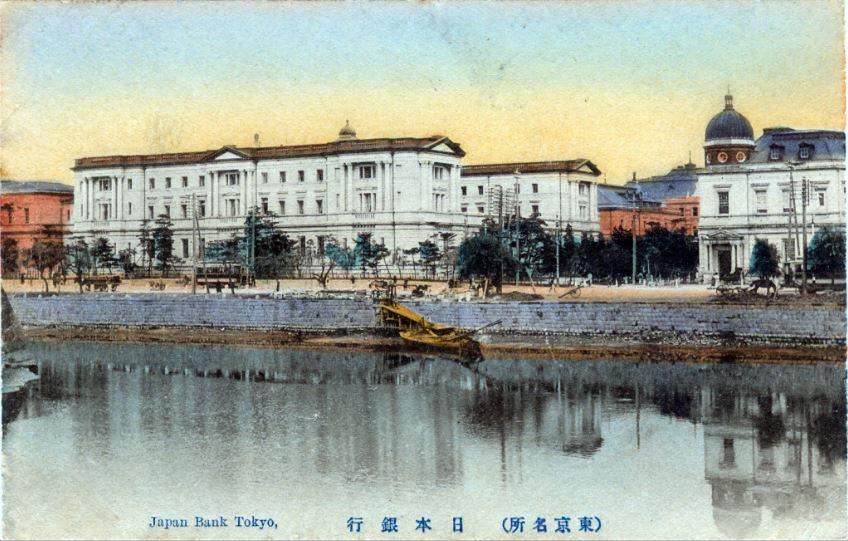
The increasing prominence of Nihonbashi within Tokyo and within Japan solidified the ward as a national finance center. The Tokyo Stock Exchange, established in 1878, was constructed on its current Nihonbashi site in 1931. The Bank of Japan is the central bank of the nation and united the country under a common currency, the yen, in 1871. Its neo-baroque facility was constructed atop the site of a gold mint on the northern shore of the Nihonbashi River in 1896.
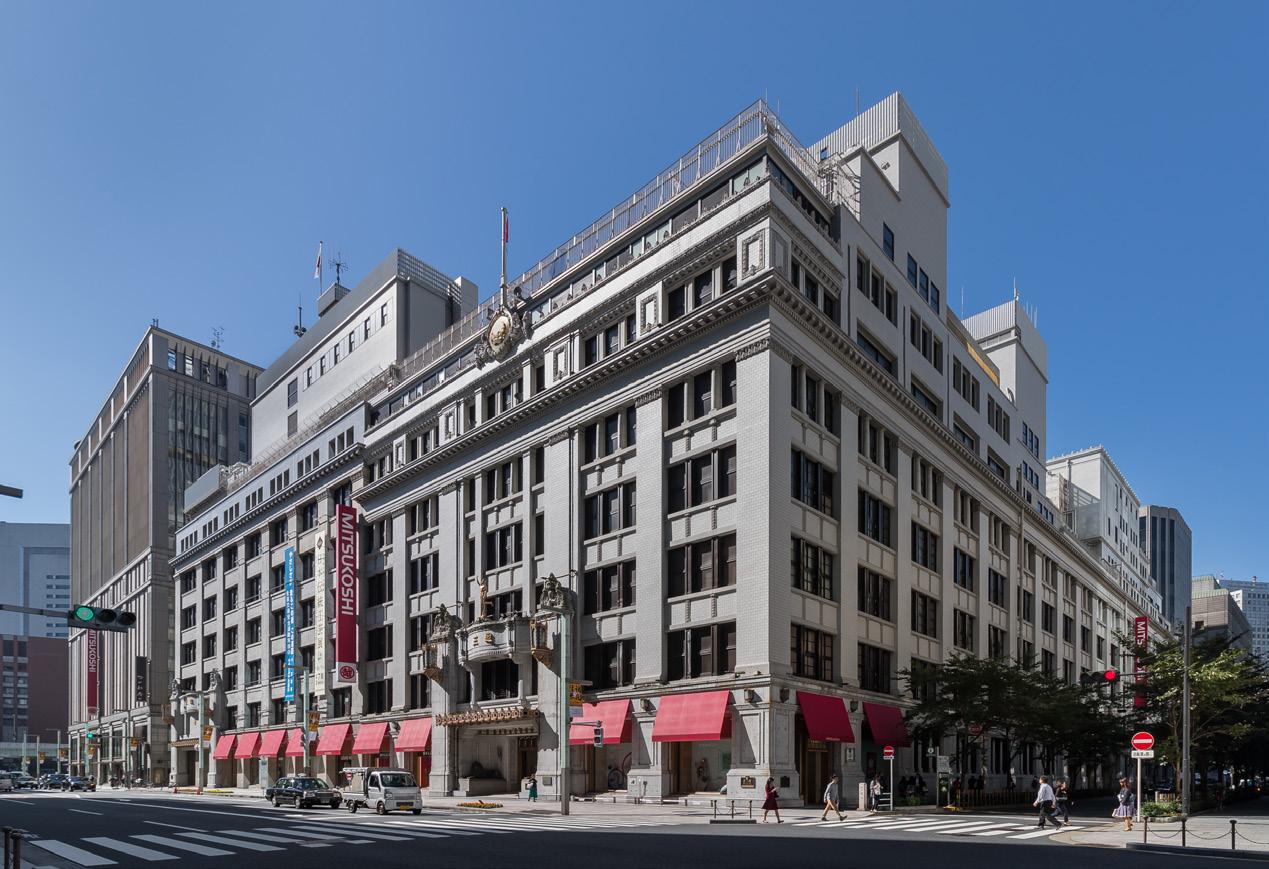
However, one of the most prominent commercial endeavors to emerge from Nihonbashi started as Mitsui’s Echigoya textile shop, opened in 1673 by Mitsui Takatoshi (1622-1694). By 1904, the shop had expanded business enough to rebrand as Japan’s first department store, Mitsukoshi. Expanding further still, the Mitsui Company began investing in real estate holdings in 1914 targeting Nihonbashi specifically. Today, Mitsui is considered one of Japan’s premier corporate holdings companies and one of the top 2,000 largest public companies in the world.
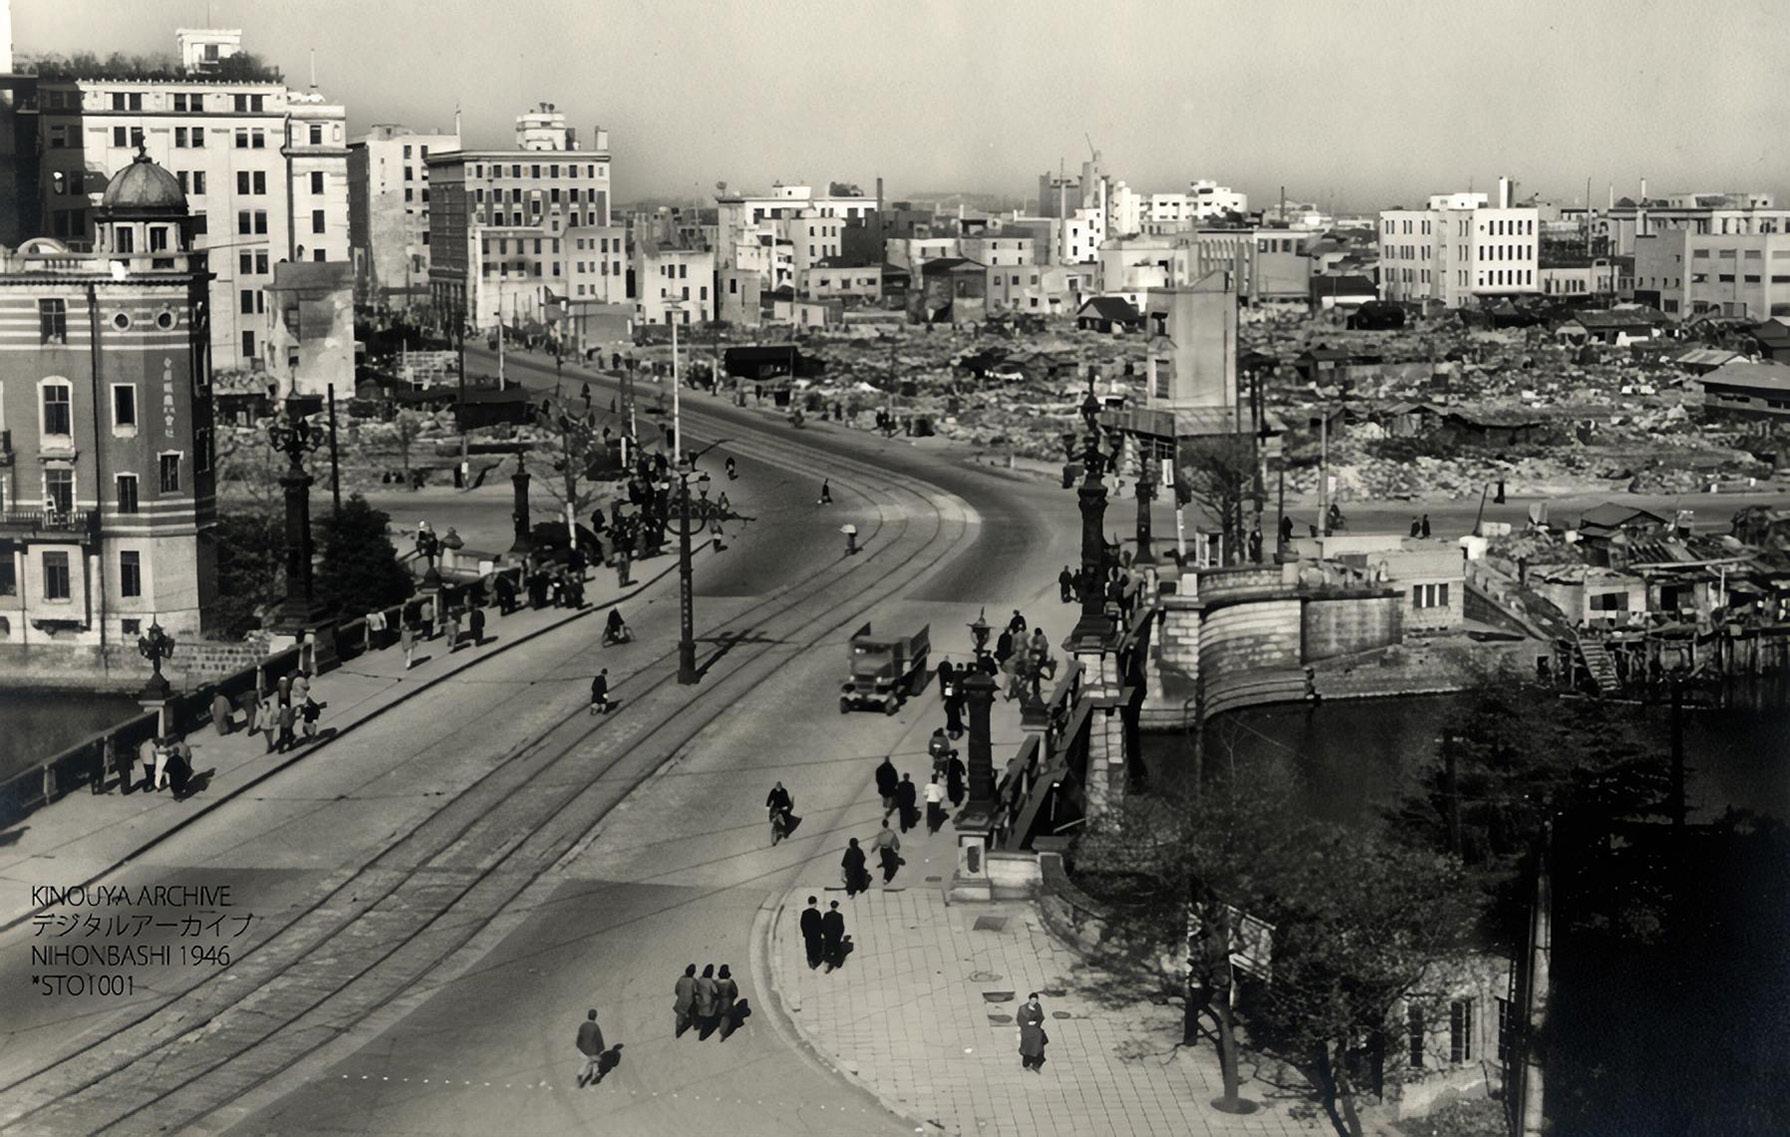
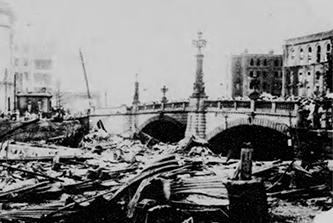
Nihonbashi’s developmental history is consistently progressive, but not without setbacks. While Nihonbashi Bridge survived fires, the Great Kanto Earthquake of 1923, and the bombing of Tokyo during World War II, surrounding blocks experienced colossal destruction in all scenarios. Whereas Tokyo’s wards historically fashioned a mosaic city - a patchwork of neighborhood locales shaped by their unique terrains and histories, reconstruction following these atrocities embraced increasingly more western styles of building. For Nihonbashi, the successive phases of occidental influence caused deeper and deeper ruptures with the ward’s traditional water-based development. As land inheritance tax structures evolved after WWII, large parcels were subdivided for landholders to maintain affordability and new parcel typologies, such as flagpole lots, became common during selloffs.
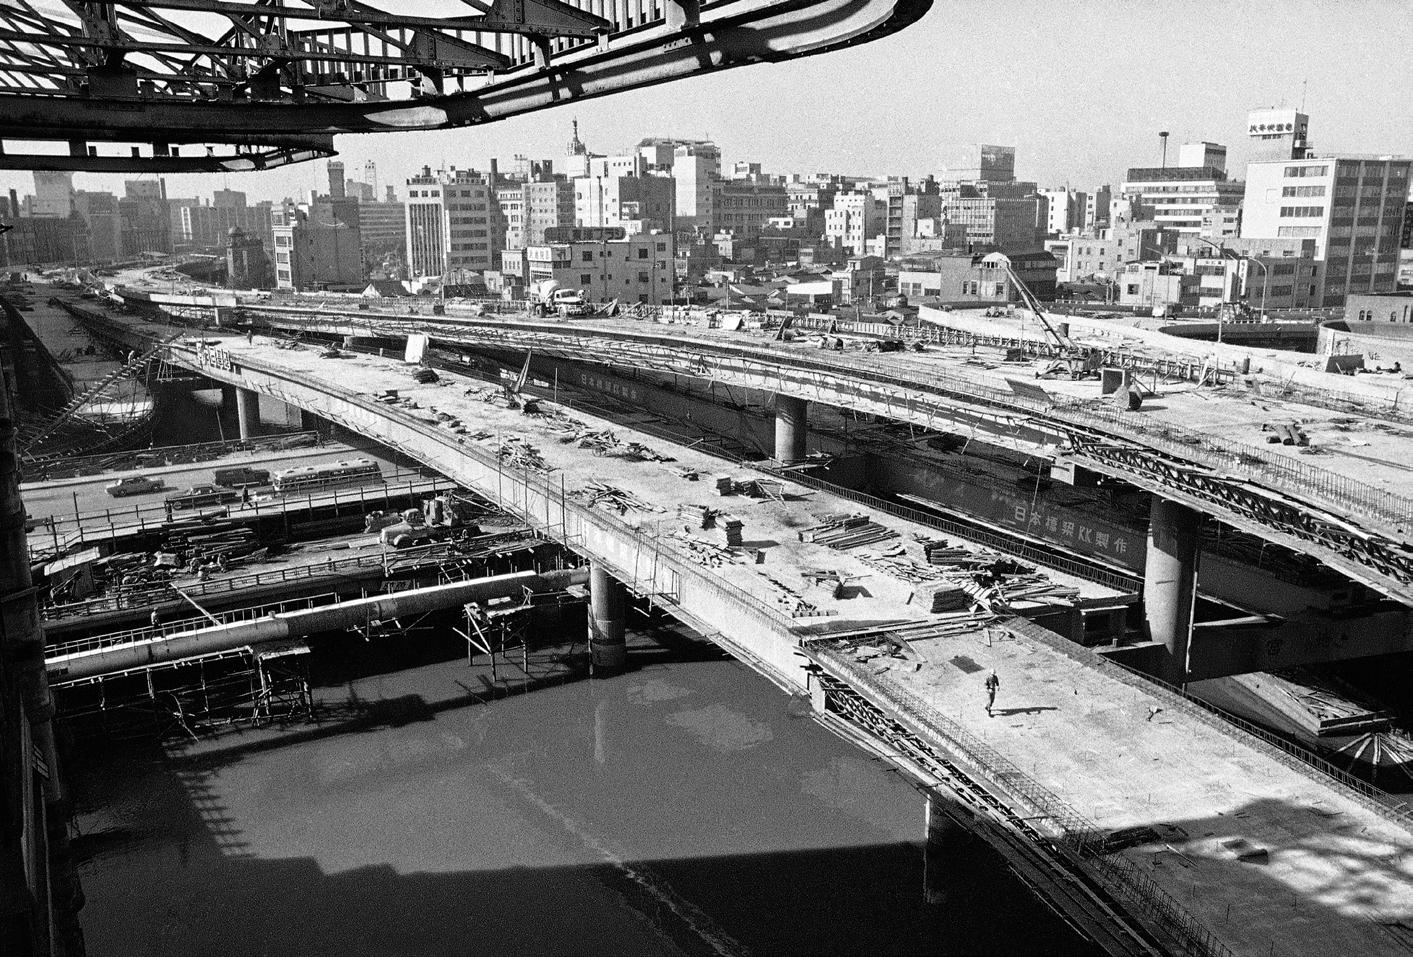
The bridge met its ultimate demise when the elevated Metropolitan Expressway was constructed over the course of the Nihonbashi River in preparation for the 1964 Tokyo Olympics. This act was the final rupture of the ward and its residents from the historic lifeblood waterfront; the expressway megastructure sent Nihonbashi into a cultural and environmental decline with waterway economics nullified.
As greater Tokyo Bay continued to industrialize, water surface area lessened and water quality worsened. Nowadays, Tokyo is less a “water city” and more a city next to water, disconnected from its best asset. Natural coastlines and historic vistas are unrecognizable given landfill practices, sprawling industrial sites, and towering skyscrapers. Traveling up the few remaining Tokyo canals or upstream tributaries evokes romantic images of what life on the water must have been like – little traffic, quietness, brief encounters with natural greenspace and wildlife.
The Olympic legacy of elevated highways is a blessing in disguise. To avoid the cost and hassle of purchasing privately owned land parcels, Japanese transportation officials built their vehicle networks directly above rivers and canals. This allowed Nihonbashi’s block structure to remain mostly intact. In 2017, Tokyo’s Ministry of Land, Infrastructure, Transport, and Tourism (MLIT) set plans in motion to remove the Nihonbashi flyover following the 2020 Olympic Games, relocating the expressway as a tunnel road under the Nihonbashi River. Moving highway environmental concerns below ground seems moot by Tokyo sustainability goals compared to a complete removal, but daylighting the river provides positive outcomes, nonetheless. These include an increase in water transit fleets, improved water flow and quality, mitigation of urban heat islands, restored natural vistas, and increased access to recreational green and blue spaces.
Introduction
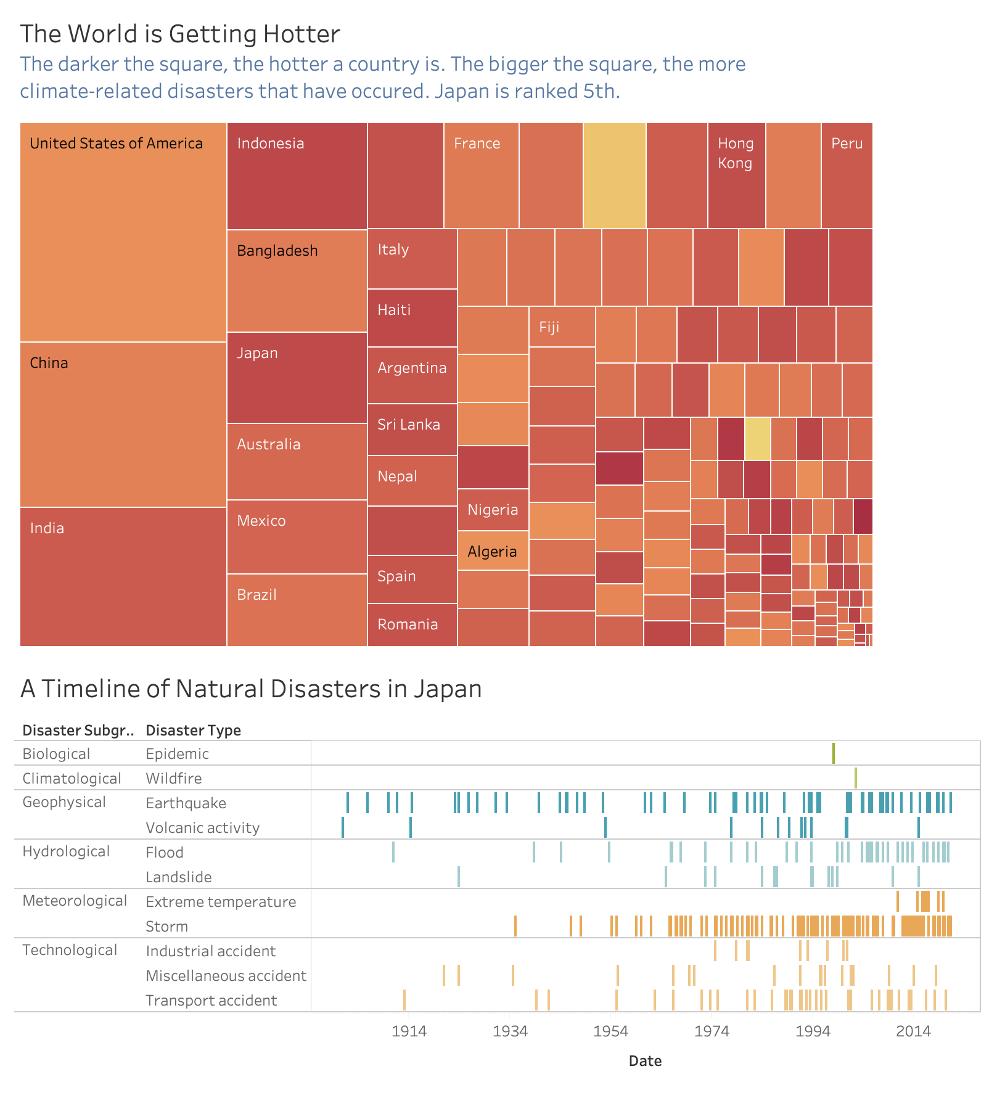
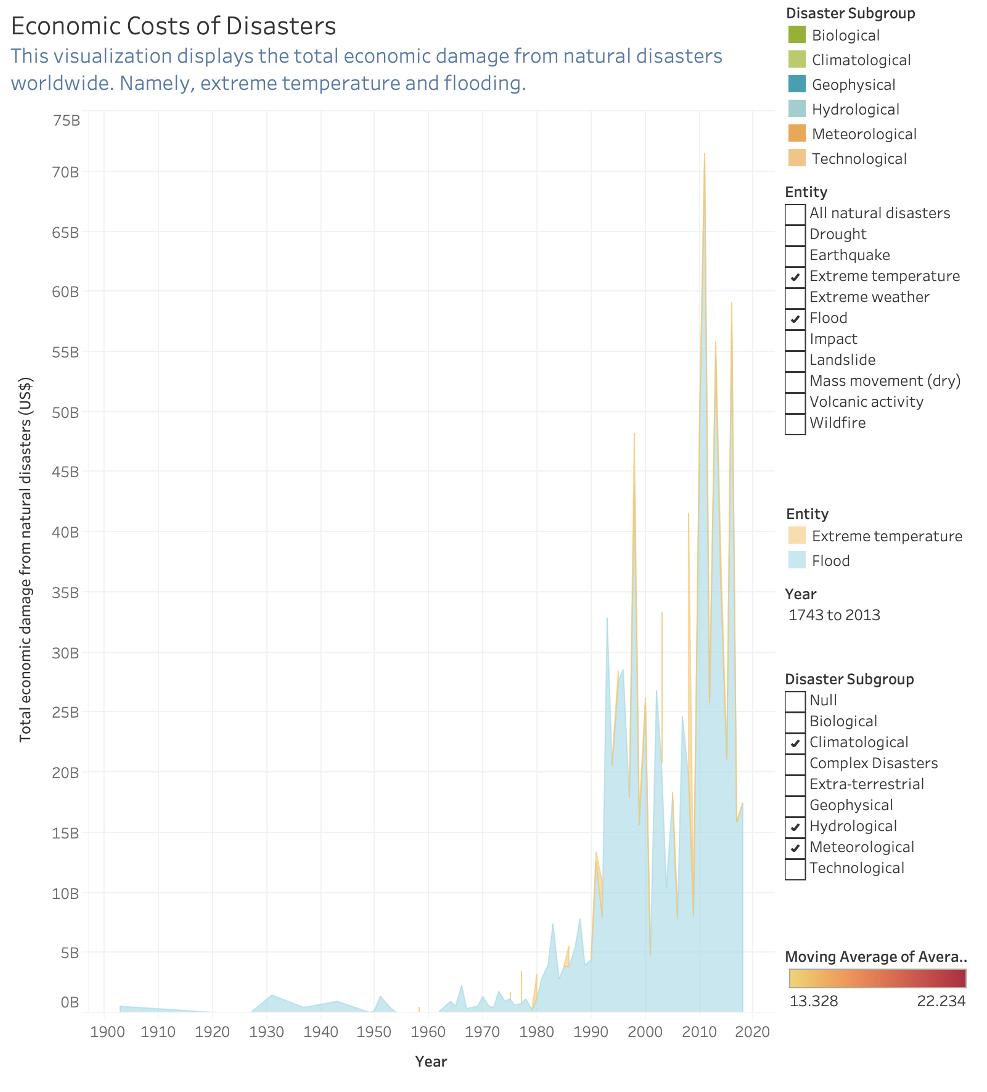
In regard to the anticipated climate change in Nihonbashi, using data from the EM-DAT international disaster database, the Natural Hazards Dataset from the National Centers for Environmental Information, and data from The Berkeley Earth Surface Temperature Study, we can see in the first visualization that Japan is ranked 5th in climaterelated disasters. This visualization also shows that the darker the square, the hotter a country is-- Japan’s mean annual temperature has increased by 1.0°C over the last century. The second visualization shows a timeline of natural disasters in Japan. The main culprits being earthquakes, floods, and storms. The last visualization shows the economic impacts of climate-related disasters worldwide-- flooding and extreme temperature causing economic damage in the billions.
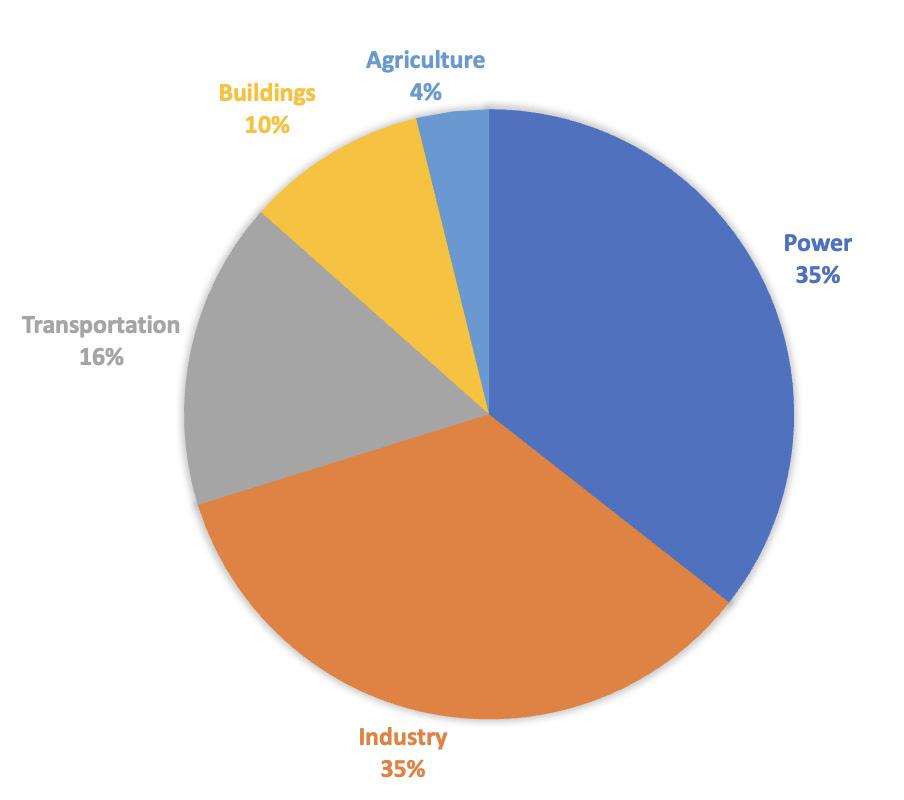
A recent report found that Japan is the sixth largest GHG emitter in the world after China, the United States, the European Union, India, and Russia (Kuwabara, Tasuku, et al., 2021). And In 2017, it emitted a net 1,230 metric megatons of carbon dioxide equivalent (MtCO2e), most of which originated from five sectors: power (37 percent), industry (36 percent), transportation (17 percent), buildings (10 percent), and agriculture (4 percent) (Kuwabara, Tasuku, et al., 2021).
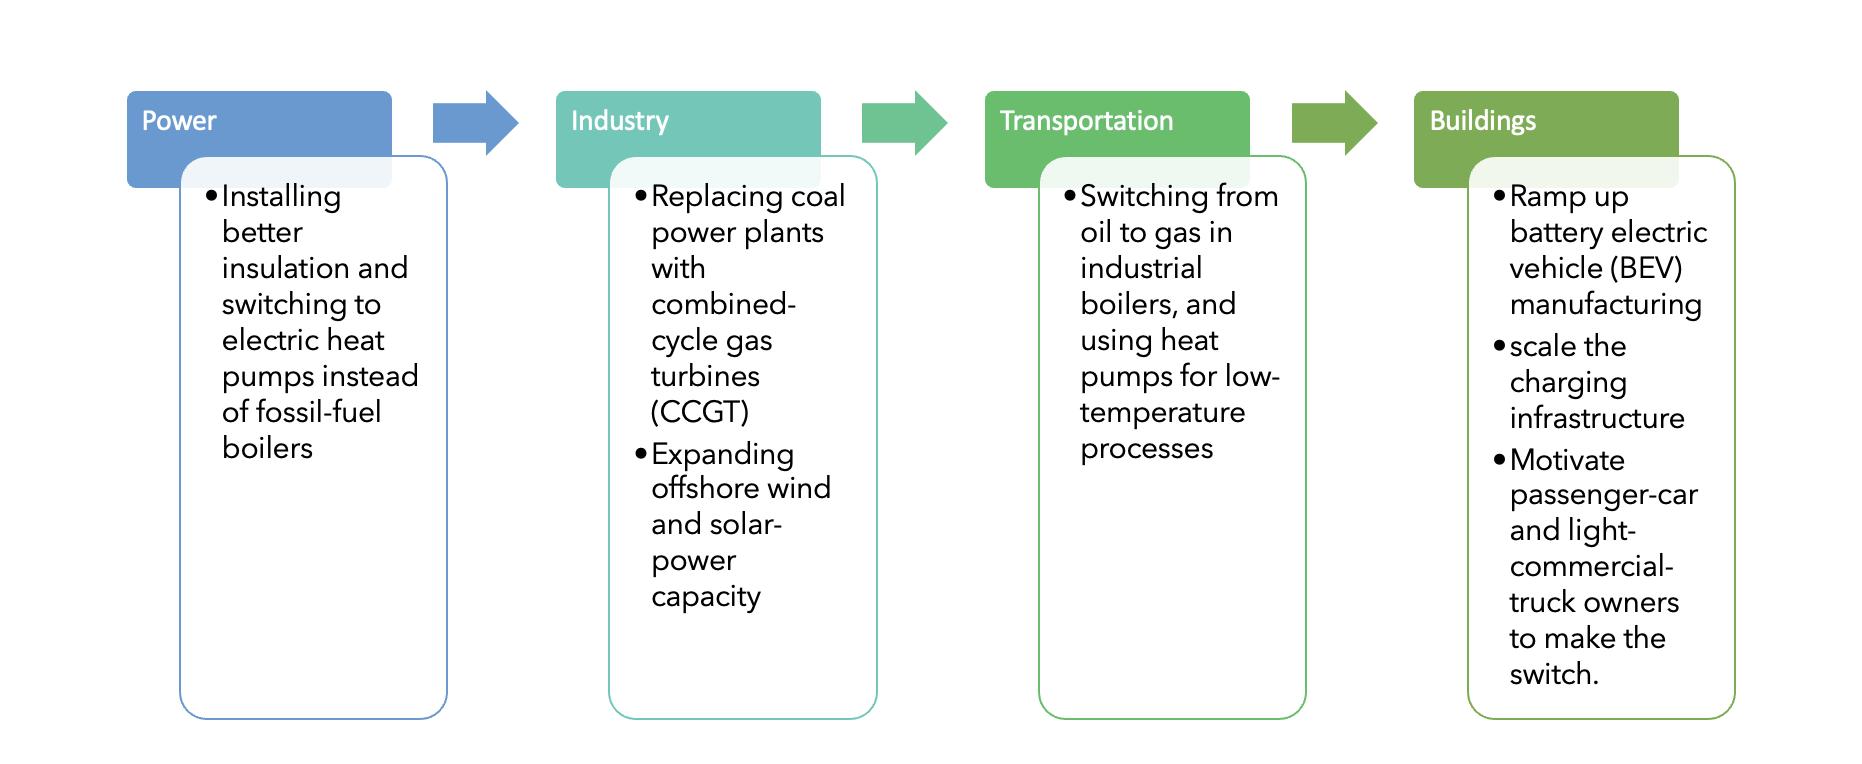
In the years ahead, Nihonbashi has many strengths to leverage on its path to net-zero. From its extensive railway infrastructure offering a viable alternative to cars to the life cycle of Japanese buildings making it easier to impose green regulations on new construction. The pathway for Nihonbashi to decarbonize its major sectors based on what seems to be most feasible and affordable are laid out here in the sectors where you find the highest emitters, from expanding offshore wind and solar-power capacity, to ramping up battery electric vehicle manufacturing (Kuwabara, Tasuku, et al., 2021).
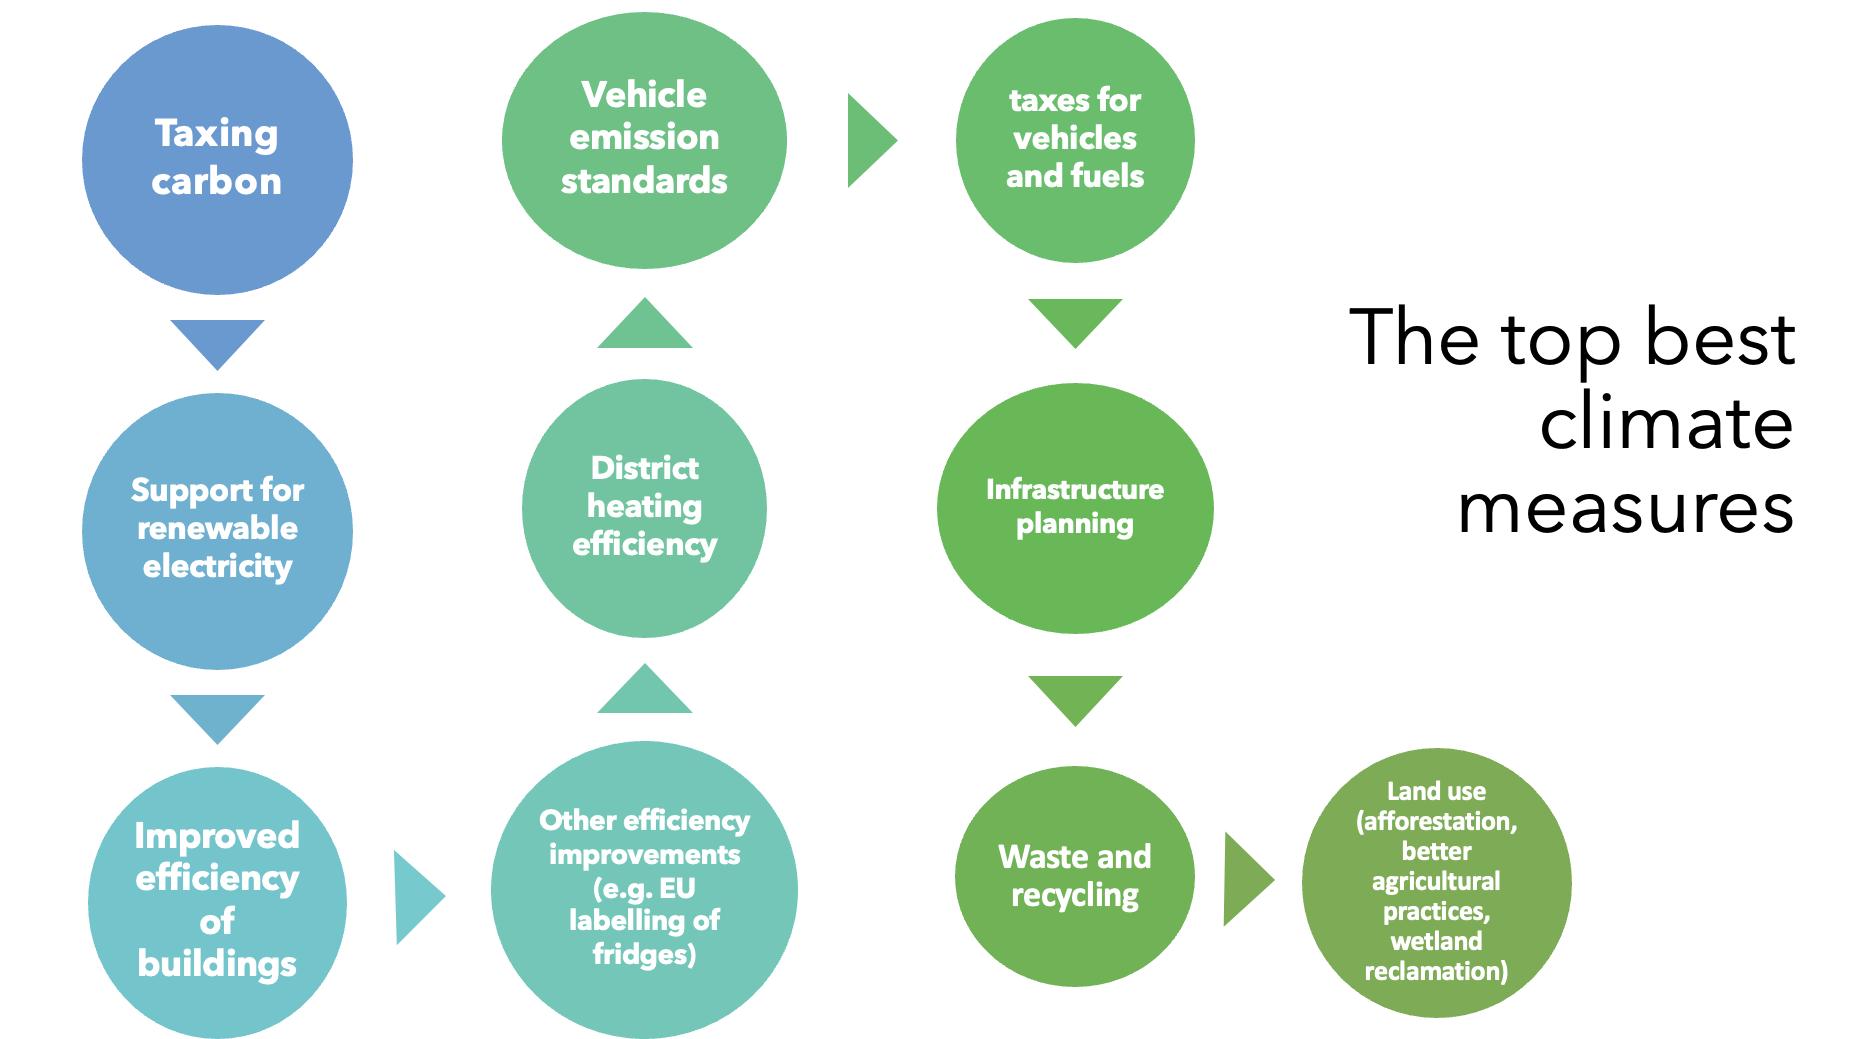
In recent years, NGOs have identified 150 ways to save the climate in northern Europe by promoting effective climate mitigation measures in the national climate policies of 11 countries that make up the Council of Baltic Sea States. Climate policy experts from environmental NGOs in each country listed the ten best climate mitigation measures. All 10 of the top measures described have led to a drop in CO2 emissions in many countries. In order for Nihonbashi to reach its goal, it will be important to implement these policies or variations of the measures suggested.
The ten best climate measures. (2019, December 19). AirClim. https://www.airclim.org/acidnews/ten-best-climate-measures
Important Ecological Urbanism certifications to attain include LEED & CASBEE. LEED is a voluntary planning certification and is intended to recognize practices that meet the strategies drawn from sustainability criteria that work to reduce the impacts caused by the construction activity. The requirements of the LEED for Neighborhood Development are organized into four categories: three consist of prerequisites (mandatory for final certification) and credits associated to points for the qualification of the evaluated object, and another category called Innovation & Design Process, that has no mandatory requirements (Barcelona Urban Ecology Agency, 2012).
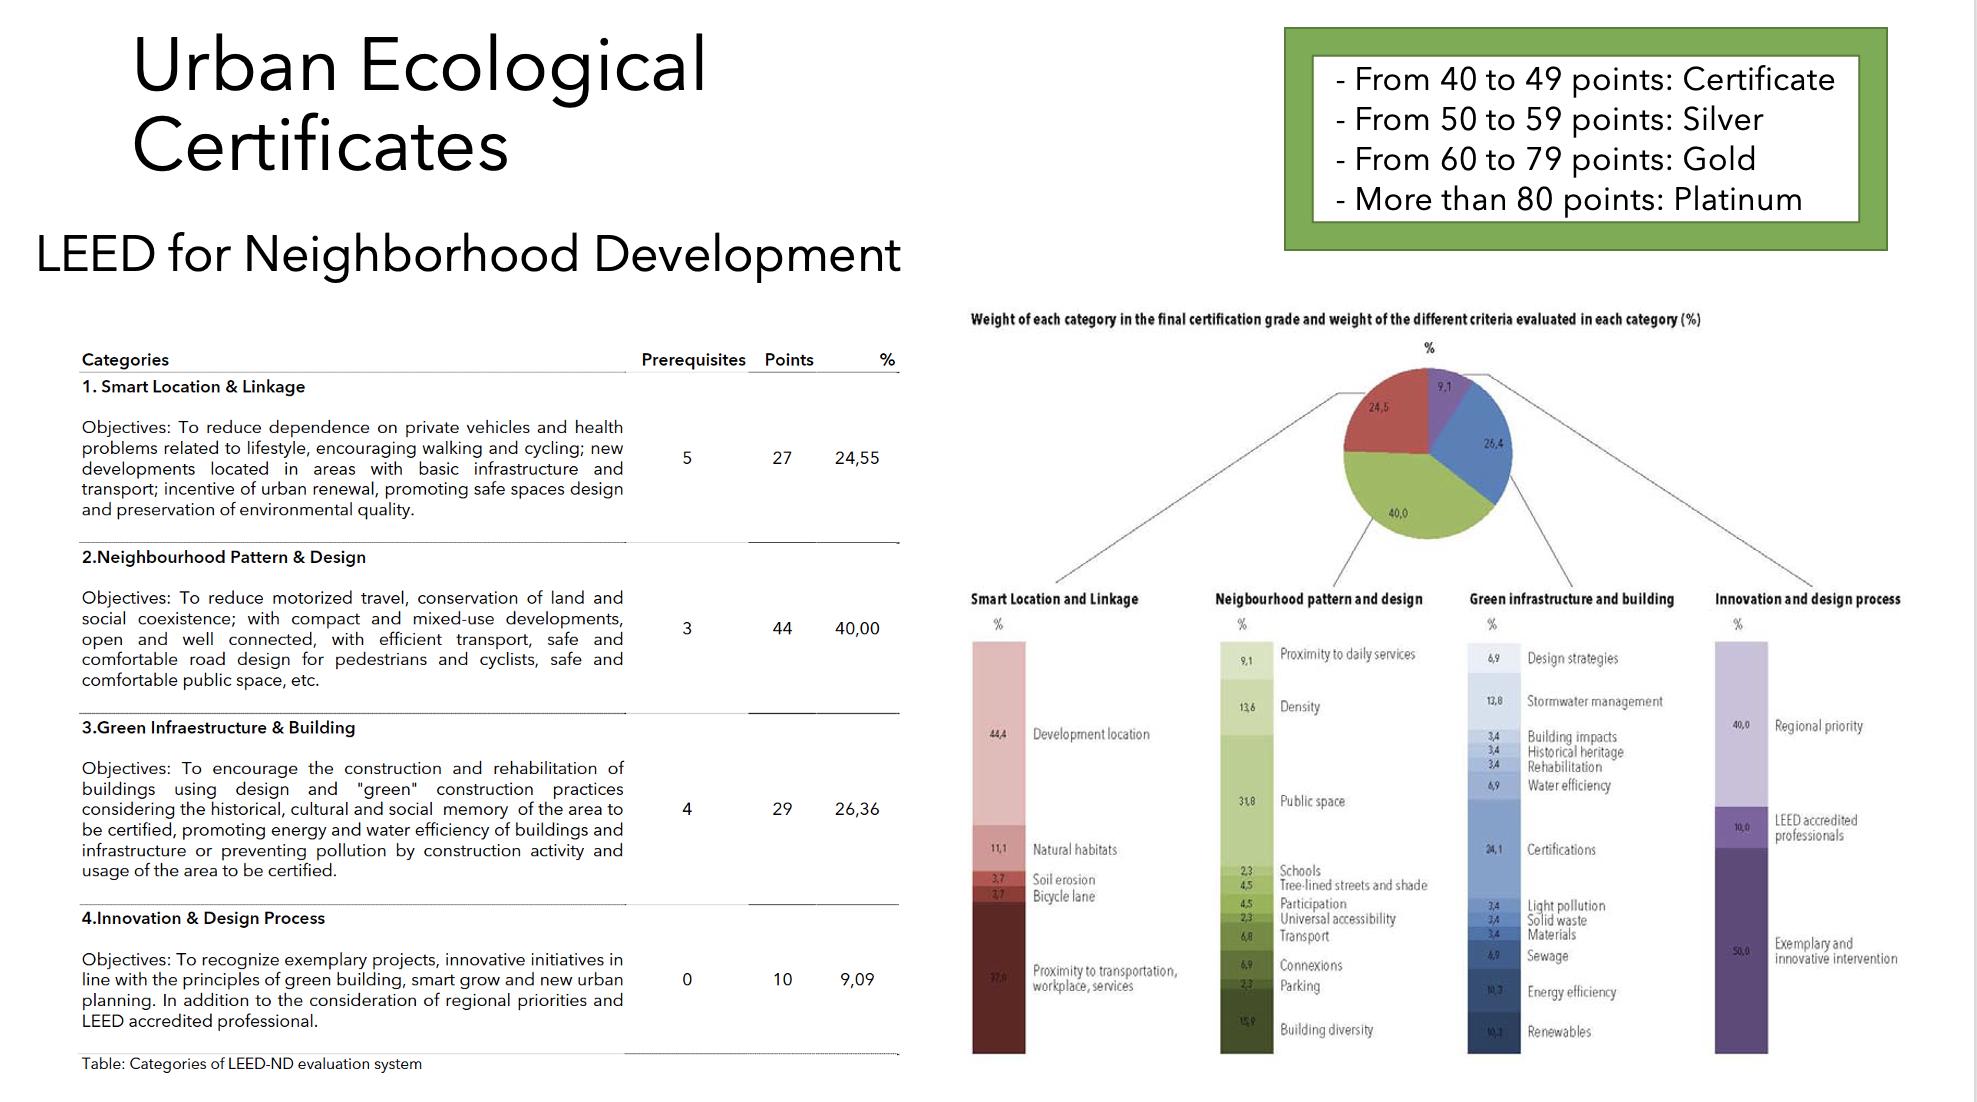
All LEED certification system uses the checklist methodology that, through a point system related to a list of requirements, checks whether the project complies with the requirements to get different certification standards. The graph presents the objectives and requirements of the categories that make up the certification system.
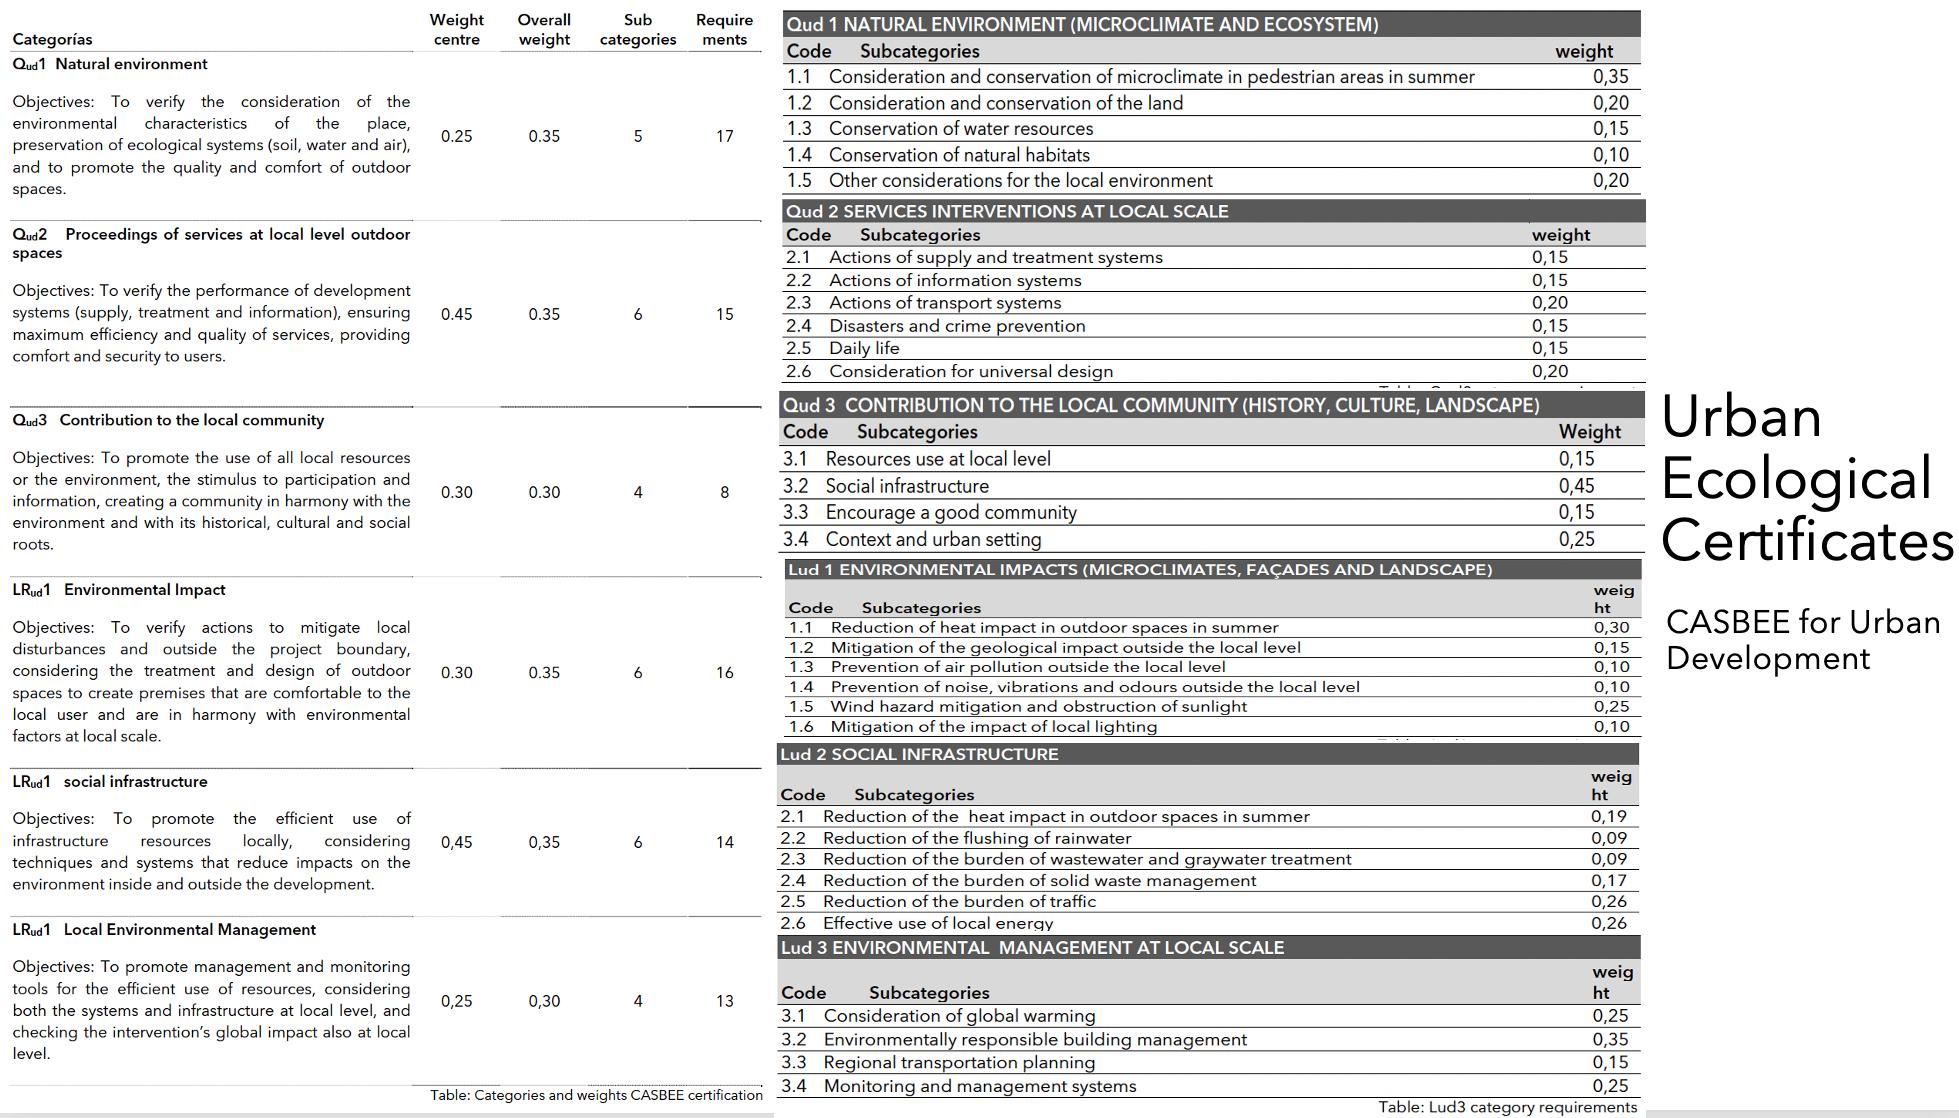
CASBEE has been developed based on four key policies: (1) Allow evaluation of higher environmental aspects of buildings. (2) Be as simple as possible. (3) Be applicable to a wide variety of subjects and cases. (4) Consider the issues and problems specific to Japan and Asia (Barcelona Urban Ecology Agency, 2012). The evaluation parameters are organized from two basic conceptual issues: Indoor Environmental Quality of the project “Q” (Quality) and Outdoors Environmental Load “L” (Load). Both are defined as the limits of influence of the evaluated subjects: the hypothetical limit of the building and the hypothetical limit of the urban area.
CASBEE for Urban Development checks the urban environment of buildings, considering only the qualities and loads outside the building. CASBEE for Urban Development + Building also includes qualities and loads outside the buildings that make up the urban development, quality and specific loads of buildings, ie the tool brings together the considerations regarding the building and the urban environment. The requirements of the evaluation system are in total 83 and are organized into 31 subcategories, which in turn make up the six categories, three related to environmental quality and three related to the environmental impacts of development.
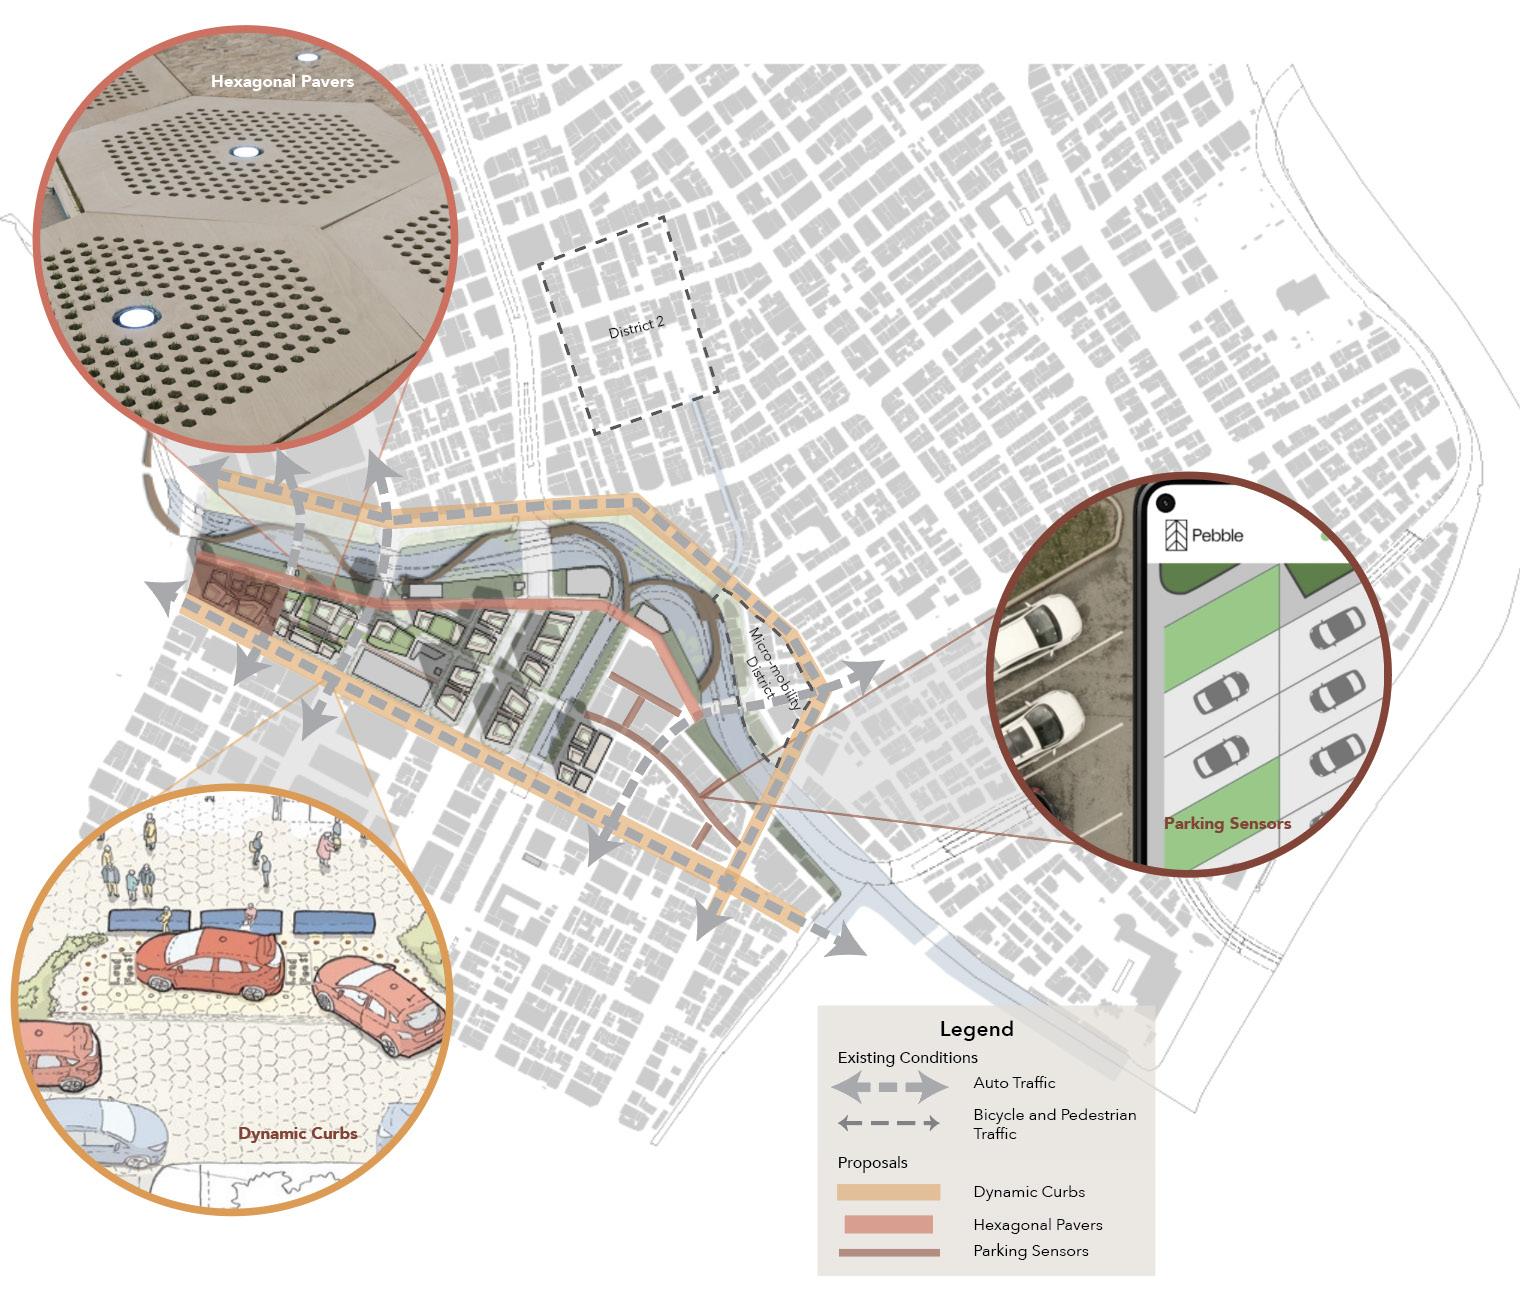
When thinking about Nihonbashi’s needs and potential for smart technology implementation, there are many areas in which technology could enhance planning and design. However, because of the district’s carbon neutrality and climate resilience goals, targeting transportation improvements and bicycle/pedestrian infrastructure would be the most effective way to use smart technology to encourage less driving and decrease carbon emissions and increase general quality of life. Particularly along the Waterfront proposal, there is emphasis surrounding maintaining the street grid, activating the riverfront, and encouraging pedestrian movement through the area, so this proposal will focus on this district to demonstrate the potential of smart technology.
There have been many improvements via smart technology that impact the experience of the pedestrian. “Smart sidewalks” are a new concept, and they use sensor technology to capture the flow of foot traffic on the sidewalk. This type of data collection is preferred, as it does not require video cameras or any identifiable personal information. Pavegen is a company that developed sidewalk energy generation technology through panels that generate power when a footprint compresses the boards. Each step generates between 2 and 4 joules, which is stored in batteries. Streetlights can also be connected to a smart grid, and sensors can be used to turn them on and off based on the sound of footsteps nearby. They can also be used to surveil traffic patterns, or even connect people to emergency services if needed. This connectivity can also save Nihonbashi energy and money, as street lighting can be up to 40% of a city’s energy bills, so this would cause huge cost savings. Finally, smart street crossings were developed by a firm in Poland. Called SmartPass, the system increases safety of pedestrians on the road crossing, by informing approaching vehicles about the presence of pedestrians. Not only does the whole crossing light up when someone approaches, but it alters the surrounding streetlights to stop traffic as someone is trying to cross the street. Here are some examples of areas that each of these improvements could be implemented.

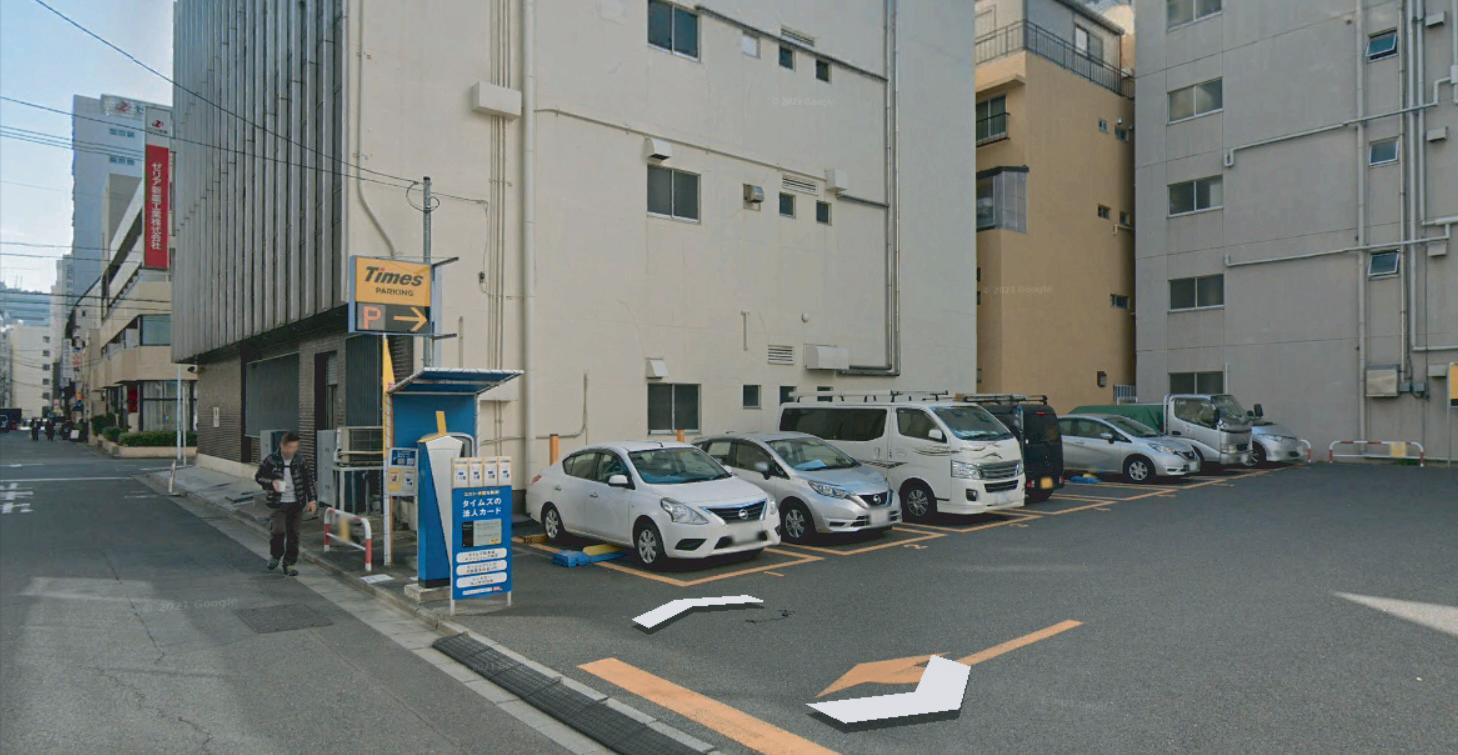
In targeting transportation, smart technology has been used to help with an array of issues, including parking. We hope Nihonbashi will implement car free zones and reduce vehicles on the road, parking will remain a part of the urban fabric for a while. The use of sensors in parking spaces would help streamline the parking process. In Los Angeles, drivers in a 15-block district drove an extra 950,000 miles and produced 730 tons of carbon dioxide in search of parking. In order to quell these emissions, parking sensors would allow users to see where available spots are in real time in Nihonbashi, as well as reserve them. The sensors were introduced through Sidewalk Labs, and they are connected to an app called “Pebble”, which shows drivers where spots are available in an area in real time. Specifically, in this proposal we wanted to keep parking at a minimum and focus on other transit options, so parking should largely be underground and on a few arterial roads on the outskirts of the district. Dynamic curbs are another parking and transportation tool. Introduced for the Sidewalk Toronto project with Google, dynamic curbs use lights instead of physical curbs to illustrate the street boundary. These lights can move throughout the street, to widen or narrow the roadway or even make an area pedestrian-only. Dynamic curbs would be a strong tool to begin to lessen Nihonbashi’s car use. Finally, through the Sidewalk Toronto proposal, they proposed these hexagonal street pavers, which can be easily removed and reconfigured as demands change. These are installed in tandem with dynamic curb technology. These pavers are typically made of wood for driving, which makes them absorb less heat and allow for drainage. They can also be changed based on use, so they can widen or narrow a road, reserve space for pedestrians, or remove the street altogether. They contain many holes on their surface as well, which allows for easy installation of bike racks, street signs, or even a basketball hoop.
At the core of smart technology implementation is data. Smart technology reacts to real-time demands, which means there must be some form of surveillance to understand what those demands are – typically in the form of video cameras, sensors, or mobile phone tracking. This is the most debated piece of smart technology, since using mass surveillance technology can easily cross the line into invasive and open the potential for personal data misuse by companies or governments. Therefore, it is vital to have strong data use and storage policies. Specifically, data should be stored in various locations, so it is decentralized, which would protect mass data exposure if there were to be a hack. Additionally, residents in the smart district should understand in simple terms how their data is being collected, stored, and used. Finally, residents should also be able to use their data and have access to it through the company or government that is storing it. In the future, the district should develop a data management plan, to ensure
 Regan Buchanan
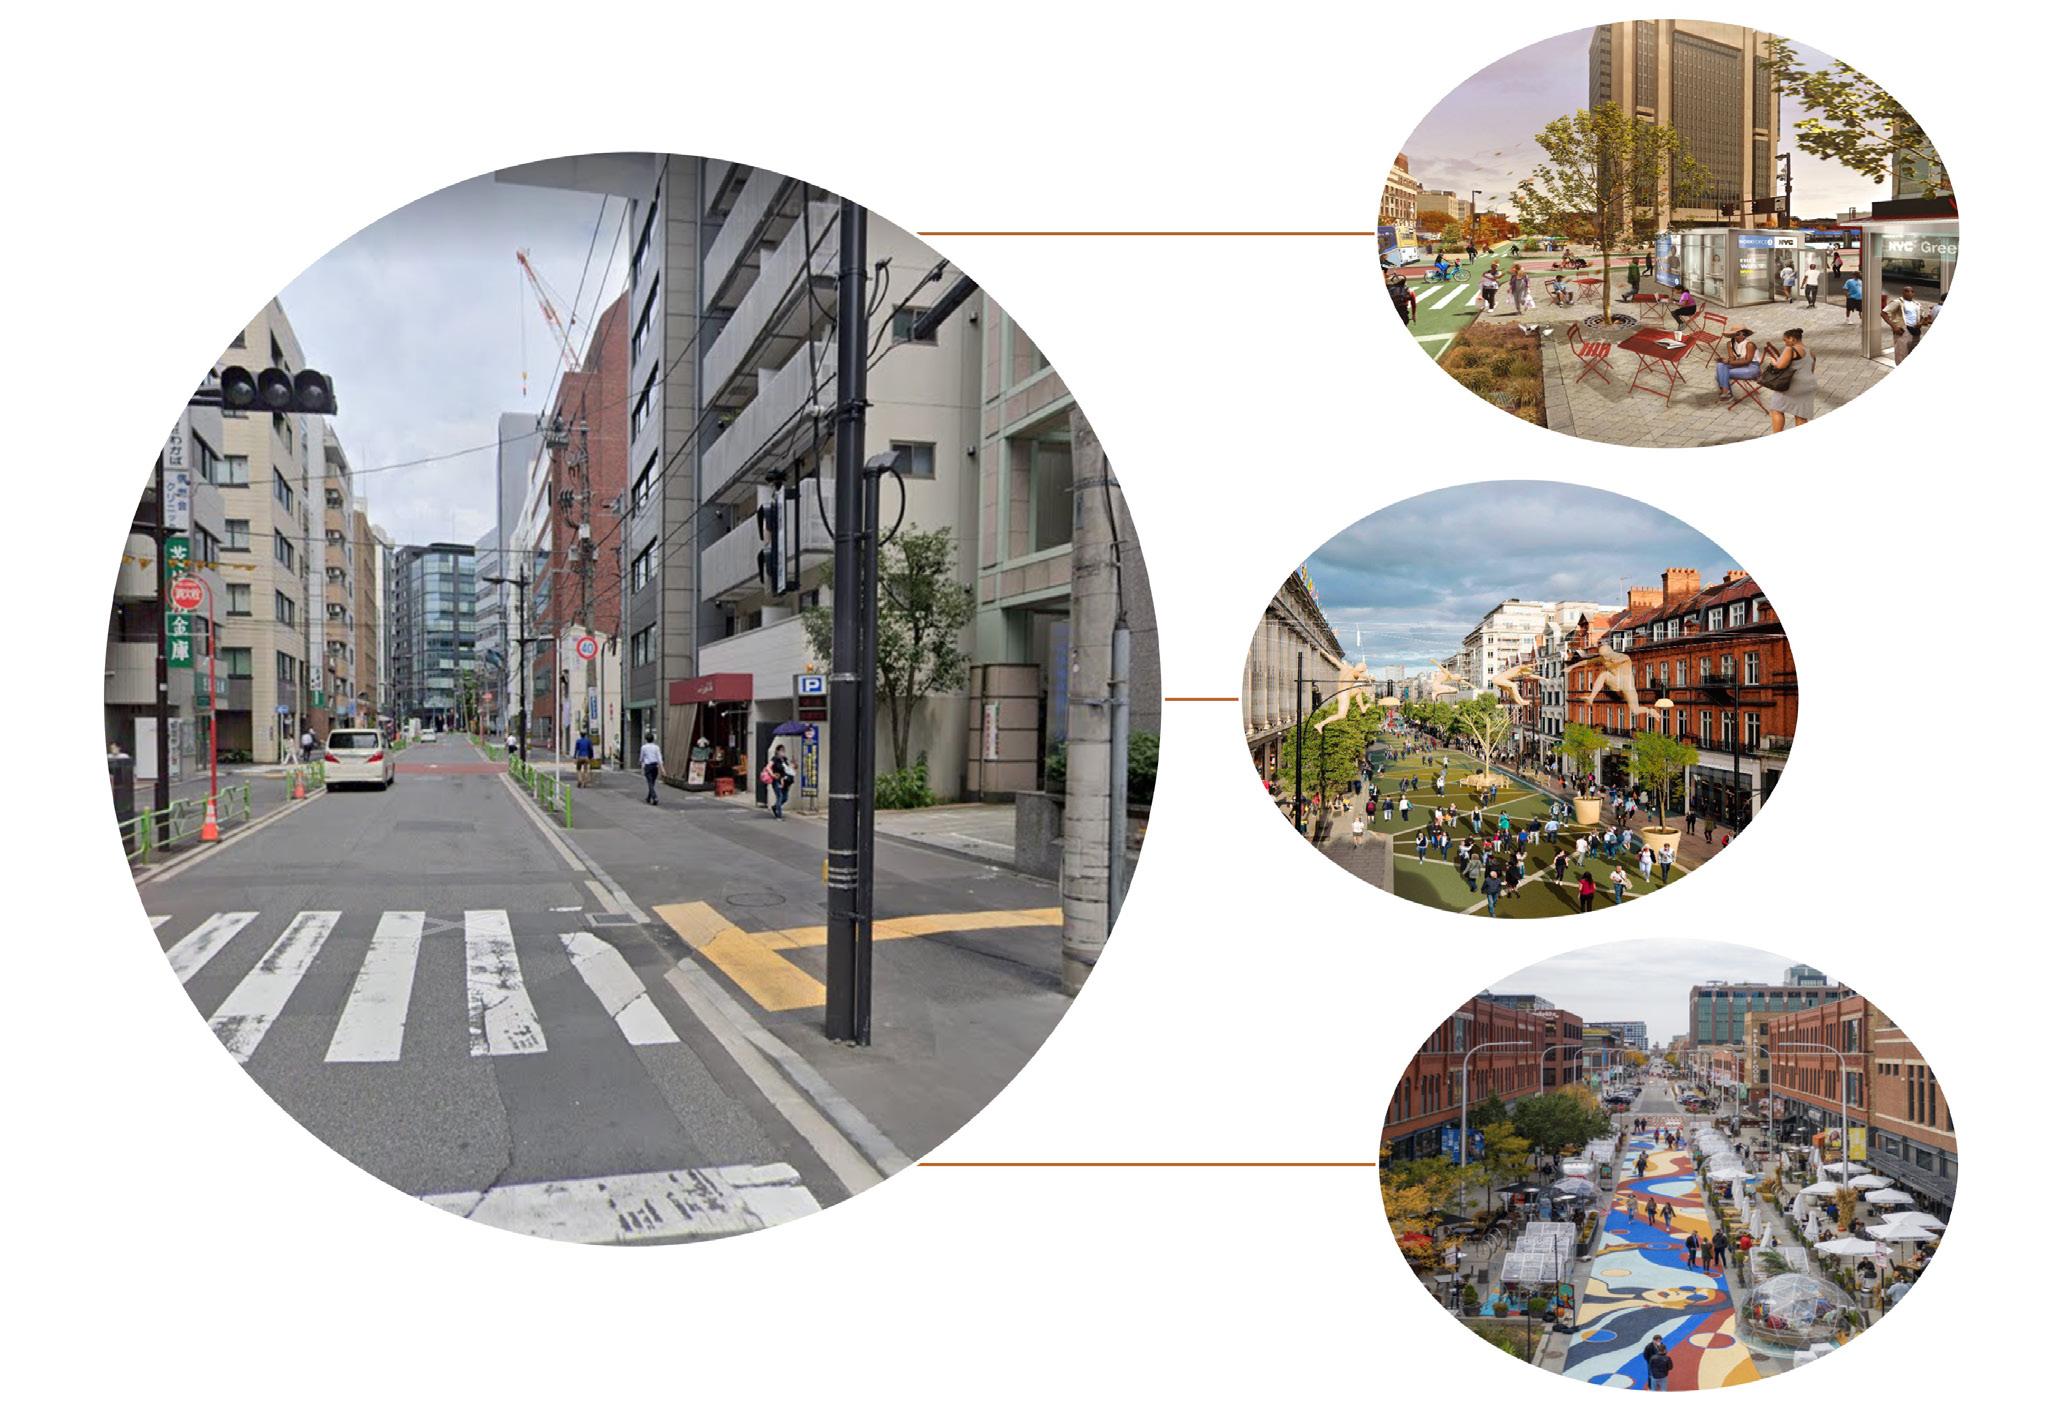
In response to our goals of carbon-neutrality, covid-preparedness, and climate change action, one of our proposals is enacting car-free districts in specific points of Nihonbashi. To achieve carbon-neutrality specifically, Nihonbashi will have to take a critical look at its use of personal vehicle travel and make significant changes. Car-free districts have many benefits, including an increase in pedestrian and cyclist safety, reduction in air or noise pollution, and improved street aesthetics. In this proposal, we will discuss the history of roads in Nihonbashi, inspirations to go car-free from other global cities, implementation plans, and design proposals.
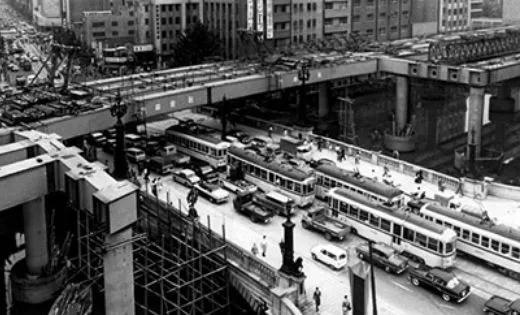
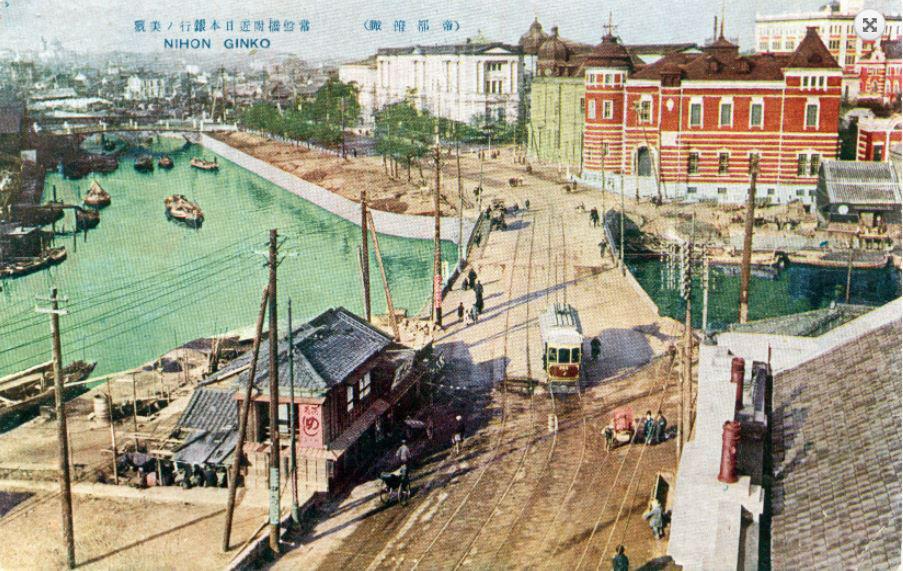
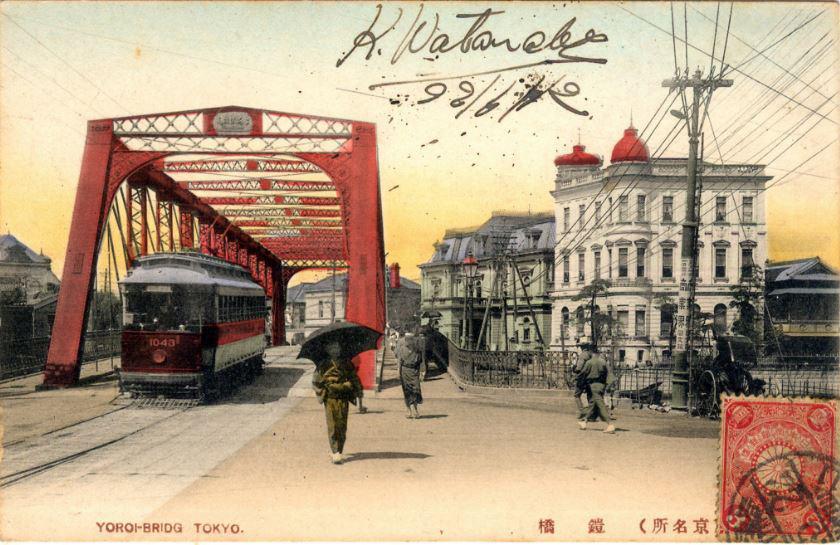
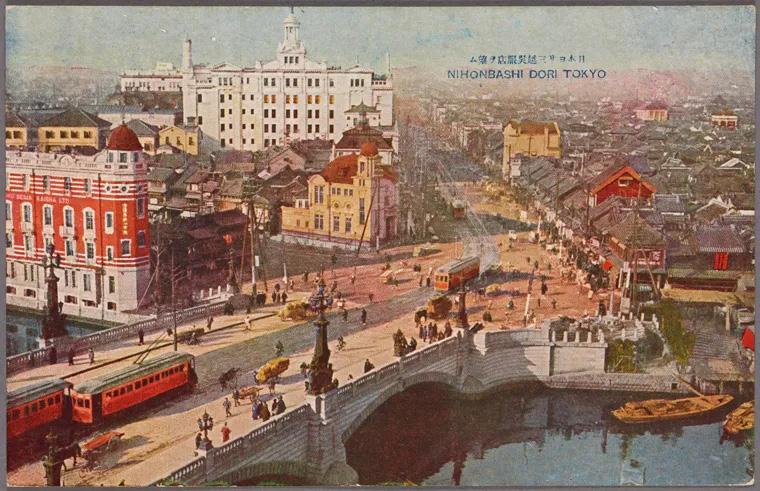
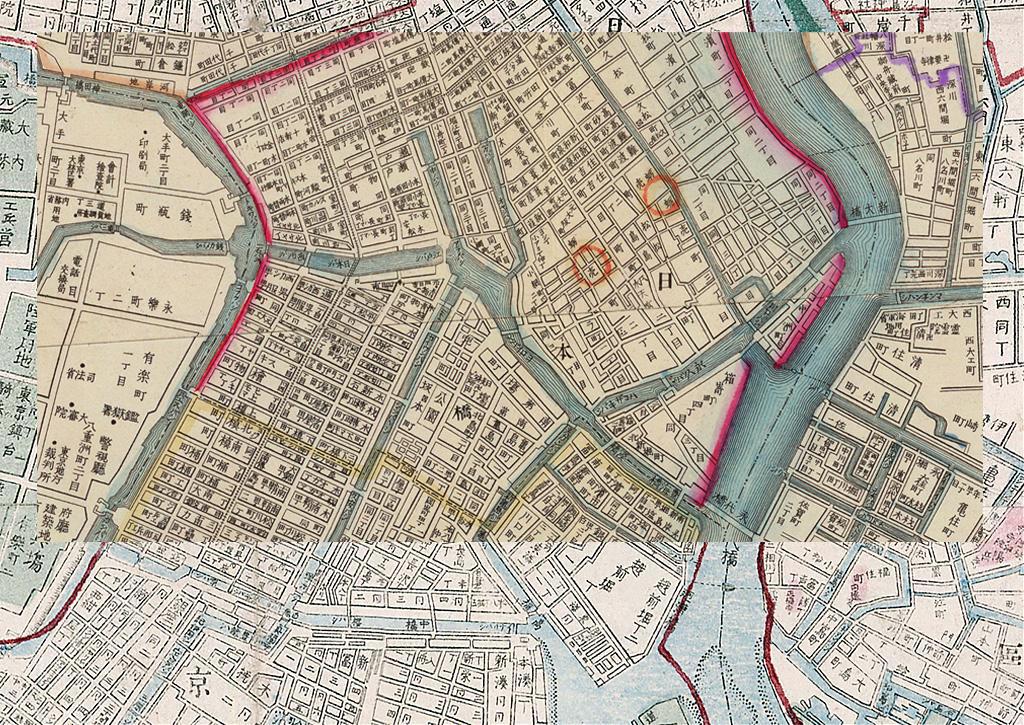
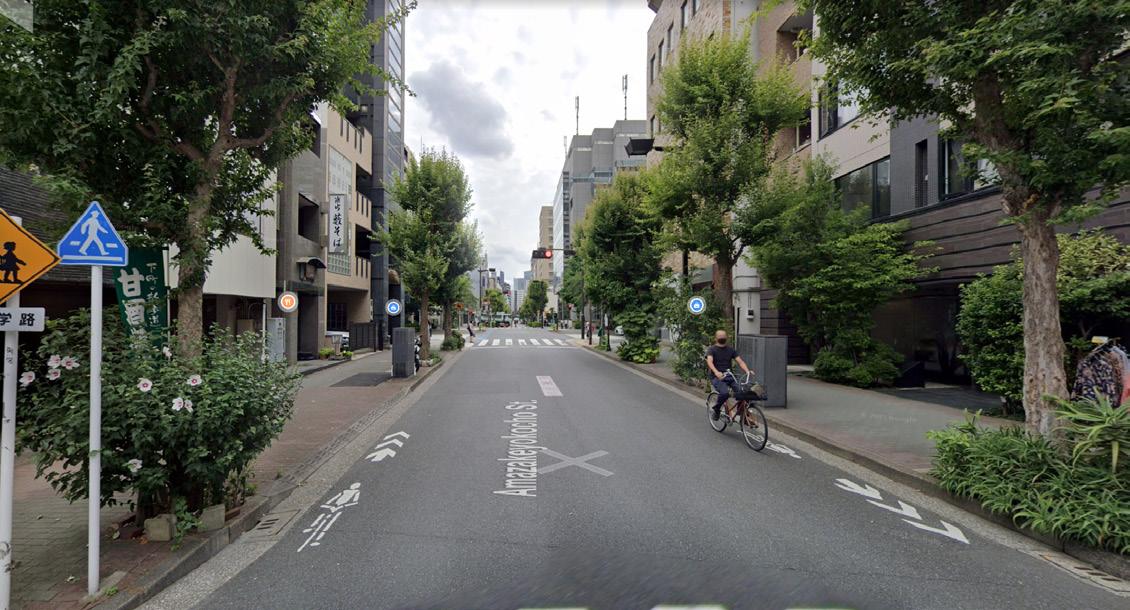
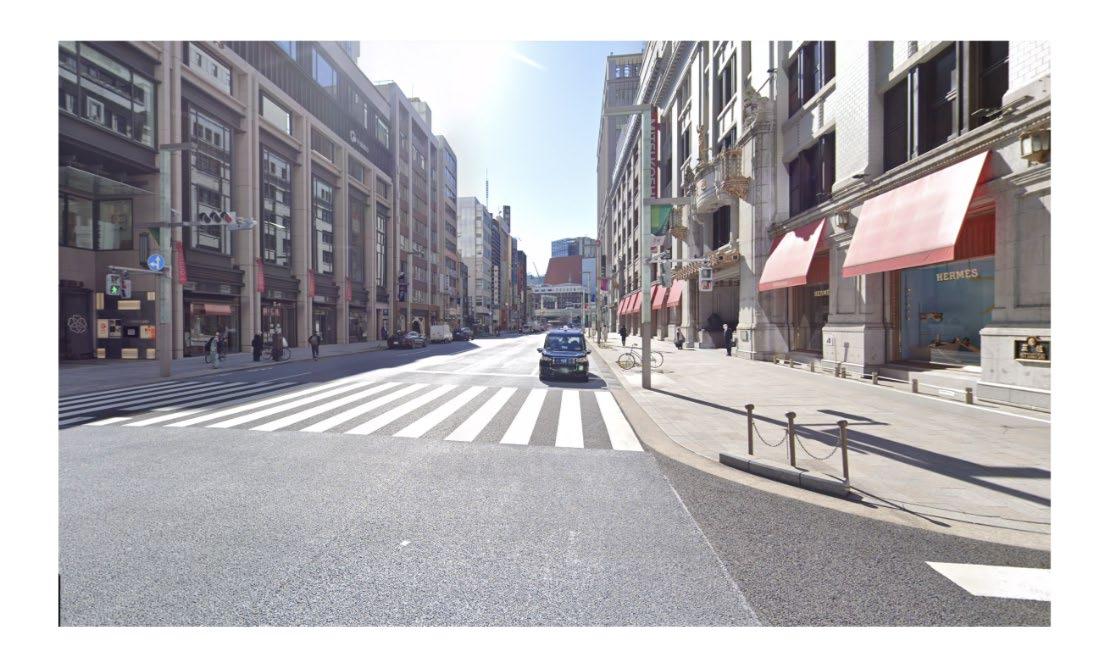
Nihonbashi is a successful and prominent district in Tokyo for many reasons, but a key piece of its development revolves around the five roads that begin in the district and connect to all distant corners of Japan. In 1604, the Shogunate constructed these five roads, essentially determining Nihonbashi’s destiny to be the center of Japan’s transportation network. Flash forward to 1922 (in first image above), Nihonbashi’s roads were bustling centers of multi-modal transportation featuring transit, pedestrians, and cyclists alike. However, in 1963, in preparation for the Olympics, the five essential roads were turned into to highways for cars. When proposing a car-free Nihonbashi, at first glance it may seem that we are ignoring the district’s history of being the center of Japan’s transportation because we are suggesting that car travel be limited. It is, in fact, quite the opposite; we are urging a return to and celebration of Nihonbashi’s origins by suggesting roads that can be used and enjoyed by everyone. Let’s go back to 1922 when the roads were thriving community spaces for exchange and travel.
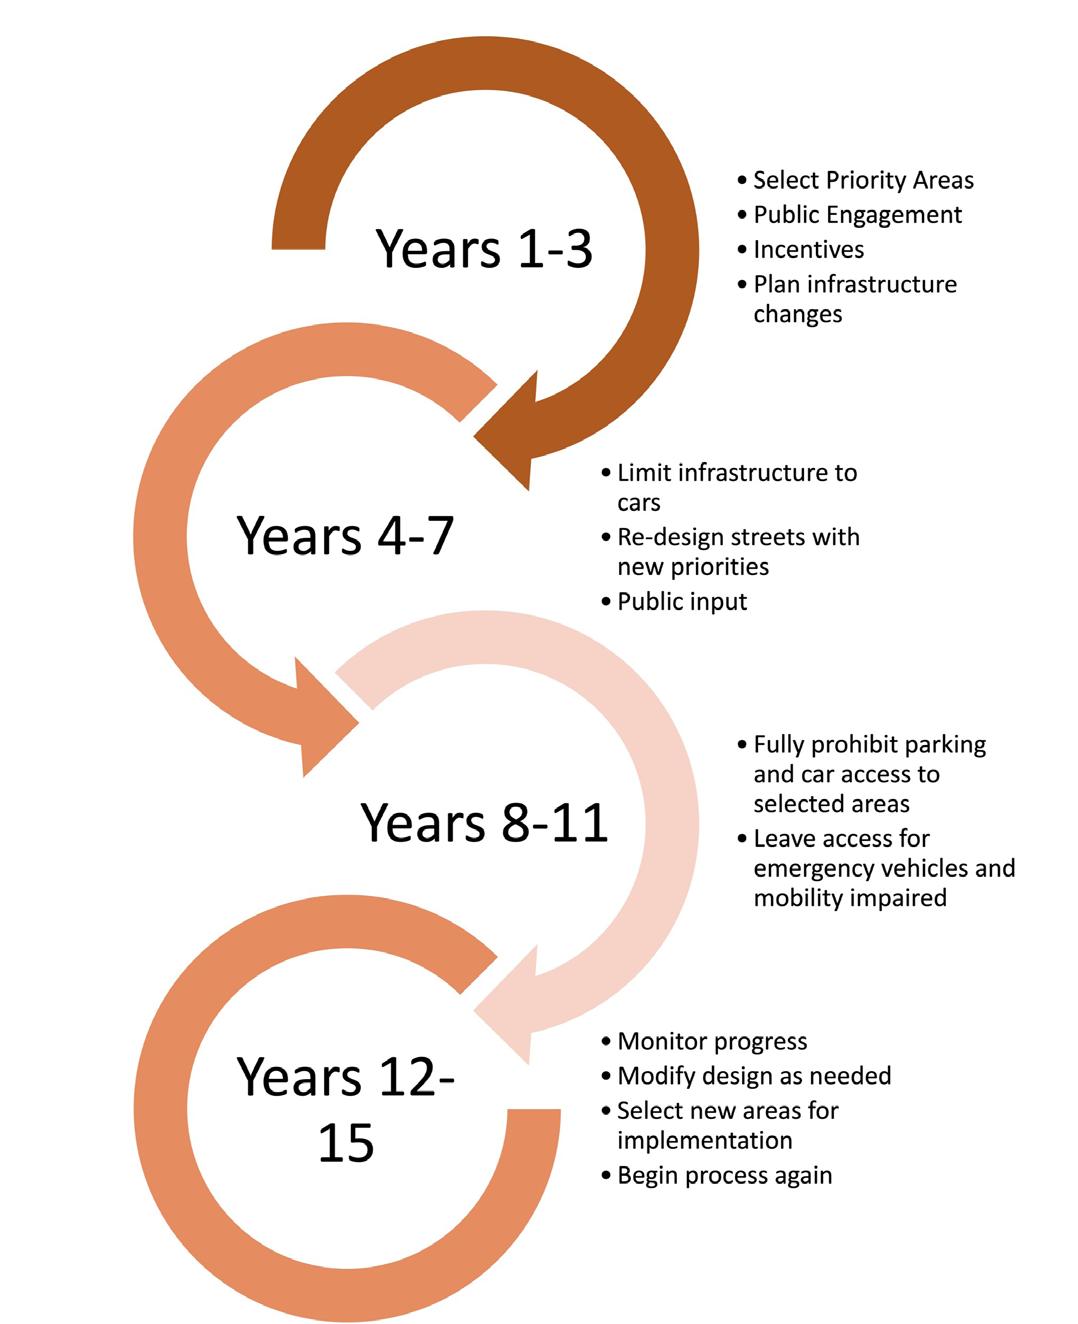
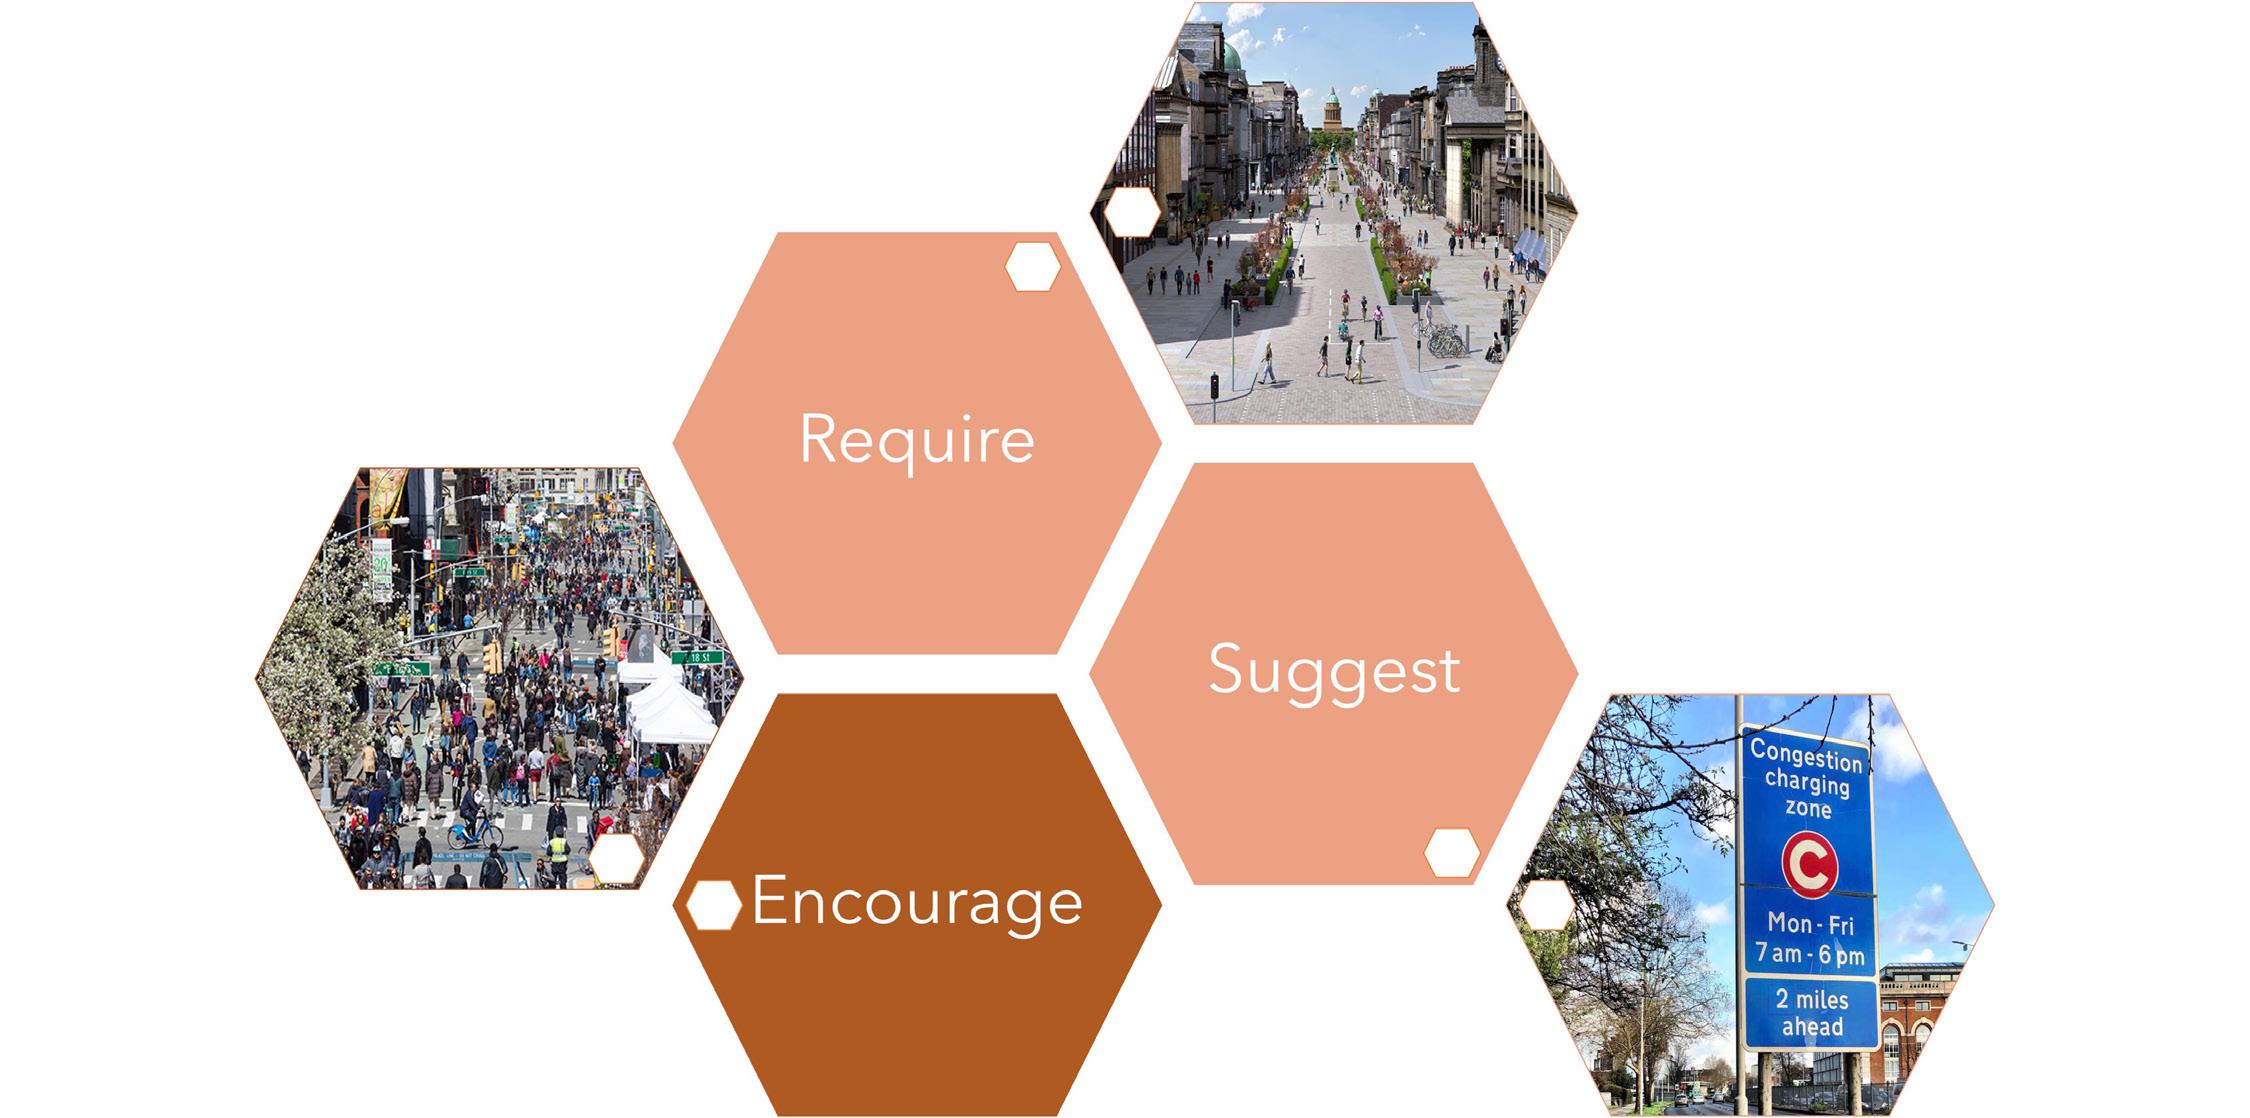
The first step for this project was to research other global cities that are making efforts to go car-free and gather best practices from their work. Many cities are currently attempting to limit or eliminate car traffic entirely, and their efforts can be boiled down to three basic strategies. The first is to encourage residents to be car free. Cities are achieving this mission by hosting community events, raising public awareness, and celebrating multi-modal transportation options. The goal is to get residents excited about the opportunity to reduce their travel in cars. The second strategy is to suggest going car-free. Suggesting is stronger than encouraging, with governments working to reduce street access for cars, reduce parking, or add congestion taxes. In this way, governments are not prohibiting travel in cars, but they are making it more inconvenient and costly to travel this way, which also pushes residents to use other modes. Finally, governments can require a car-free zone. This stage entails fully prohibiting cars on selected spaces and re-designing roads to reflect the new uses. These stages should happen in a procession but can certainly overlap. The goal is to have an incremental approach that allows space for public feedback and support.
After compiling the various strategies from peer cities, we can break the three stages of encourage, suggest, and require into a 15-year plan for implementing a car-free district. Again, the goal is an incrementalist approach with time for reflection, redirection, and public feedback.
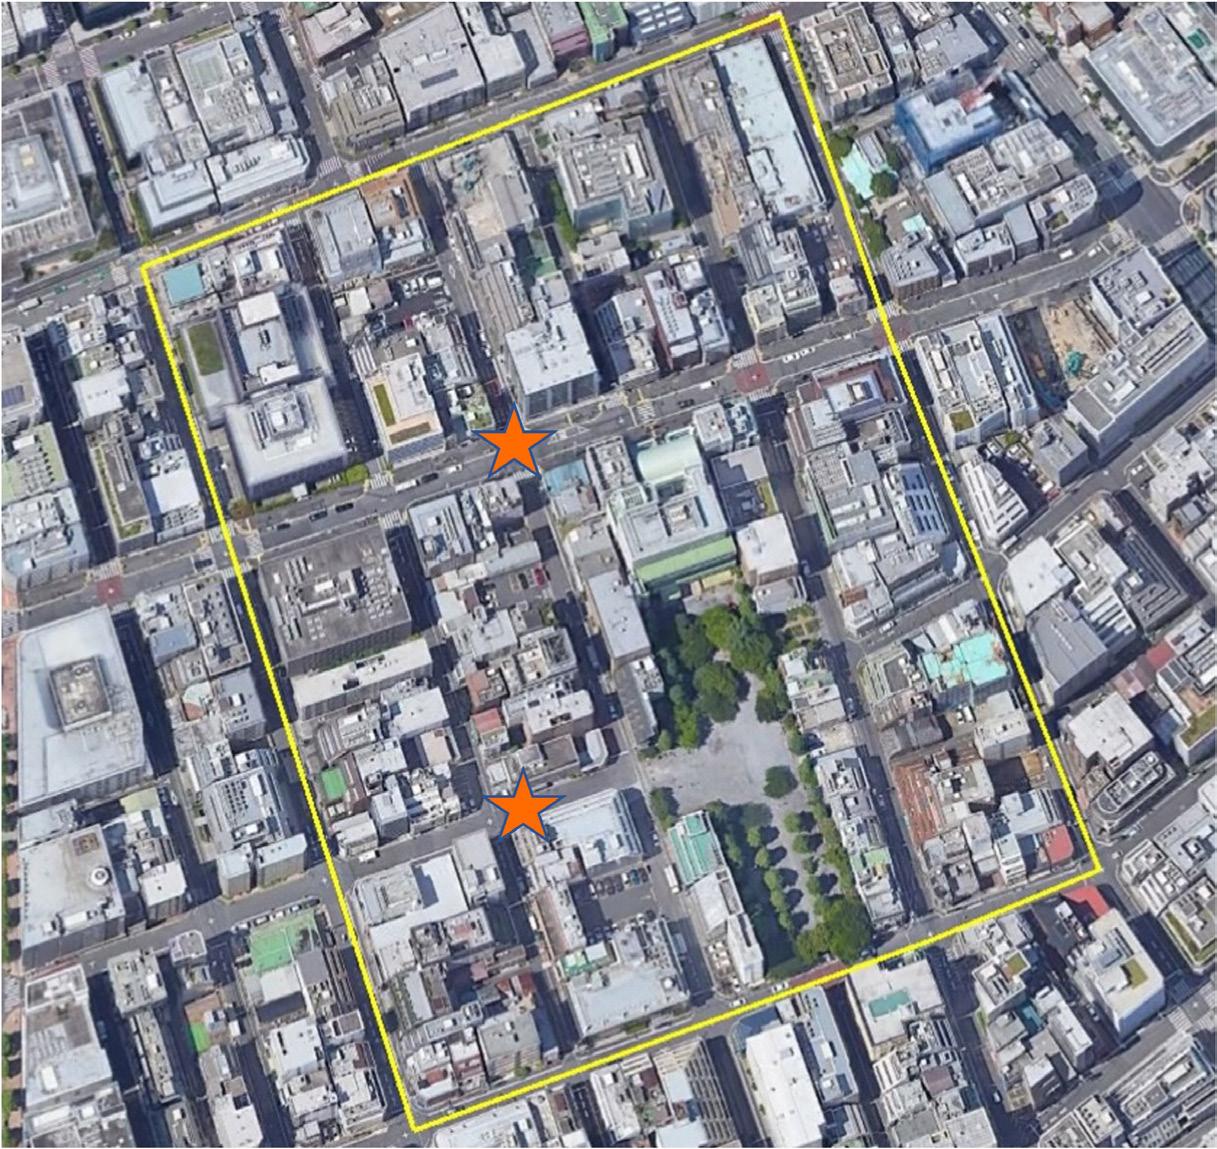
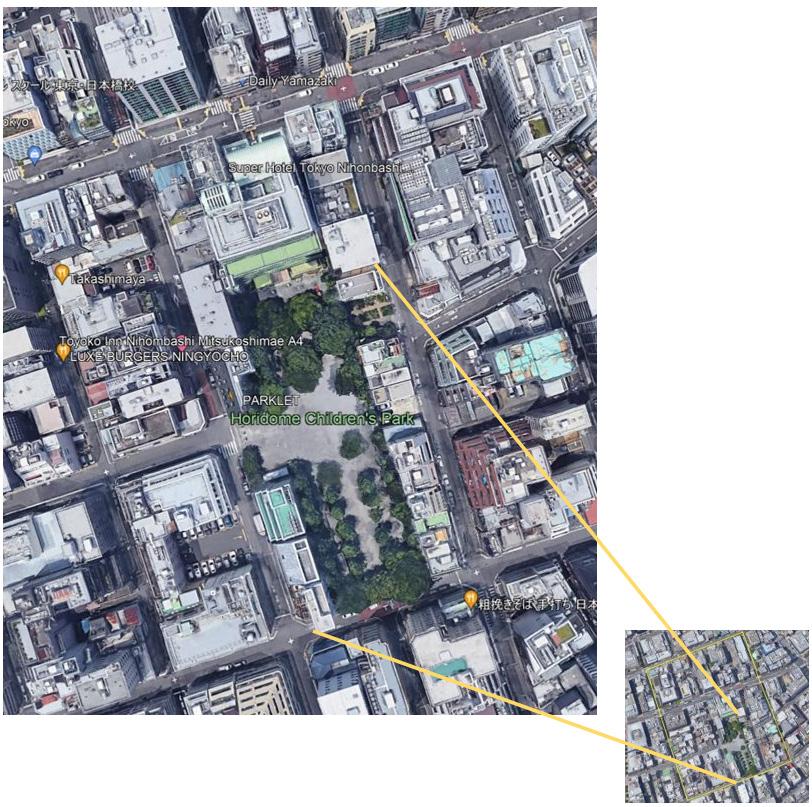
In examining architectural proposals for the redevelopment of District 2, it was determined that District 2 would be a suitable candidate for the first car-free district trial. Specifically, the streets in the image below will be the sites for our implementation plans.
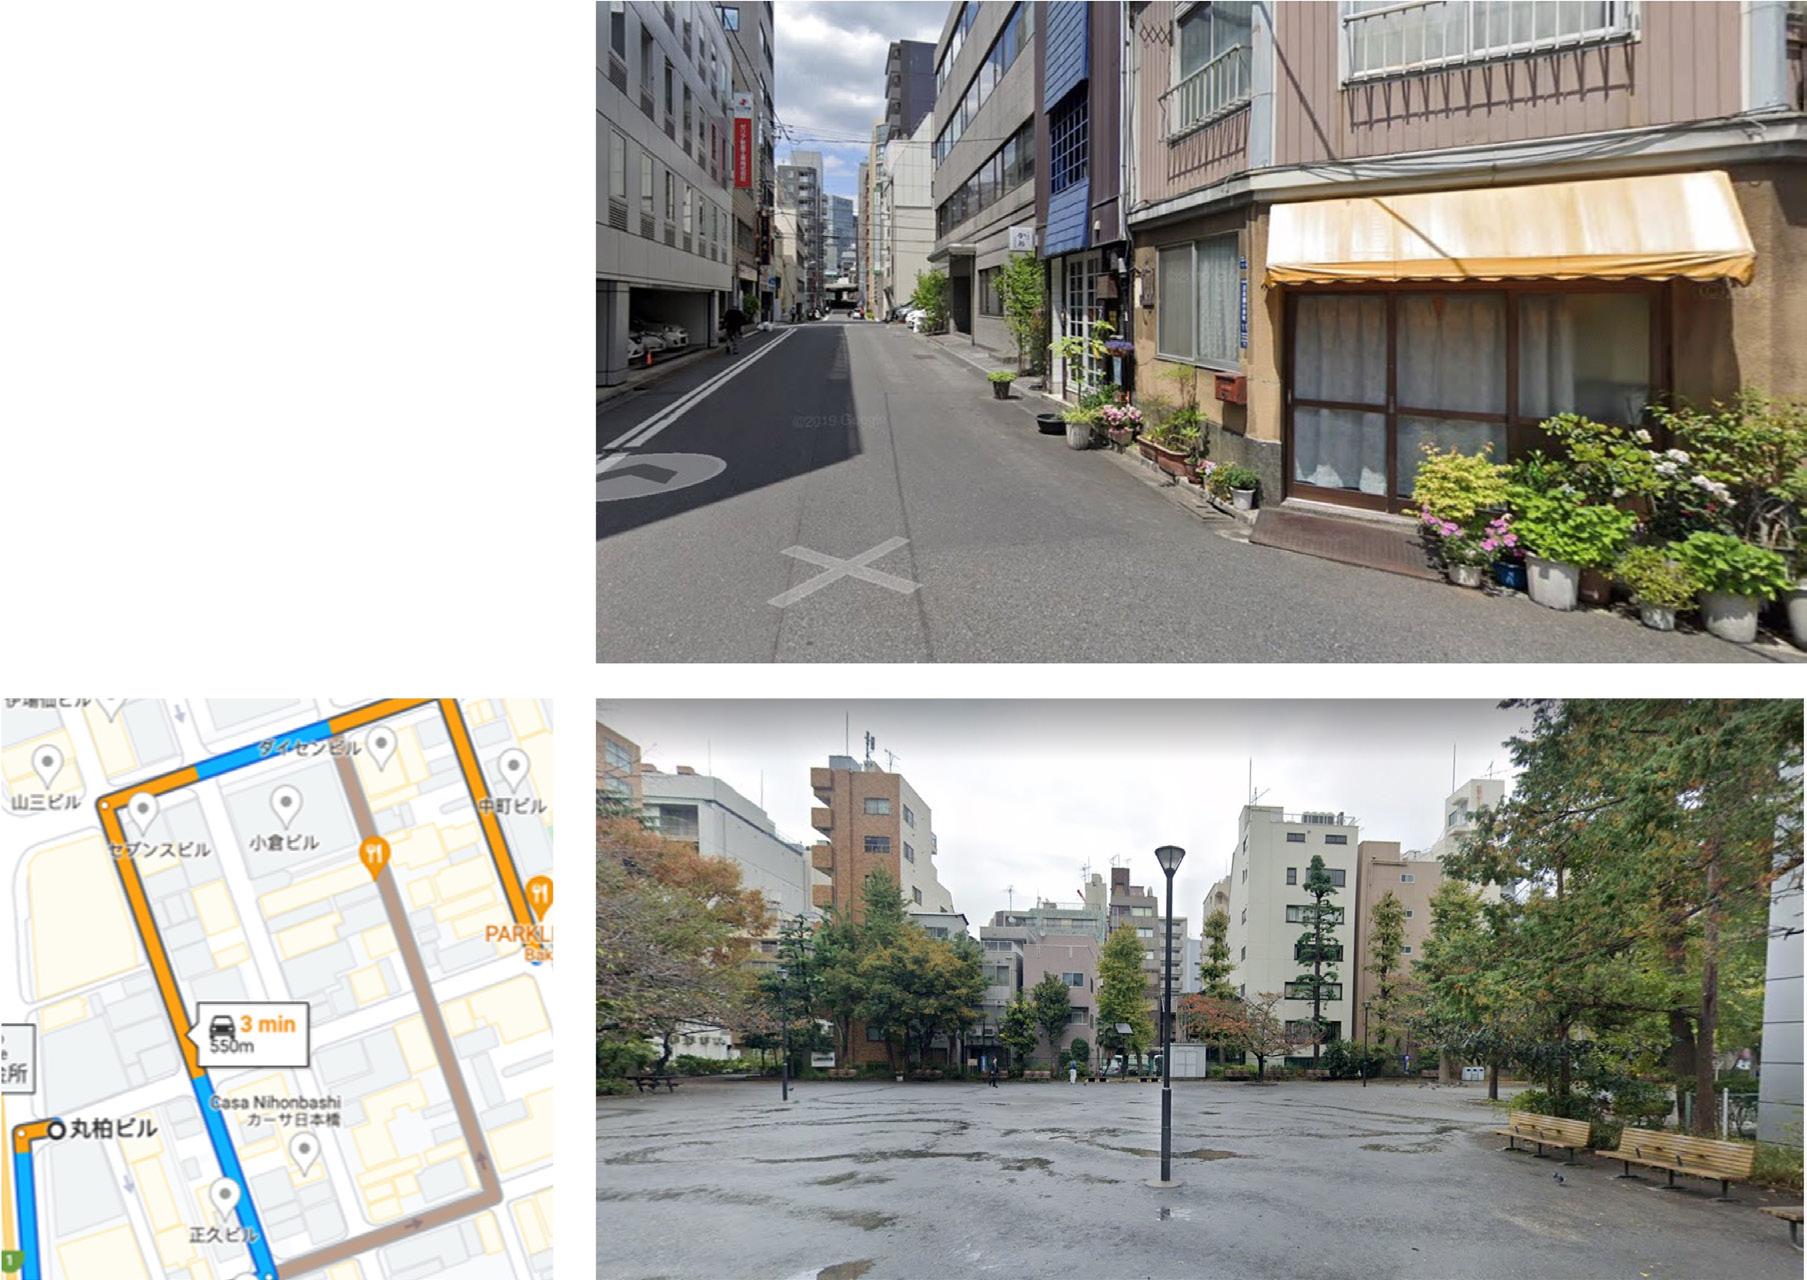
For the first four years of the project, public awareness and engagement will be the focus of the project. Specifically around the re-design of Horidome Children’s Park, community events and listening sessions could be held on the narrow access street and in the park to prepare and excite residents for the incoming changes. The access street is already limited to through traffic, making it a perfect launching point for a car-free district.
The second phase of the implementation looks at the wider road to the north of the children’s park. This road is suitable for the car-free implementation because it is close to green space, it is around a decent amount of mixed uses, and it already has infrastructure that reflects and supports high pedestrian traffic. In this portion of the plan, the street could undergo several aesthetic re-designs to limit car traffic and make the space more amenable to micro-mobility travelers.
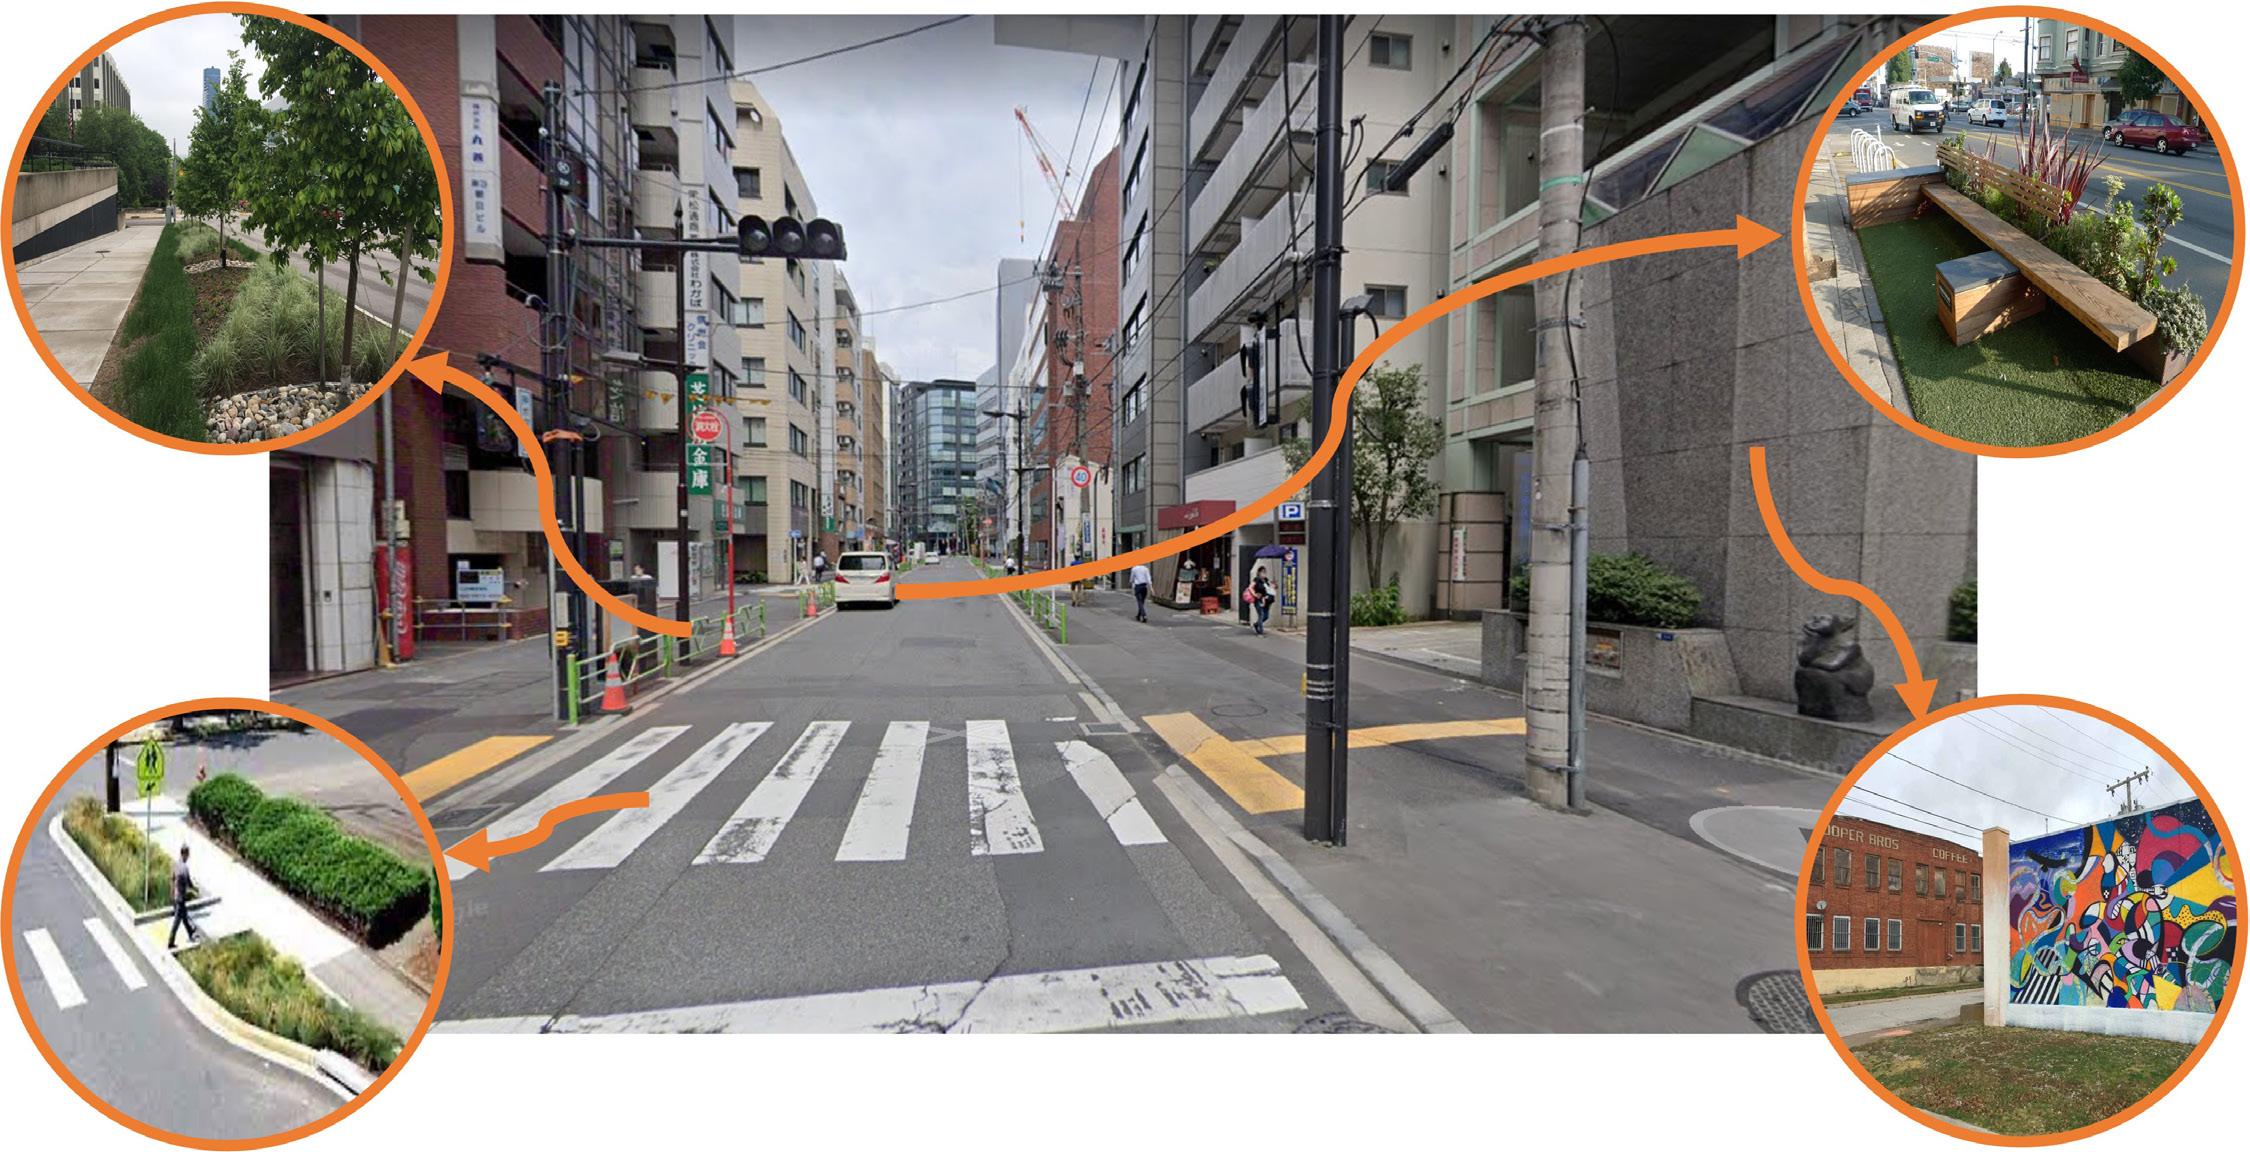
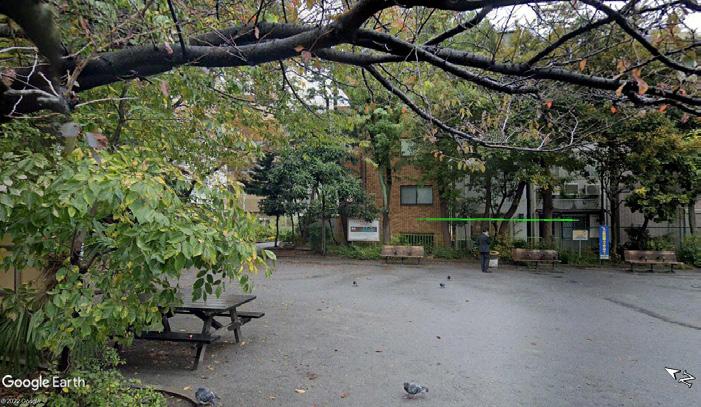
The third phase of the implementation looks at closing the road off to car traffic, except for emergency vehicles and disability services vehicles. To provide for those uses, a lane will remain available, but could be painted green like the renderings below.
Finally, for the final phase of implementation, there must be time for reflection and public feedback. Upon reflection, successes and failures of the project will be noted for the next car-free implementation area.
Maggie
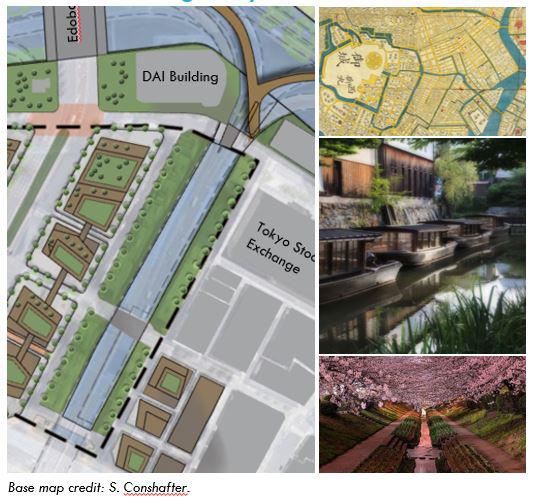
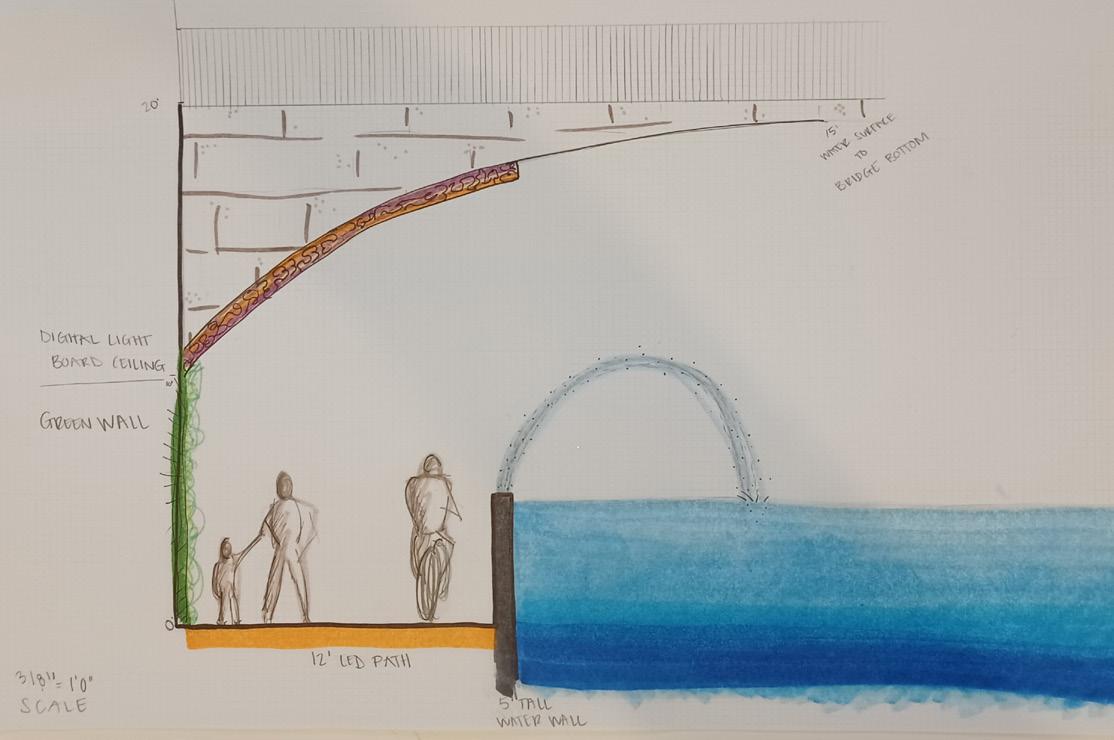
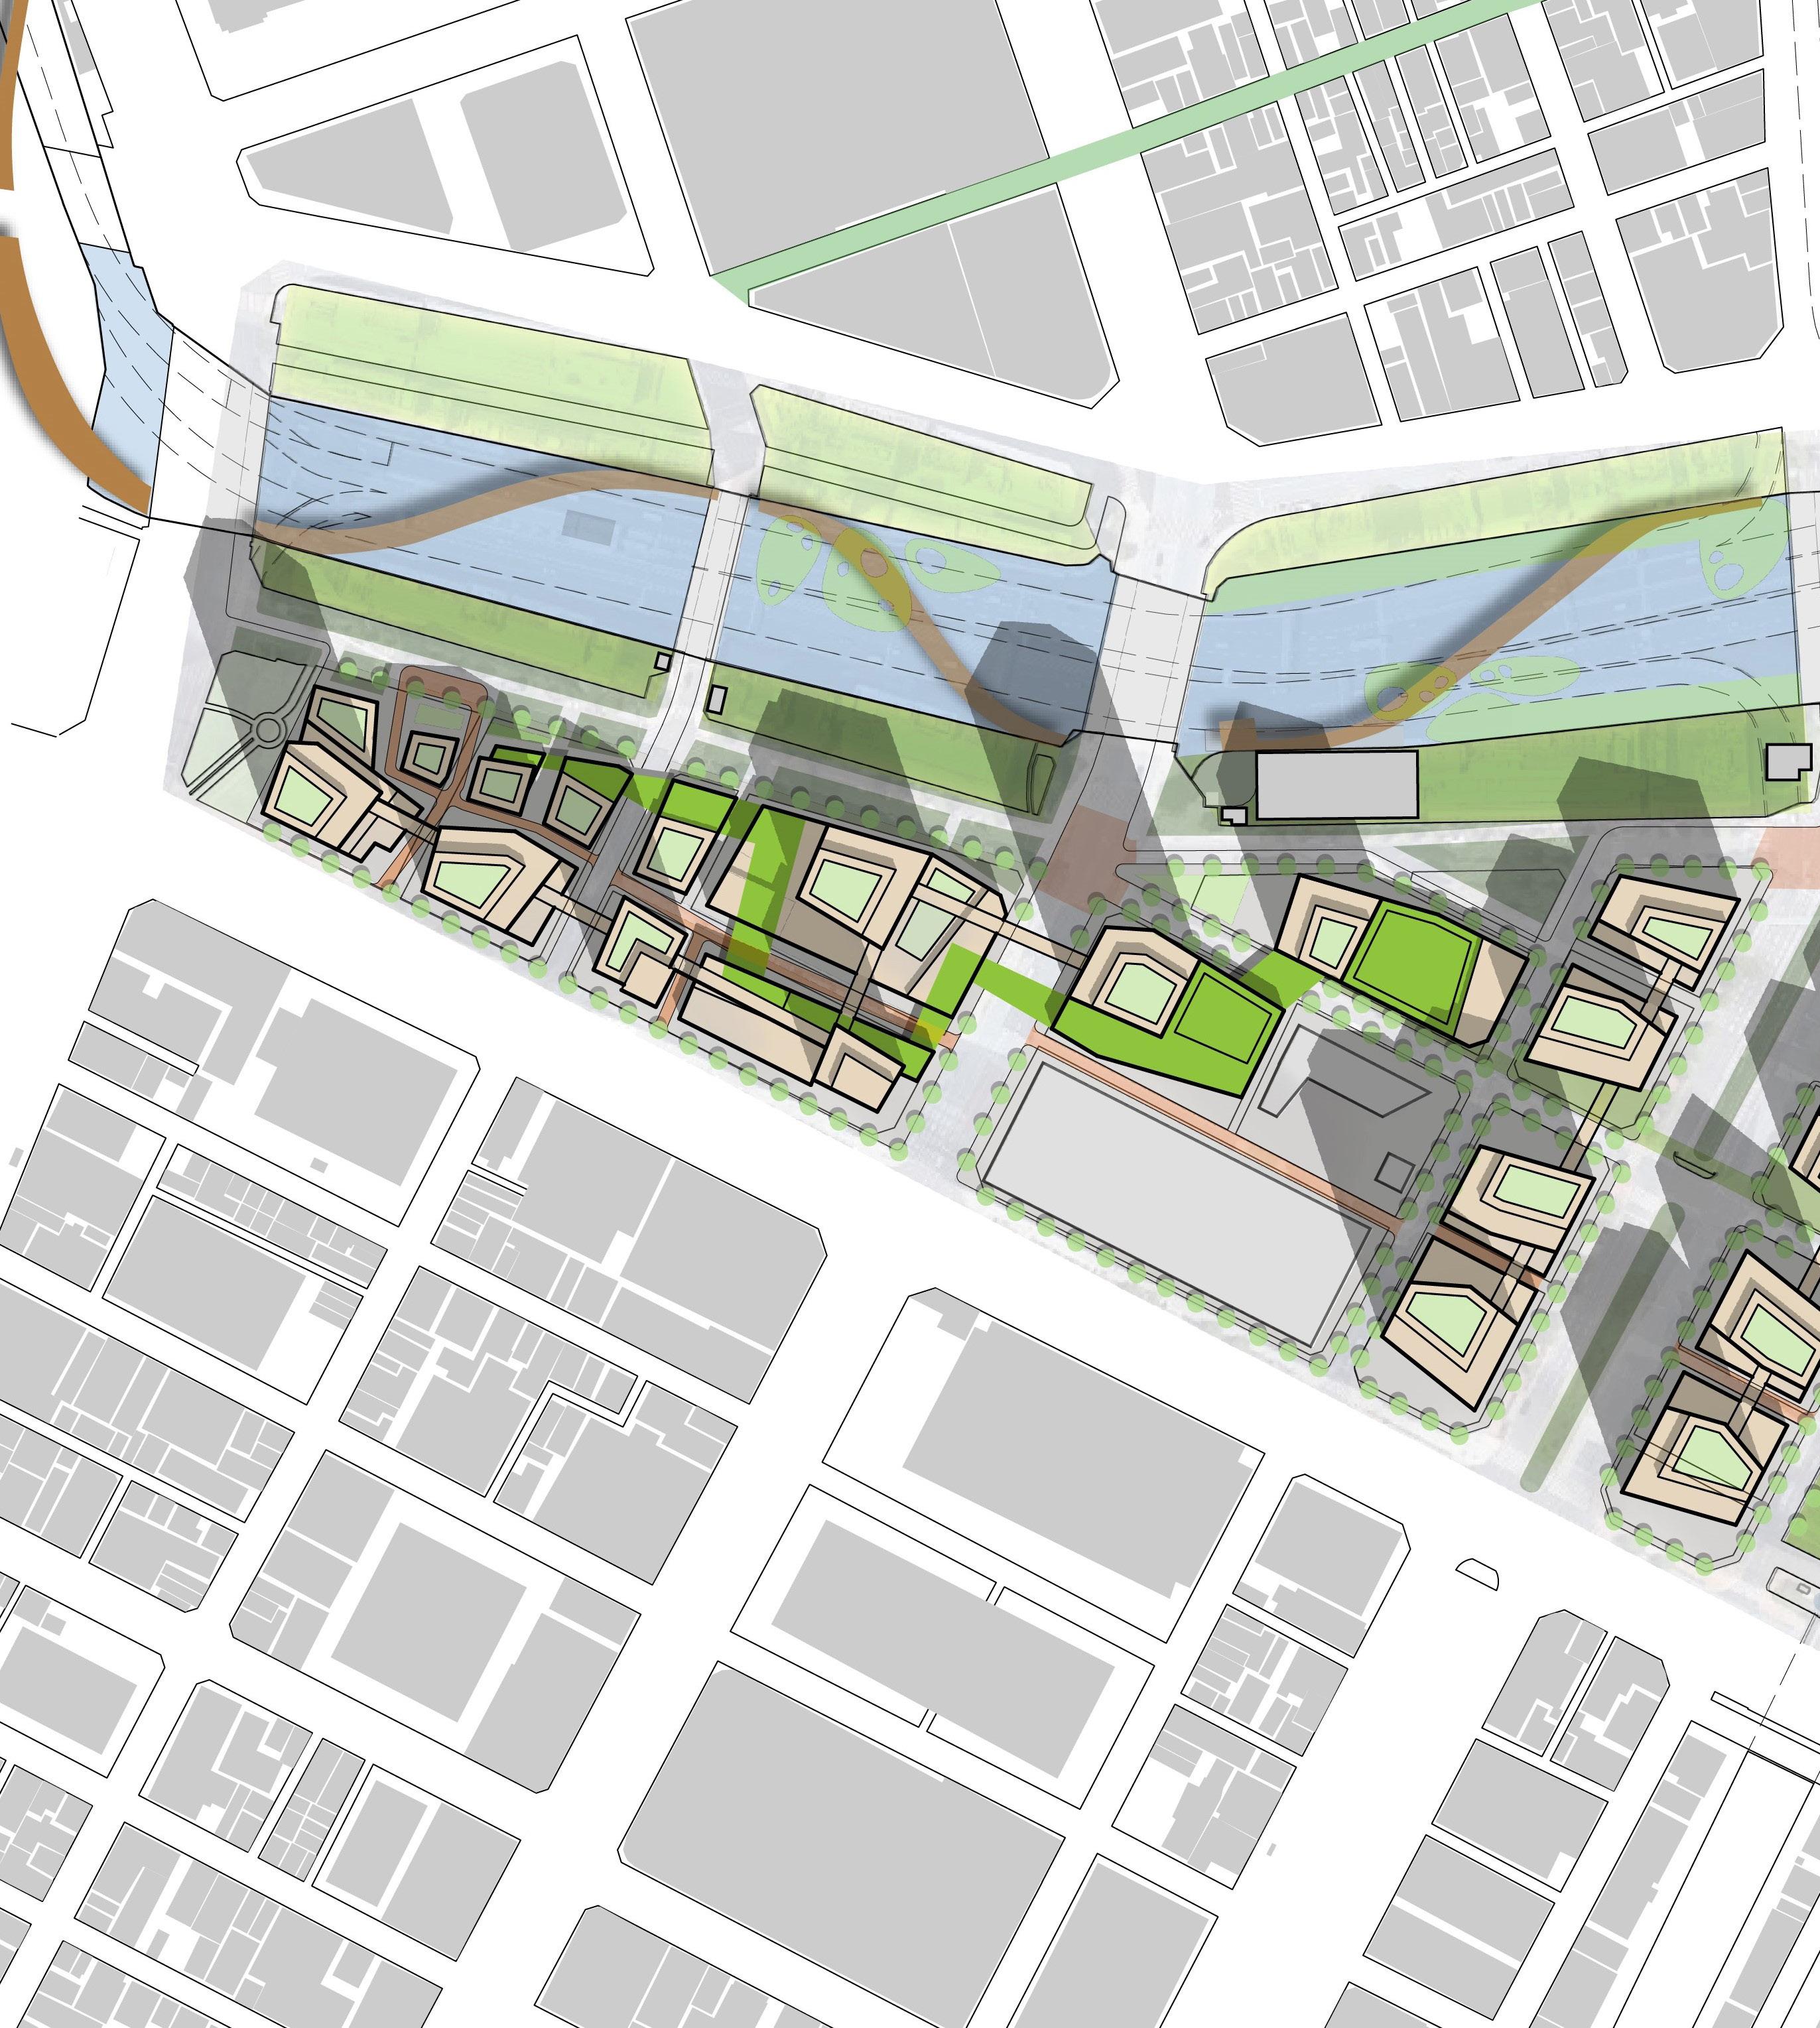
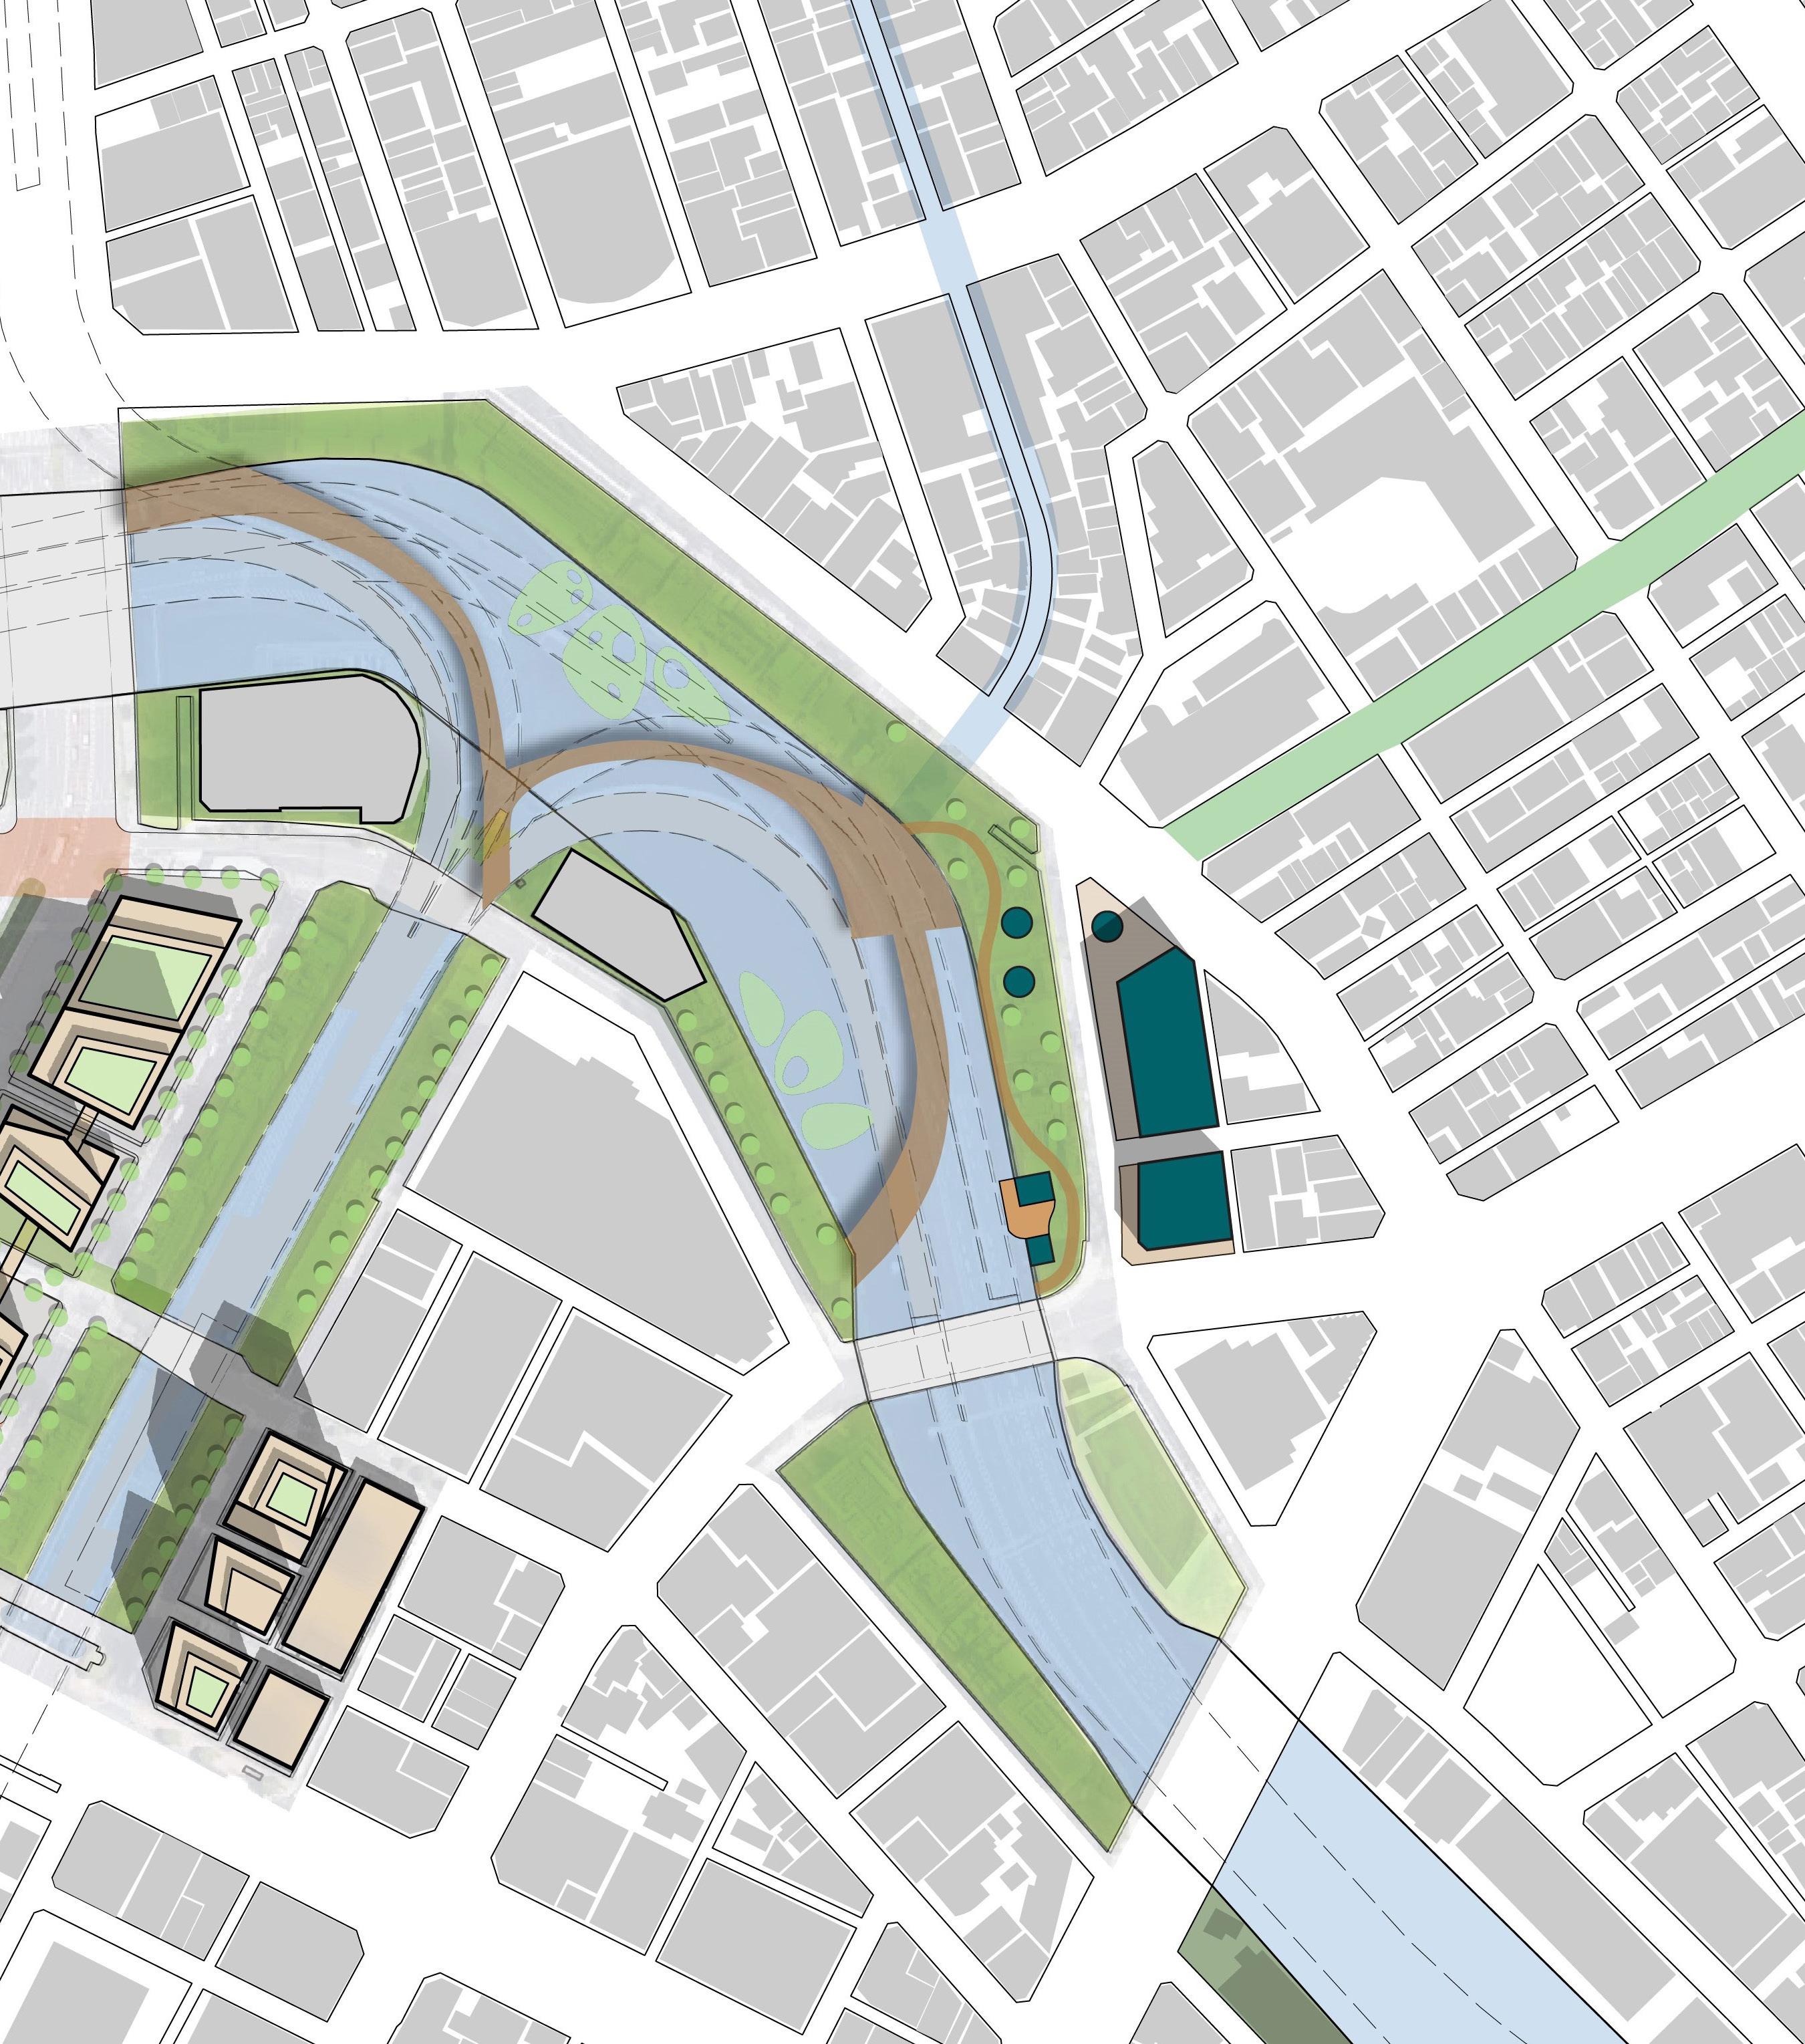
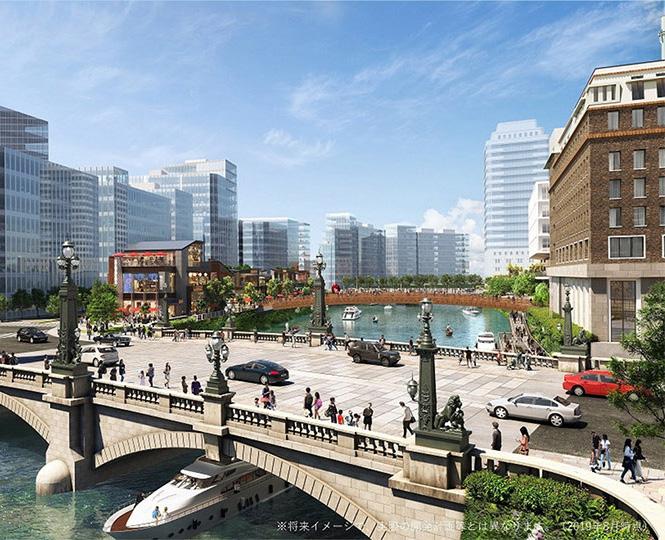
NicholsonSince Nihonbashi Bridge is the historical zero-mile post of Japan, our studio’s master plan is anchored by this feature and its prominence along the riverfront once the elevated expressway is removed. We aim to bridge Nihonbashi’s past and future through cultural-based designs, activation, and programming along this central water course to make the district a leading example in the achievement of Tokyo’s 2040 and eSG sustainability goals. We believe that broader access to water can be a driver of systematic social, cultural, and environmental change. There are three guiding elements in this riverfront plan: the recreated canal form, dedicated pedestrian and bicycle paths through green and blue spaces (cultural corridors), and a digital park under the Edo Bridge.
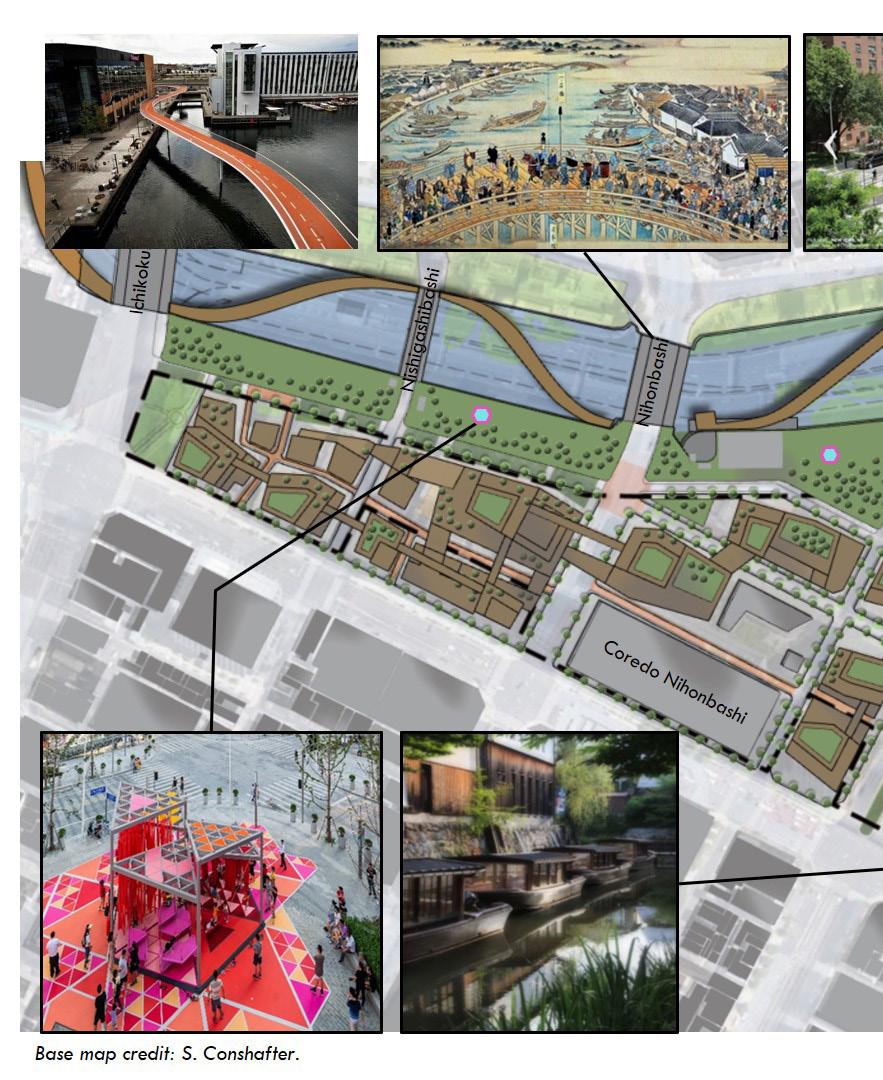
As an island nation, Japan has depended on the ocean for prosperity, yet it also lives in opposition to its powerful forces. In a civic sense, the larger relevance of water – the good and the bad - has been lost, blocked from view and out of reach with seawalls and flood gates, capped and buried underground, or pushed further away with landfill in Tokyo Bay. The elevated Metropolitan Expressway within Nihonbashi contributed to this disconnect. Its construction filled several historic canals and has hidden the Nihonbashi River from view for nearly 60 years. Upon its removal, waterfront placemaking will be key to reconnecting citizens with these blue spaces and to the heritage of the district. In today’s “experience economy”, cities must orchestrate memorable events for their citizens, so that memory itself becomes the part of their urban experience. Emotional and biophilic connections are re-established in Nihonbashi through the revitalization of its canals and rivers, their flows to greater Tokyo Bay, and their evolving role in a future water world.
Nihonbashi’s historic canal form is culturally valuable in its usage of oku, or the inner-outer dichotomy of traditional Japanese space. This theory was popularized by Japanese architect Fumihiko Maki and insinuates more private and intimate uses and feelings for inner spaces compared to outer spaces. This is seen in the rings of canals surrounding Edo Castle as well as Tokyo’s street hierarchy. The theory has both spatial and psychological configurations, which have the power to restore the balance between Nihonbashi’s built environment and natural elements as well as its role within greater Tokyo.
A large canal perpendicular to the river’s south bank is targeted for daylighting in our plan. This will inject blue and green space into Nihonbashi’s commercial heat island core. Should surrounding office buildings be converted to residential units, future residents will now have nearby access to recreation and beautiful canal scenes. This canal is also large enough to support water taxis, thereby expanding river transit and enhancing a historic transportation network for a sustainable future city.
While the presence of water is important in this design strategy, it can take a variety of forms. For example, the “canal” connection between the riverfront’s north bank and District 2 is just wider than a vehicle. Instead of recreating an actual canal here, the historic form can be mimicked with a car-free zone lined with green infrastructure and vertical greening. The green infrastructure can retain stormwater, making temporary water features before infiltration. This human-scale experiential path amplifies the intimacy found in traditional Tokyo alleyways while working with the space constraints.
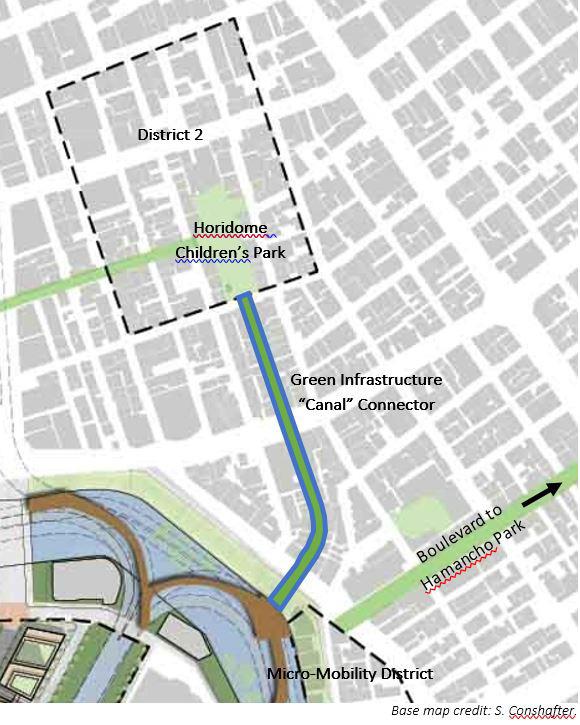
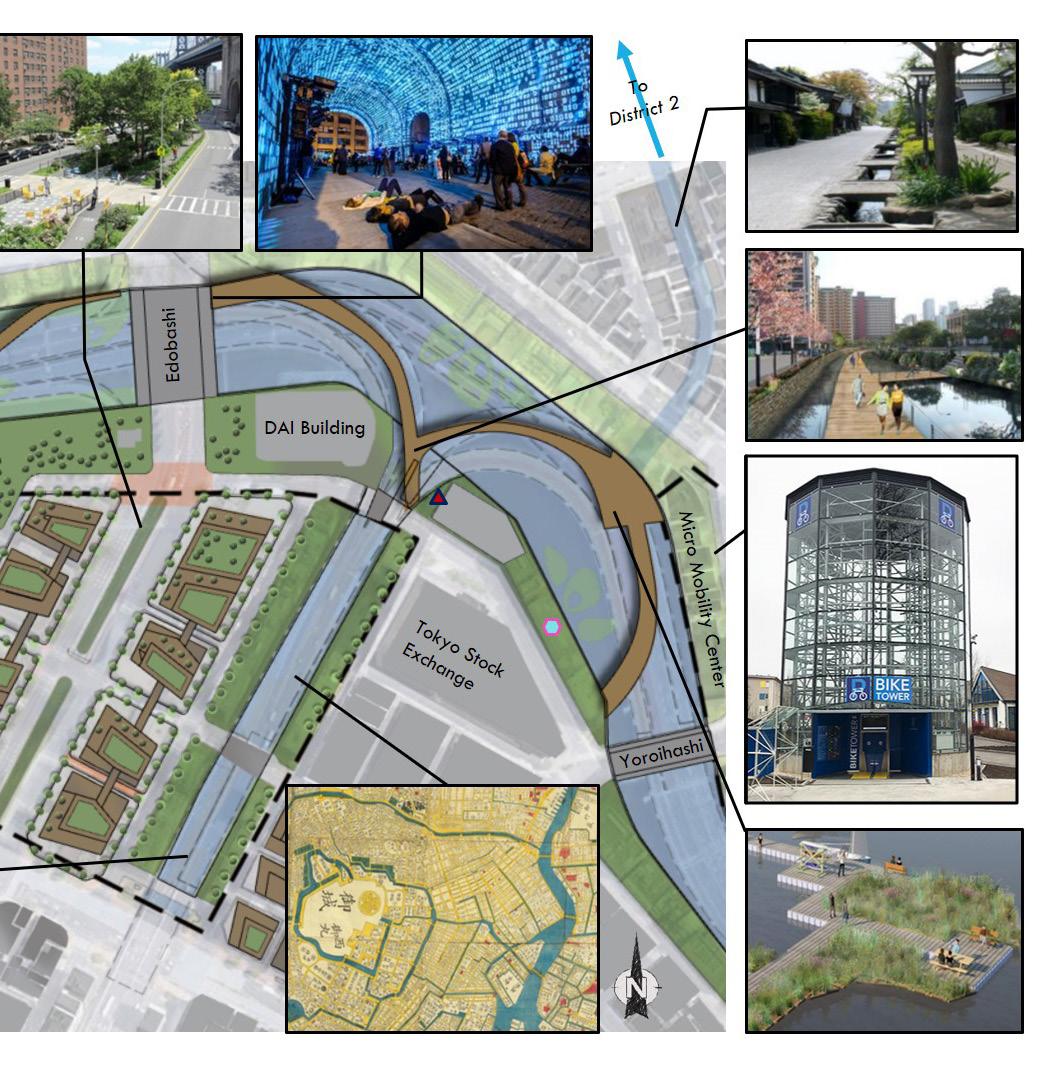
Tokyo’s eSG goals prioritize human-centered, walkable spaces surrounded by greenery and water rich in biodiversity. Our green cultural corridors strategy does just this. Using elevated boardwalks, a system of pedestrian and bicycle paths weaves over water and through new linear riverfront parks. The new greenspaces remove impervious surface cover, creating infiltration opportunities that address both upstream (watershed) and downstream (Tokyo Bay and storm surge) water threats. Many historic buildings, landmarks, and shrines are located near the riverfront and the boardwalk-path system supports connectivity between all. It is anchored on each end by micro-mobility hubs – the existing Tokiwabashi bicycle parking hub and a newly proposed micro-mobility district near the Koamicho Children’s Park.
A broader network of boulevards can also be incrementally introduced building off the boardwalk form. Strategic routes for this strategy include:
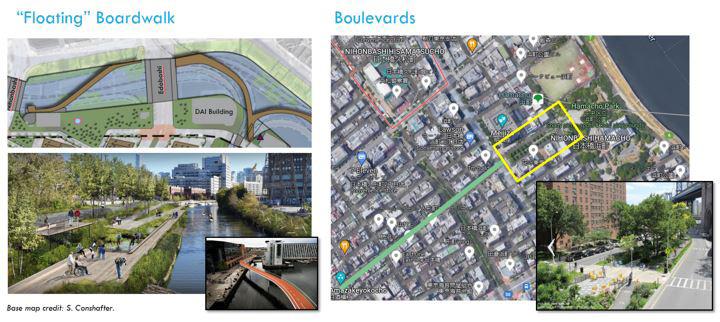
1. Amazakeyokocho Street to connect Hamancho Park to the Nihonbashi riverfront.
2. Eitai-dori Avenue from the Tokyo Station tracks to the Kamejima River. This avenue is where the renewed canal ends, so it would be a strong intersection.
3. The approach to and over the Edo Bridge.
Cultural experiences and public art must be integrated along these cultural corridors to create stimulating visual interest. A unique cultural facet of the over water boardwalk component is the utilization of existing expressway pillars. This is a cost-savings measure as well as a wabi-sabi outlook on a hard urban lesson learned – vehicle prioritization is no longer considered progress; riverfront revitalization is. Further cost savings can be achieved over the long-term if kinetic pavers are used for boardwalk construction, which harnesses the power of a footstep to generate off-grid electricity. Perhaps to power the digital displays in our next riverfront strategy.
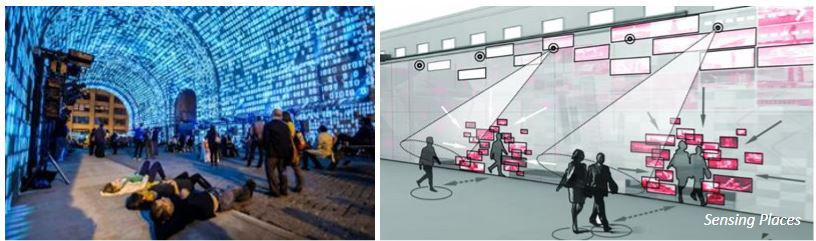
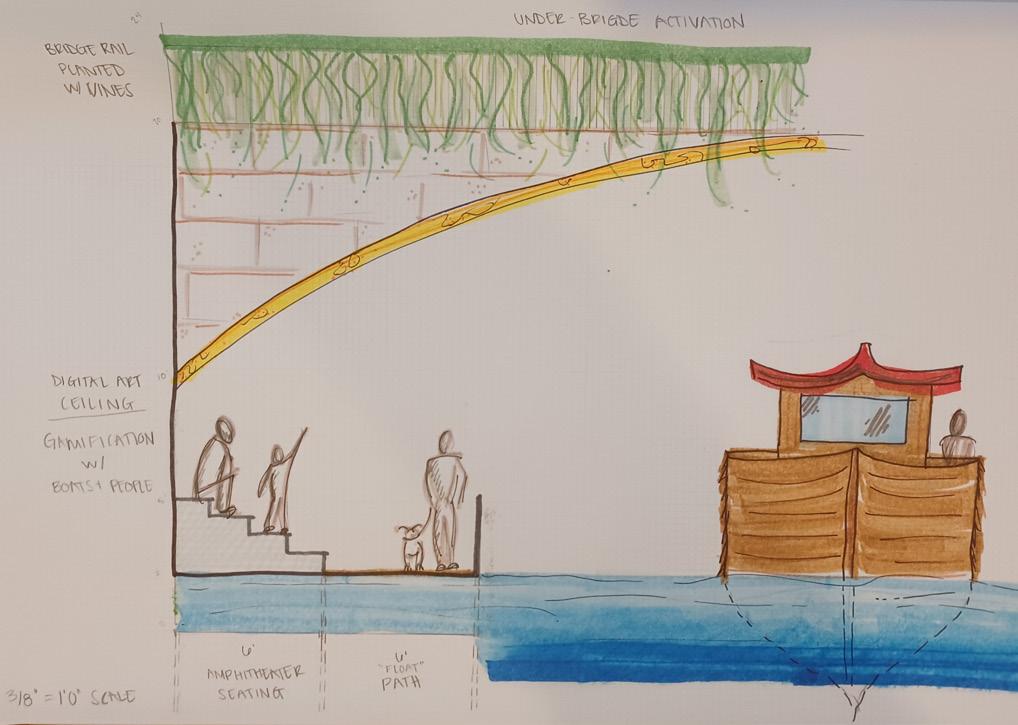
This detail of the master plan restores a lost connection to the water of the Nihonbashi River. Targeting the Edo Bridge because of its proximity to the historic Nihonbashi Bridge, this under-bridge placemaking strategy reconciles old with new, history with modernity; it plays on the themes of above-below, inner-outer, memory-imagination, tactileephemeral, and technological-natural spaces. The green cultural corridor boardwalks deliver users under the bridge and close to the water’s surface. Virtual reality ceilings and walls create engagement space, literally plugging passersby into Nihonbashi’s evolving story. Pedestrians, water taxi riders, and bicyclists can experience themselves along the river during the traditional Edo Period and imagine futuristic Nihonbashi. These digital tools can also impart local historical facts, share best practices individuals can implement to do their part to help Tokyo achieve its 2040 and eSG sustainability goals, provide wayfinding for tourists, and support a city-wide emergency notification system.

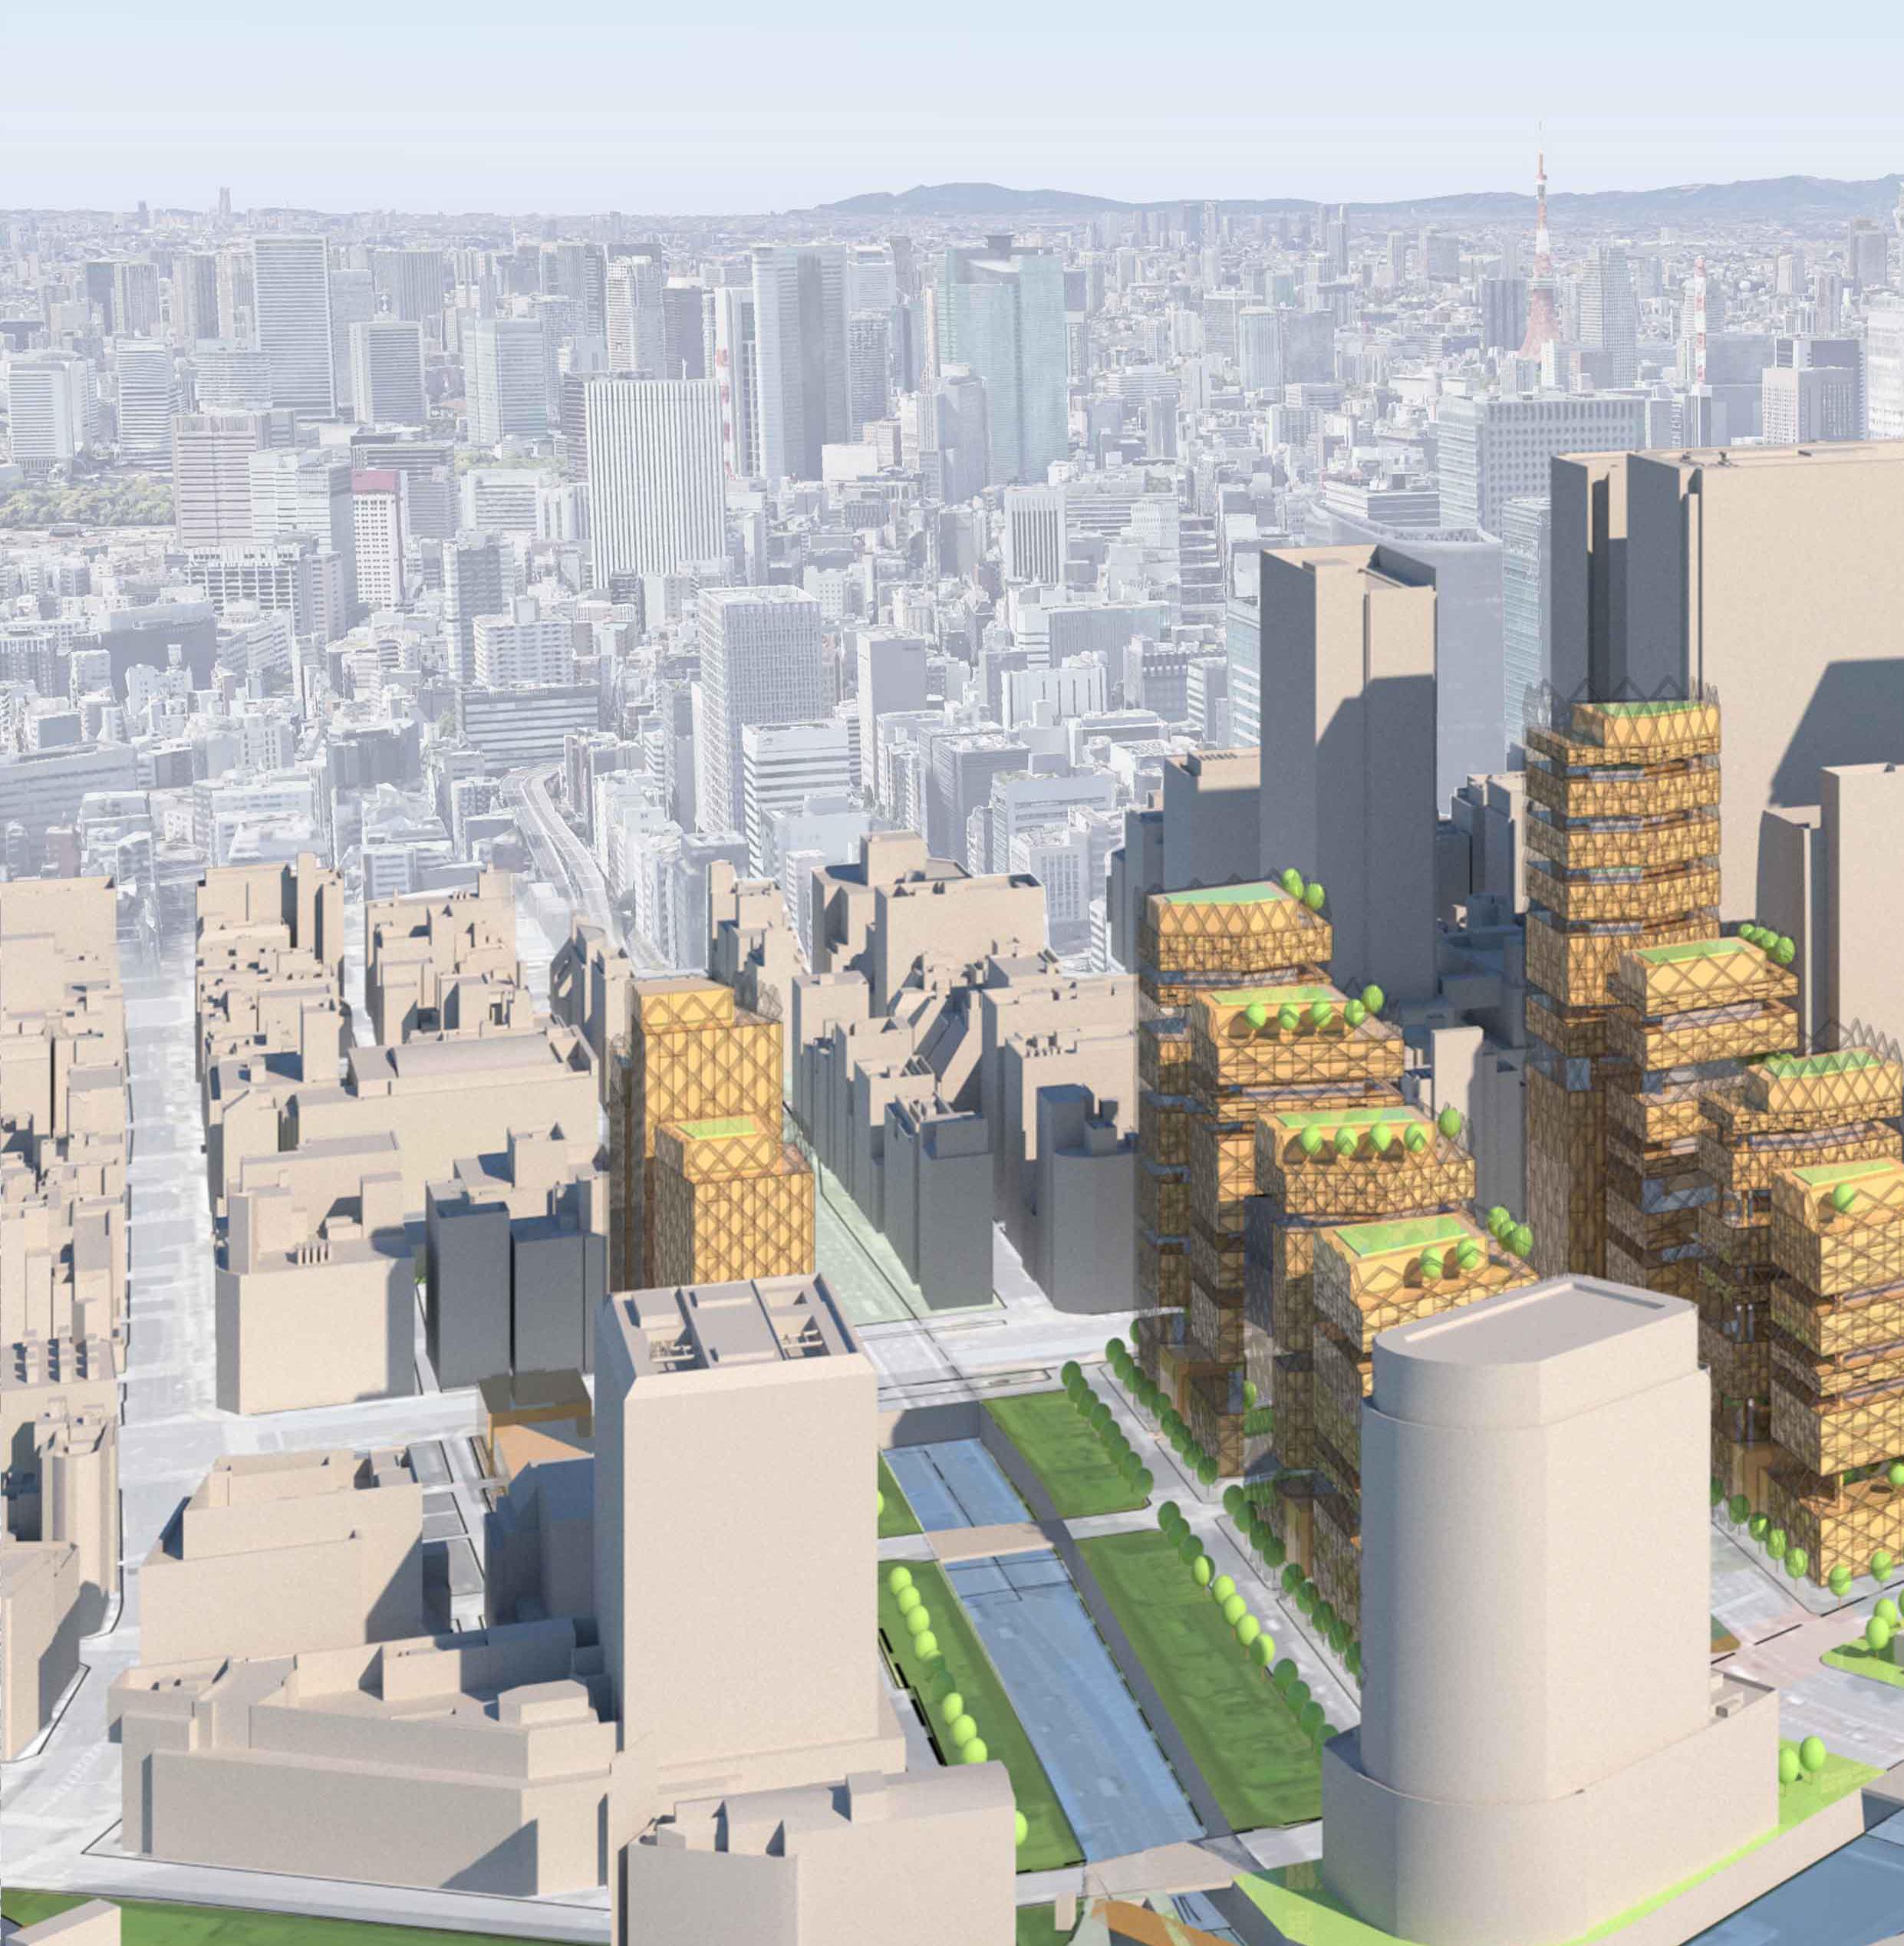
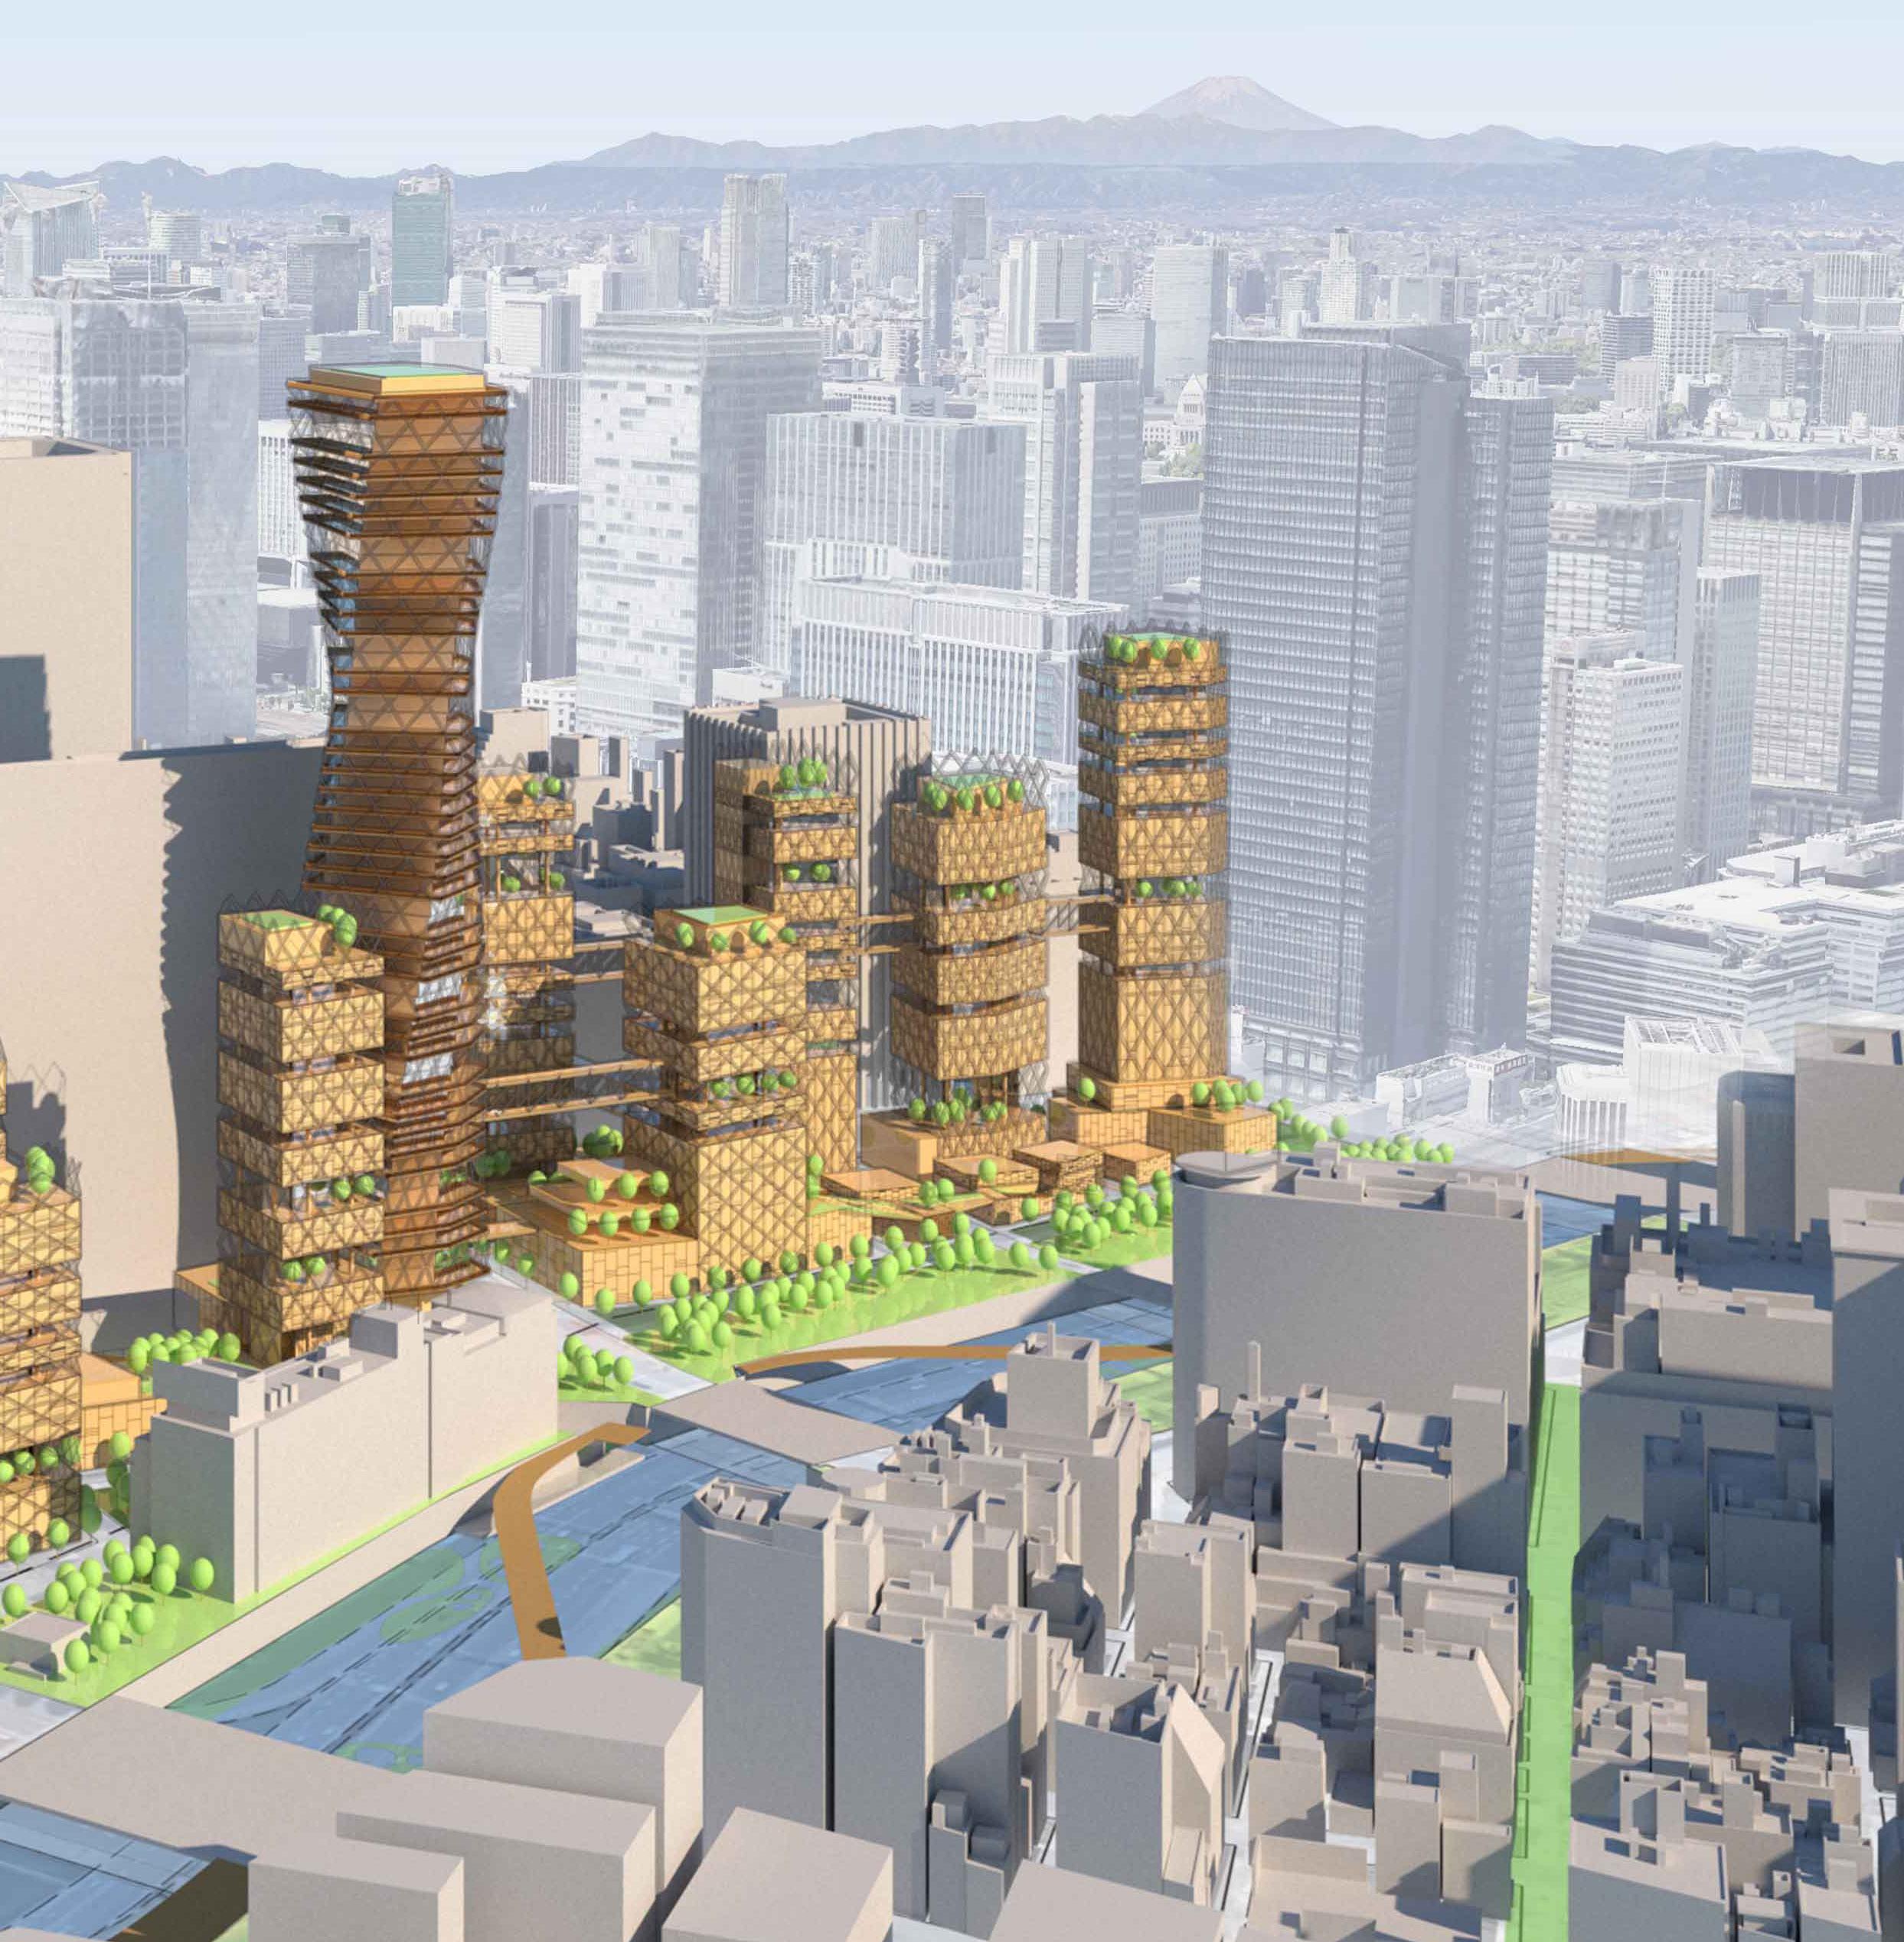
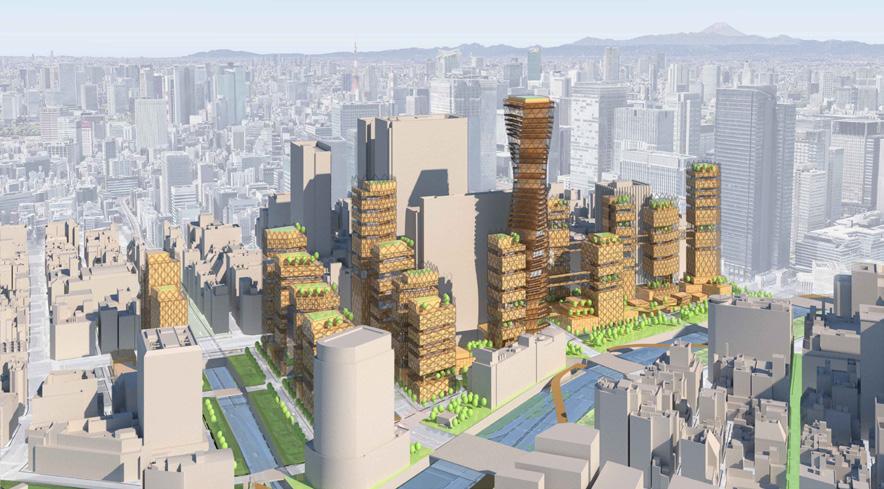
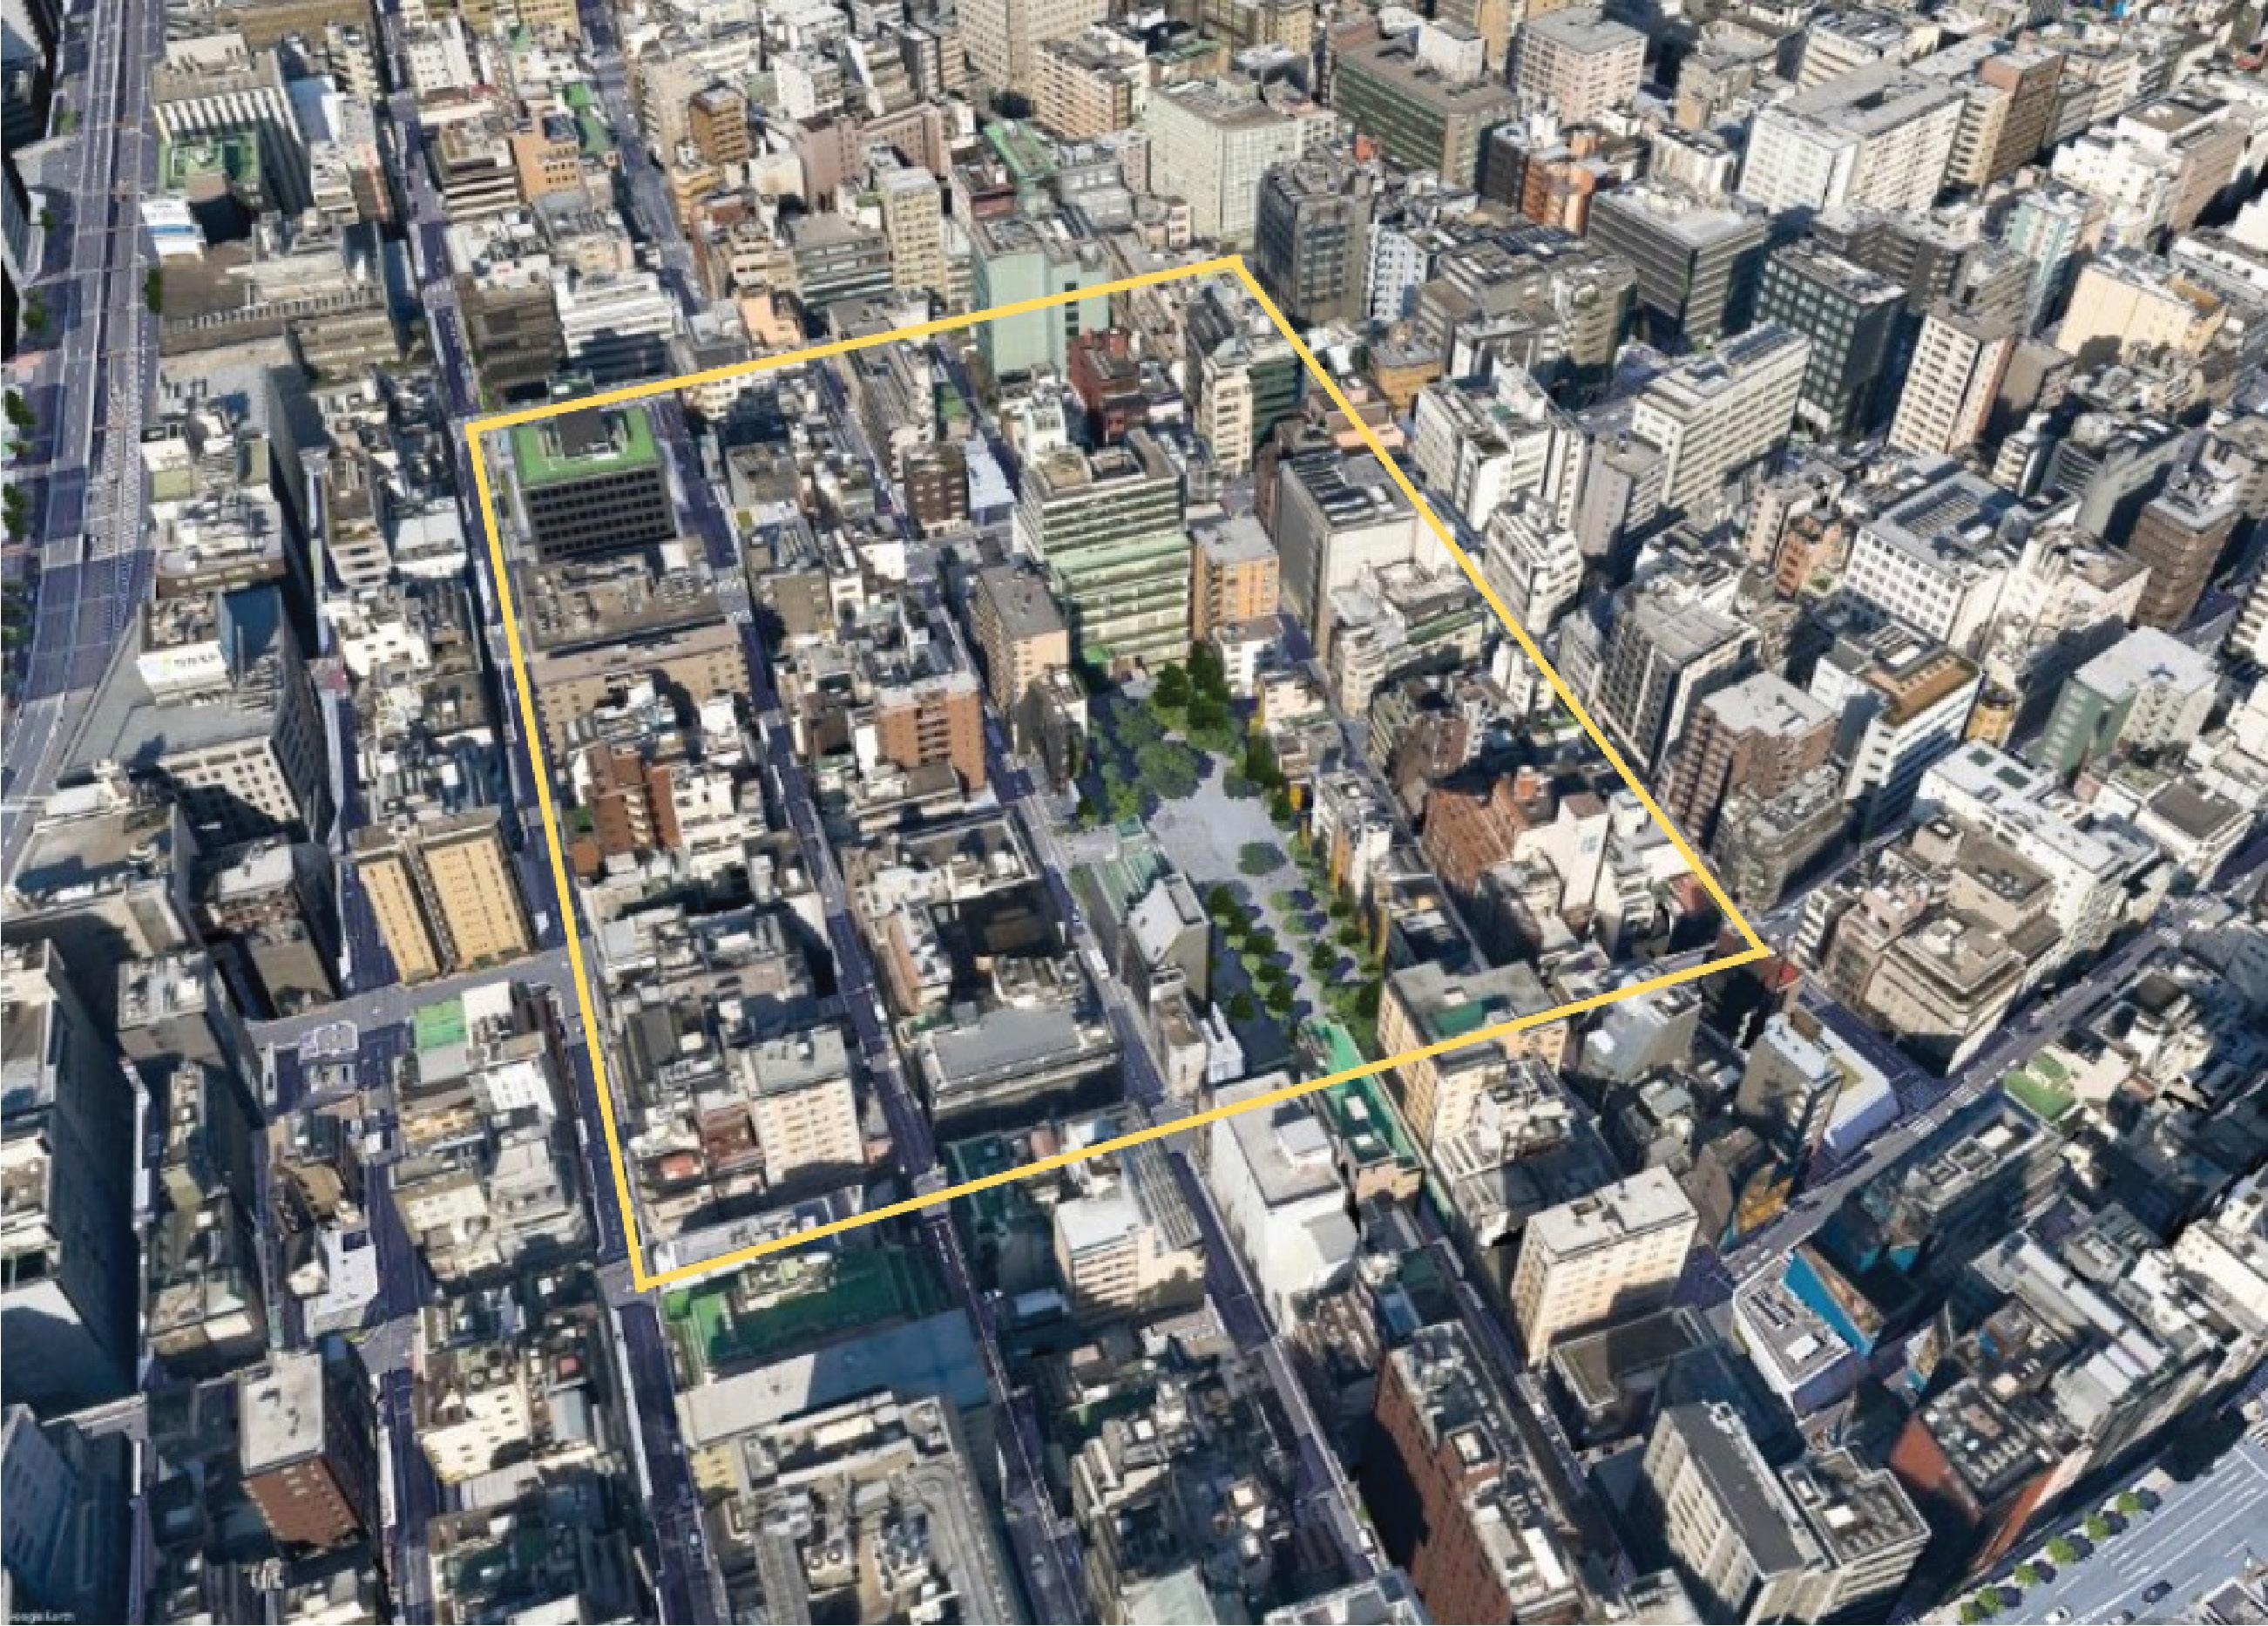
Nihonbashi is the historic center of Tokyo and the “kilometer zero” point for all of Japan. Though the area has seen massive changes over time, in terms of war and redevelopment, it largely retains a grid of streets and alleys that recall the Edo-era architectural fabric. Though presented with positive changes, such as the removal of the Nihonbashi expressway, the neighborhood faces challenges in the form of redevelopment, COVID lifestyle changes, demographics, and climate change. New development underway is increasingly subsuming the historic street grid, replacing it with massive office towers. Such development is “business as usual” in a world that desperately requires new thinking.
There could have been another way.

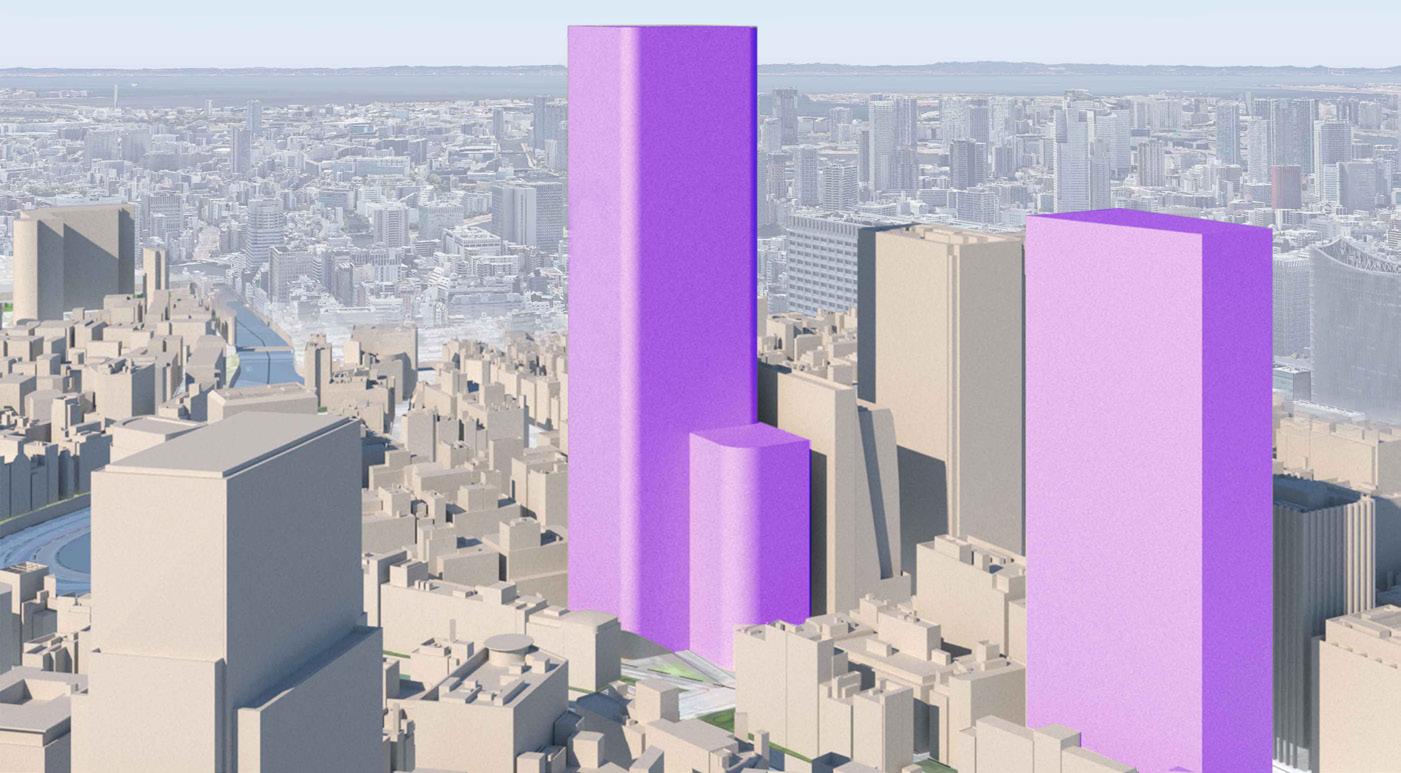
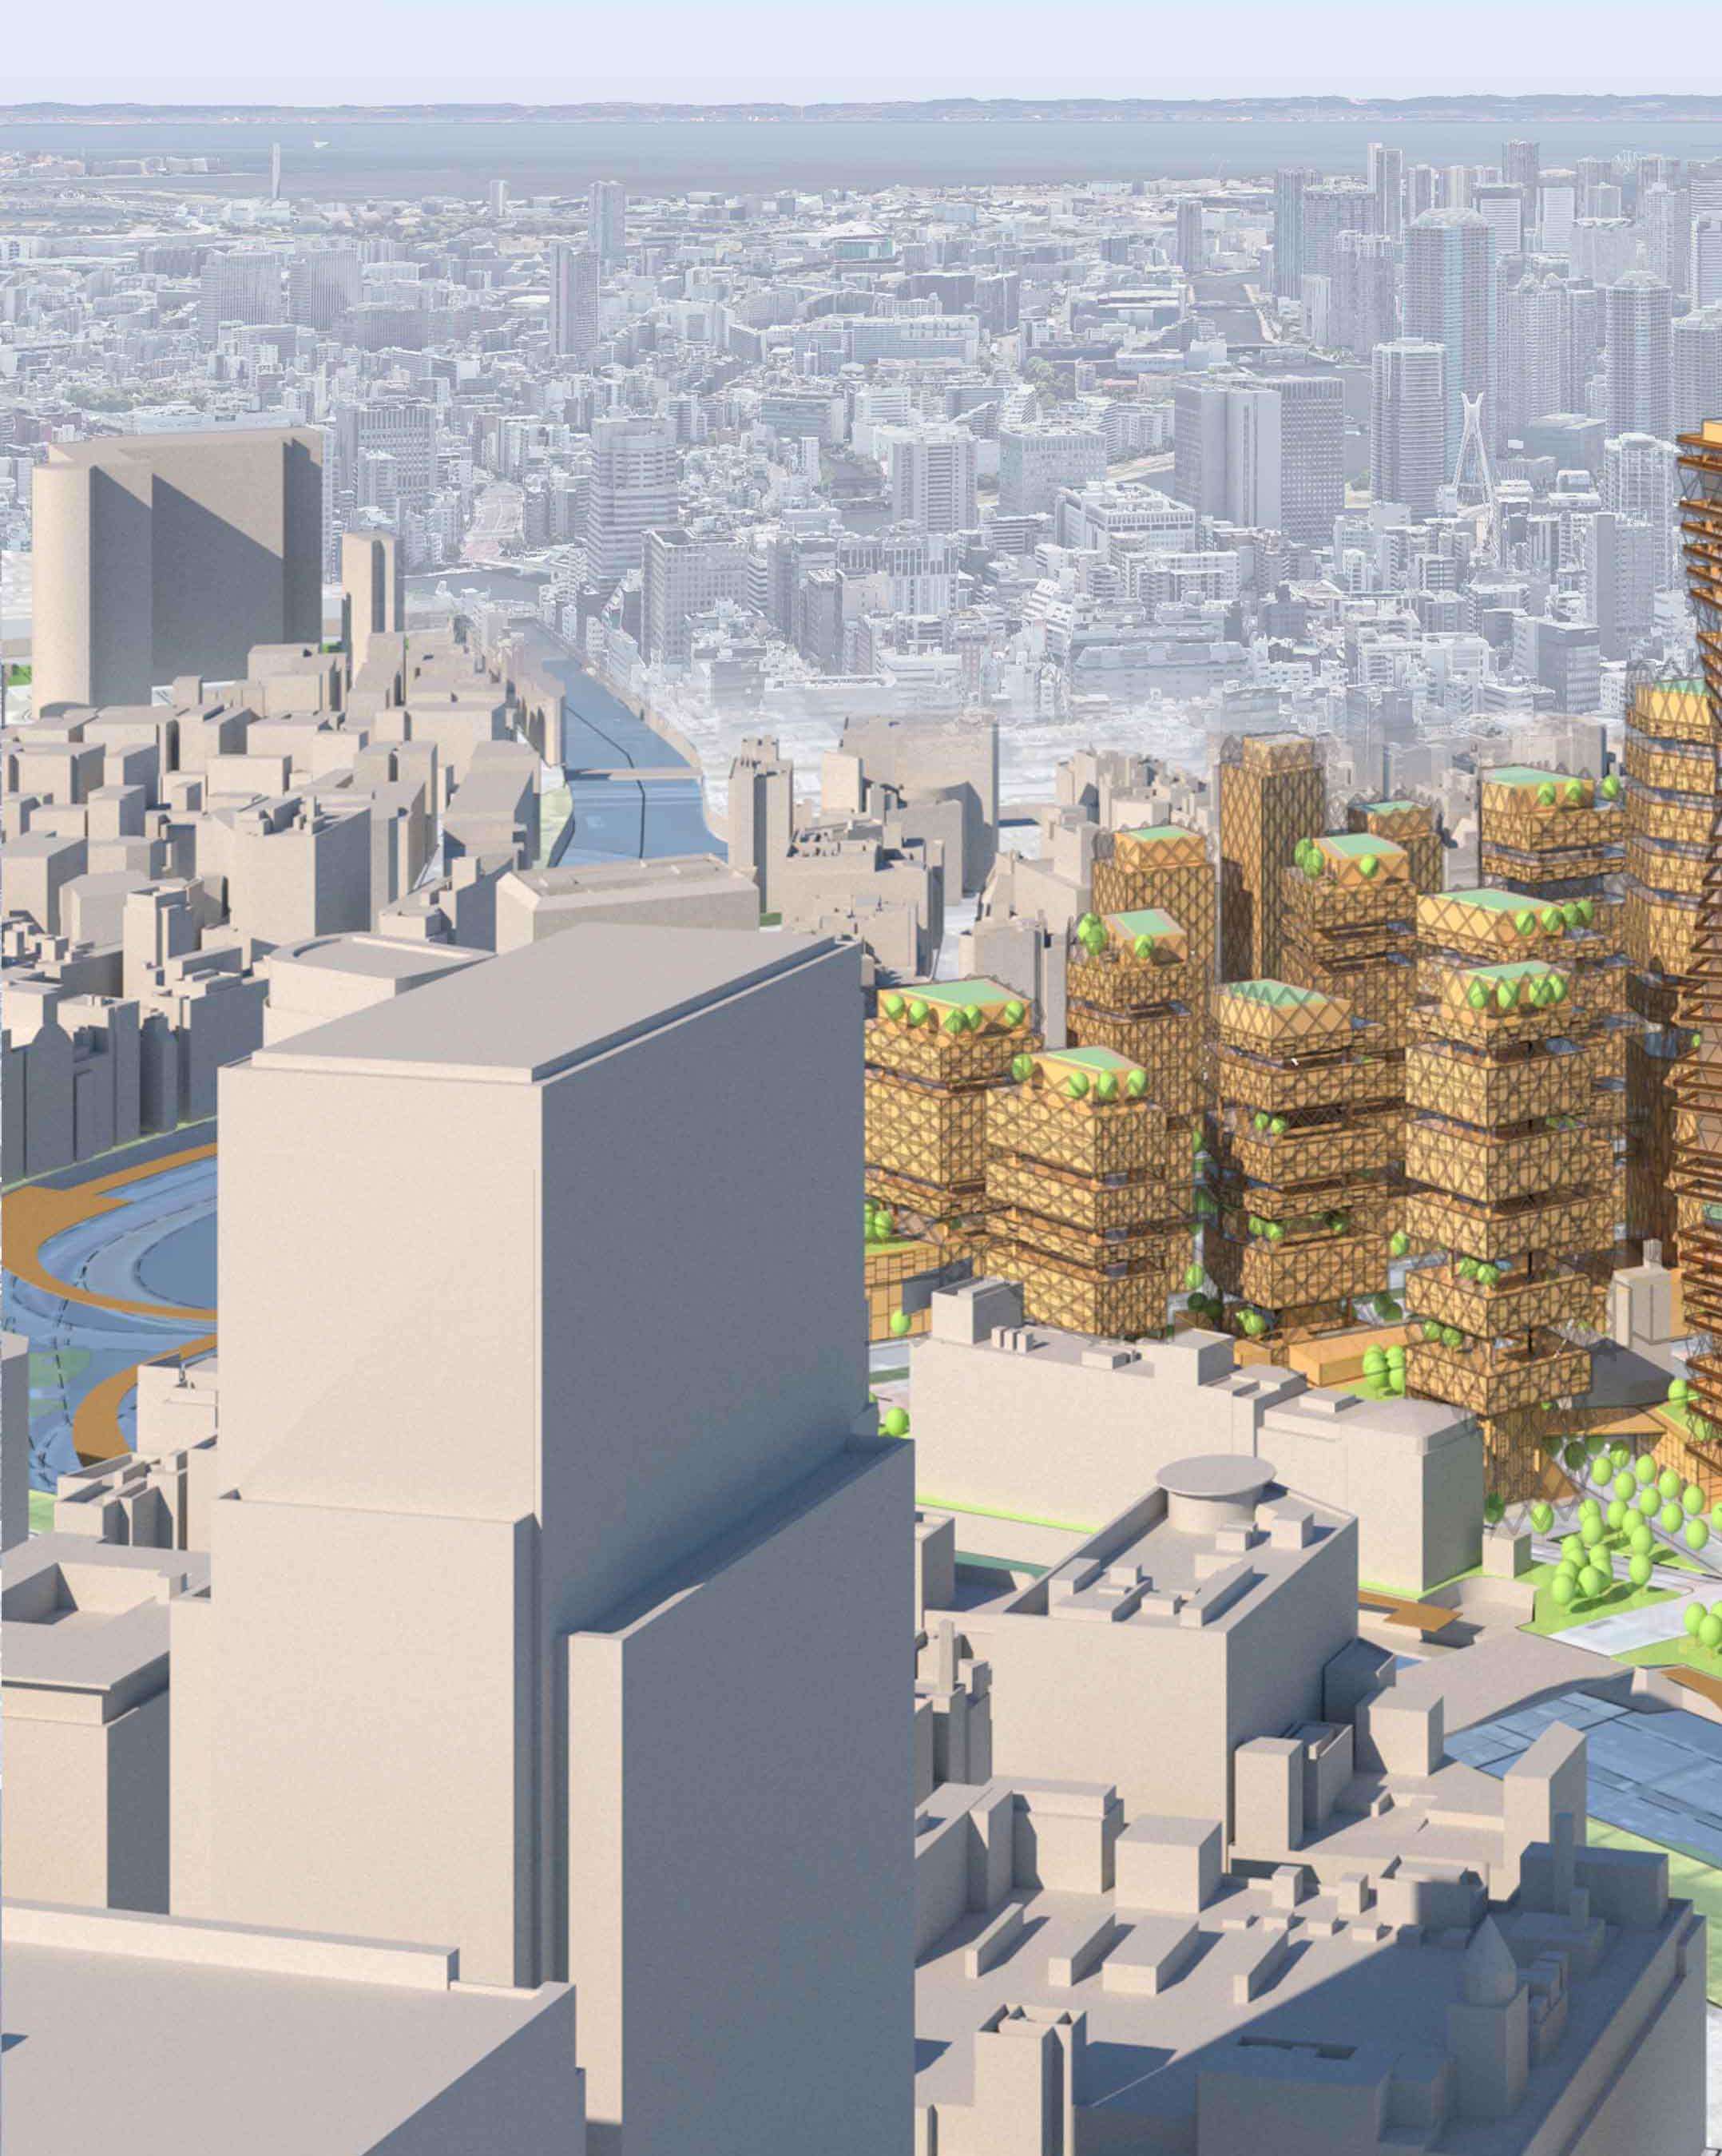
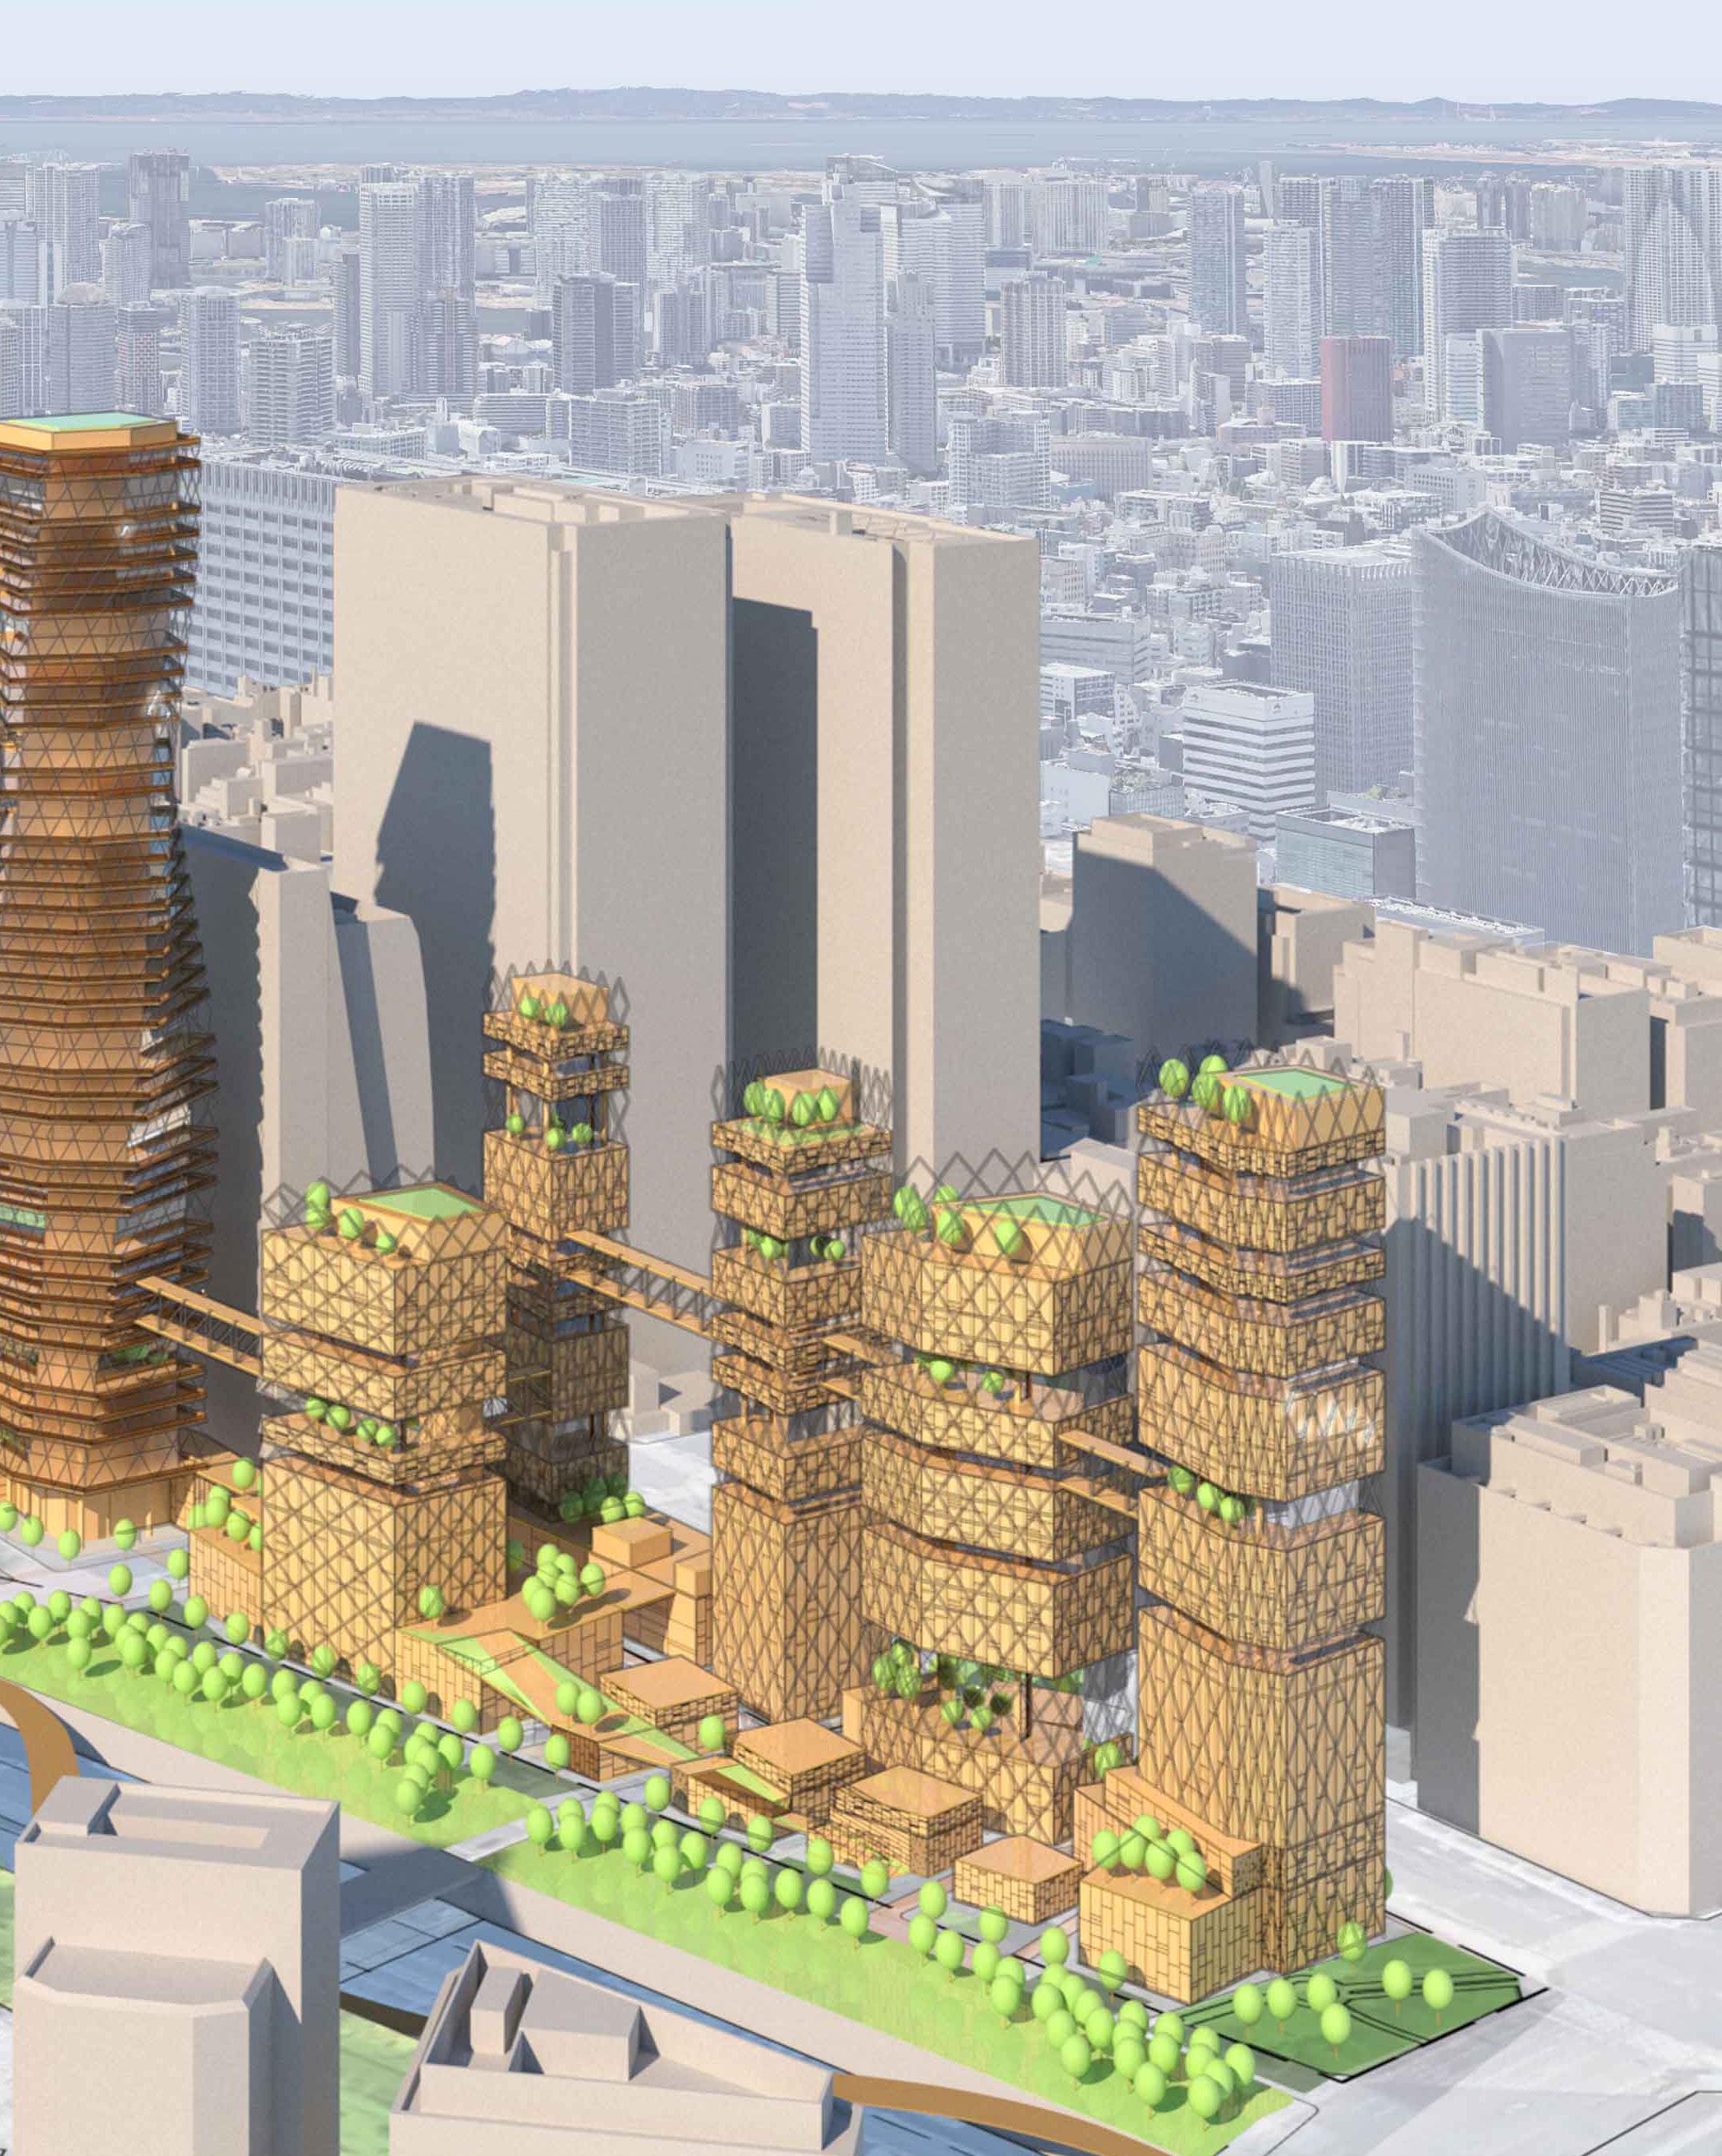
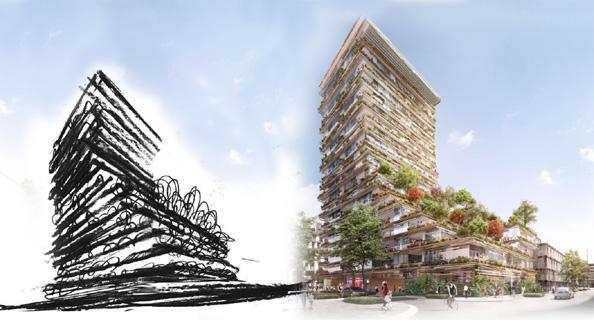
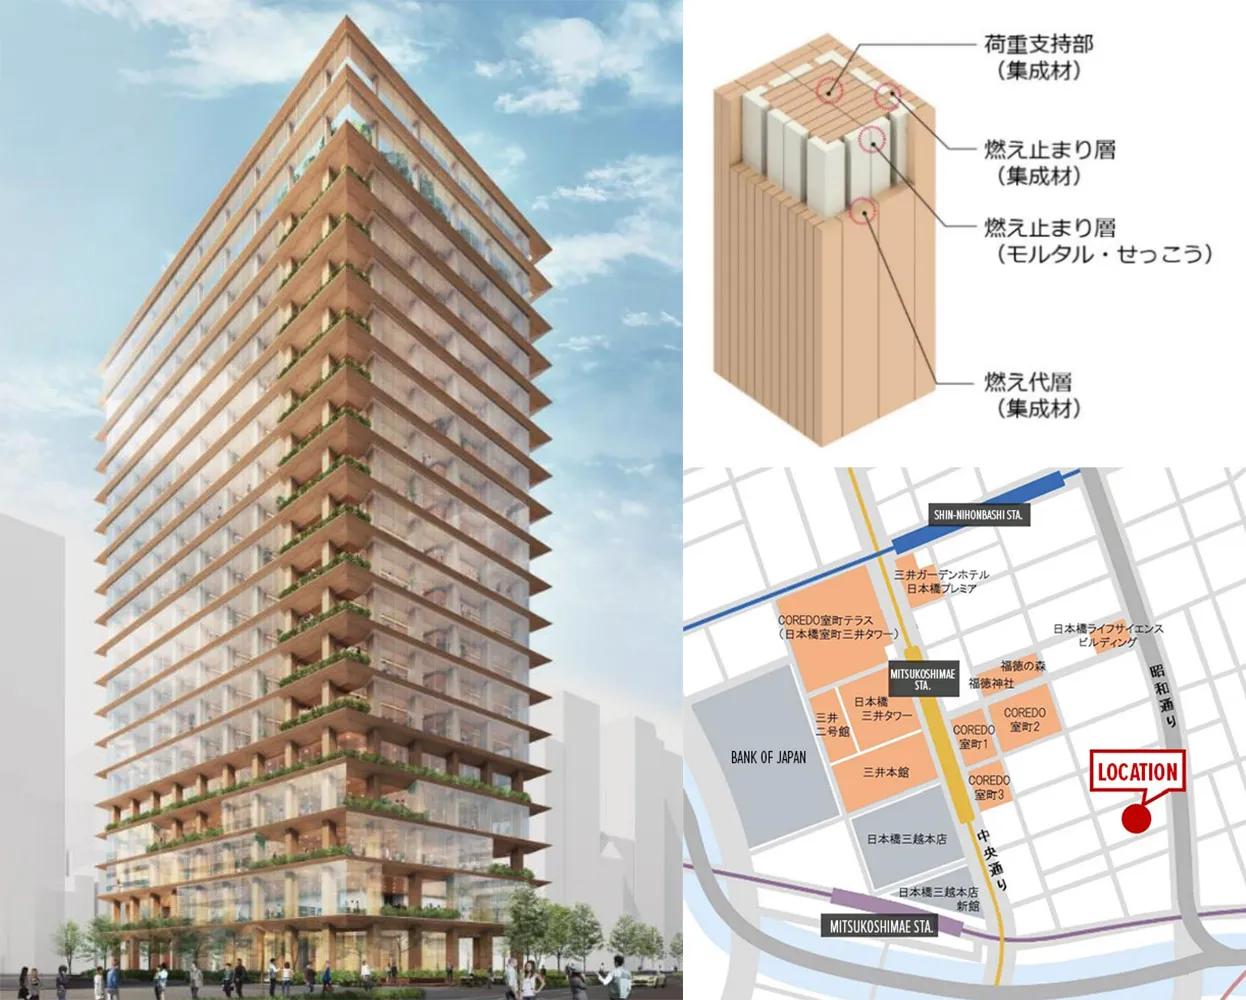
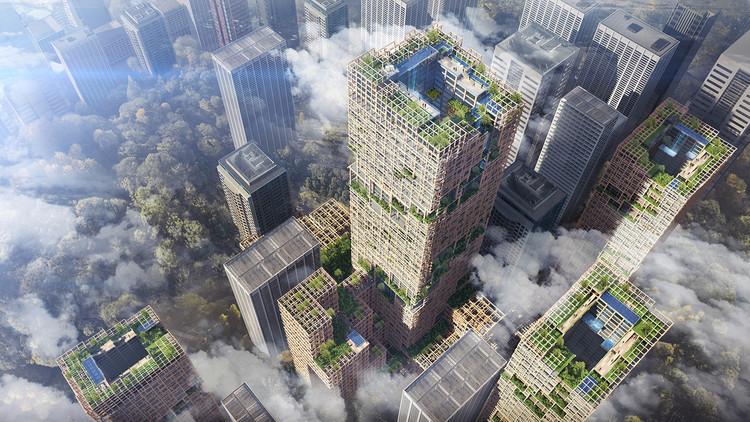
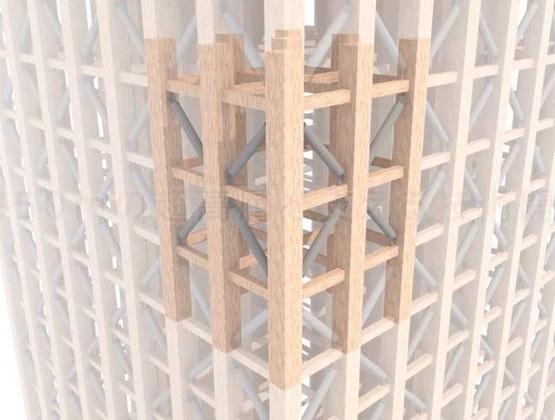
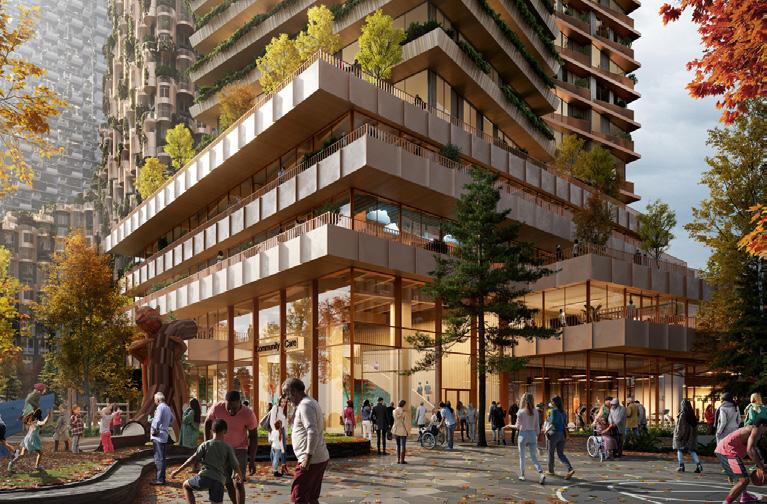
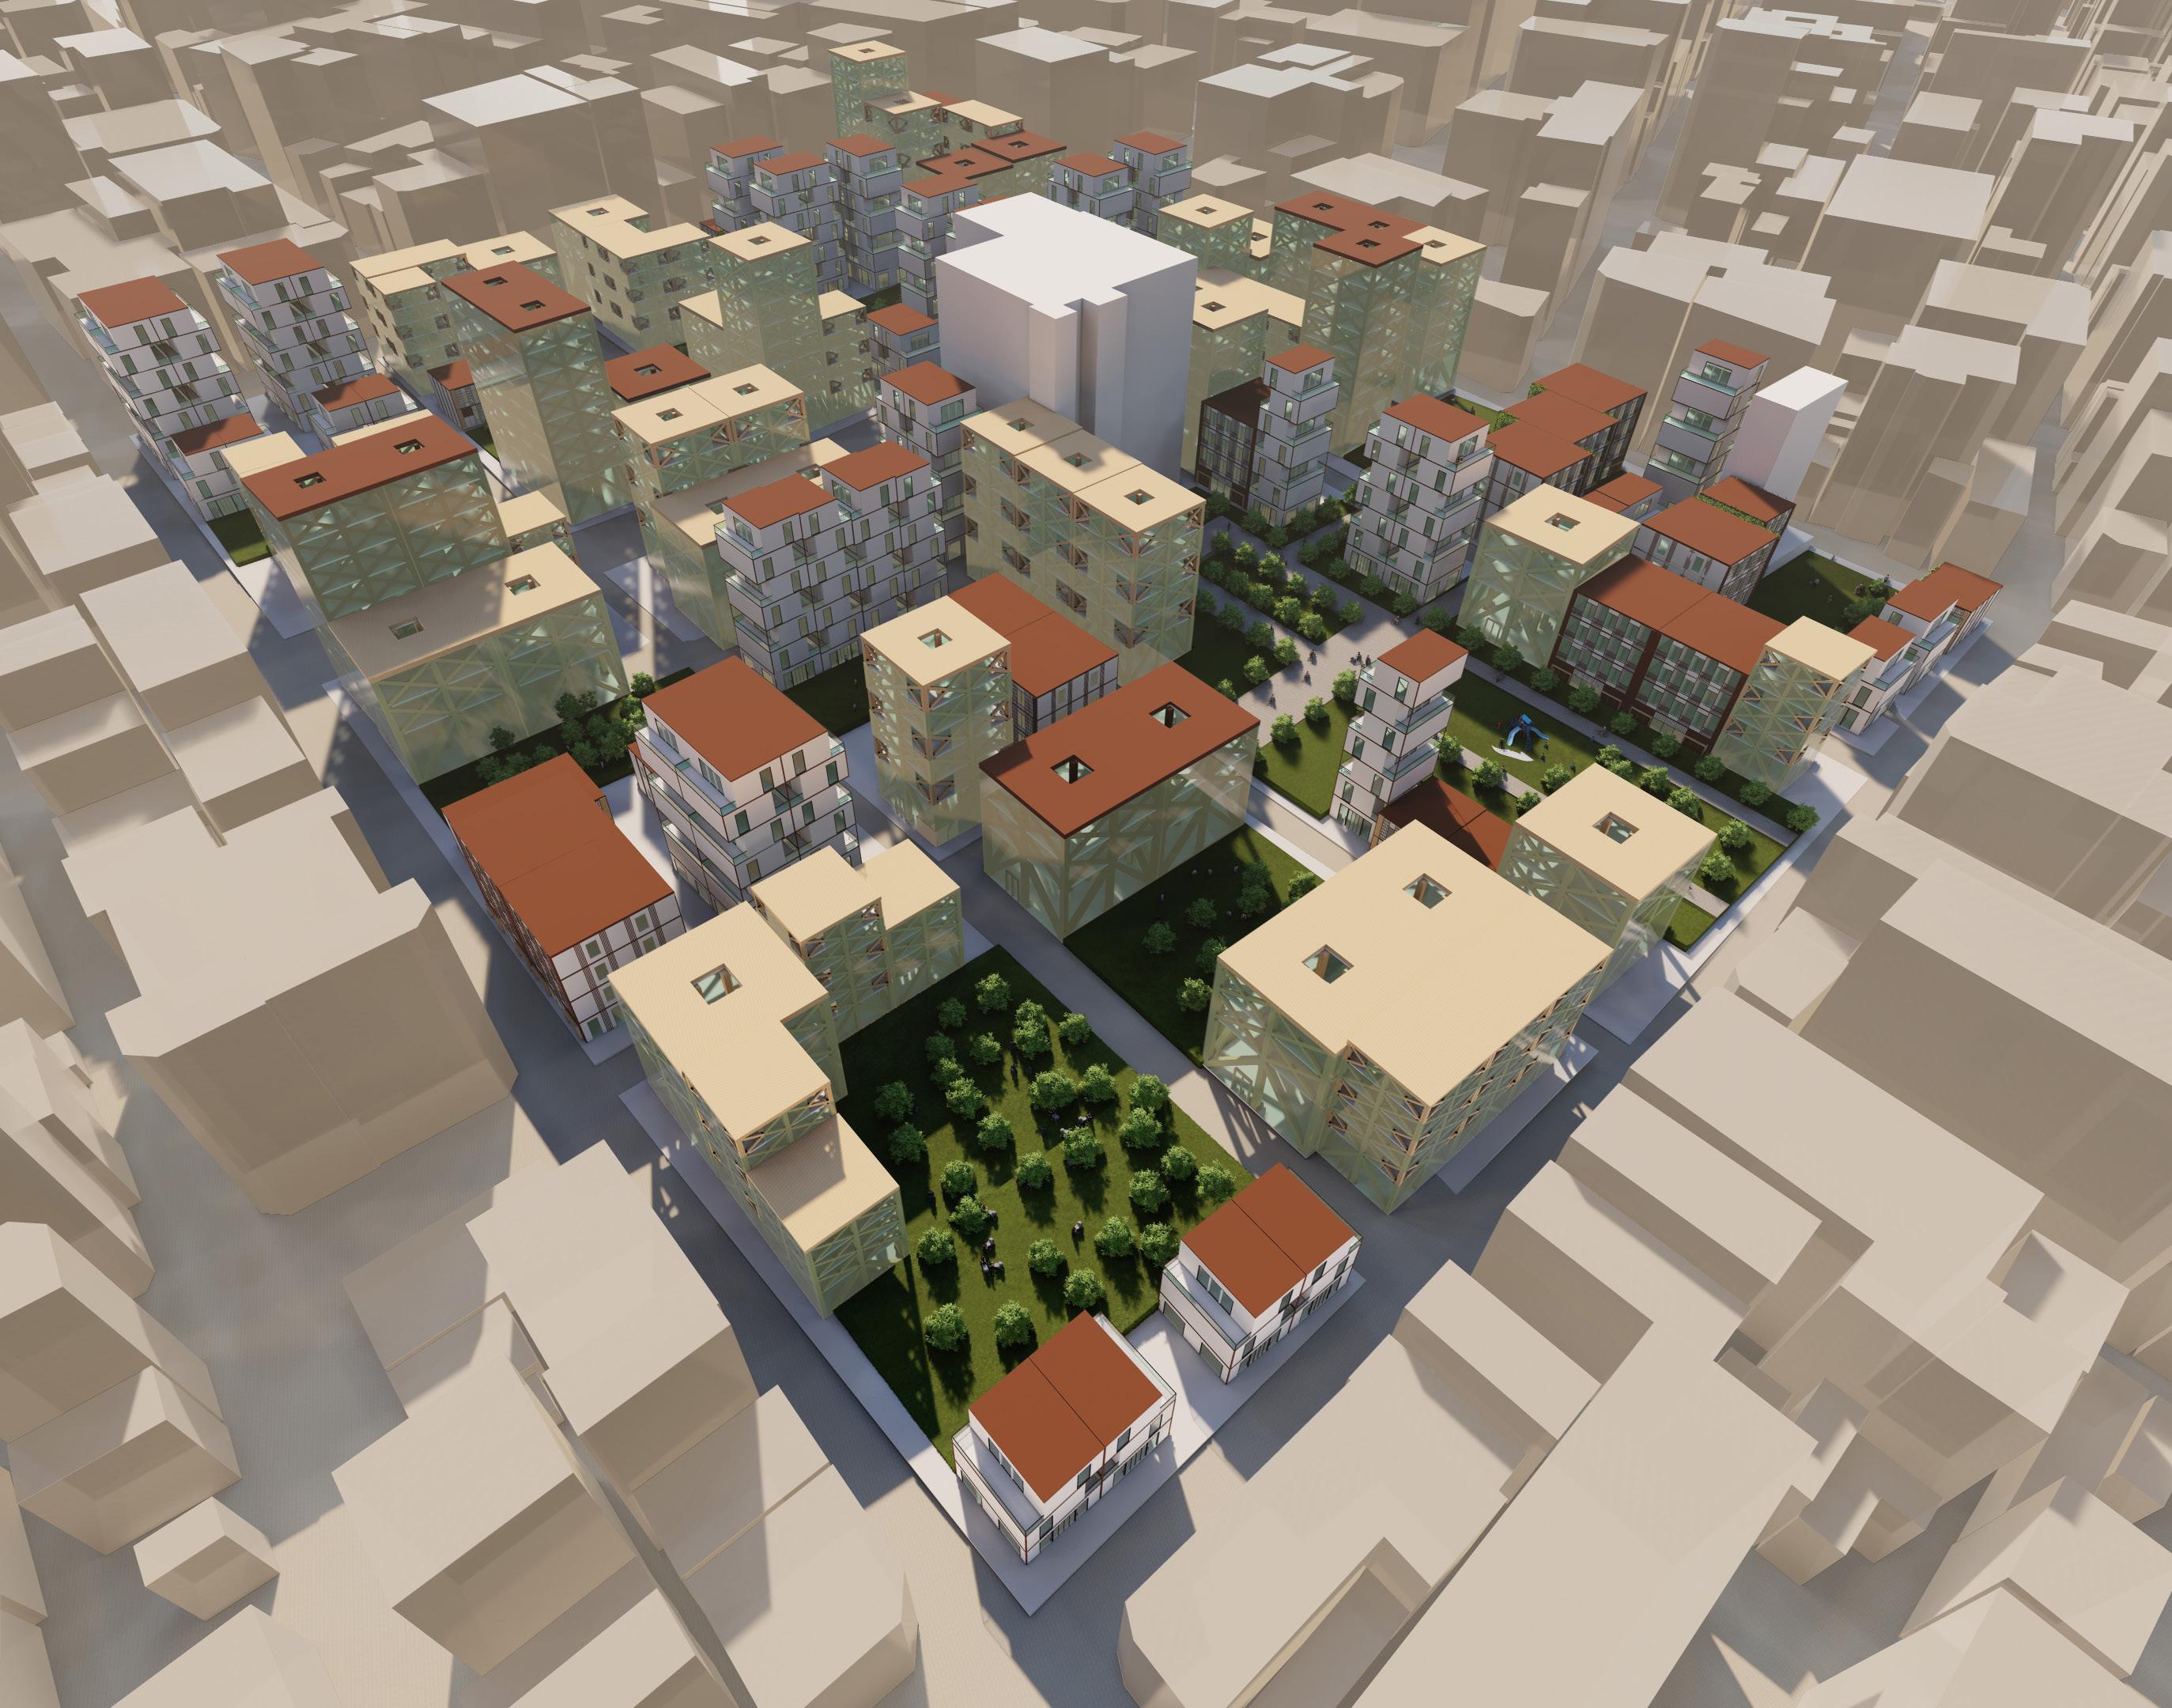
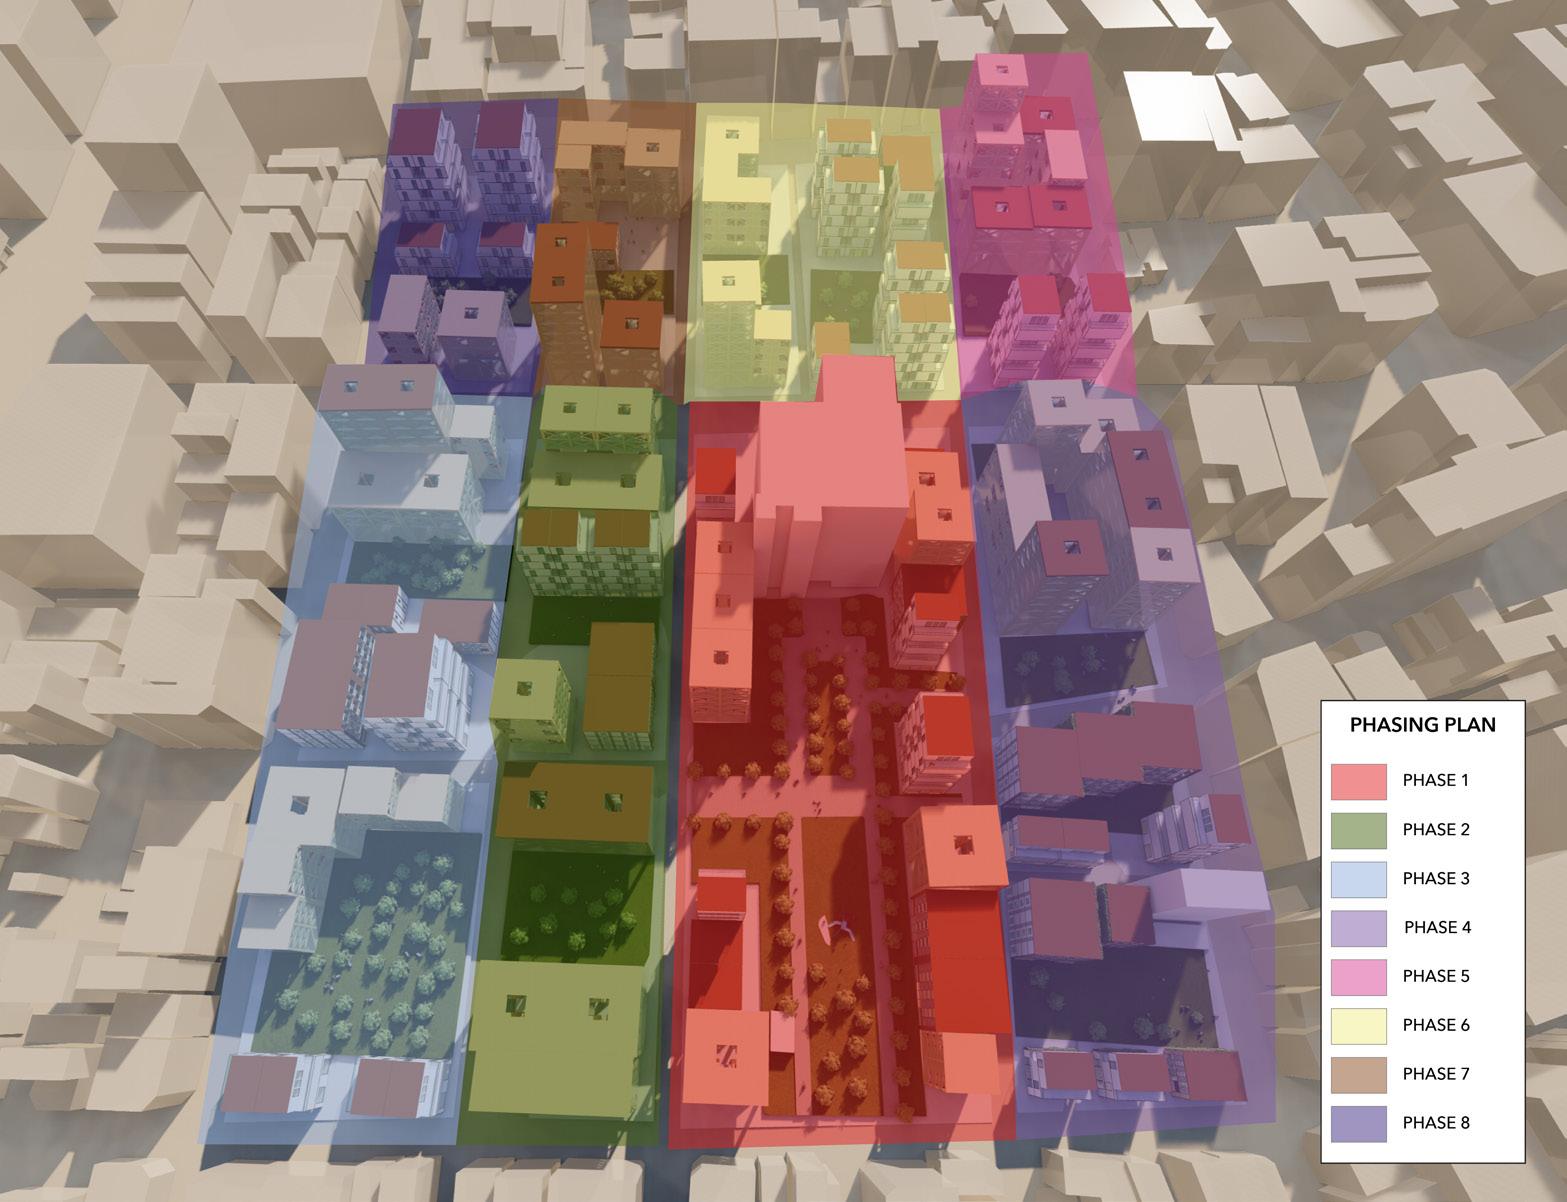
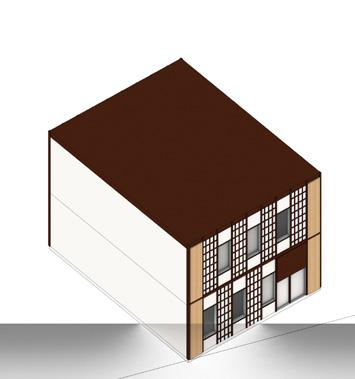
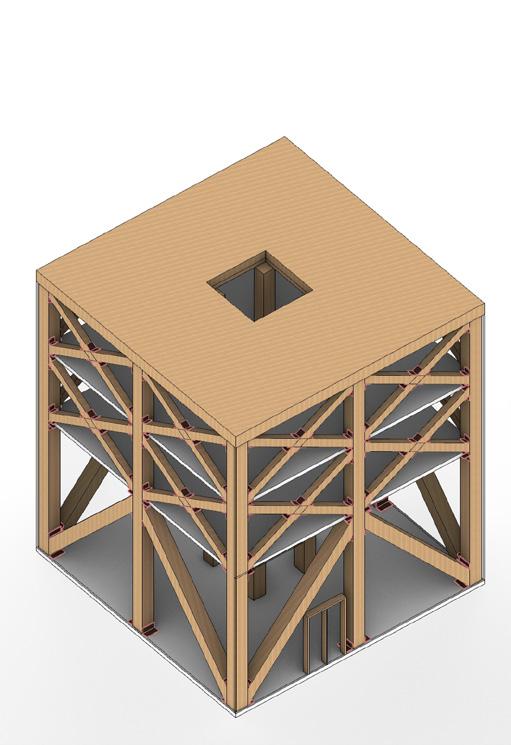
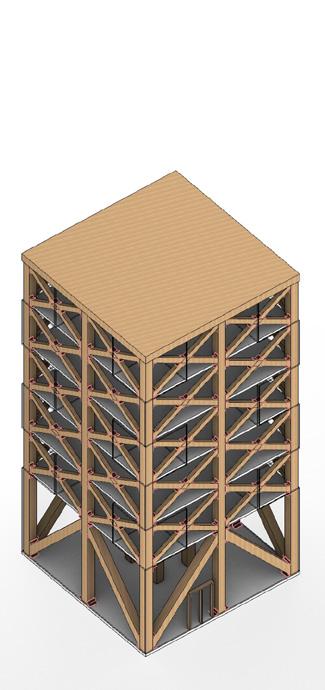
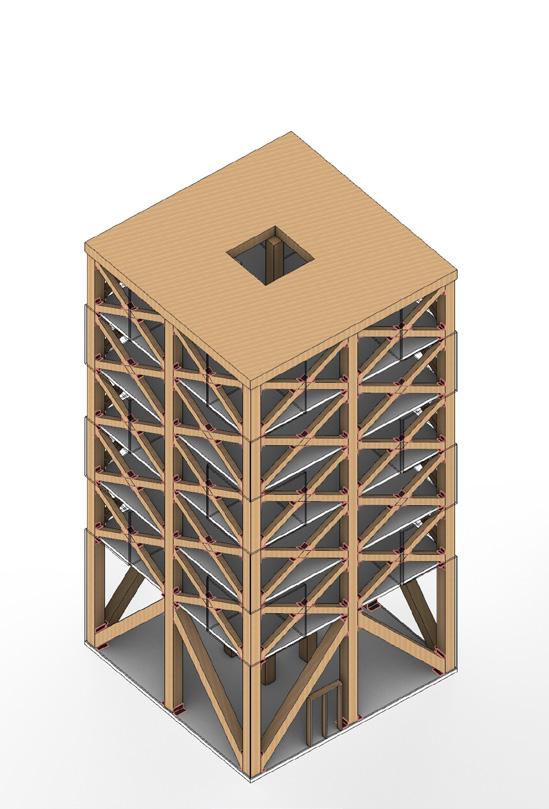
I propose an alternative timeline where Nihonbashi is redeveloped in a manner that preserves the historic street networks, captures and negates carbon emissions, and creates a livable neighborhood for the people of Tokyo. Hybrid timber towers are already under development in Tokyo and offer a strategy to capture carbon, while integrating the district with other sustainable strategies. Thinner, residential towers, integrated into pedestrian alleys and parks, can add street life and residents to this waterfront district. Office and commercial space can be integrated into the podiums and also withing “work-from-home” spaces within the towers.
Nihonbashi and Japan deserve a new way of thinking to address the challenges that lie ahead in a rapidly changing world.

History & Proposed Plans:
Historic Grid: Retained for Centuries (1892 Map)
Existing Conditions: A Network of Historic Alleyways
Proposed Plan: Save the Grid!
Current Timeline: Consuming the Grid

Pedestrian Realm: Multiple Levels
FAR / Density: Thinner Timber Towers
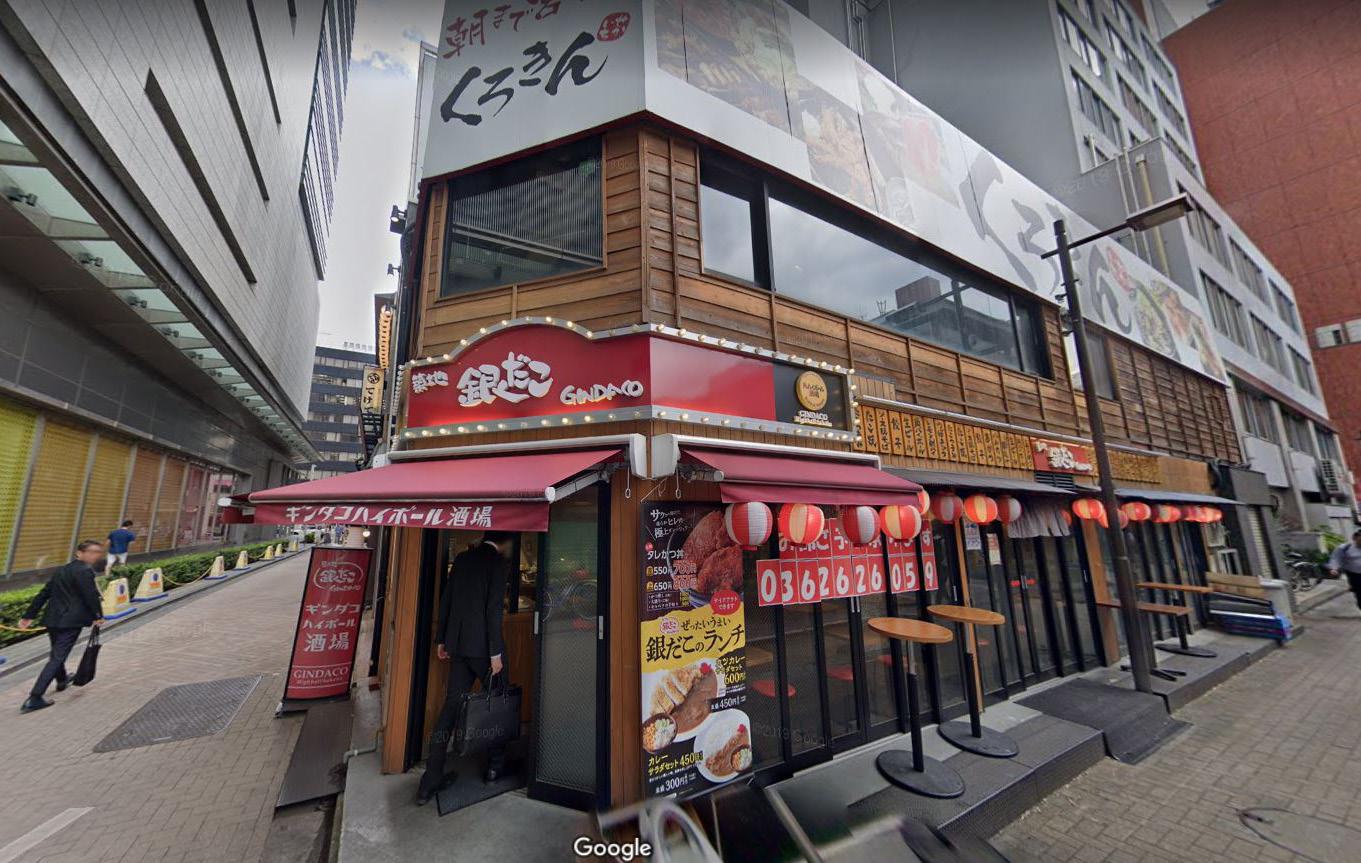
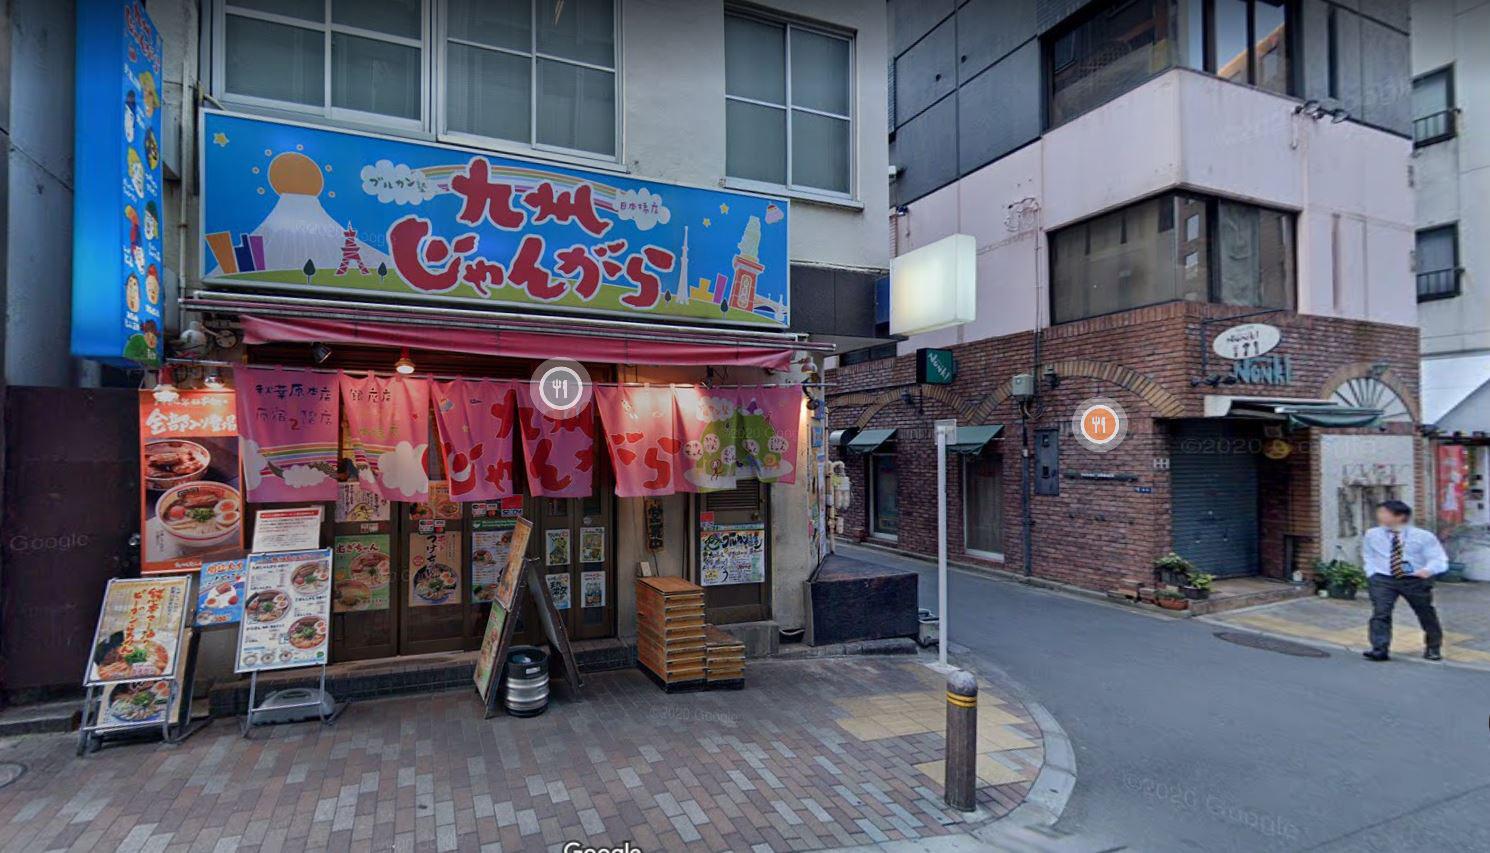
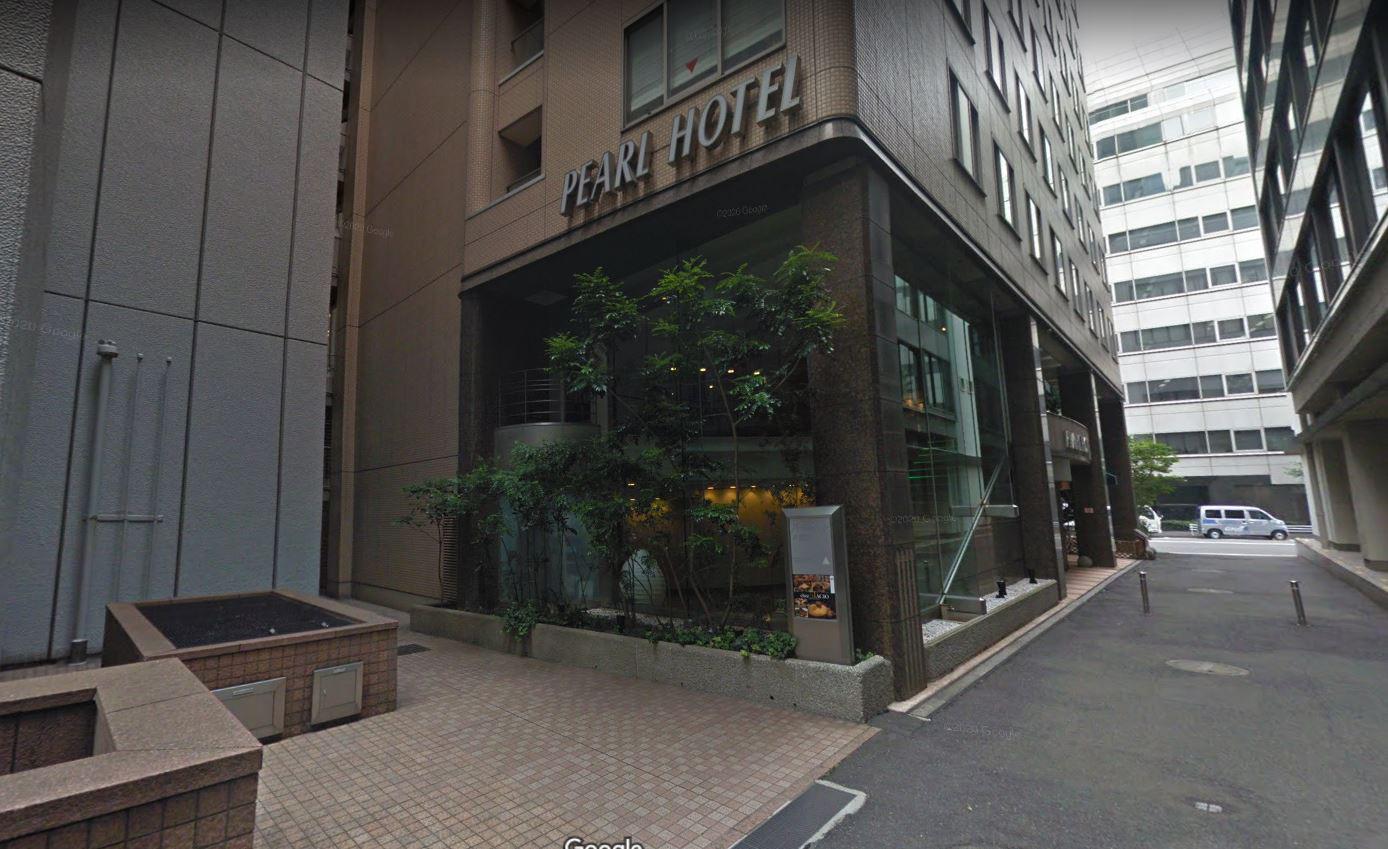
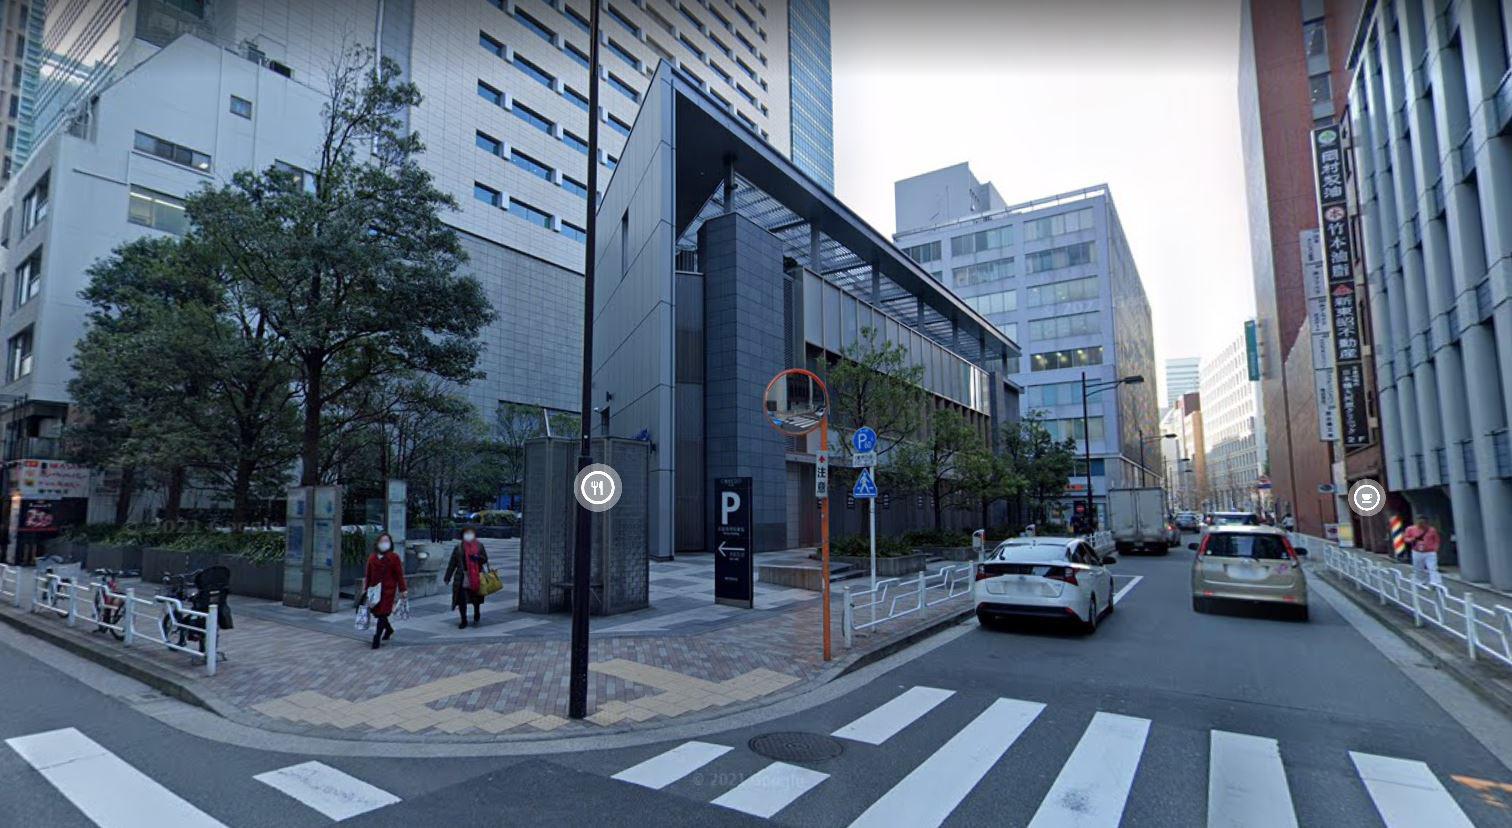
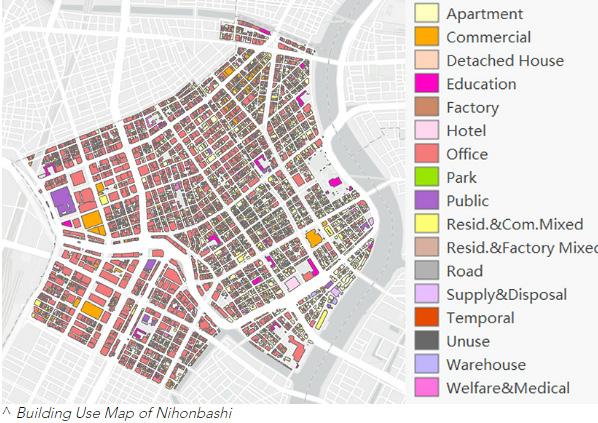
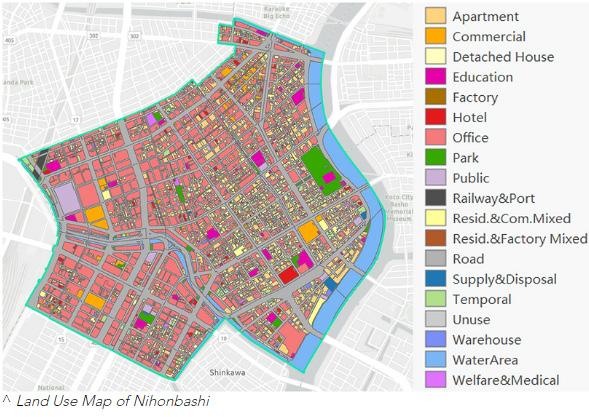
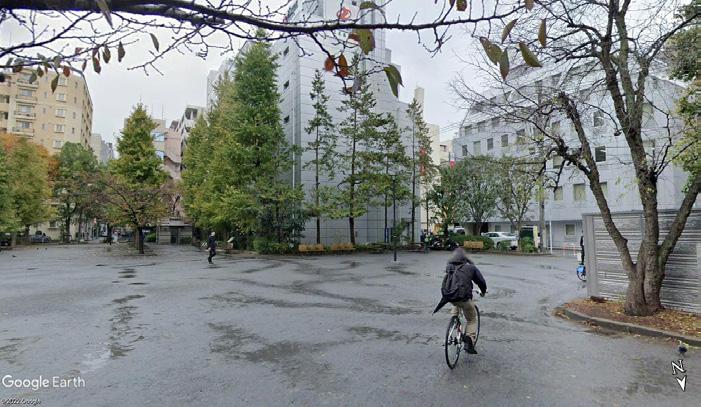
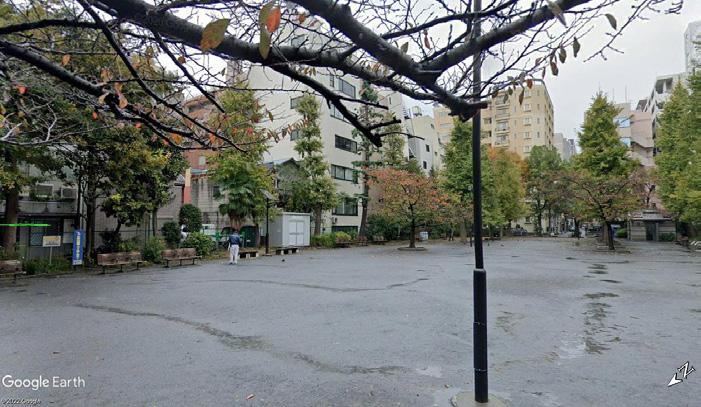
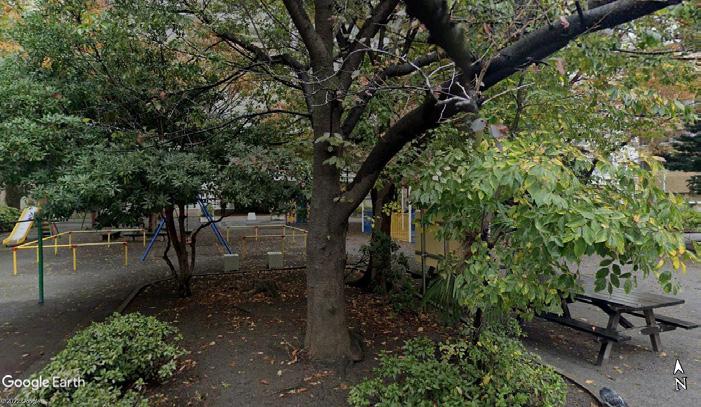
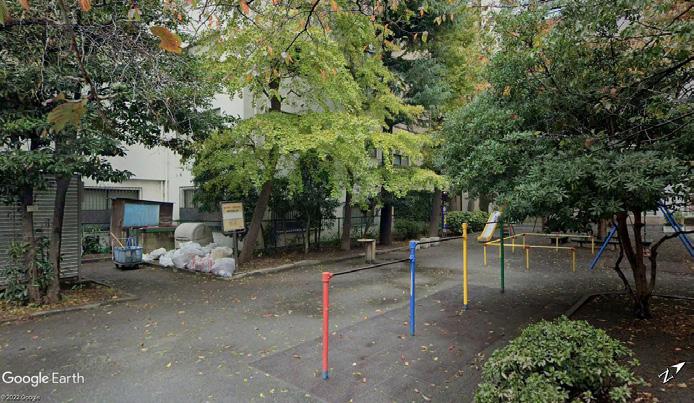
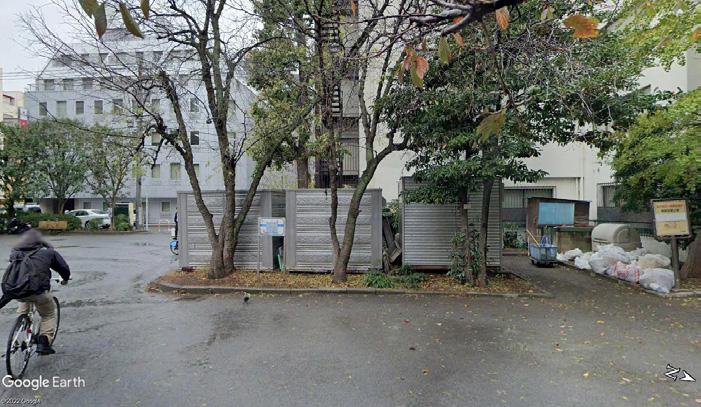
The above images from Google Earth Street View show pictures of historic alleyways (and their businesses). These alleyways are now gone - under construction for new officefocused mega-development has wiped away these historic streets. The streets are the only memory of this historic center of Japan. Real estate owners should understand the importance of being a steward for the area - they should preserve the historic grid, the soul of Nihonbashi, and develop buildings that respect history while building in a more sustainable manner.
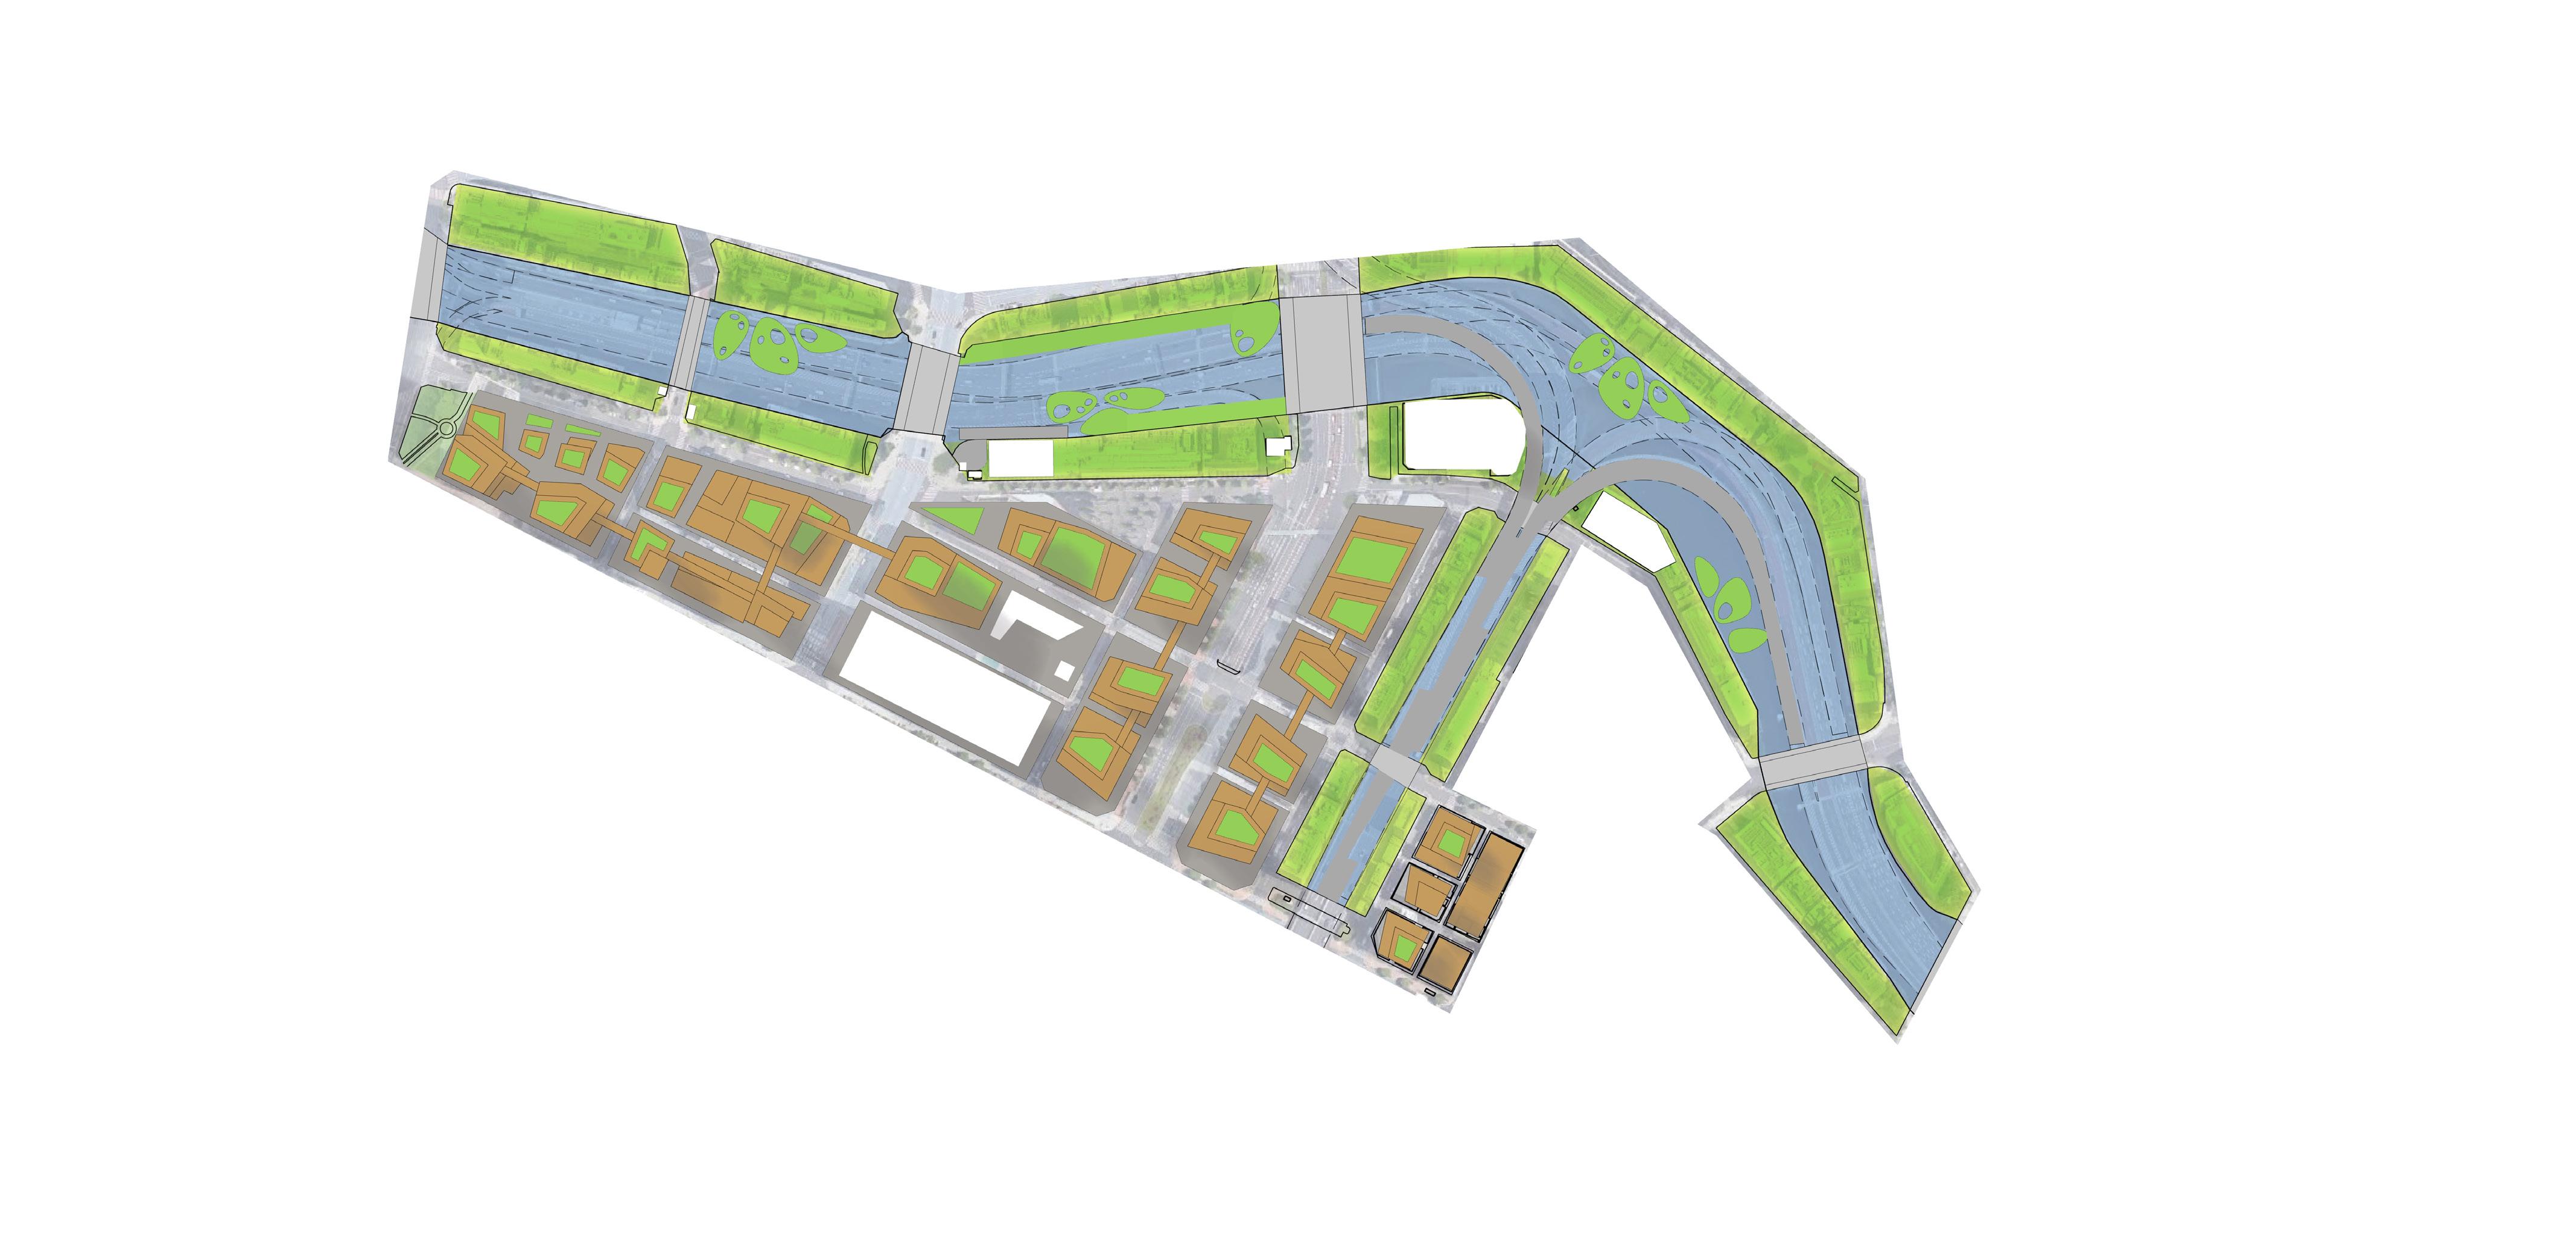
ILLUSTRATIVE SITE PLAN: PROTECT THE SOUL OF NIHONBASHI & THE FUTURE OF THE PLANET

RETAIL ALLEYS VERTICAL PROMENADE
KABUTO SHRINE


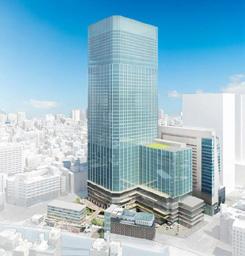
 NIHONBASHI BRIDGE 1-Chome Central (Under Construction)
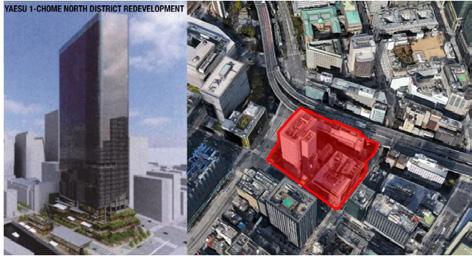
Yaesu 1-Chome North (Under Construction)
NIHONBASHI BRIDGE 1-Chome Central (Under Construction)
Yaesu 1-Chome North (Under Construction)
ALTERNATIVE TIMELINE
1-Chome Central (Under Construction)
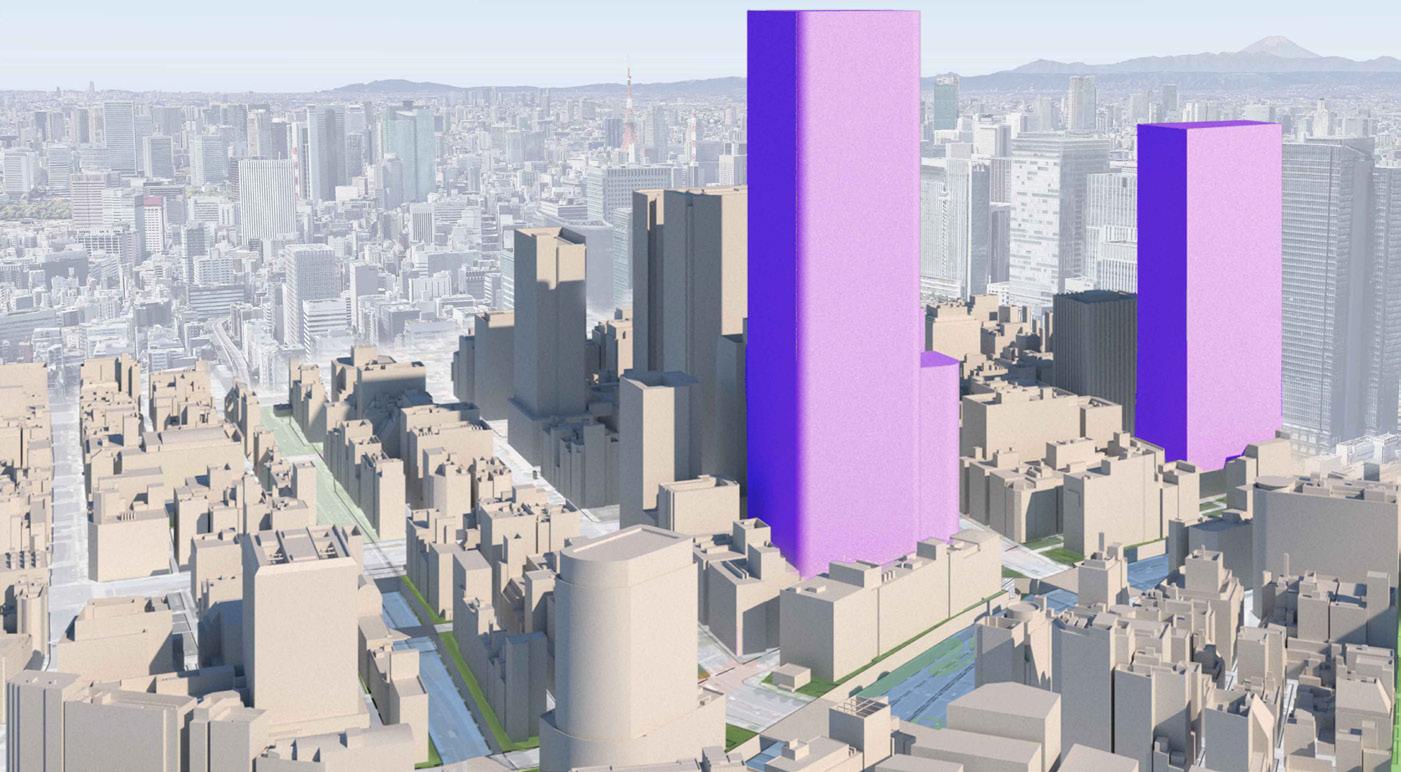
CURRENT TIMELINE
Yaesu 1-Chome North (Under Construction)
Master Plan Strategies:
BUILDING AIRFLOW
HISTORIC CANALS
HISTORIC GRID
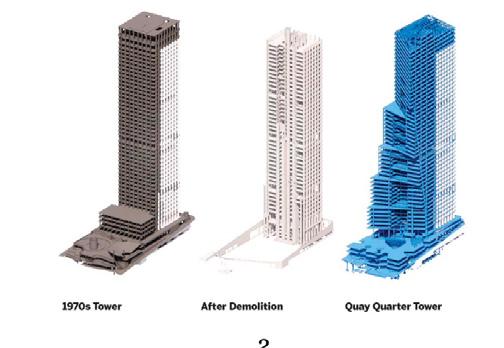
Sydney, 3XN’s 50-story Quay Quarter Tower (1) incorporates a 45-story 1970s office tower (2)
Privacy & Cookies: This site uses cookies. By continuing to use this website, you agree to their use. To �nd out more, including how to control cookies, see here: Cookie Policy
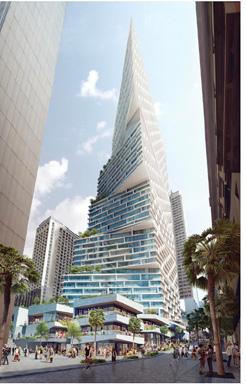
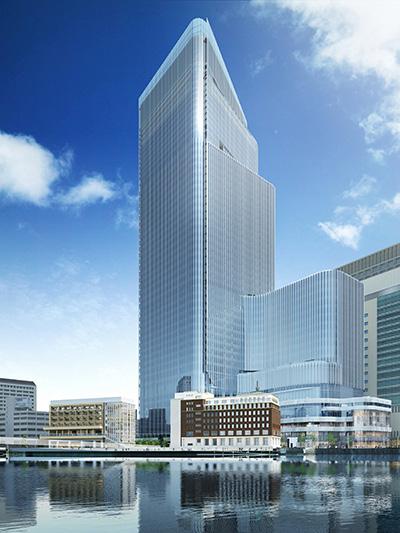
Mitsui Fudosan and Takenaka Corporation are planning to build a 17story wood-frame o�ce tower in Tokyo’s Nihonbashi district. With a proposed height of 70 meters, this would be the tallest wooden building in Japan.
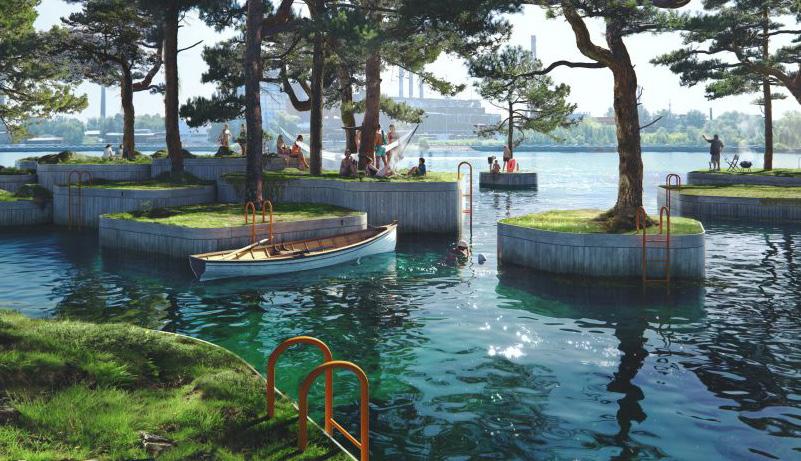
Restore waterfront, provide new permeable open spaces and new waterfront habitats (Copenhagen Floating Islands / Marshall Blecher Studio Fokstrot)
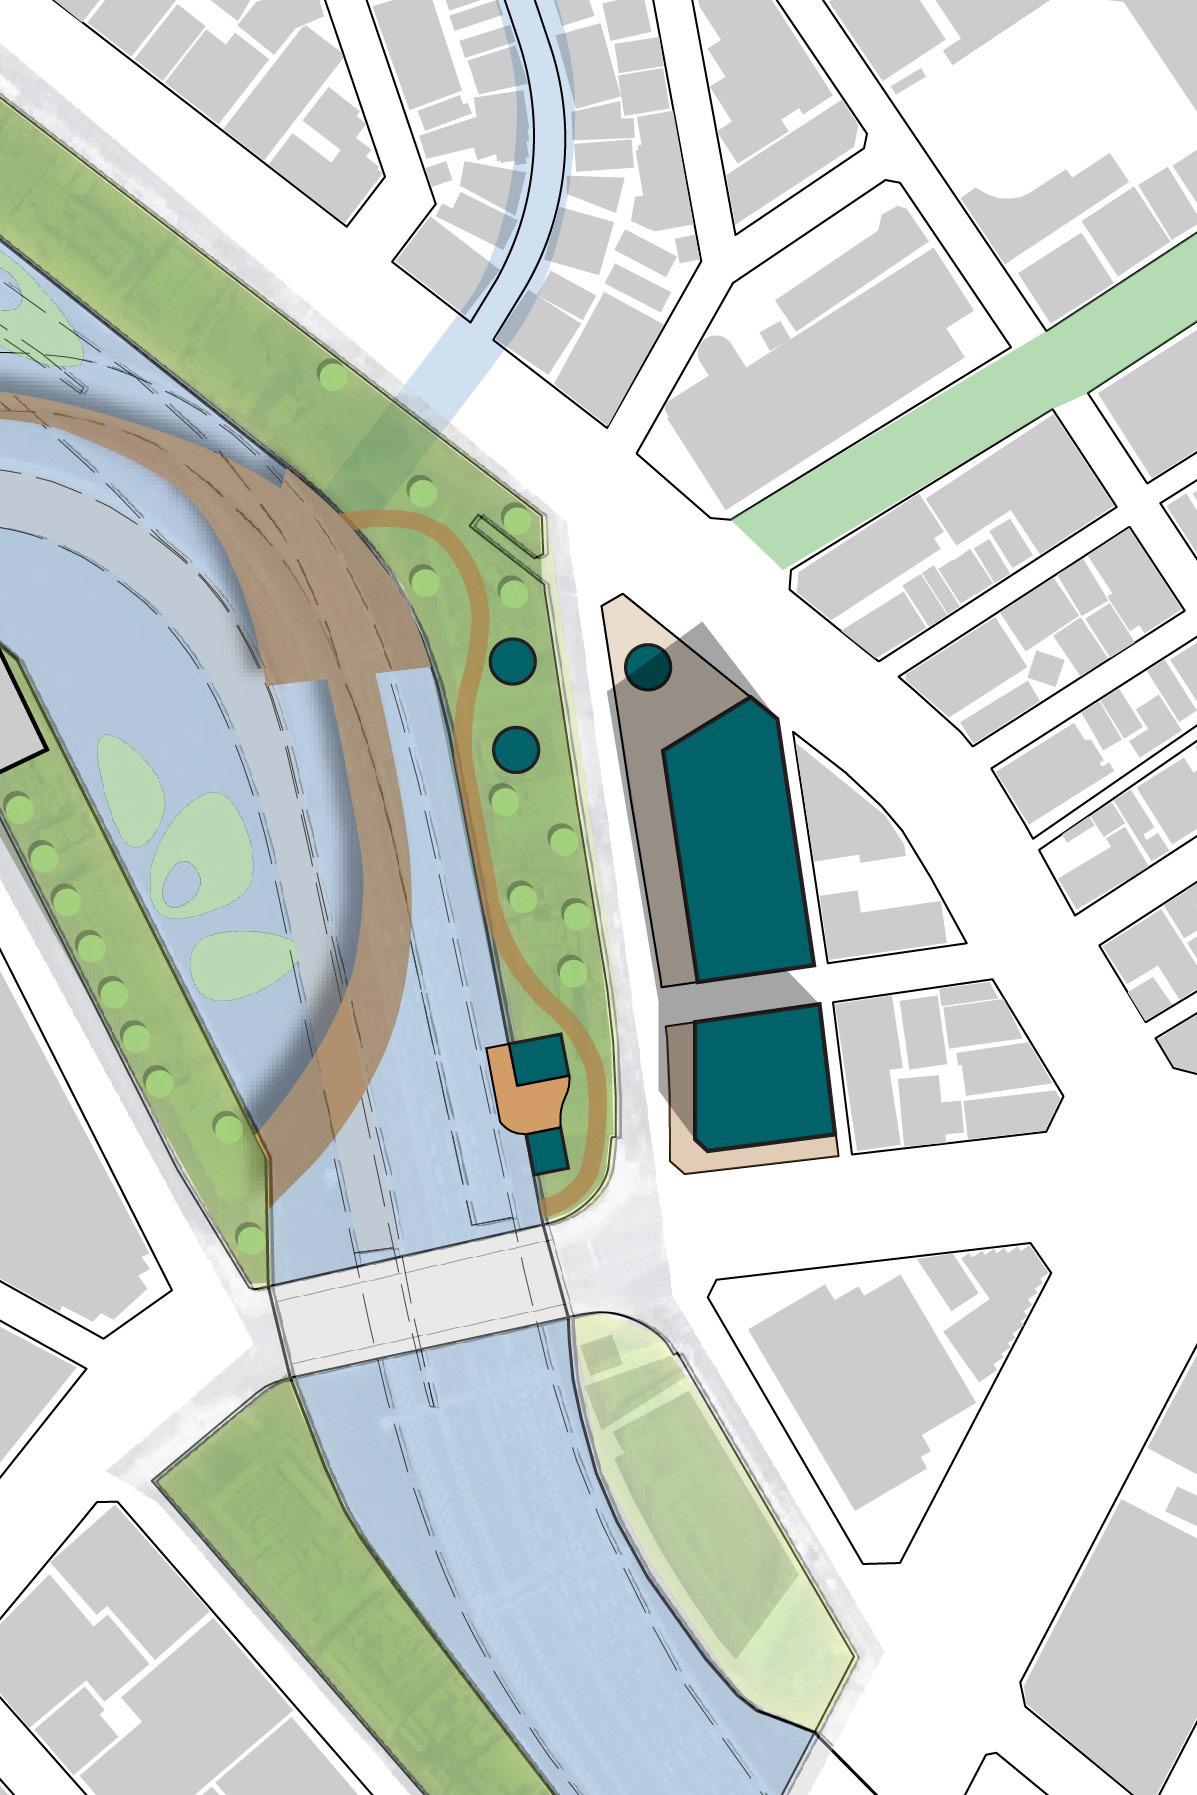
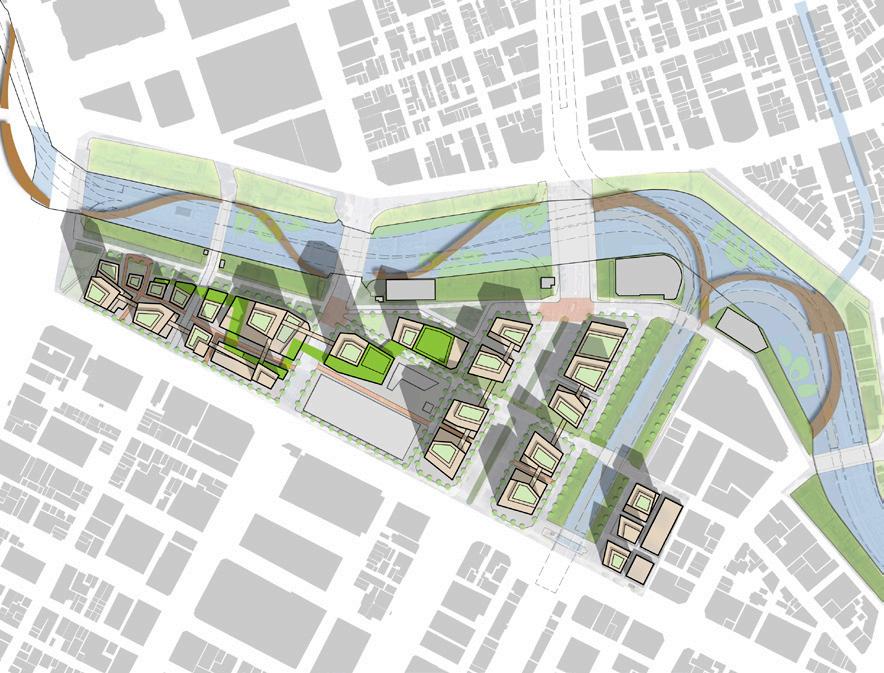
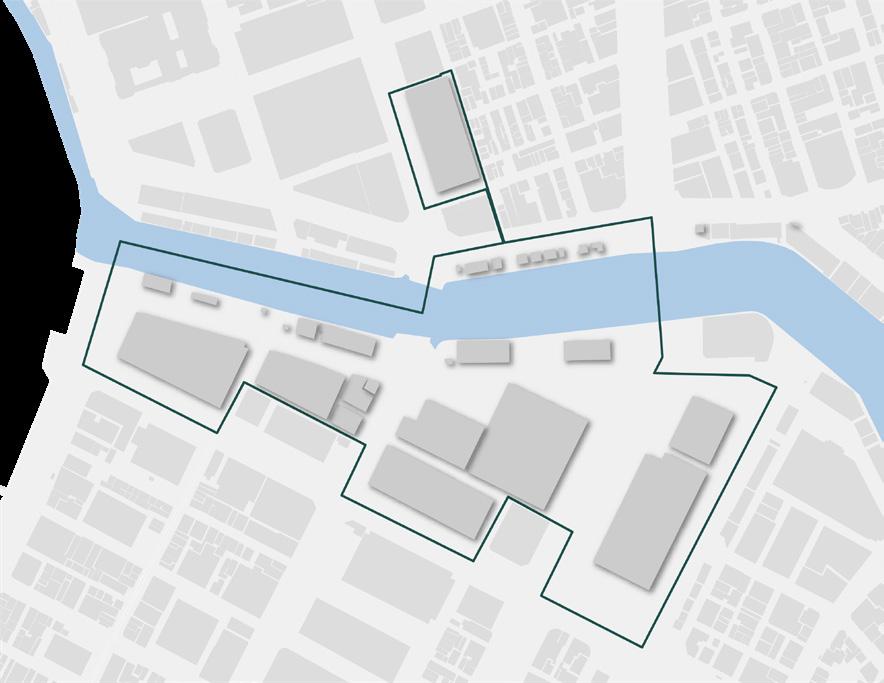
The Nihonbashi Micro-mobility Hub is a proposal to activate the Nihonbashi Waterfront while cnouraging safe cycling and providing a vision for future waterfront development. By removing existing river-side buildings and replacing them with higher density high-rise buildings above the commercial levels of the Micromobility Hub, we are able to make space for public use, health, and enjoyment. Finally, by creating spaces for micromobility usage, we will turn the Nihonbashi Waterfront into a safe, healthy, and environmentally friendly place for Tokyo citizens to enjoy the river.
“Image bumps” are 2D images of curbs, barriers, and other street features. They provide visual cues to drivers to slow down and make roads safer.
Shin-ohasi-dori: A 6-8 lane road with no cycling markings
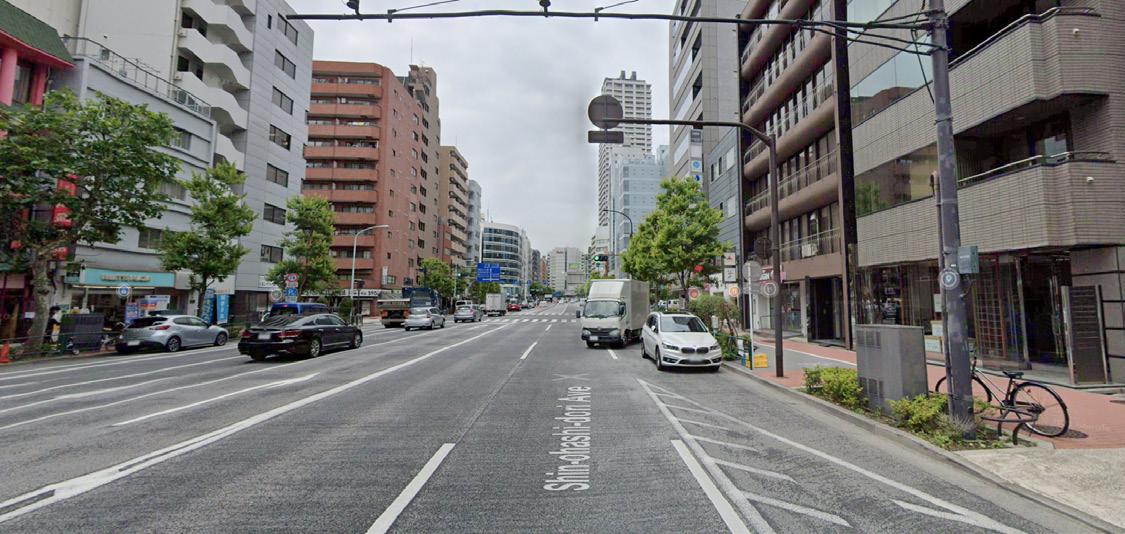
Encourages cyclists to use the sidewalk for transit
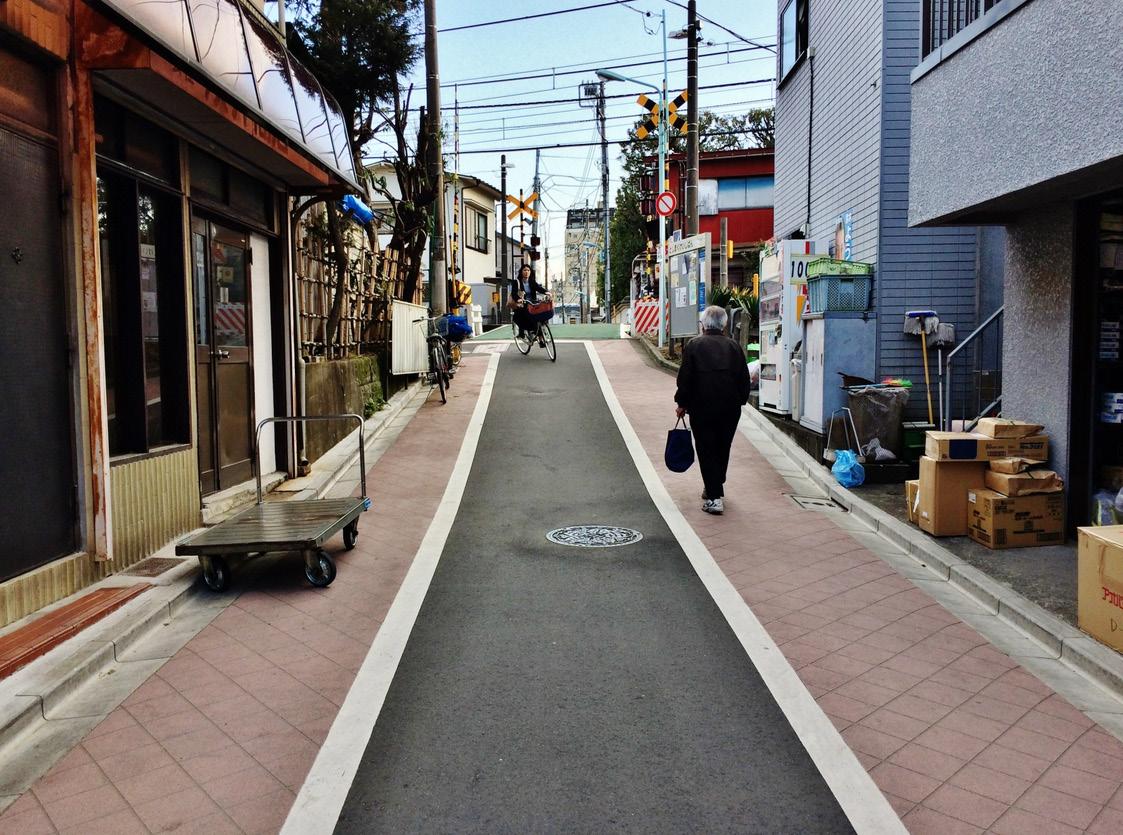
Visual sidewalks indicate a designated walking area and reinforce the idea that part of the road belongs to the pedestrian (or cyclist). See Typical interior block in Nihonbashi, left. These streets are calm, but have no formal hierarchy of use.
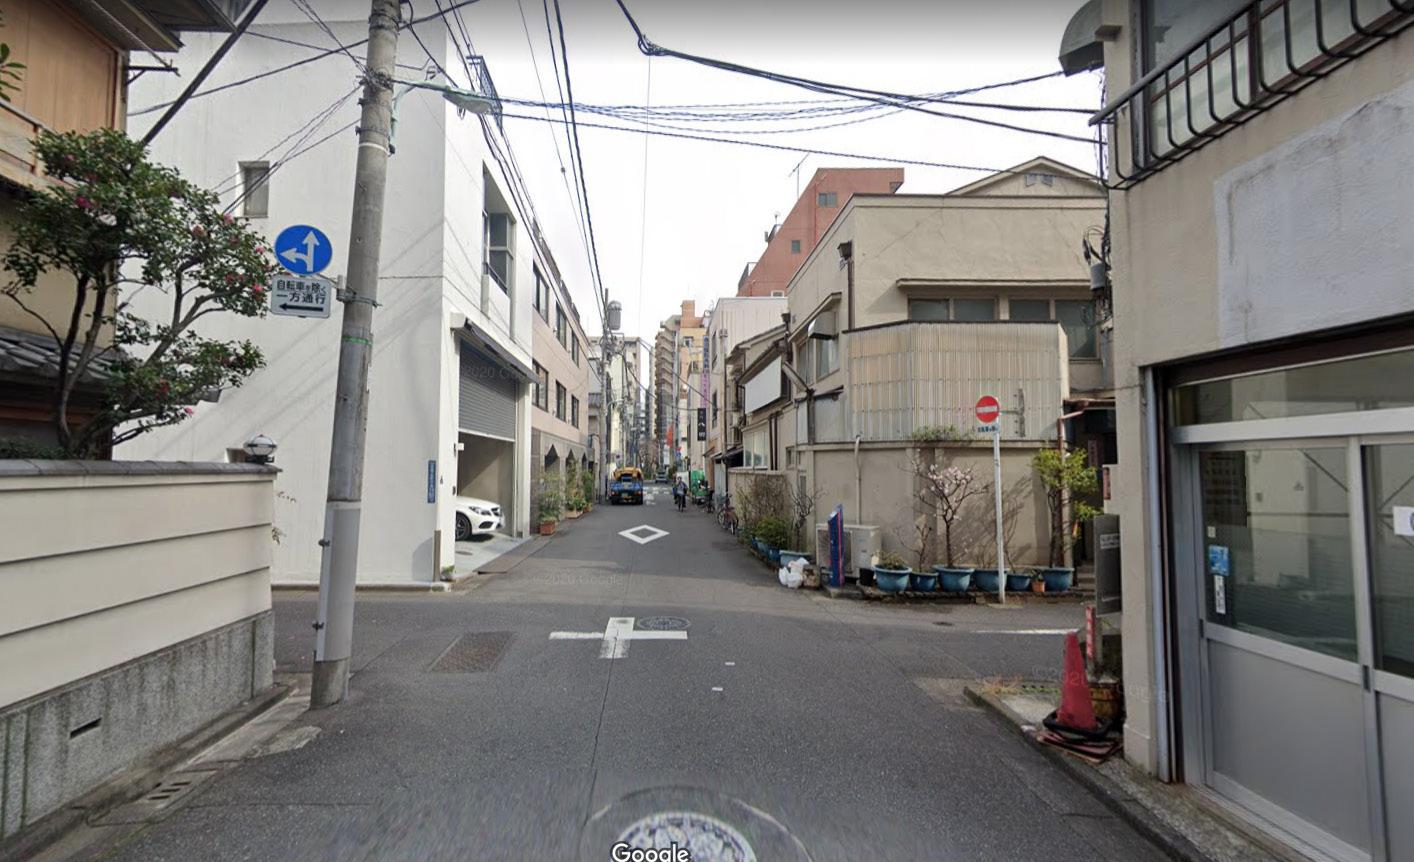
Amazakeyokocho: A 1-2 lane road with cycling markings
Markings are inconsisten, lanes are narrow Encourages cyclists to use the road for transit
Typical Block Interior: Slow traffic, no markings indicating where pedestrian, cyclist, or automotive traffic is meant to go. Further confuses the issue of the cyclists’ place on Tokyo roads
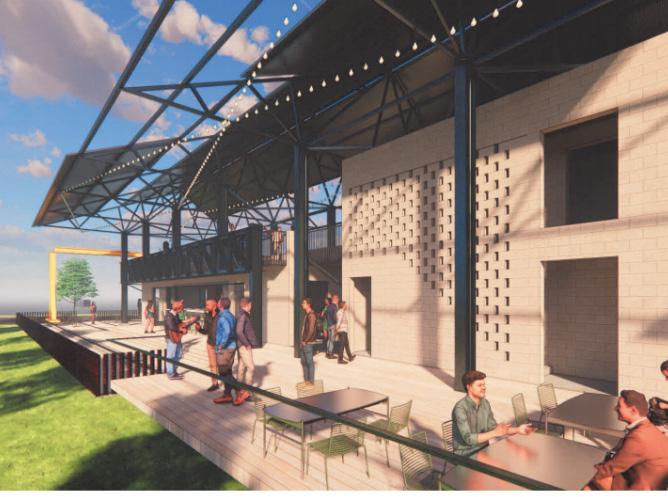
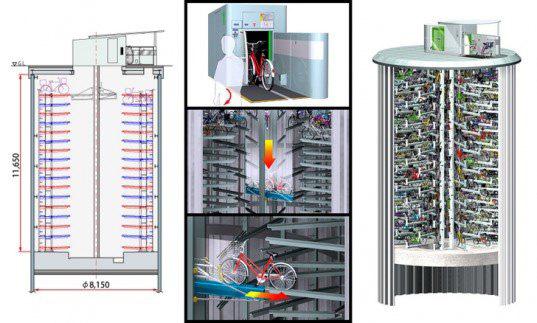
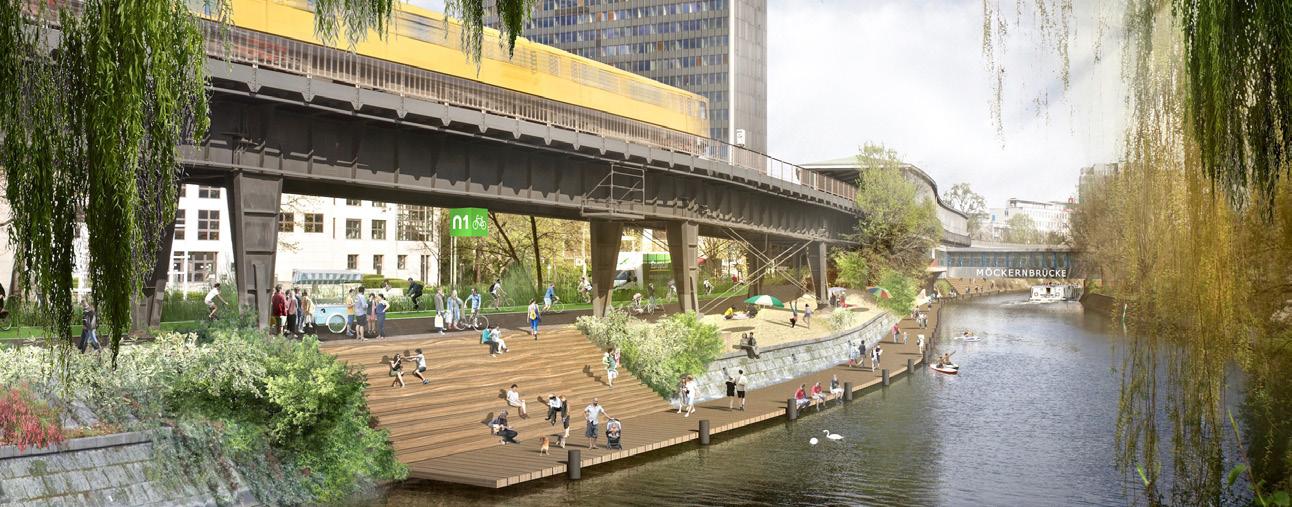
Waterfront redevelopment provides significant opportunity for new programming. Social spaces modeled after the Berlind Radbahn, Isamu Noguchi playgrounds, cyclist utilities such as Giken’s EcoCycle Storage solutions, and restaurants and cafes. All serving to draw the residents of Tokyo to the waterfront.
This project is meant to increase resiliency within the district of Nihonbashi in the face of climate change and the COVID-19 pandemic by harnessing the use of smart technologies to analyze the performance of potential redevelopment projects that will further Tokyo’s pursuit of carbon neutrality.
With Tokyo’s goal of carbon neutrality in mind, this project attempted to understand what factors influence the performance of a development and the potential impacts it will have on its surrounding environment. By utilizing smart technologies to create metrics based on the development’s land use patterns, the waterfront performance analysis was able to identify how occupant behavior influences the resiliency of a building and its surrounding area in the face of a warming climate.
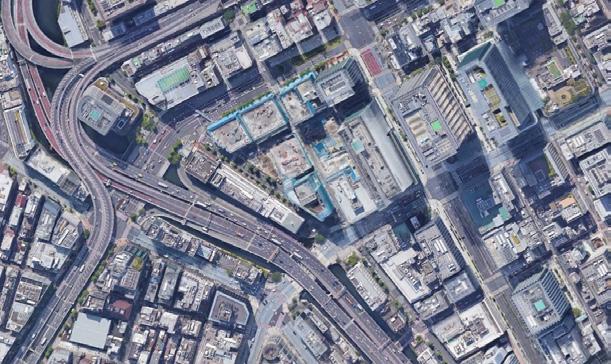
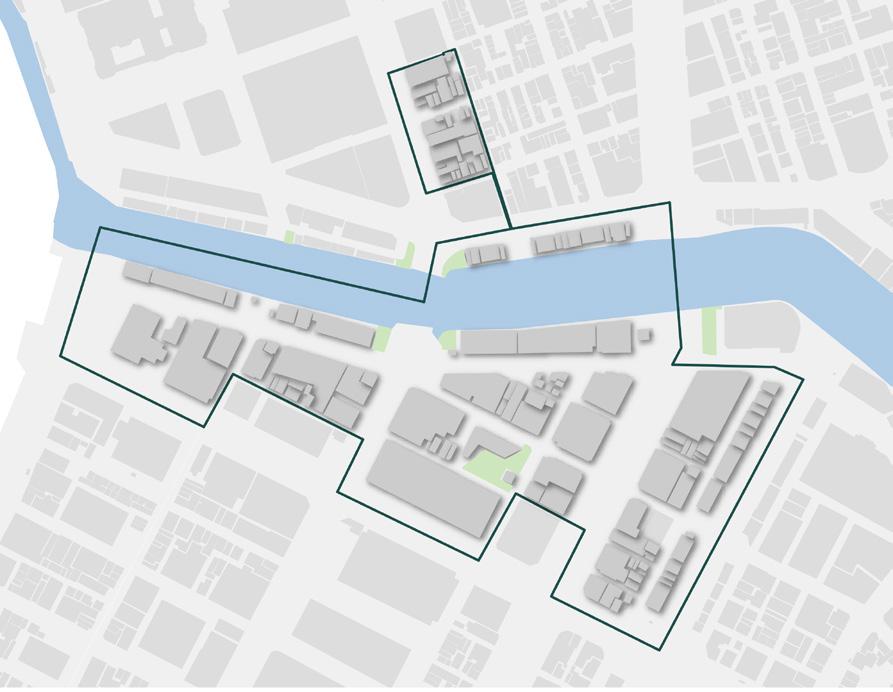
Using an application within the ESRI products called ArcUrban, build outs of the Georgia Tech and Mitsui Fudosan waterfront development proposals were created to understand how their respective land uses would interact with a waterfront that will be activated after the interstate removal. The metrics each build out created provide a better understanding of the efficiency of each proposal and serve as a guide for future developers when considering which land uses most align with Tokyo’s goal of carbon neutrality and climate resiliency.
Before the build outs of each proposal was created, establishing an understanding on how occupant behavior and land use impacts the carbon footprint of a building was important.
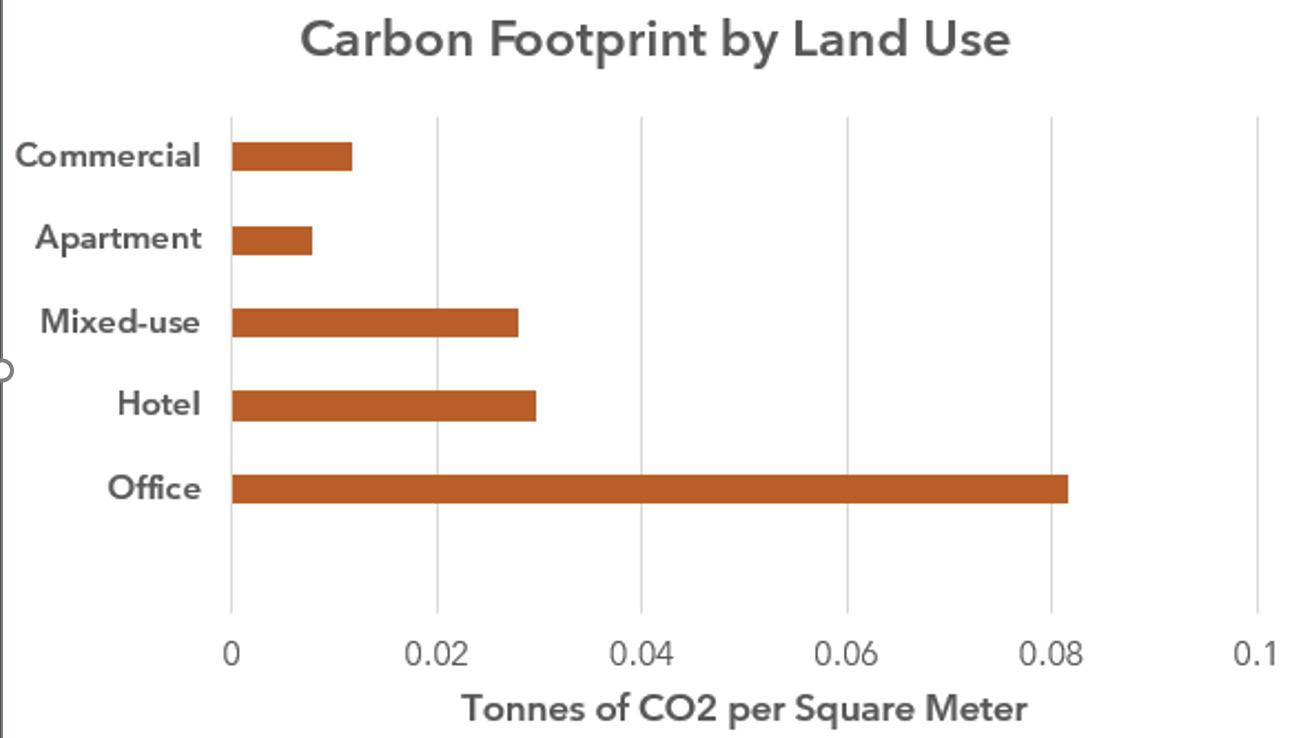
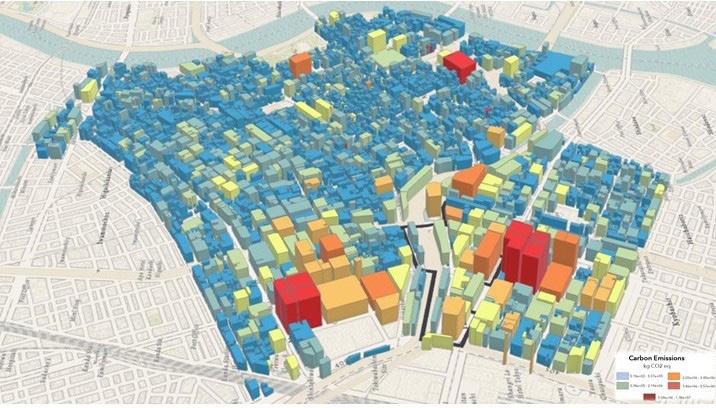
General observations show that most of Nihonbashi’s carbon emissions occur along the waterfront and in District One, which is made up predominantly of office buildings. A breakdown of what land use is responsible for the most CO2 per square meter show that office buildings are the largest contributor at almost .09 tonnes of CO2 per square meter. This is mainly contributed to the fact that most office buildings have data sectors that must be maintained at a certain temperature to prevent overheating or energy failure. This, in addition to the general energy demands that come with maintaining an office building make the carbon footprint of office buildings much larger compared to other building uses (IPCC, 2014)
With clear indications and research showing the correlation between building use and carbon footprints, COVID-19 represented a rare opportunity to capitalize on changing work environments to reshape the built environment as it shifted away from a high demand for traditional workspaces. Additionally, with Tokyo’s goal of reaching net carbon net neutrality by 2050, massive changes would need to be made to the infrastructure of Tokyo to reach this goal.
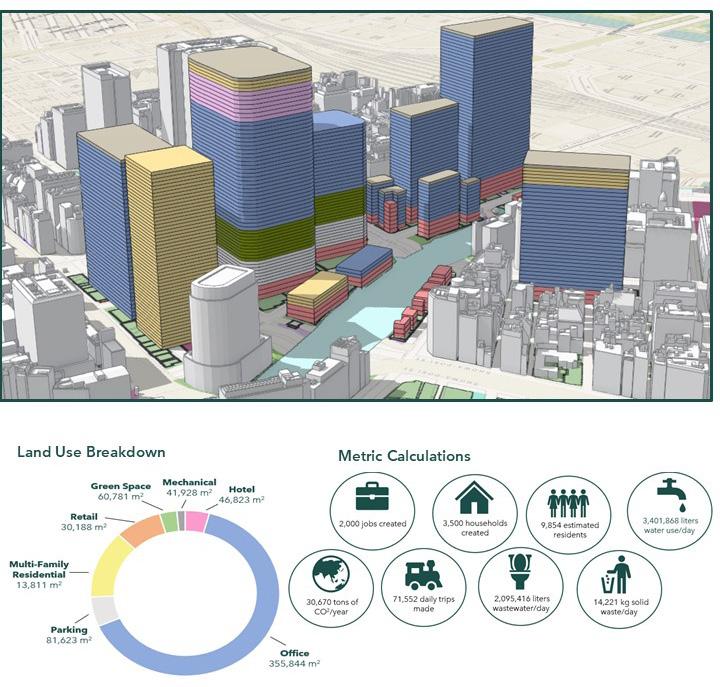
With their proposal being developed prior to the pandemic, the Mitsui redevelopment proposal does not consider a decreased need for traditional office space as telecommuting becomes more prominent. With the vast majority of the Mitsui proposal comprised of office buildings, it is likely that much of this space will be severely underutilized. Furthermore, the carbon emissions associated with its main building use do not align with Tokyo’s carbon net neutrality goal of 2050. While their plan does incorporate a fair amount of green space creation that coincides with the activation of the waterfront, most of this green space is comprised in the form of outdoor terraces within the office buildings, which severely limits the accessibility of these green spaces to residents who don’t work in the office buildings.
The Georgia Tech proposal presents a stark contrast to the Mitsui proposal. Georgia Tech proposal recognizes the shift in the need for traditional workspaces due to COVID and instead incorporates mostly mixed-used developments that create a livable city center. As shown earlier, mixed-use developments have a much lower carbon footprint than office buildings, which will help contribute to Tokyo’s carbon neutrality goals while also revitalizing the waterfront in ways that strictly office buildings could not. By incorporating more green space along the river rather than in courtyards inside the buildings, Georgia Tech’s plan makes green space much more accessible and enjoyable for all residents and visitors. This plan also recognizes Nihonbashi’s history as a business district by maintaining office space within each of the buildings, just not to the same degree as the Mitsui proposal. Compared to the Mitsui plan, the much smaller floorplates of the Georgia Tech plan allow for much greater access to natural light, which will significantly lower energy demands for the district. The smaller floorplans of the Georgia Tech proposal will also allow Nihonbashi to retrofit these spaces back into office buildings much easier than a larger floor plan should the work force transition back to mainly in person.
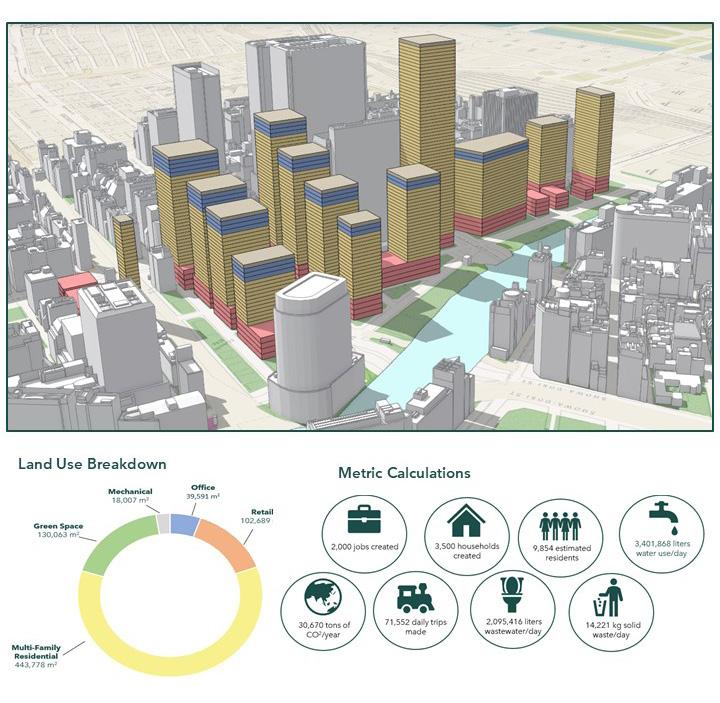
With the build out of each proposal within ArcUrban, several metrics are created that allow for a greater understanding of the proposal performance. These metrics are created based off a formula built into ArcUrban that is based on the respective building use, total populations, and net area of each building. Each of these metrics provides a comparative analysis into the impacts each proposal will impose on its surrounding environment. The four metrics of interest in this study were jobs created, estimated residents, tons of CO2 emitted per year, and the daily trips made. The Georgia Tech proposal accounts for more than double the number of estimated residents as compared to the Mitsui proposal. This number is mainly due to the higher number of mixed-residential units in the Tech proposal compared to Mitsui’s.
However, despite accounting for twice the estimated number of residents, the Tech proposal will only emit almost a third of Mitsui’s total carbon emissions per year. This metric relates to the differences between office and mix-used buildings and their respective carbon emissions per square meter. Tech’s plan, which is predominantly mixed-use developments, would help to drastically lower Nihonbashi’s total carbon footprint if implemented.
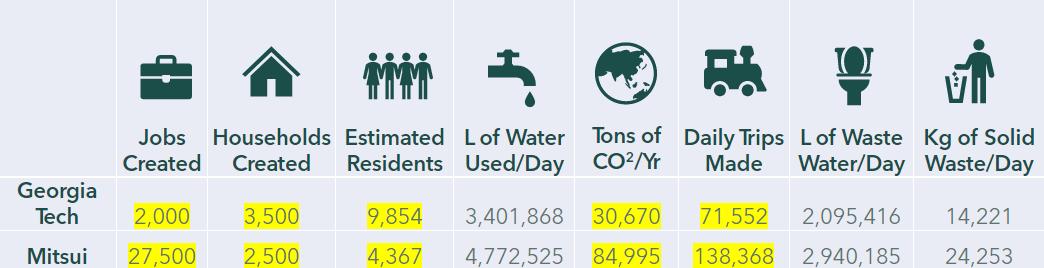
The second metric worth pointing out is the jobs created and the stark differences between the two proposals. A limitation of ArcUrban is that it cannot account for remote work, only work that is present in the office. So while it may look like Georgia Tech’s proposal will take away jobs from the business district of Nihonbashi, this is not actually the case. It is likely that the Georgia Tech proposal will maintain the same number of jobs that exist already within the district, but most of those jobs will be through a work-from-home situation and thus will not take up office space within the waterfront district.
The last metric to highlight is the daily trips made into the waterfront district for each respective proposal. As you can see the Georgia Tech proposal is almost half of the daily number of trips compared to the Mitsui proposal. This can be contributed to the fact that mixed-use building developments will reduce massive commuting flows into the district that will have a two-fold impact—one being that it will reduce overall emissions and the second being that less traffic within the district will reduce air pollution produced by vehicular traffic that will improve overall quality of life for residents within the area.
The results of this performance and energy analysis are meant to serve as recommendations for future redevelopers to incorporate more mixed-use developments and alternative energy sources into Nihonbashi as revitalization projects continue throughout the district. As we have shown, the benefits of mixed-use developments are two-fold – 1) mixeduse developments will increase density of activity patterns throughout Nihonbashi by changing land use patterns; and 2) will decrease overall carbon emissions throughout Nihonbashi due to lower energy demands associated with mixed-use developments compared to office buildings.
As we know, cities are high consumers of energy. Cities house 50% of the world’s population by are responsible for 75% of the global energy demand (UNEP, n.d.) . However, although cities are such high consumers, the per capita energy demand of urban areas is often lower than rural areas due to concentrations of populations and infrastructure. In fact, Tokyo’s per capita energy demand is lower than many of the world’s other global cities. This is largely in part to the high population density. Other factors also influence urban energy demand including building design, material and use, urban form, transportation networks, and infrastructure networks. Redevelopment opportunities, like in Nihonbashi, create opportunity to reduce energy demand through design.
The goal of this analysis was to compare the energy demand of three different scenarios: the existing buildings, the Mitsui Fudosan proposal, and the Georgia Tech proposal. Examining the results will provide insights into how demand varies based on building use, and can inform energy supply planning and policies for Nihonbashi.
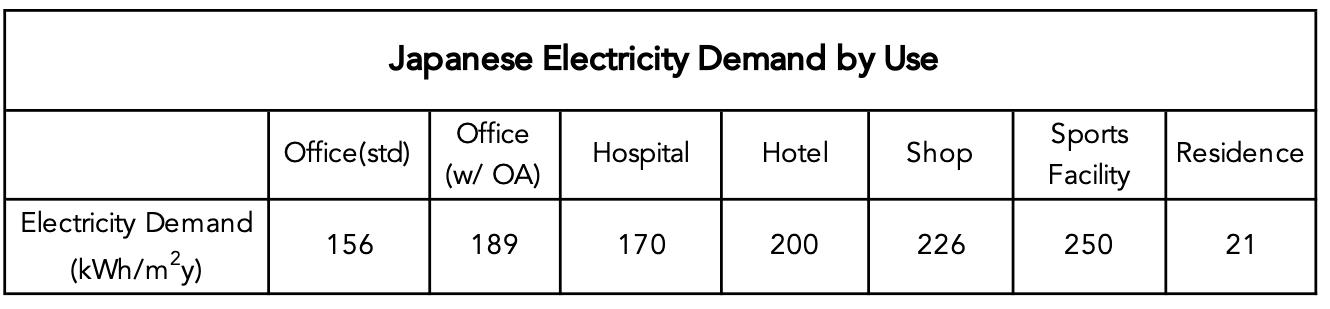
In order to model energy demand, we used Japanese data on annual electricity demand by building use, provided by Dr. Yoshida at the University of Tokyo.

Three Scenarios
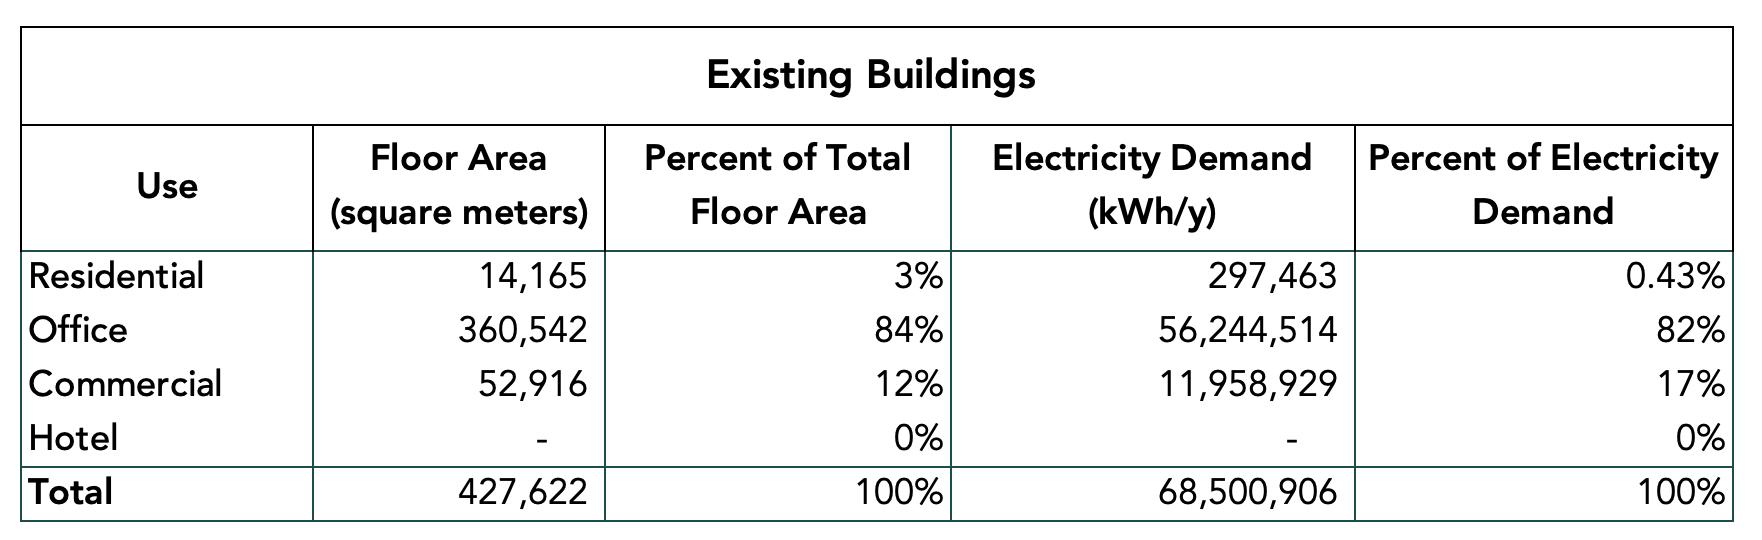
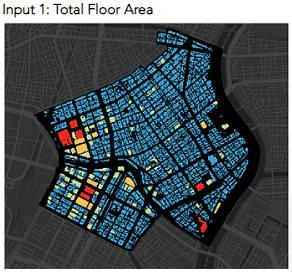
Existing Buildings
The existing buildings have a high floor area of office space, which comprises 84% of the total floor area. This is reflected in the high percentage of energy demand driven by office space.
The Mitsui Fudosan proposal is very similar to the existing conditions and can be considered a continuation of a “business-as-usual” mentality. Office space, an energy intensive use, remains a significant percentage of the proposed land use. The annual electricity demand per square meter remains consistent with the energy use of existing buildings. The proposal is not effective in lowering energy demand.
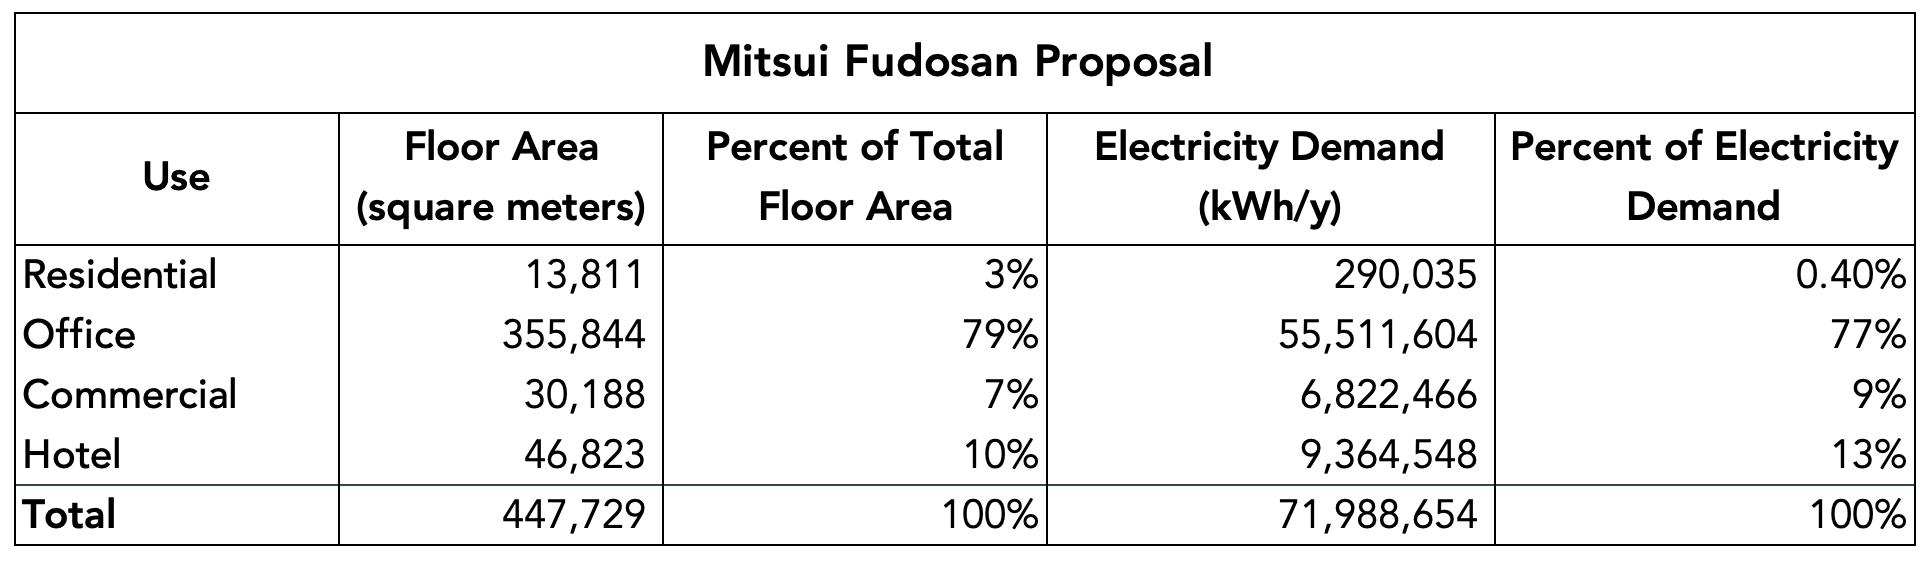
This proposal was developed before the Covid-19 pandemic, which has drastically impacted central business districts and the demand for office space. Demand is declining, and concerns of an oversupply of office space in Tokyo have been circling for years. This, in combination with the energy intensive demand of office space, would suggest that Mitsui Fudosan should reconsider its high reliance on offices in its development.
The Georgia Tech proposal uses 59% less electricity demand per square meter than Mitsui Fudosan’s proposal. Georgia Tech’s proposal has more floor are than both other scenarios but requires drastically less energy. Land use affects energy demand. Mixed-use and increased residential space can lower energy demand, as shown through this proposal.


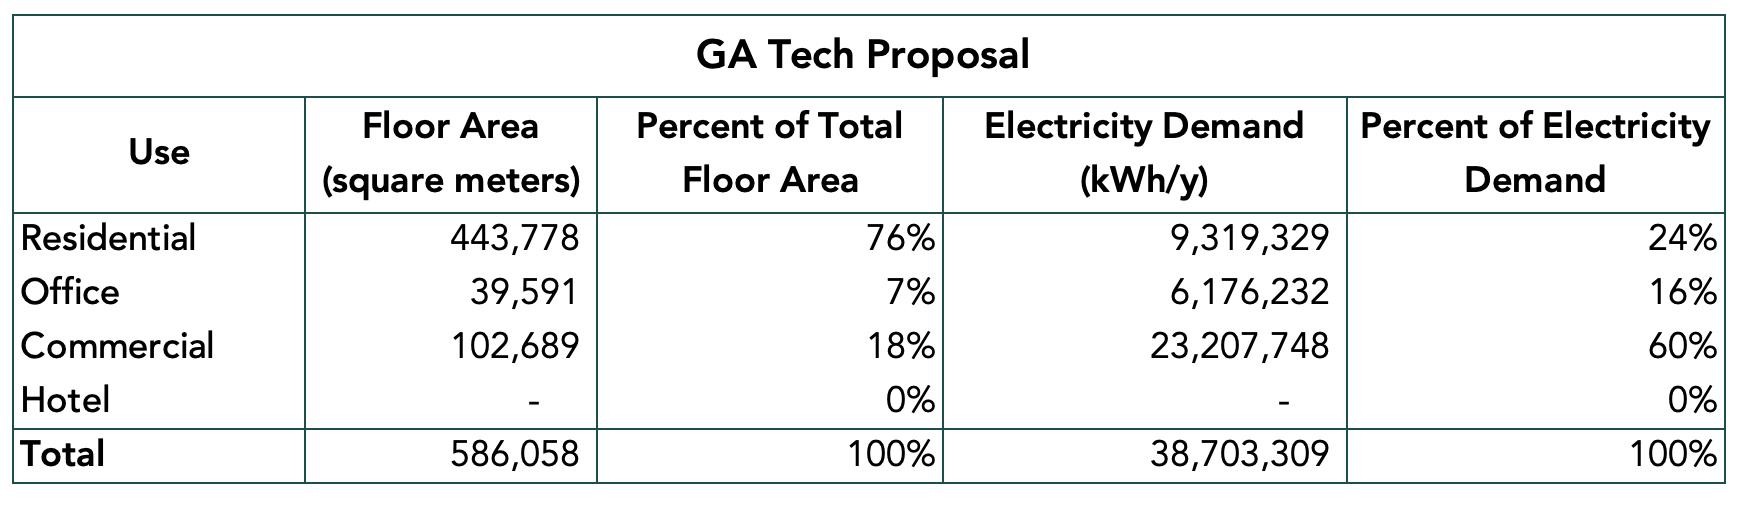
Beyond lower energy demand, mixed-use spaces also increase resilience to shocks like the pandemic, by maintaining a high residential base. They also work to create more livable spaces in the center of cities like Tokyo.
 Natalie Manitius
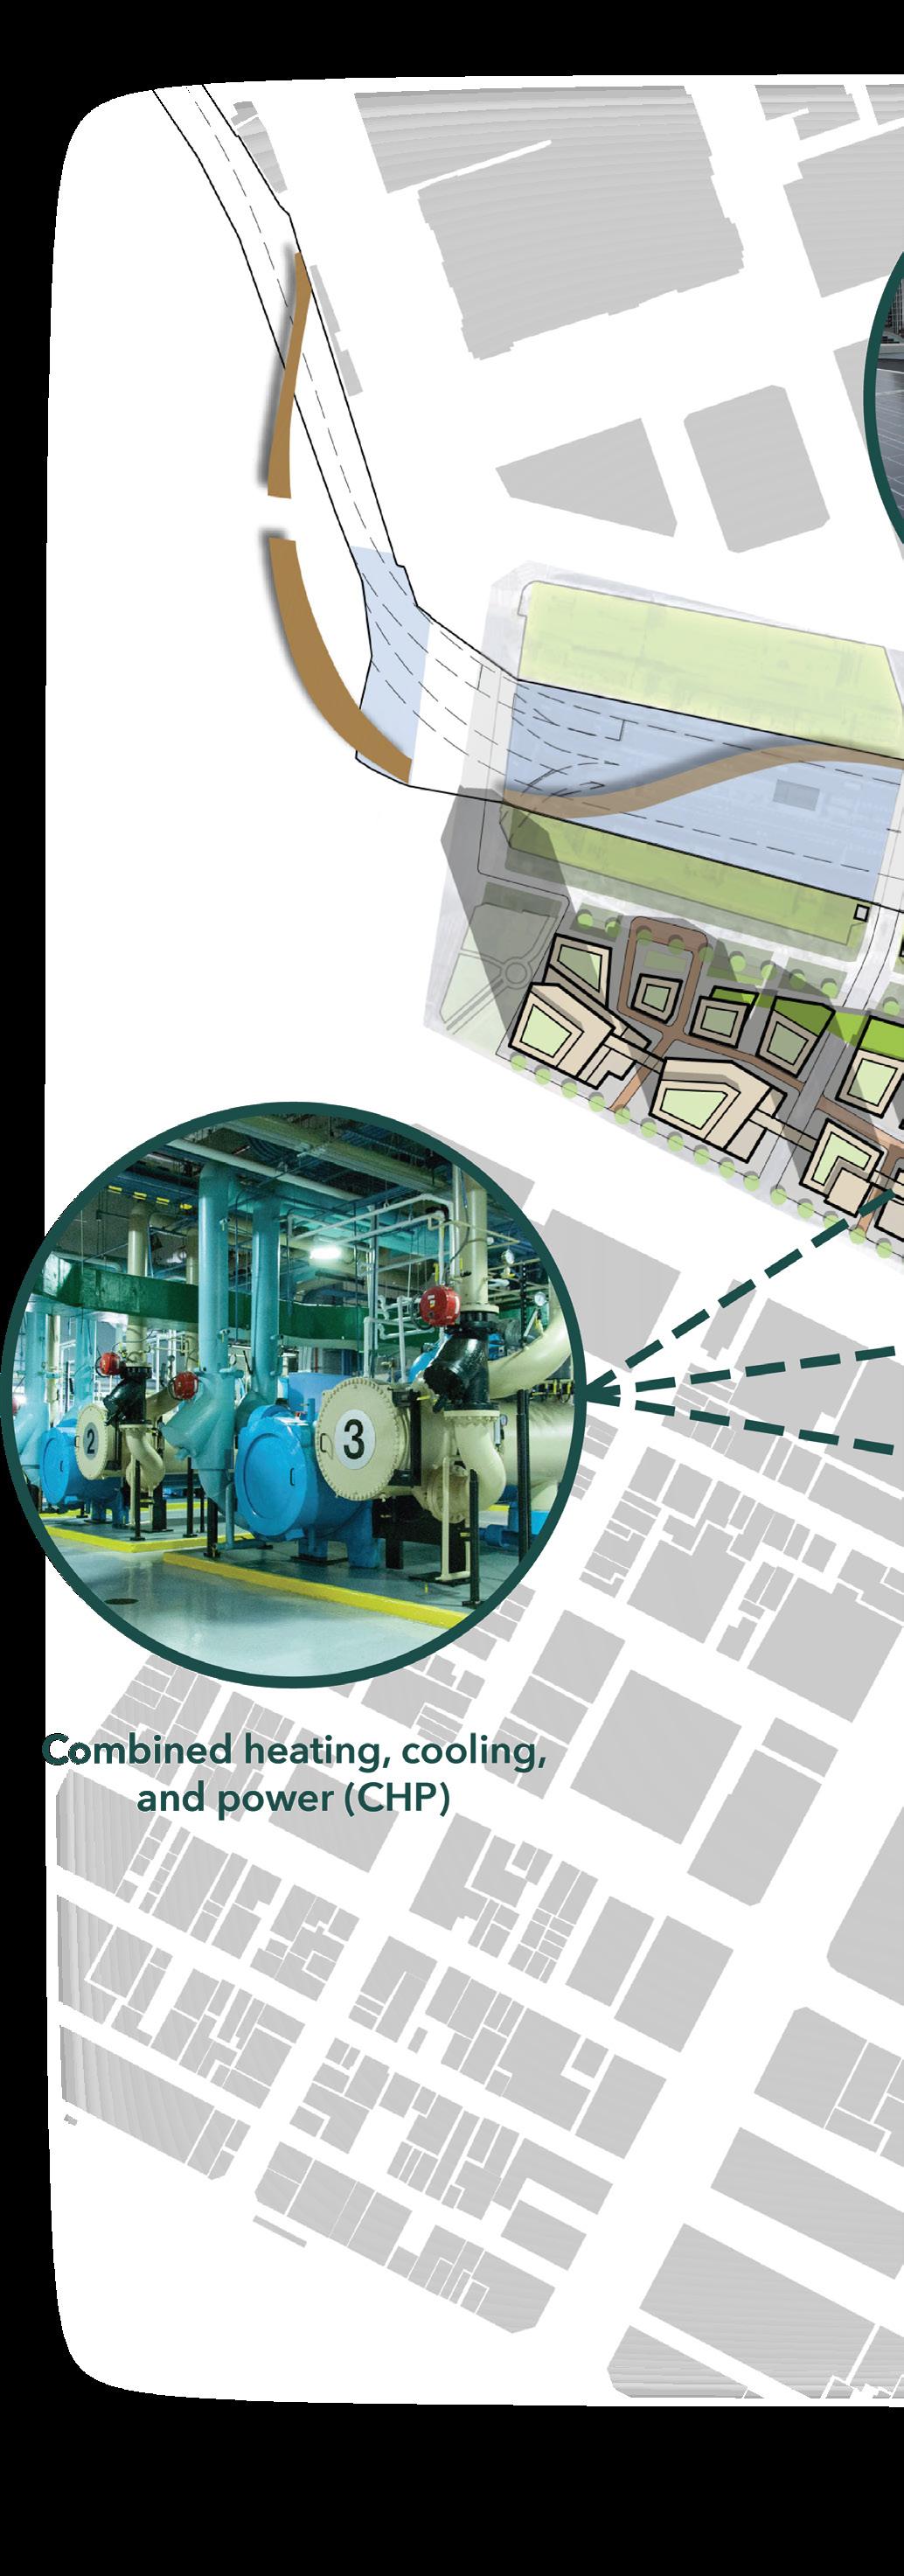
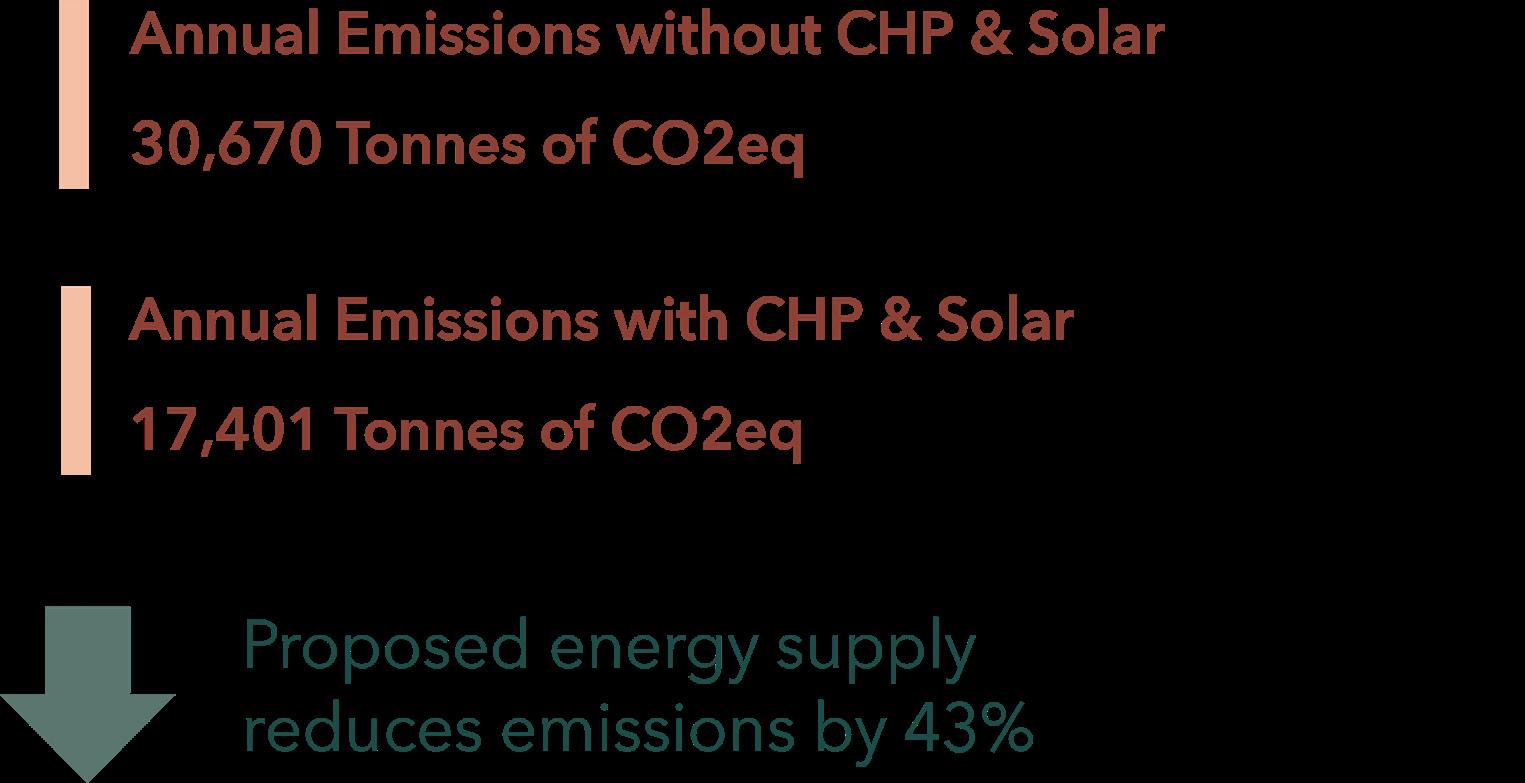
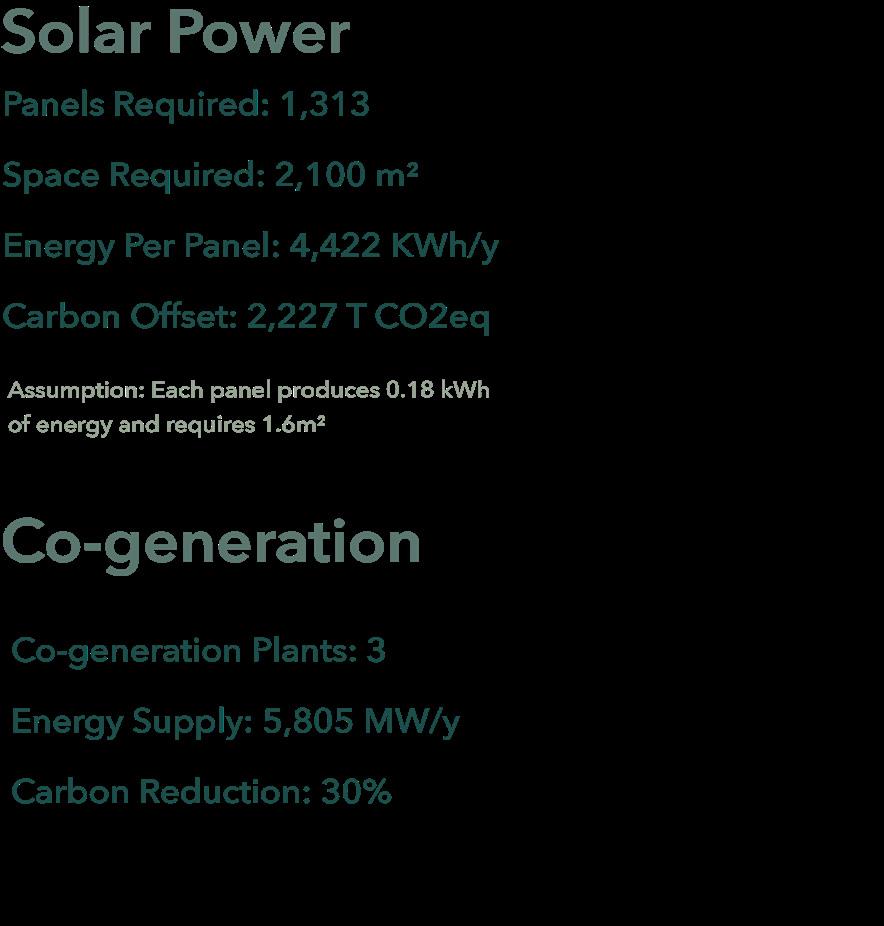
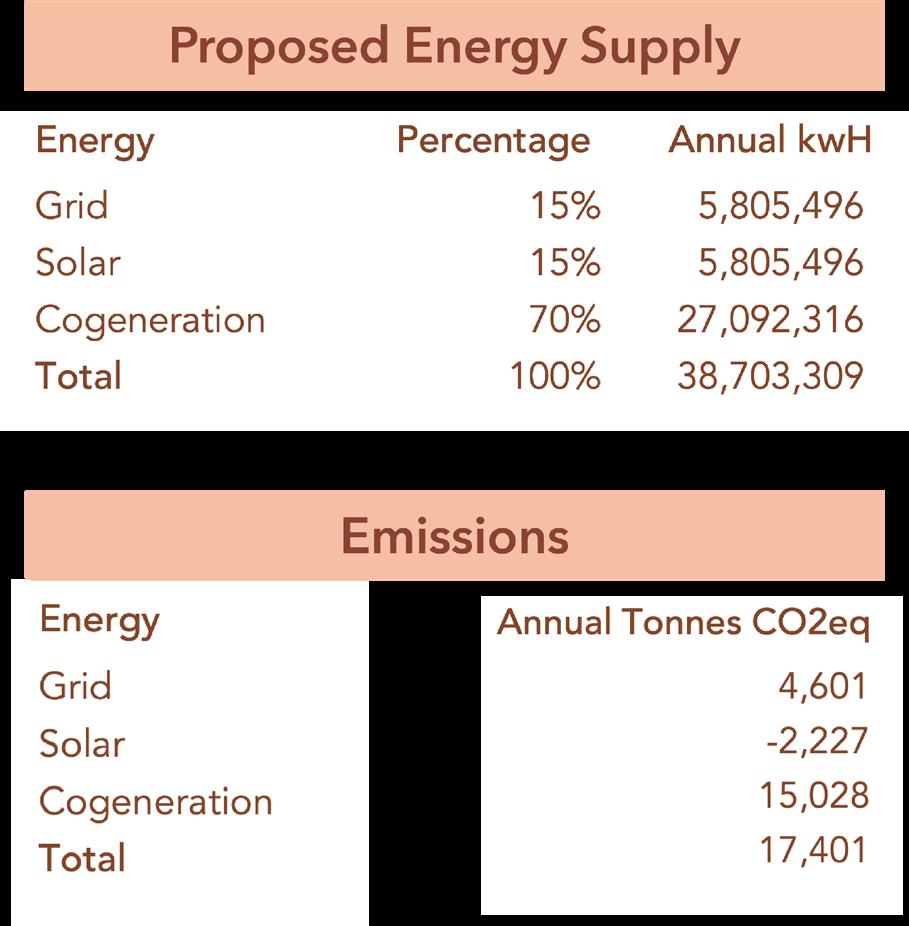
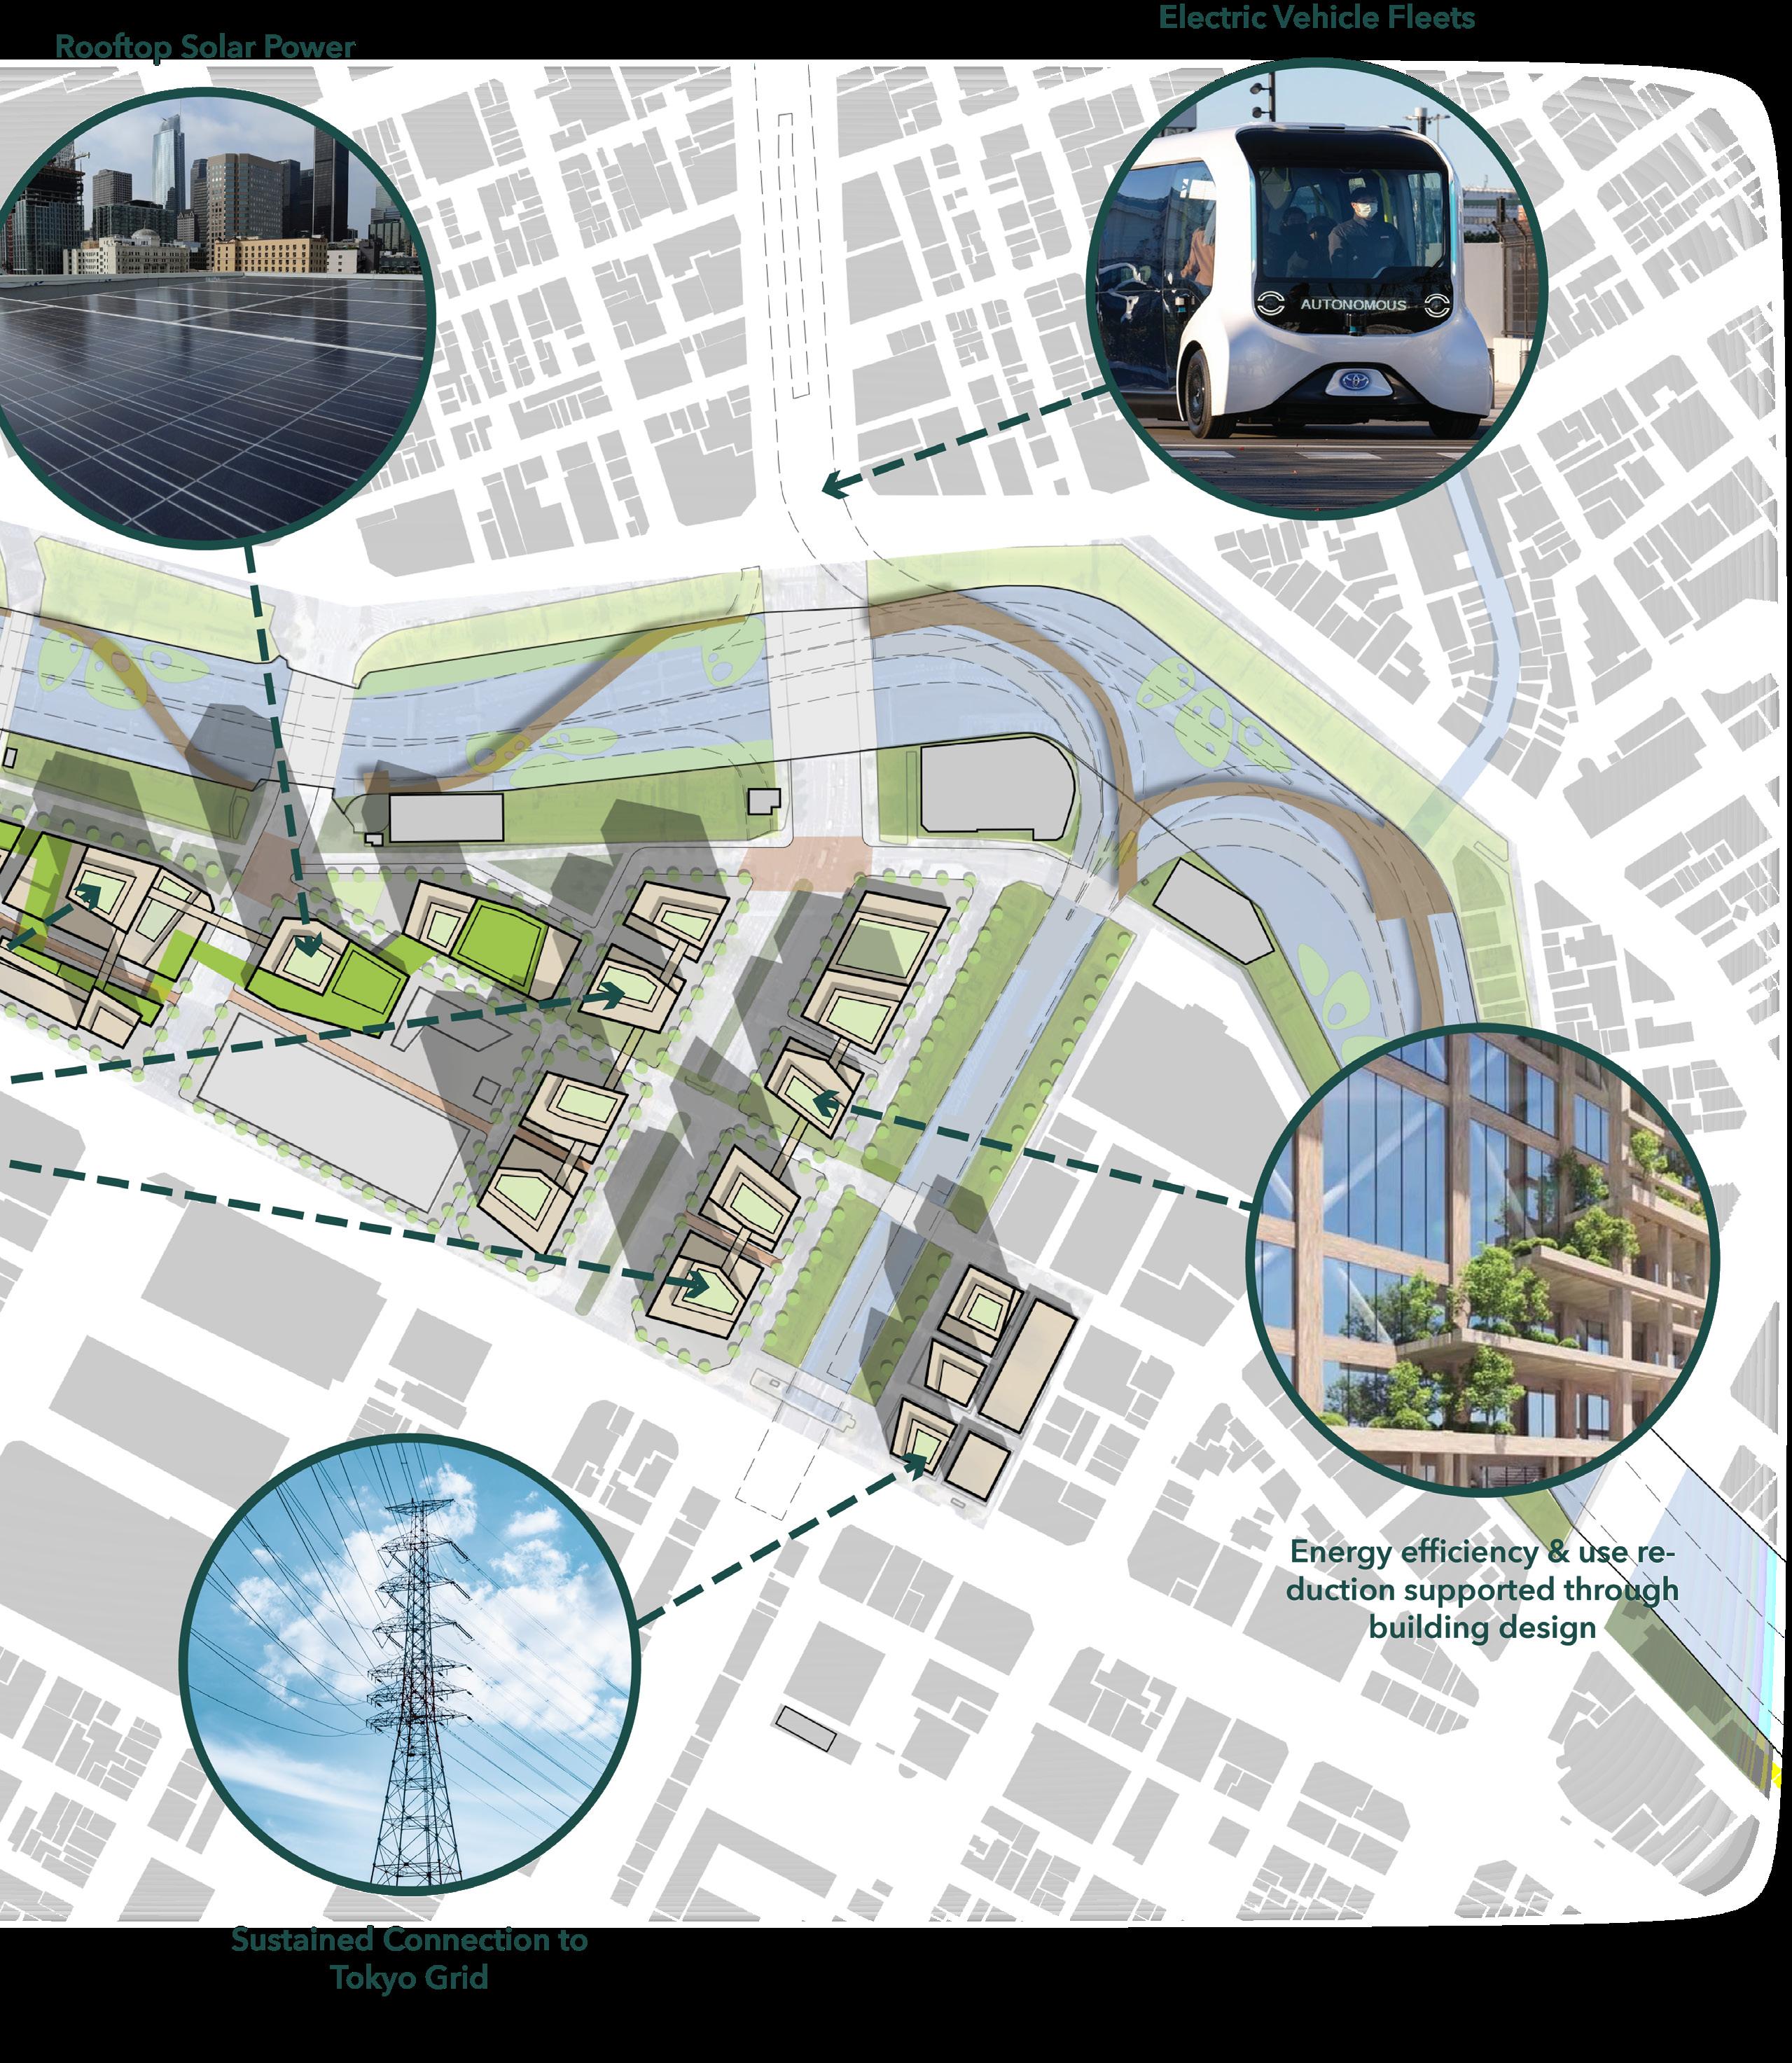
The comprehensive redevelopment of the waterfront presents an opportunity to develop a district wide micro-grid that will contribute to energy resilience and emissions reduction goals. Locally produced energy will be able to provide a stable supply of energy through distributed co-generation systems and solar panels. A sustained connection to the Tokyo grid will be able to supply supplemental power. The district energy system will drastically reduce emissions through efficiency improvements and the incorporation of renewable energy. Further efforts to decrease energy demand, improve efficiencies, and create power storage through design and amenities will support the district in achieving carbon neutrality.
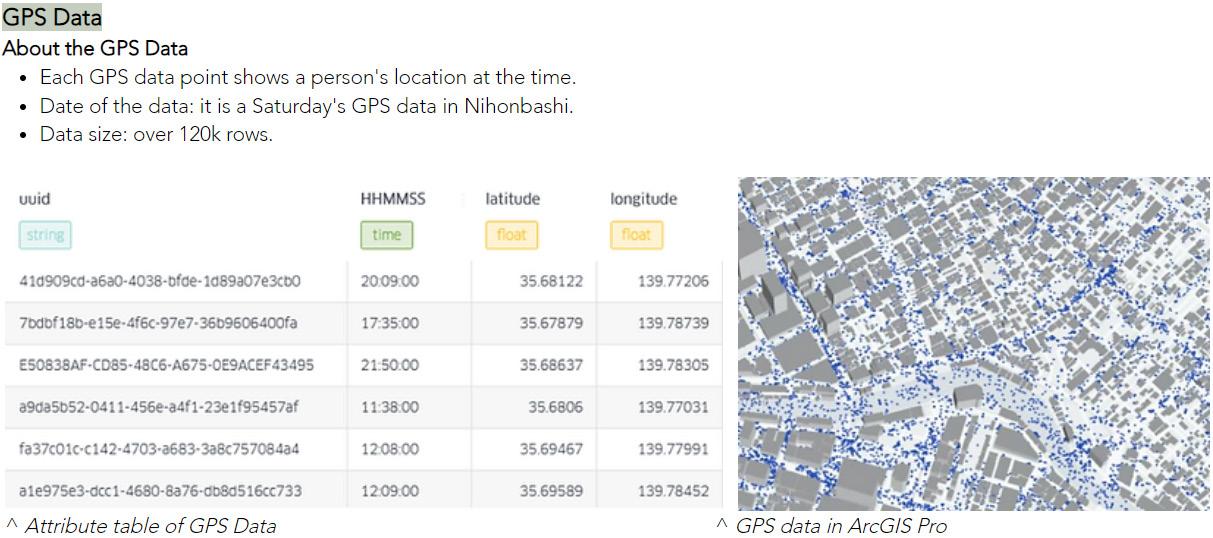
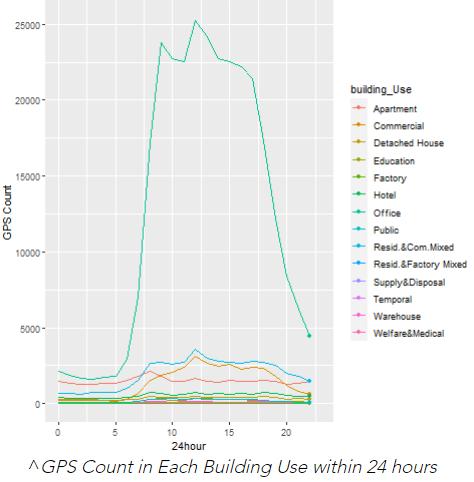
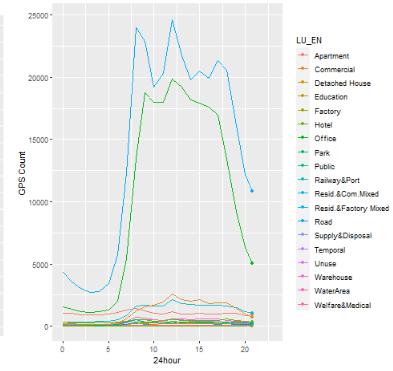
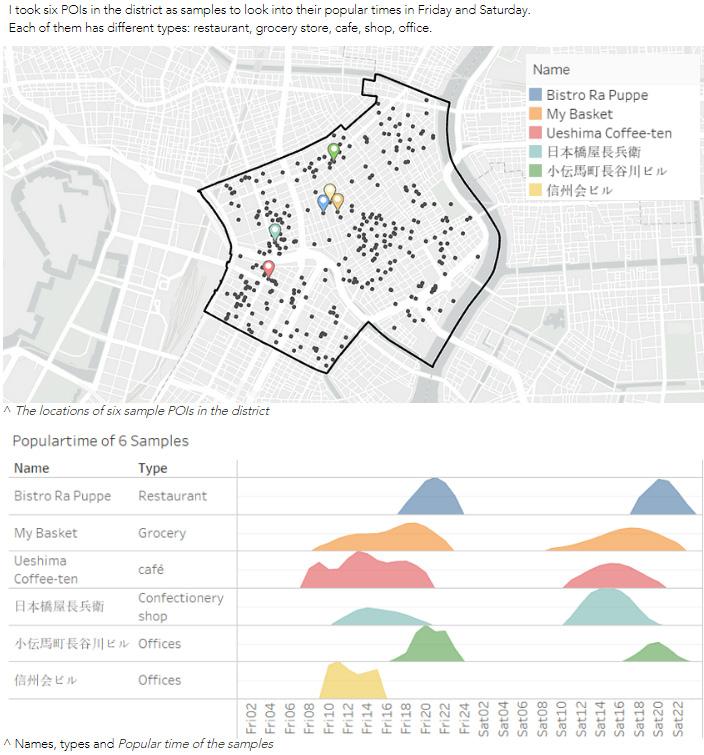
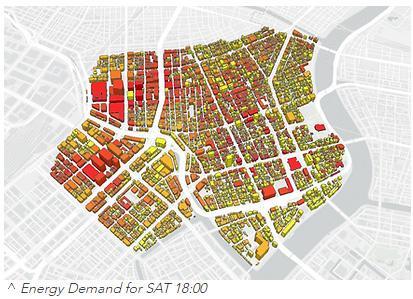
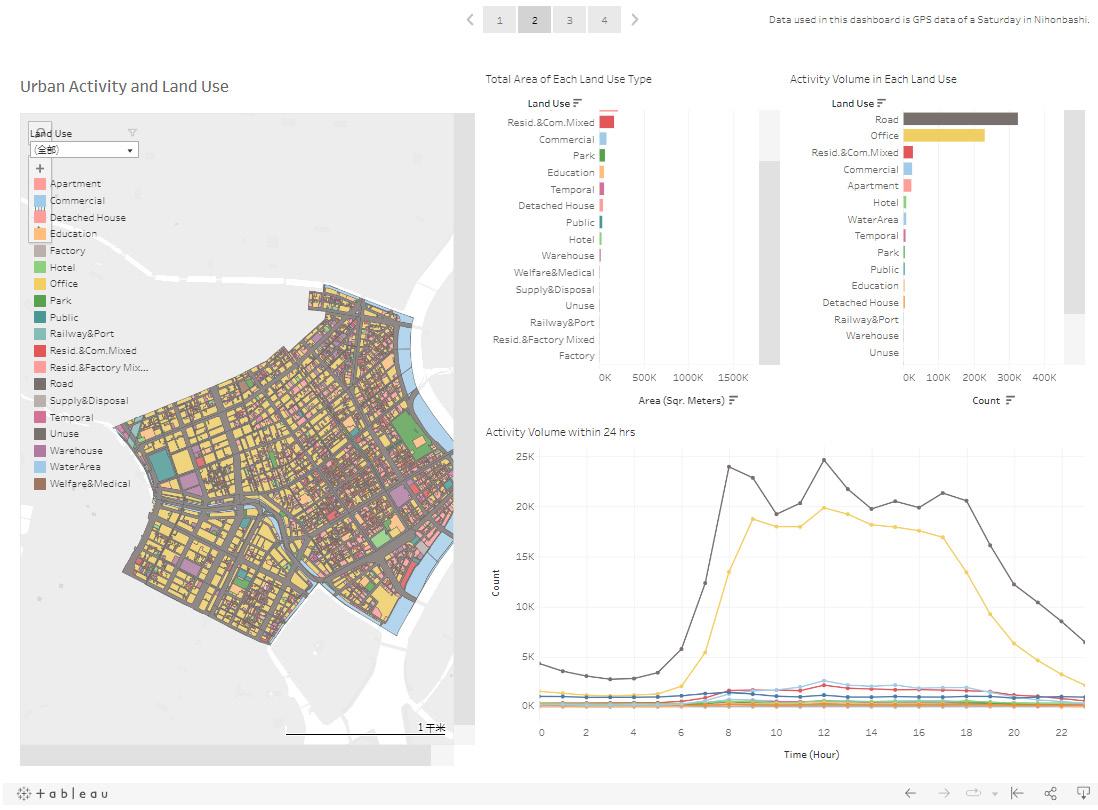
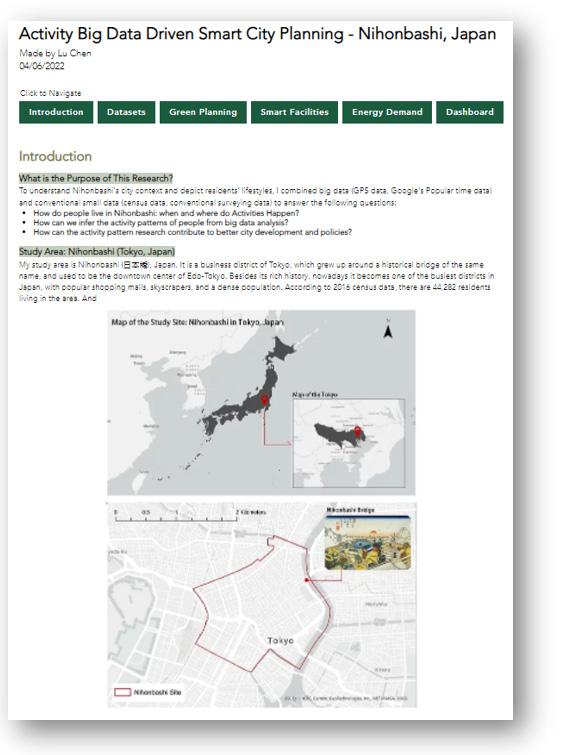
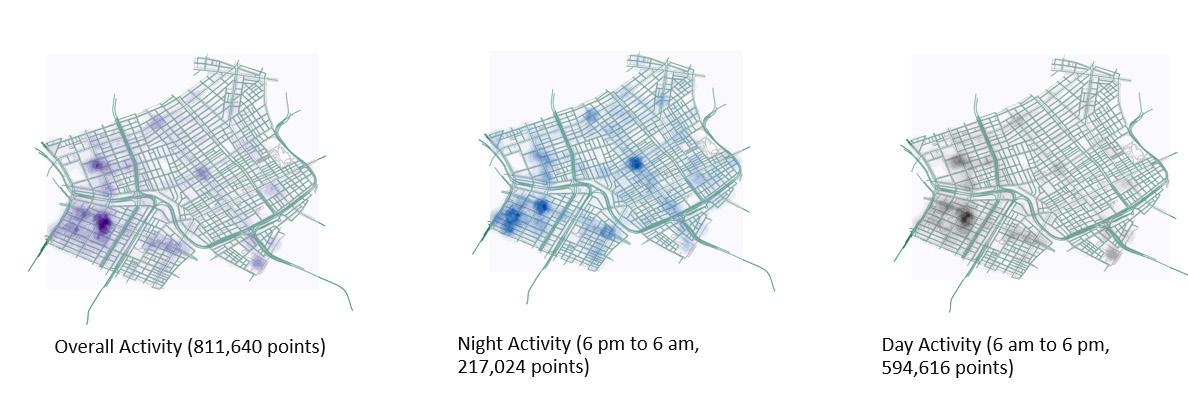
This research is to understand Nihonbashi’s city context and depict residents’ lifestyles by analyzing and mapping urban activity patterns. Furthermore, to propose data-driven planning tactics that support our 3C missions. Activity big data analyses would answer the following questions:
• How do people live in Nihonbashi: when and where do Activities Happen?
• How can we infer the activity patterns of people from big data analysis?
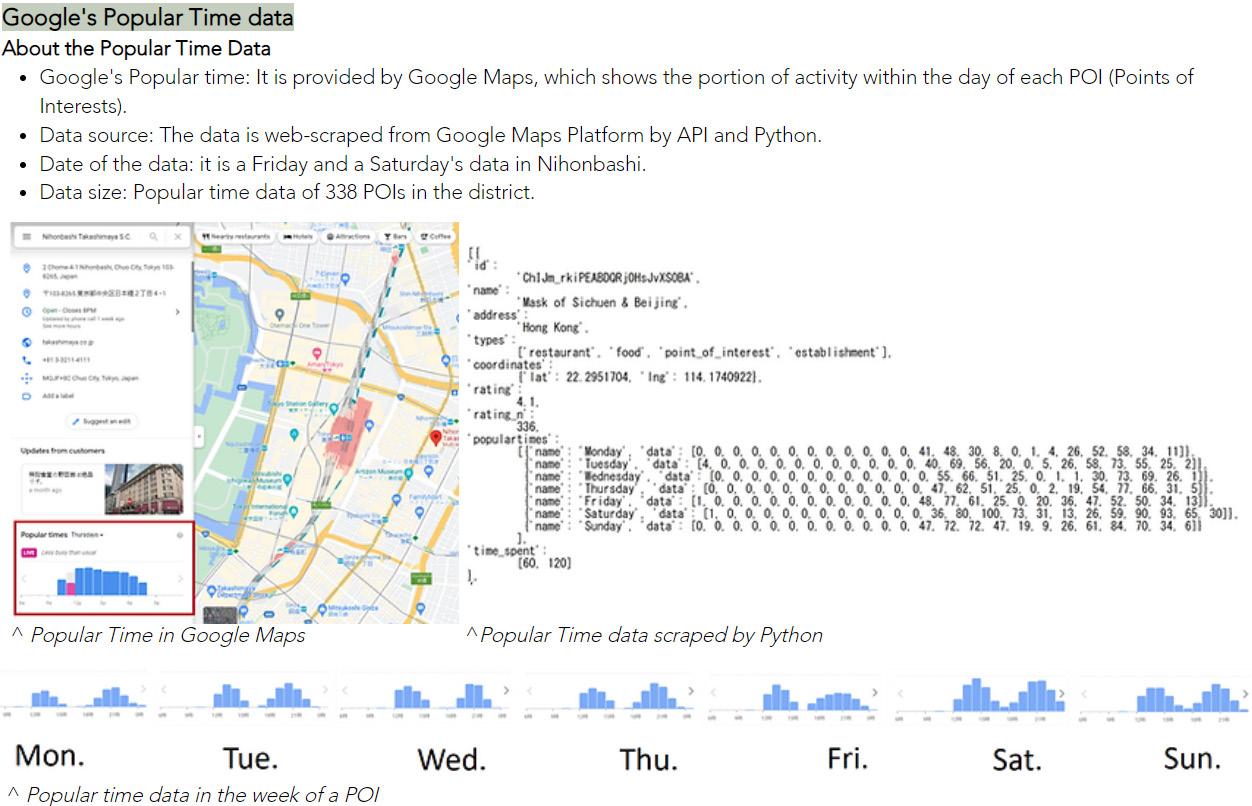
• How can the activity pattern research contribute to better city development and policies?
Acknowledge:
GPS data and web-scraped methodology from Tutorials offered by Dr. Takahiro Yoshida, The University of Tokyo.

A Slice of Nihonbashi’s City Life: Six sample POIs in Nihonbashi
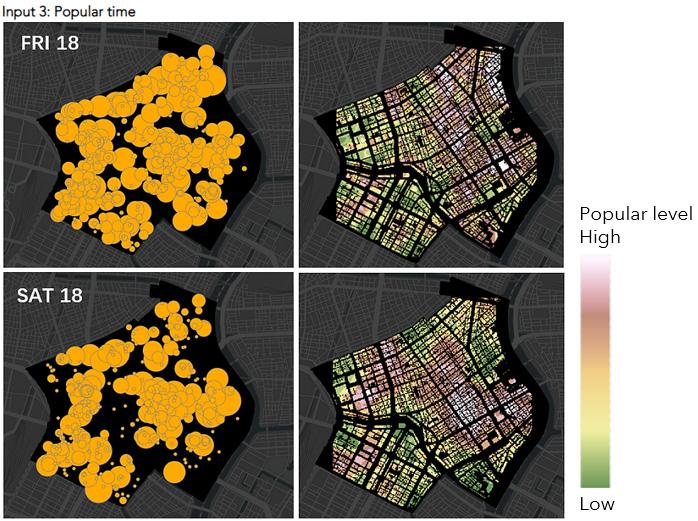
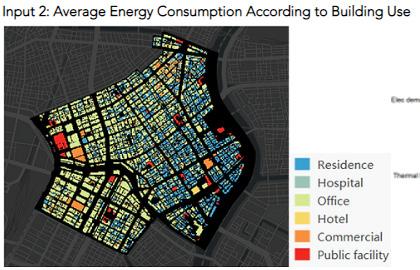
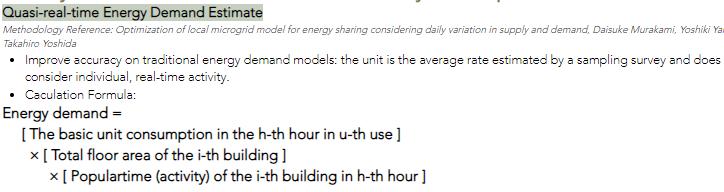
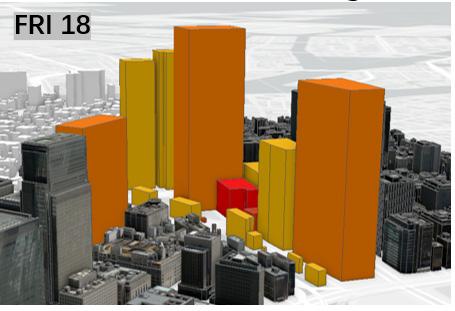
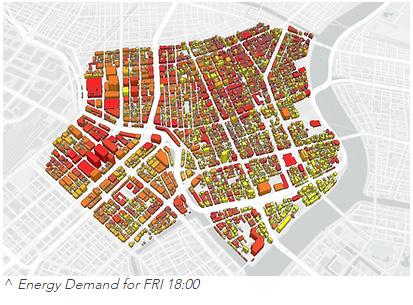
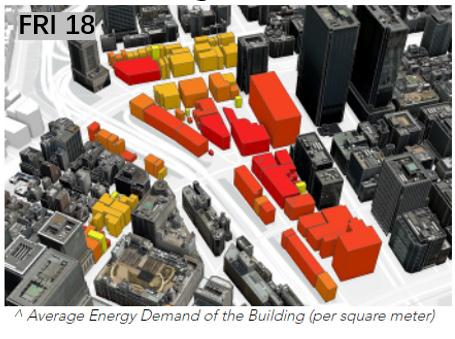
Energy Demand on FRI 18:00
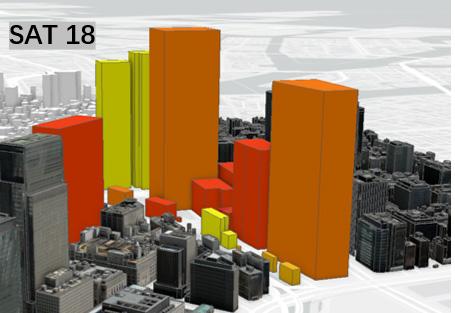
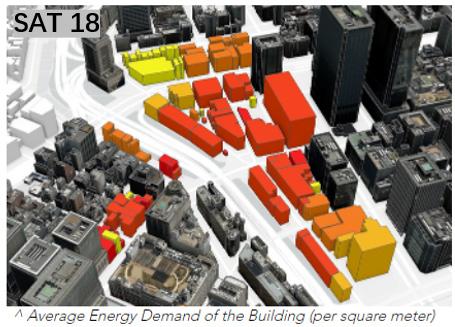
Energy Demand on SAT 18:00
Existing Buildings
Planned Buildings


 Muhammad Arsam
The waterfront re-design proposed by our studio embodies may of the policies laid out earlier; it maintains the existing road network as much as possible, gives buildings wide berth between each other to maintain sunlight and neighborhood walkability and supports constructing more green infrastructure in the form of parks. Additionally, we are also proposing a construction bonus, possibly in the form of tax credits, as an incentive to whoever builds structures that are at least somewhat publicly accessible on the waterfront. This will ensure density, human-scalability and allow the formation of a robust atmosphere on the waterfront.
The major problem this proposal is attempting to address is the discrepancies in Nihonbashi’s current land use plans and to implement a zoning policy that is more open to robust forms of activity and engagement in the area. As discussed earlier, Nihonbashi as a neighborhood mostly attracts workers from outside of its boundaries and fails to generate its own internal traffic. Our policies, taken as a sum, introduce higher vertical density will spur a new wave of residential development, which will be followed by more commercial development within the area of Nihonbashi itself. Hence, we hope to develop a neighborhood that attracts and retains a bigger population. Our proposals also encourage more walkable designs and biking as a form of commuting.
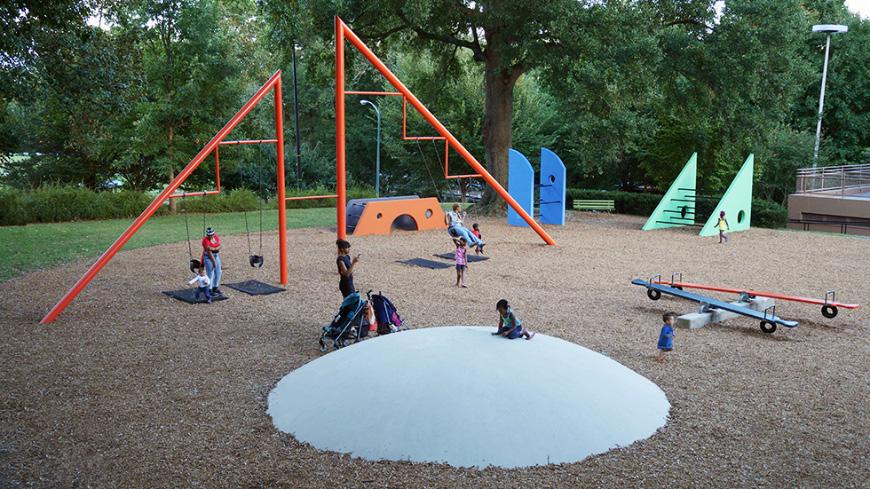
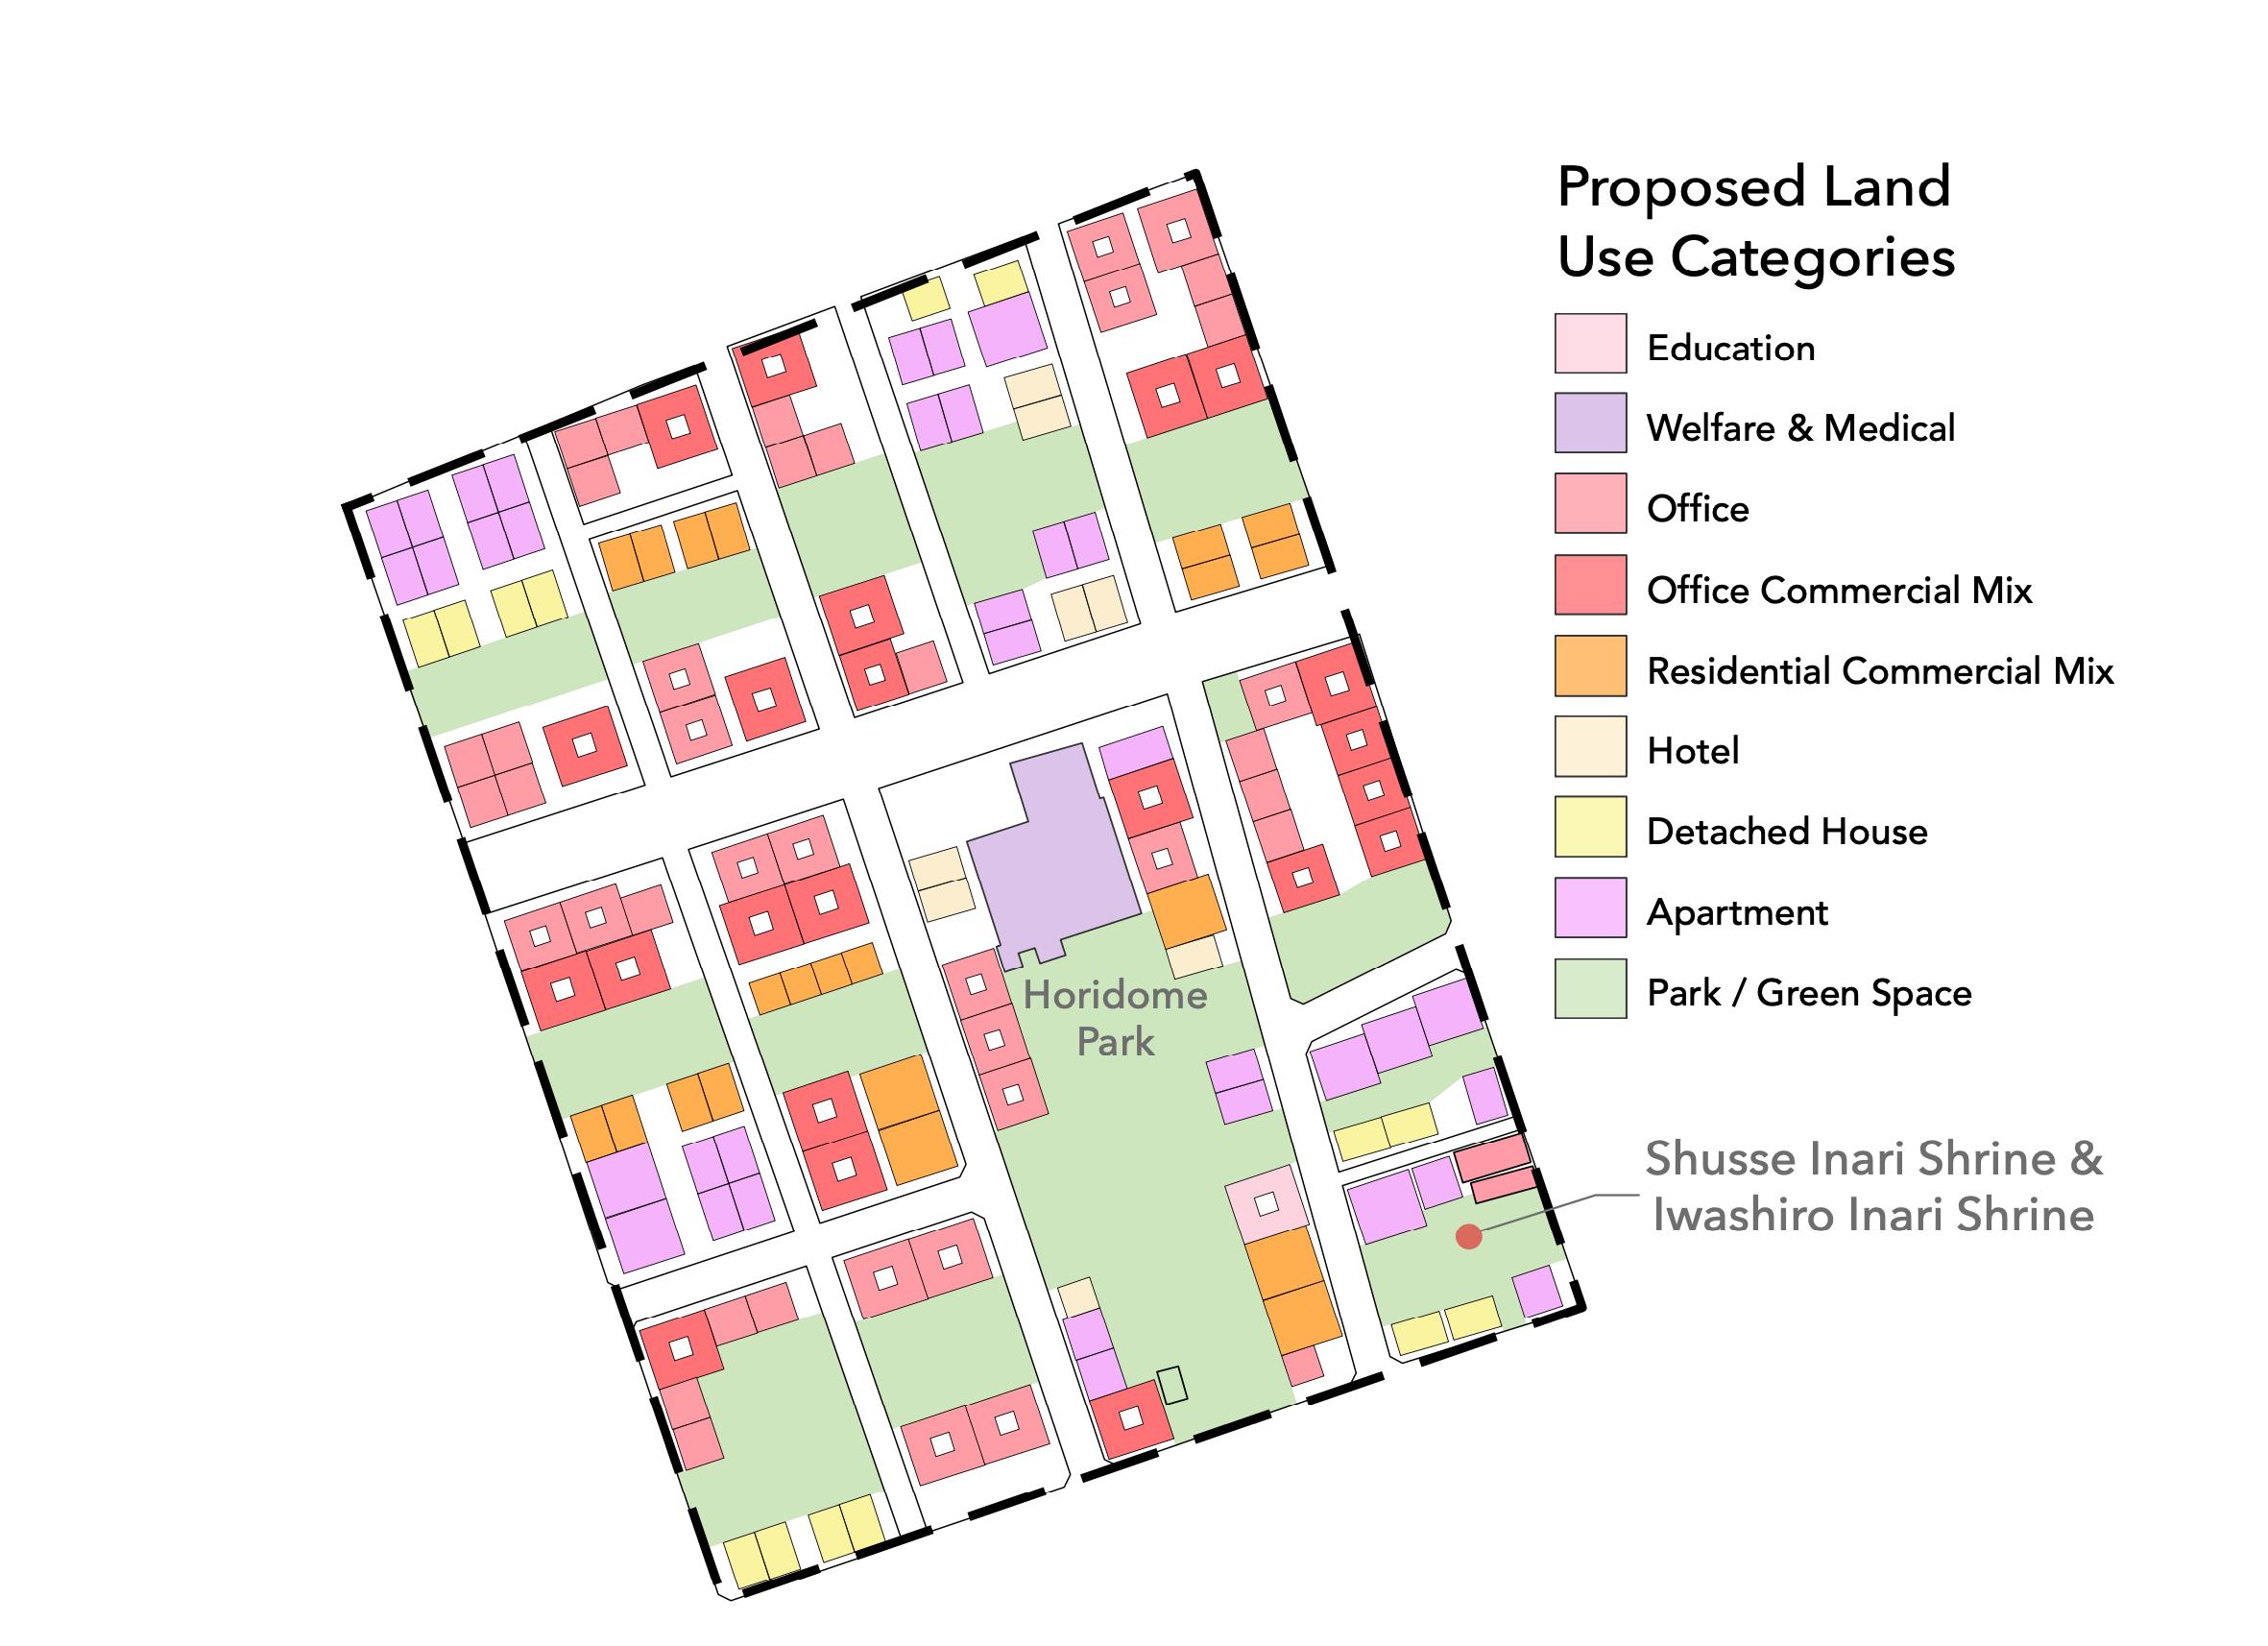
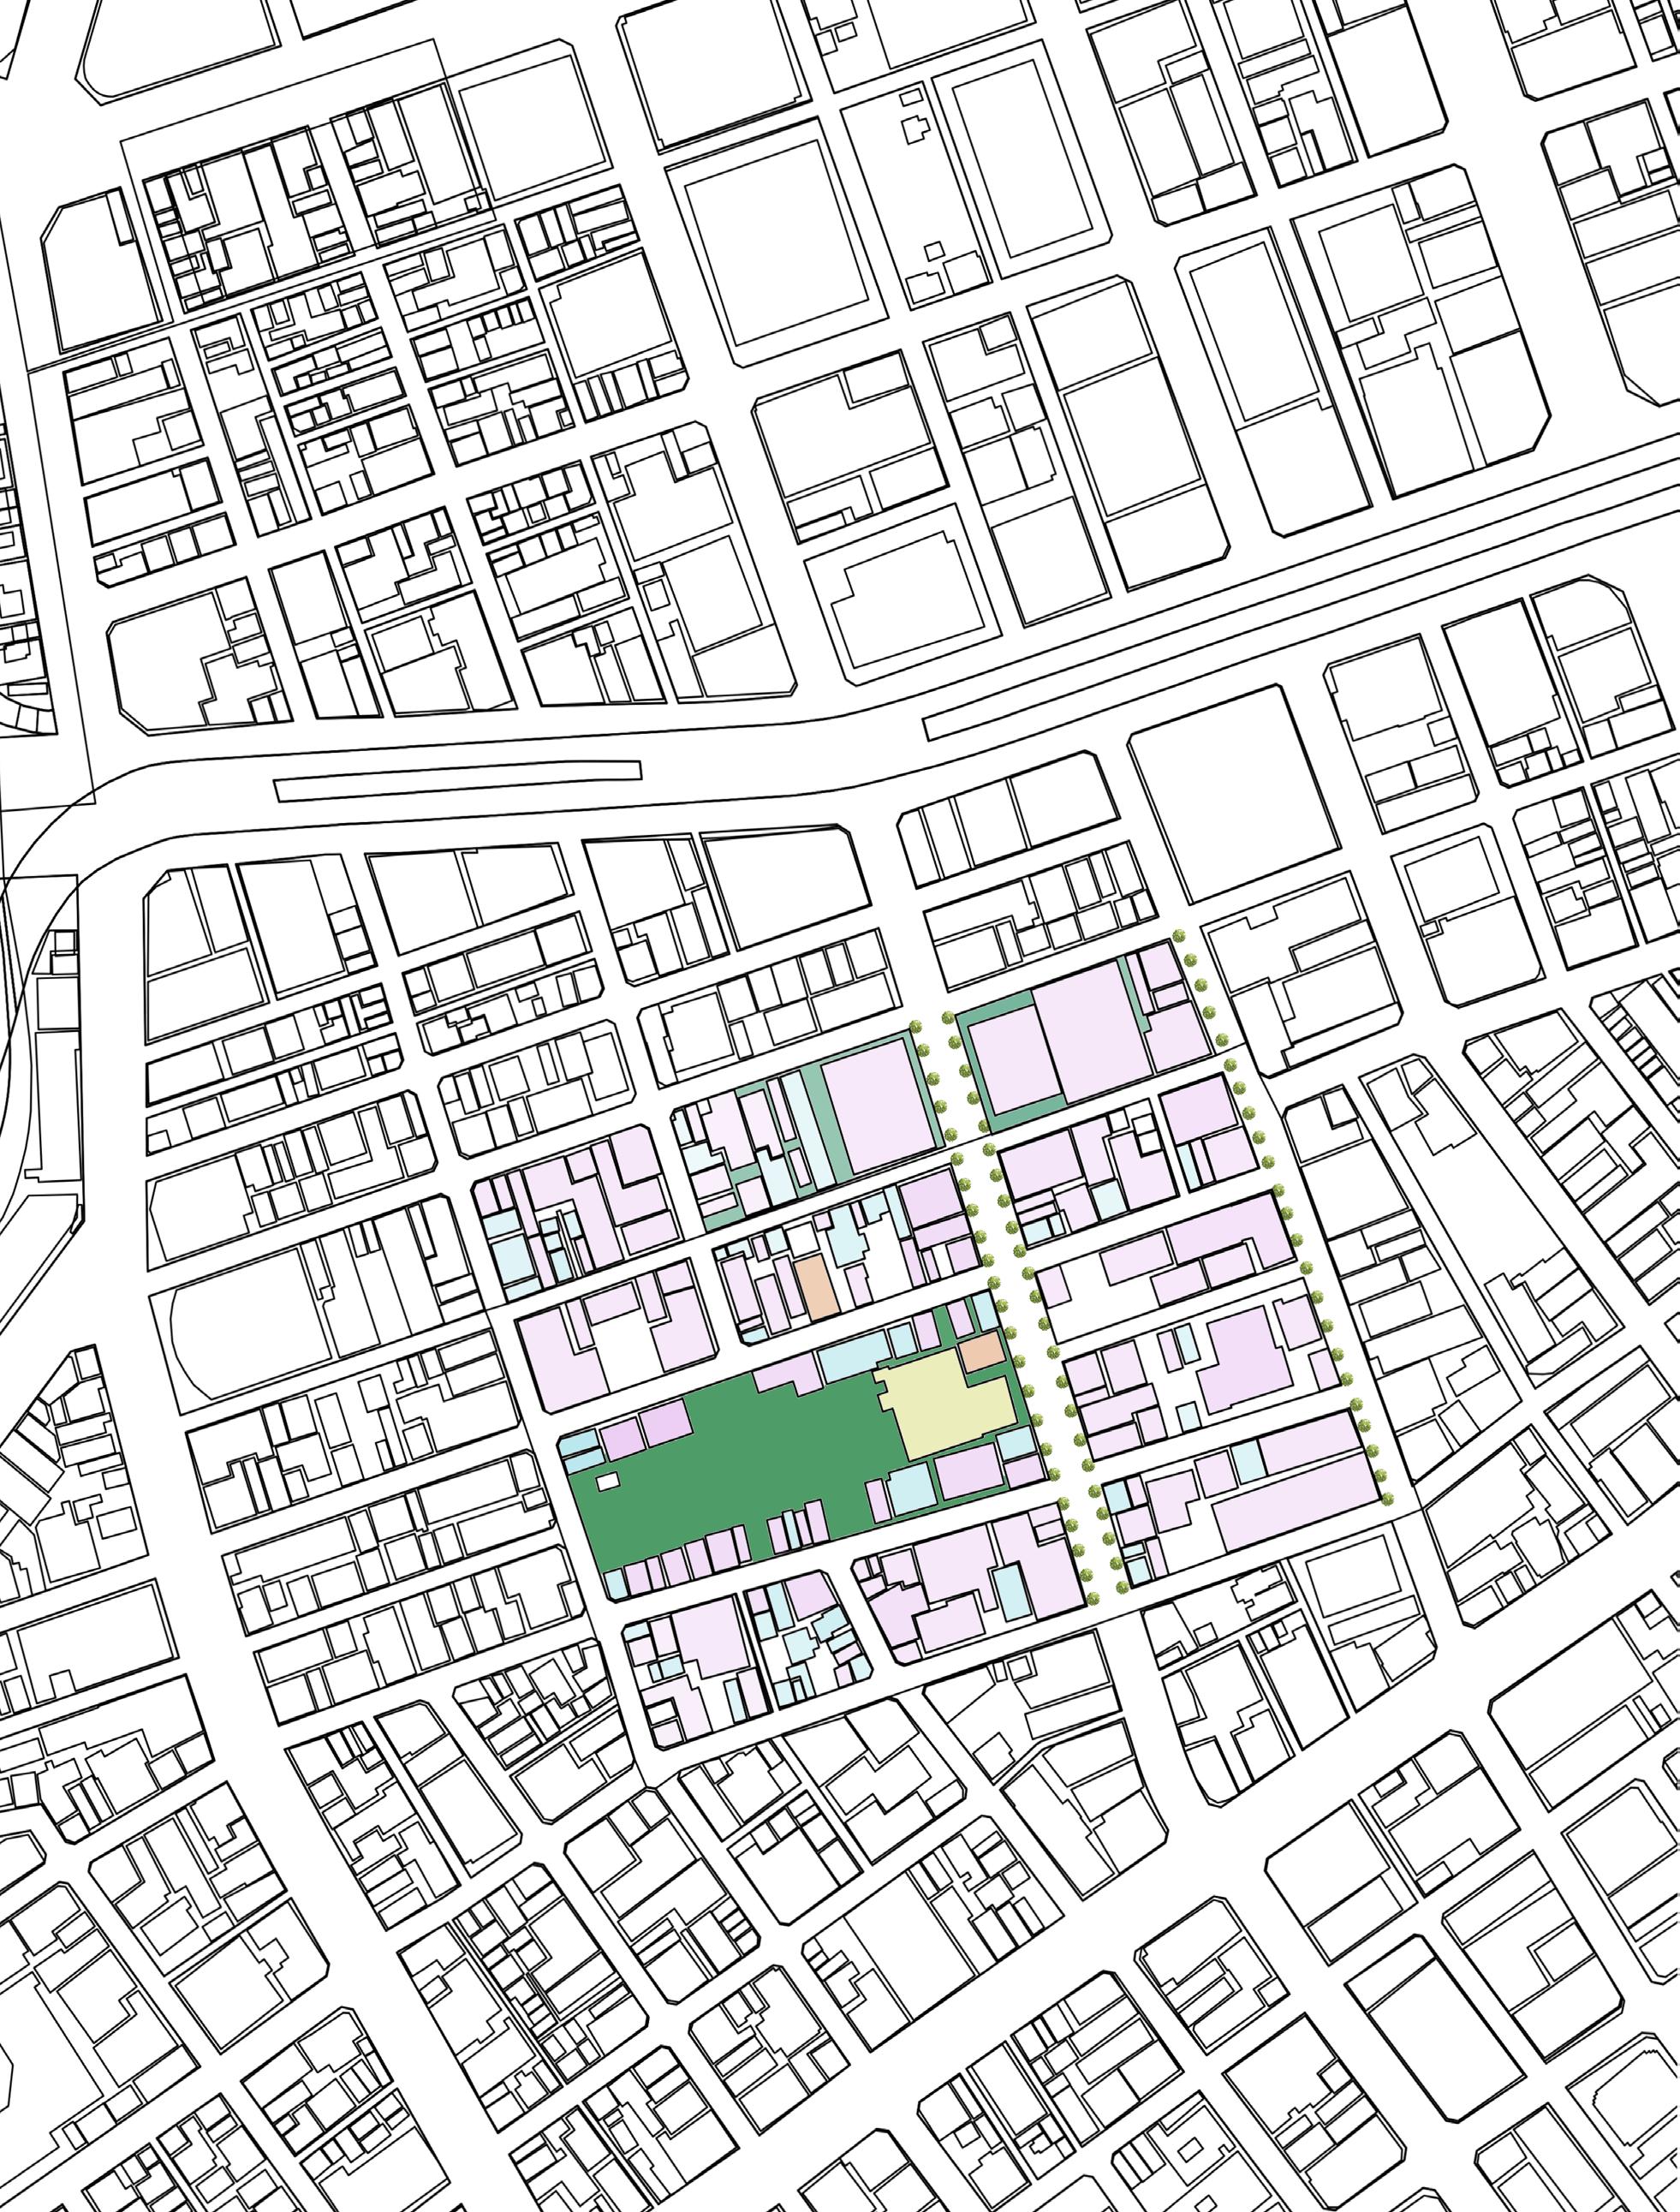
District two is a smaller scale district populated mainly with older office buildings. This district as much of the rest of its surroundings is densely populated with closely built buildings on small parcels. Resulting in an almost “stitched-together” look and feel rather than a cohesive design. Within the district is located Horidome Children’s Park which is supposed to be a nice green children’s park. Unfortunately this park is mostly concrete covered with a small children’s jungle gym resulting in a seemingly missed opportunity. As this park seems so gloomy in its scale and possibilities, this was the generator to begin the “Greening the District” proposal. In this proposal, the aim is to firstly create a better look and feel to Horidome Children’s Park which will influence adding greenery and open spaces to the surrounding portions of the district. In opening up the blocks this allows for better walkability and “breathability” to the district amongst such a dense city. Horidome Children’s Park historically is where one of the Nihonbashi canals ended so this proposal not only aims to revitalize Horidome Children’s Park but to also commemorate the historic trail of the canal that is now a street while still creating an incredible new and revitalized Horidome Children’s park. The district is already densely packed but with low to mid-rise buildings, allowing for the opportunity to rebuild higher, more sustainable buildings whilst still maintaining the same proportions as before just built up instead of horizontally.
Site Shrines
Buildings To Remain:
• Shrines
• Historic Buildings
• Buildings to Retrofit
LEGEND
Subway Stations
Residential Parks
River
Existing Aerial
Public
Education
Welfare & Medical
Office
Commercial
Residential Commercial Mix
Hotel
Detached House
Apartment
Residential Factory Mix
Warehouse
Temporal Park
Unused
Horidome Park

Research and Development Studio 2
Smart City Tokyo
Professor Perry Yang
Tasha Snedaker
Spring 2022
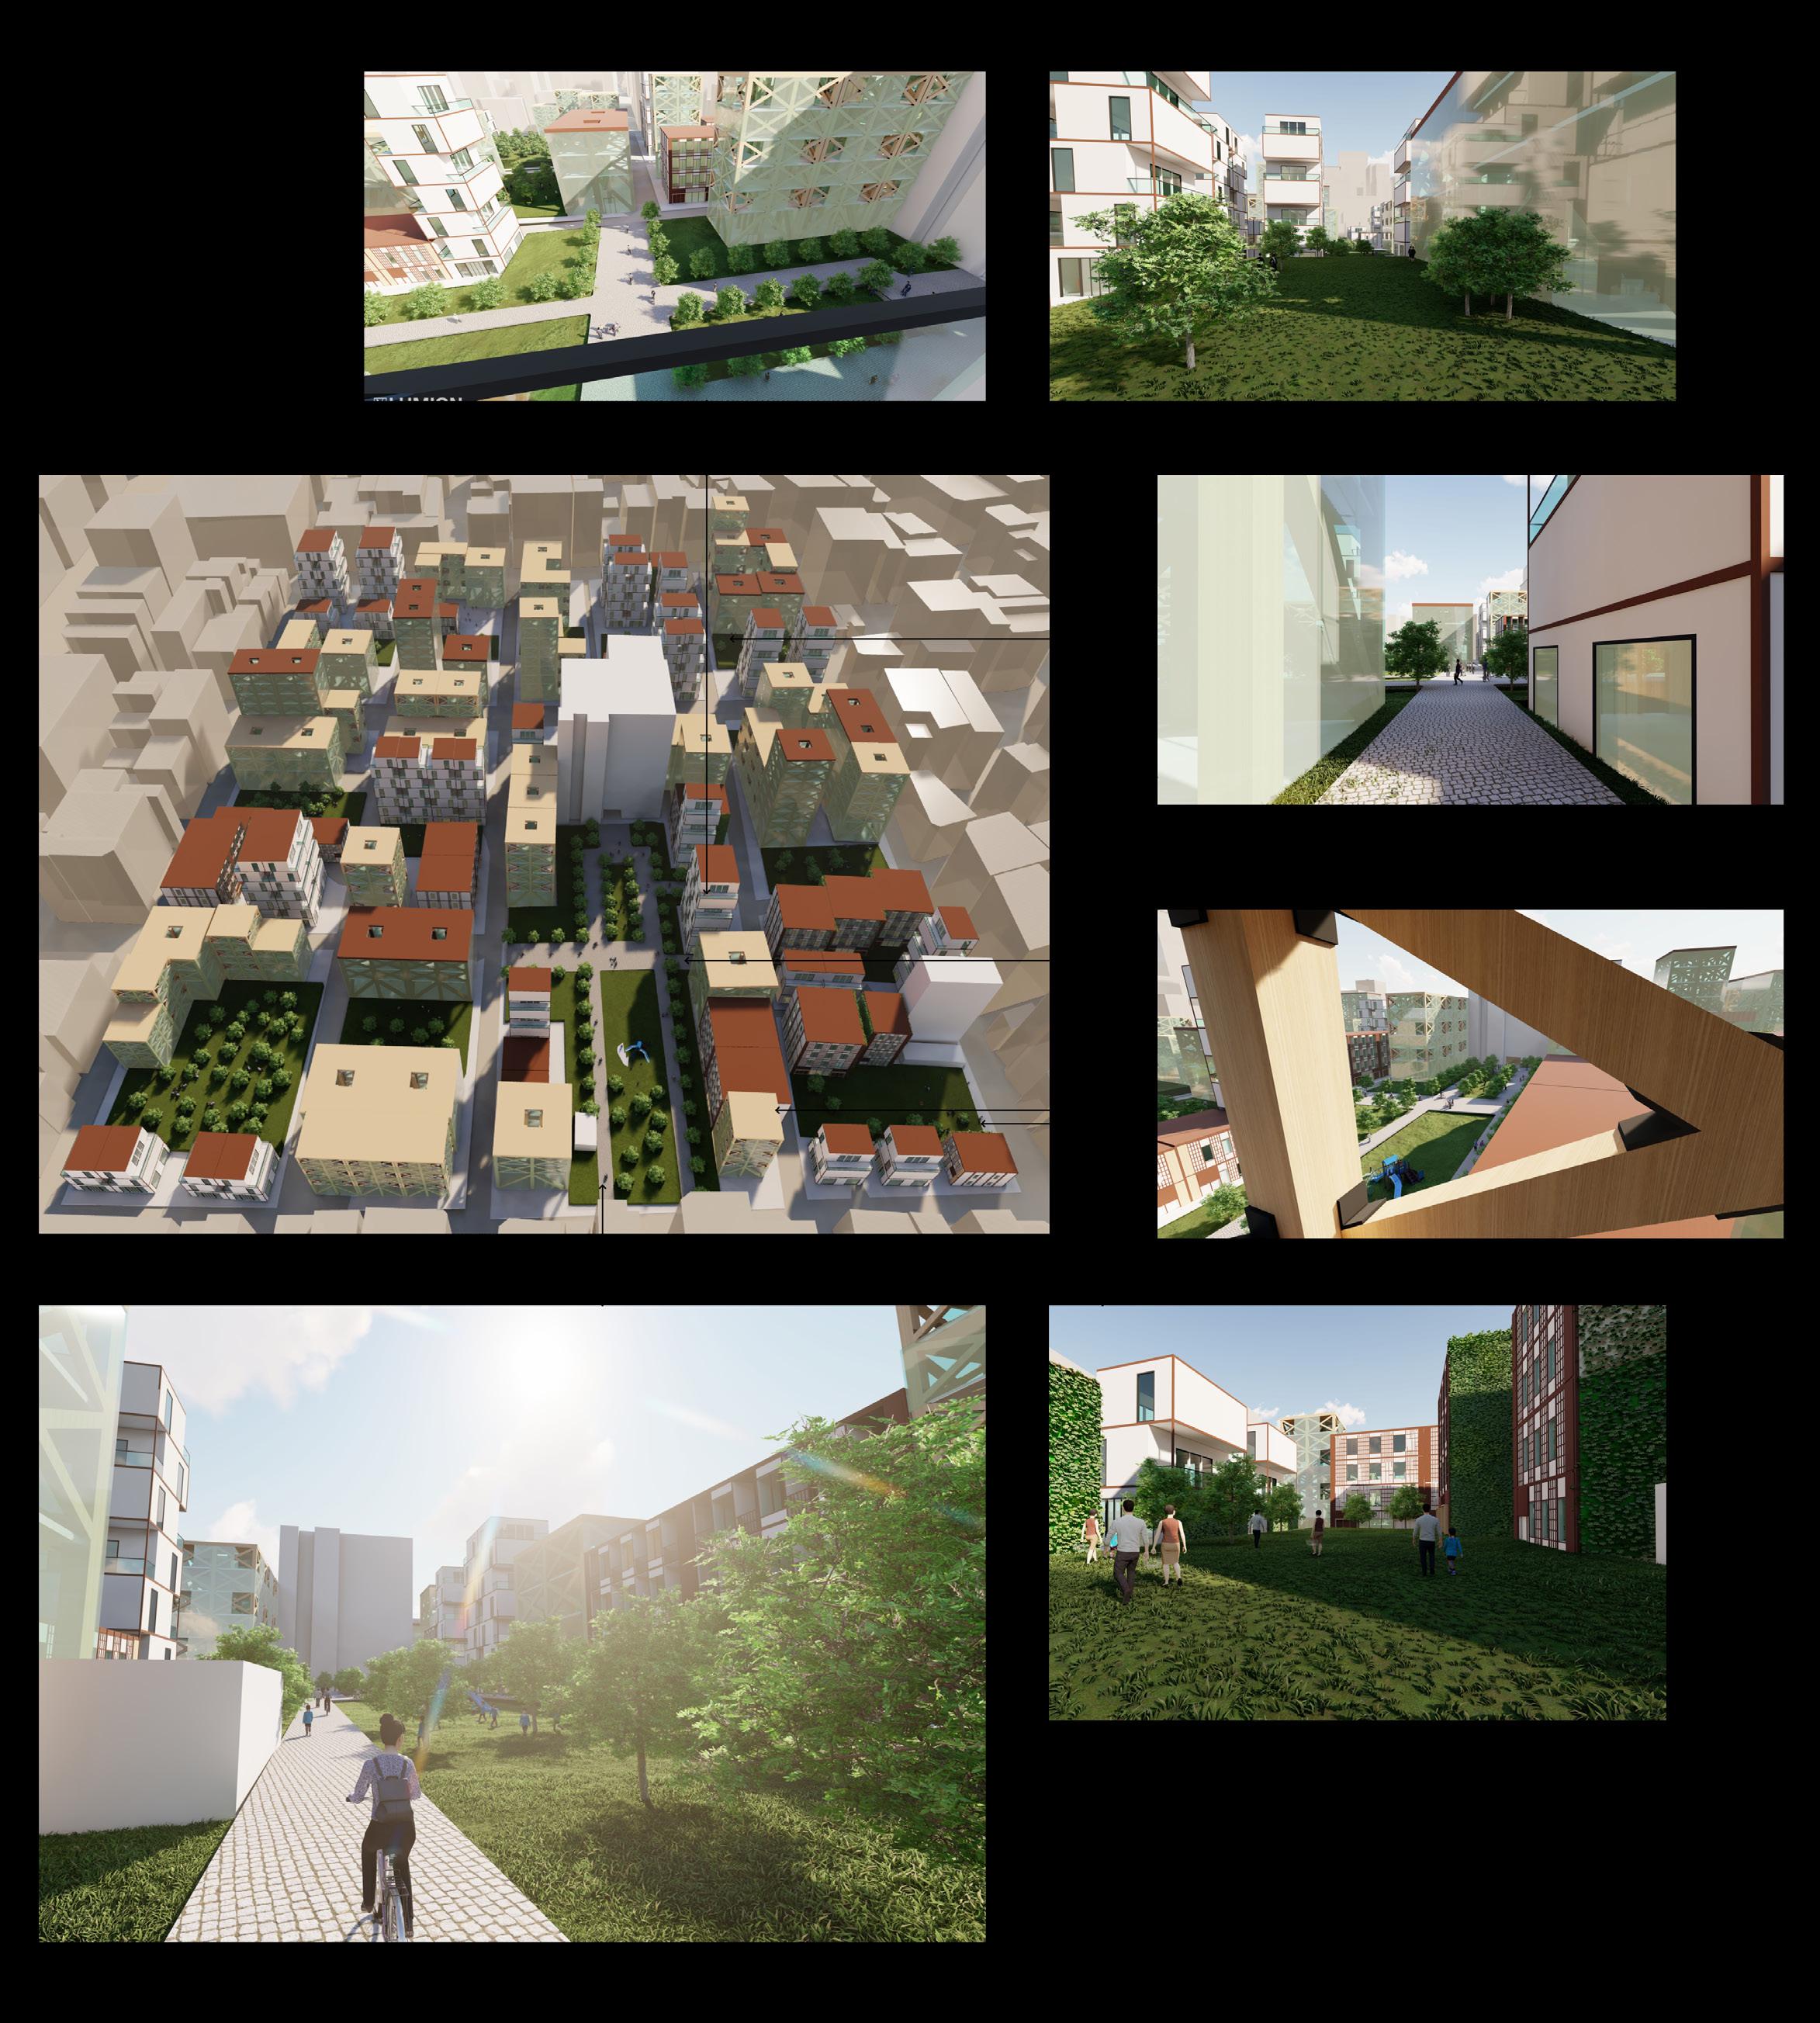
Nihonbashi, located in Chuo City, Tokyo, Japan, and the center of old Edo Tokyo, has become an area of high carbon and low community. The studio’s intent was to address these issues and Tokyo’s zero carbon goal. This project proposes an Eco-District: One-Minute City concept that is intended to have the ability to be duplicated throughout Tokyo and allow for the return to a more harmonious and balanced way of life The key proposition of this project is to create a multi-layered, mixed-use space that includes community areas, recycling, walk-ability, connectivity to neighbors, kids areas, garden spaces in each living unit, and maximum amount of daylighting in each space. There are also third spaces and the idea of having the buildings connected by bridges is that it can allow for quick and safe passage to a friend and allow for more community amongst those that wouldn’t normally be able to run into someone, like the elderly.
The design started with looking at the machiya, the Japanese shop house design, which is long like an eel’s bed, or a ‘unagi-no-nedoko’. It is an homage to the Edo period’s form of mercantile architecture that emphasized a narrow street-facing front, and resulted in a longer building extending to the back or center of the block. Space was limited and was used efficiently. The proposal takes the machiya styled apartments and follows the tatami mat room measurement style, from the Edo period. This then led to a conglomeration of stacked machiya-like apartments that were then arranged fit into buildings. The buildings were organized so that the first few floors would contain primarily street-faced retail and open office and residential on the remaining floors.
The benefits of having a one-minute city is that the people living in that superblock can reach what they need within a minute. Shopping, eating, socializing, health and medicine, laundry, and other items can be found within a very short period and without a car. This reduction of the use of cars is in direct relation to the increase in green house gas accumulation, and the heating of the earth. The minute city won’t have everything people need but what they need most.
GROUND FLOOR
CIRCULATION
TYPICAL RETAIL / OFFICE FLOOR
TYPICAL RESIDENTIAL FLOOR
GROUND FLOOR
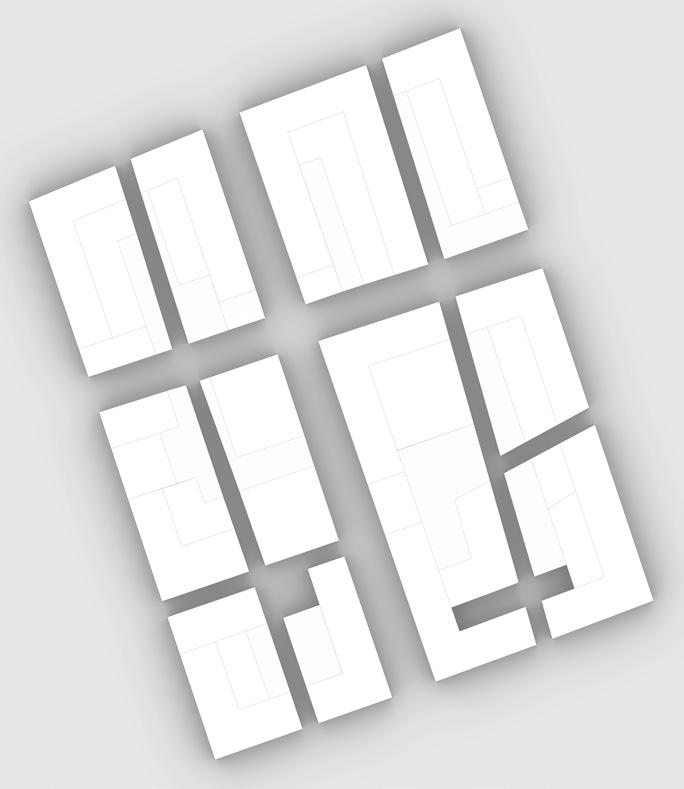


TYPICAL RETAIL / OFFICE FLOOR
TYPICAL RESIDENTIAL FLOOR


GROUND FLOOR
TYPICAL RETAIL / OFFICE FLOOR
BRIDGES & STREET CIRCULATION
GROUND FLOOR

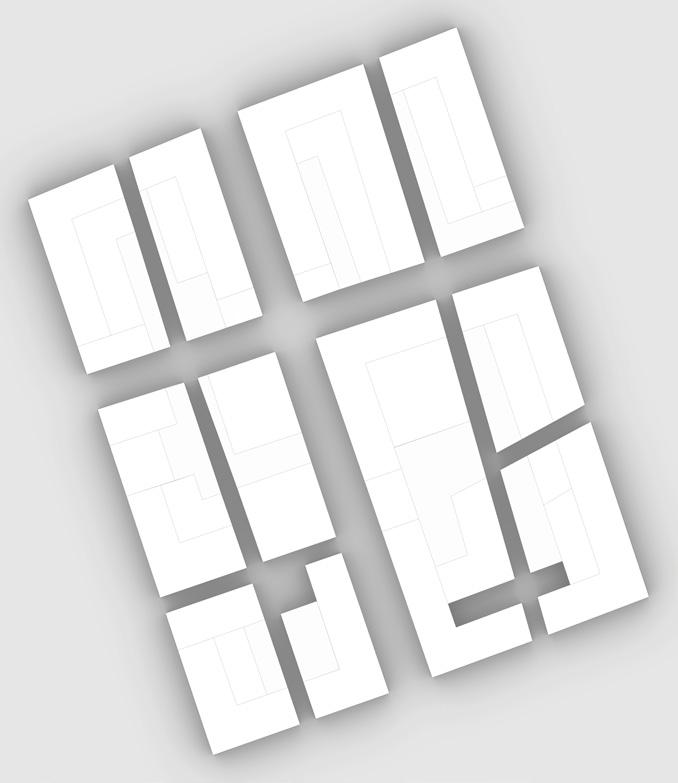
TYPICAL RETAIL / OFFICE FLOOR
TYPICAL RESIDENTIAL FLOOR
TYPICAL RESIDENTIAL FLOOR


KIDS AREA
VERTICAL CIRCULATION
BEDROOM
BATHROOM
LIVING ROOM
KITCHEN DINING ROOM
GARDEN SPACE (tsuboniwa)
CONNECTION BRIDGES
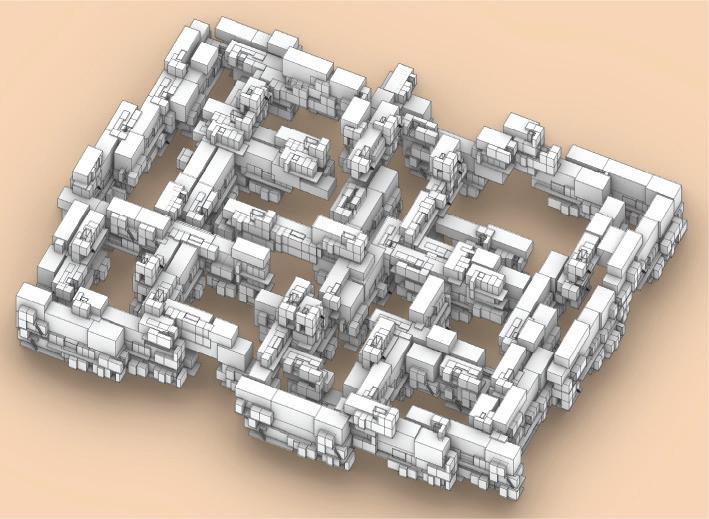
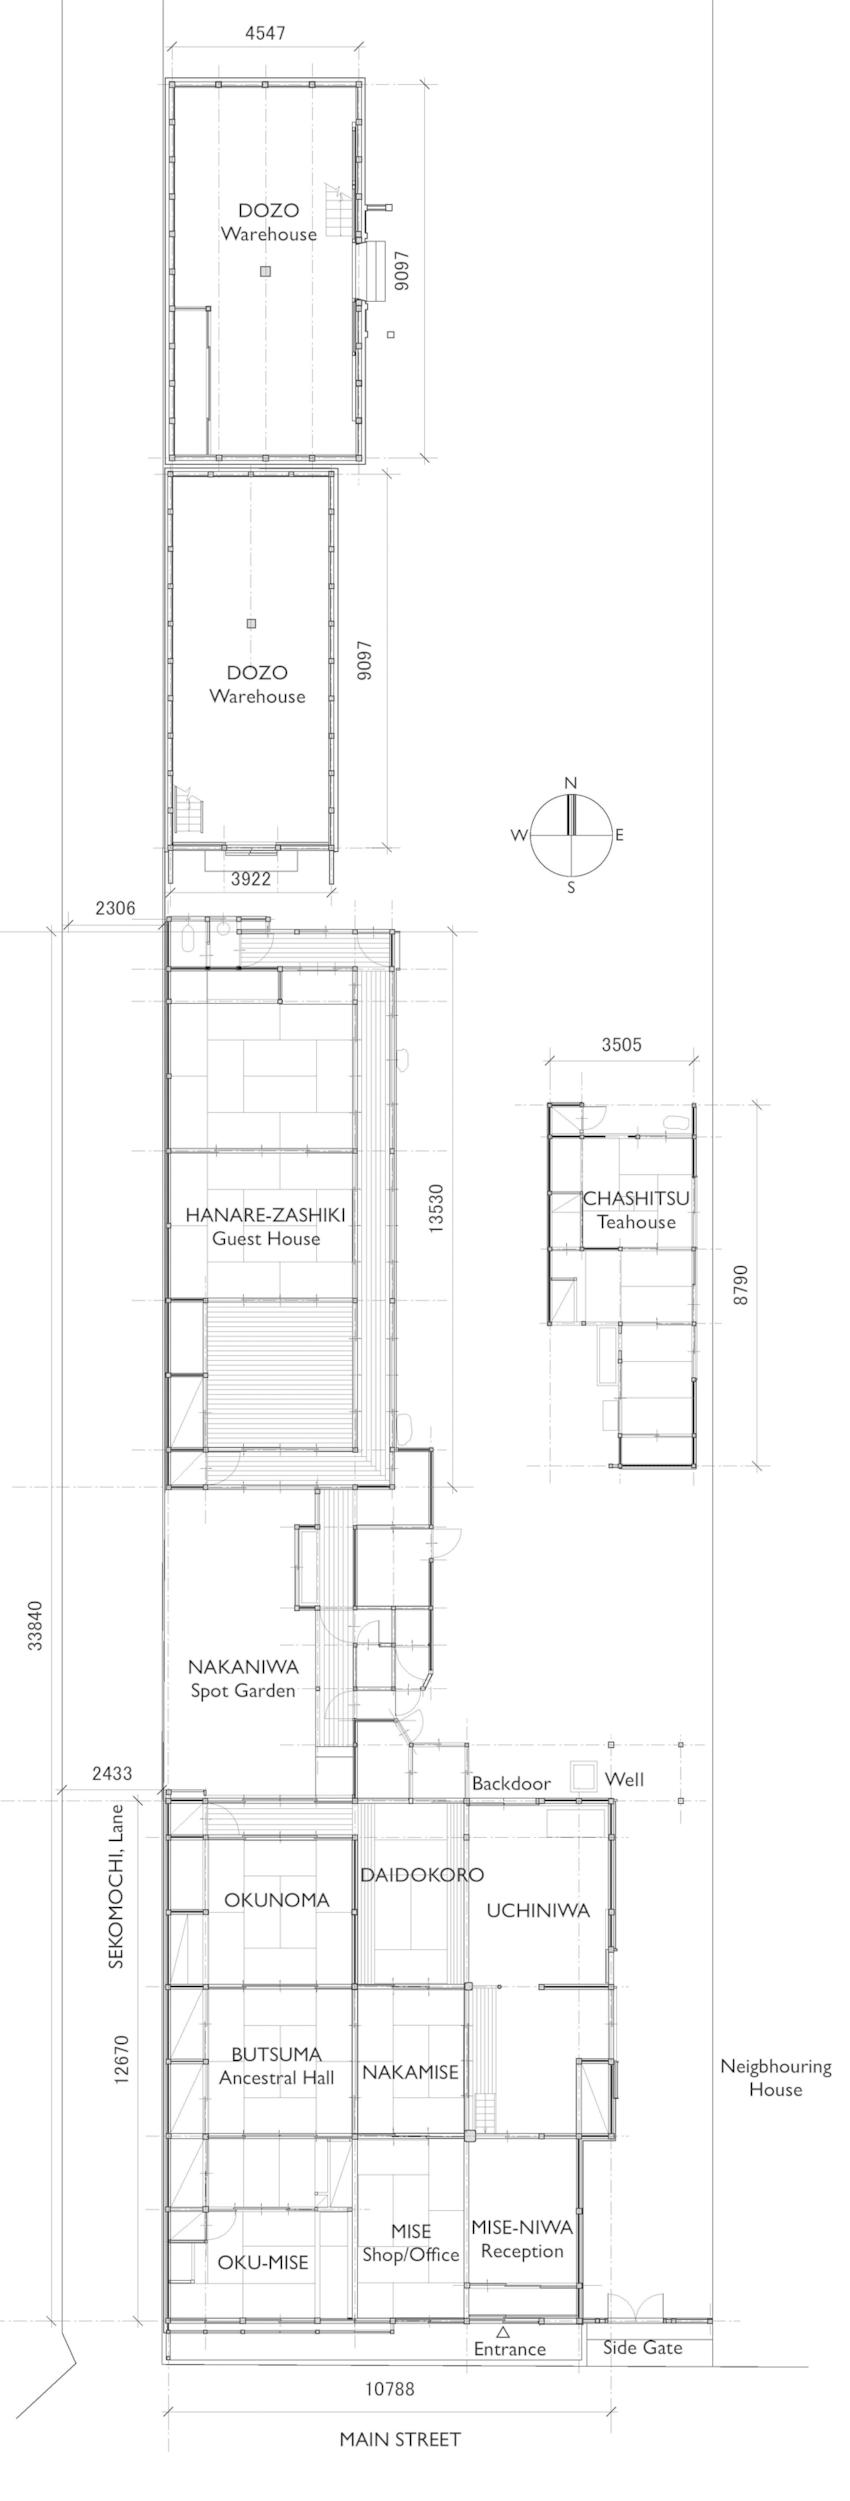
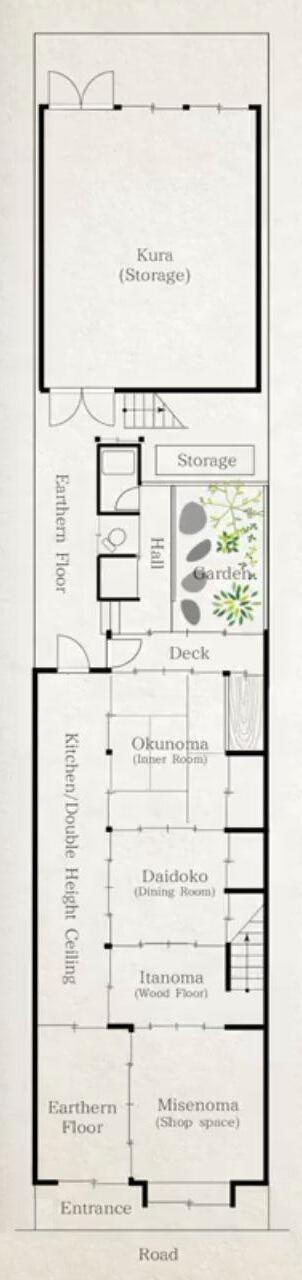
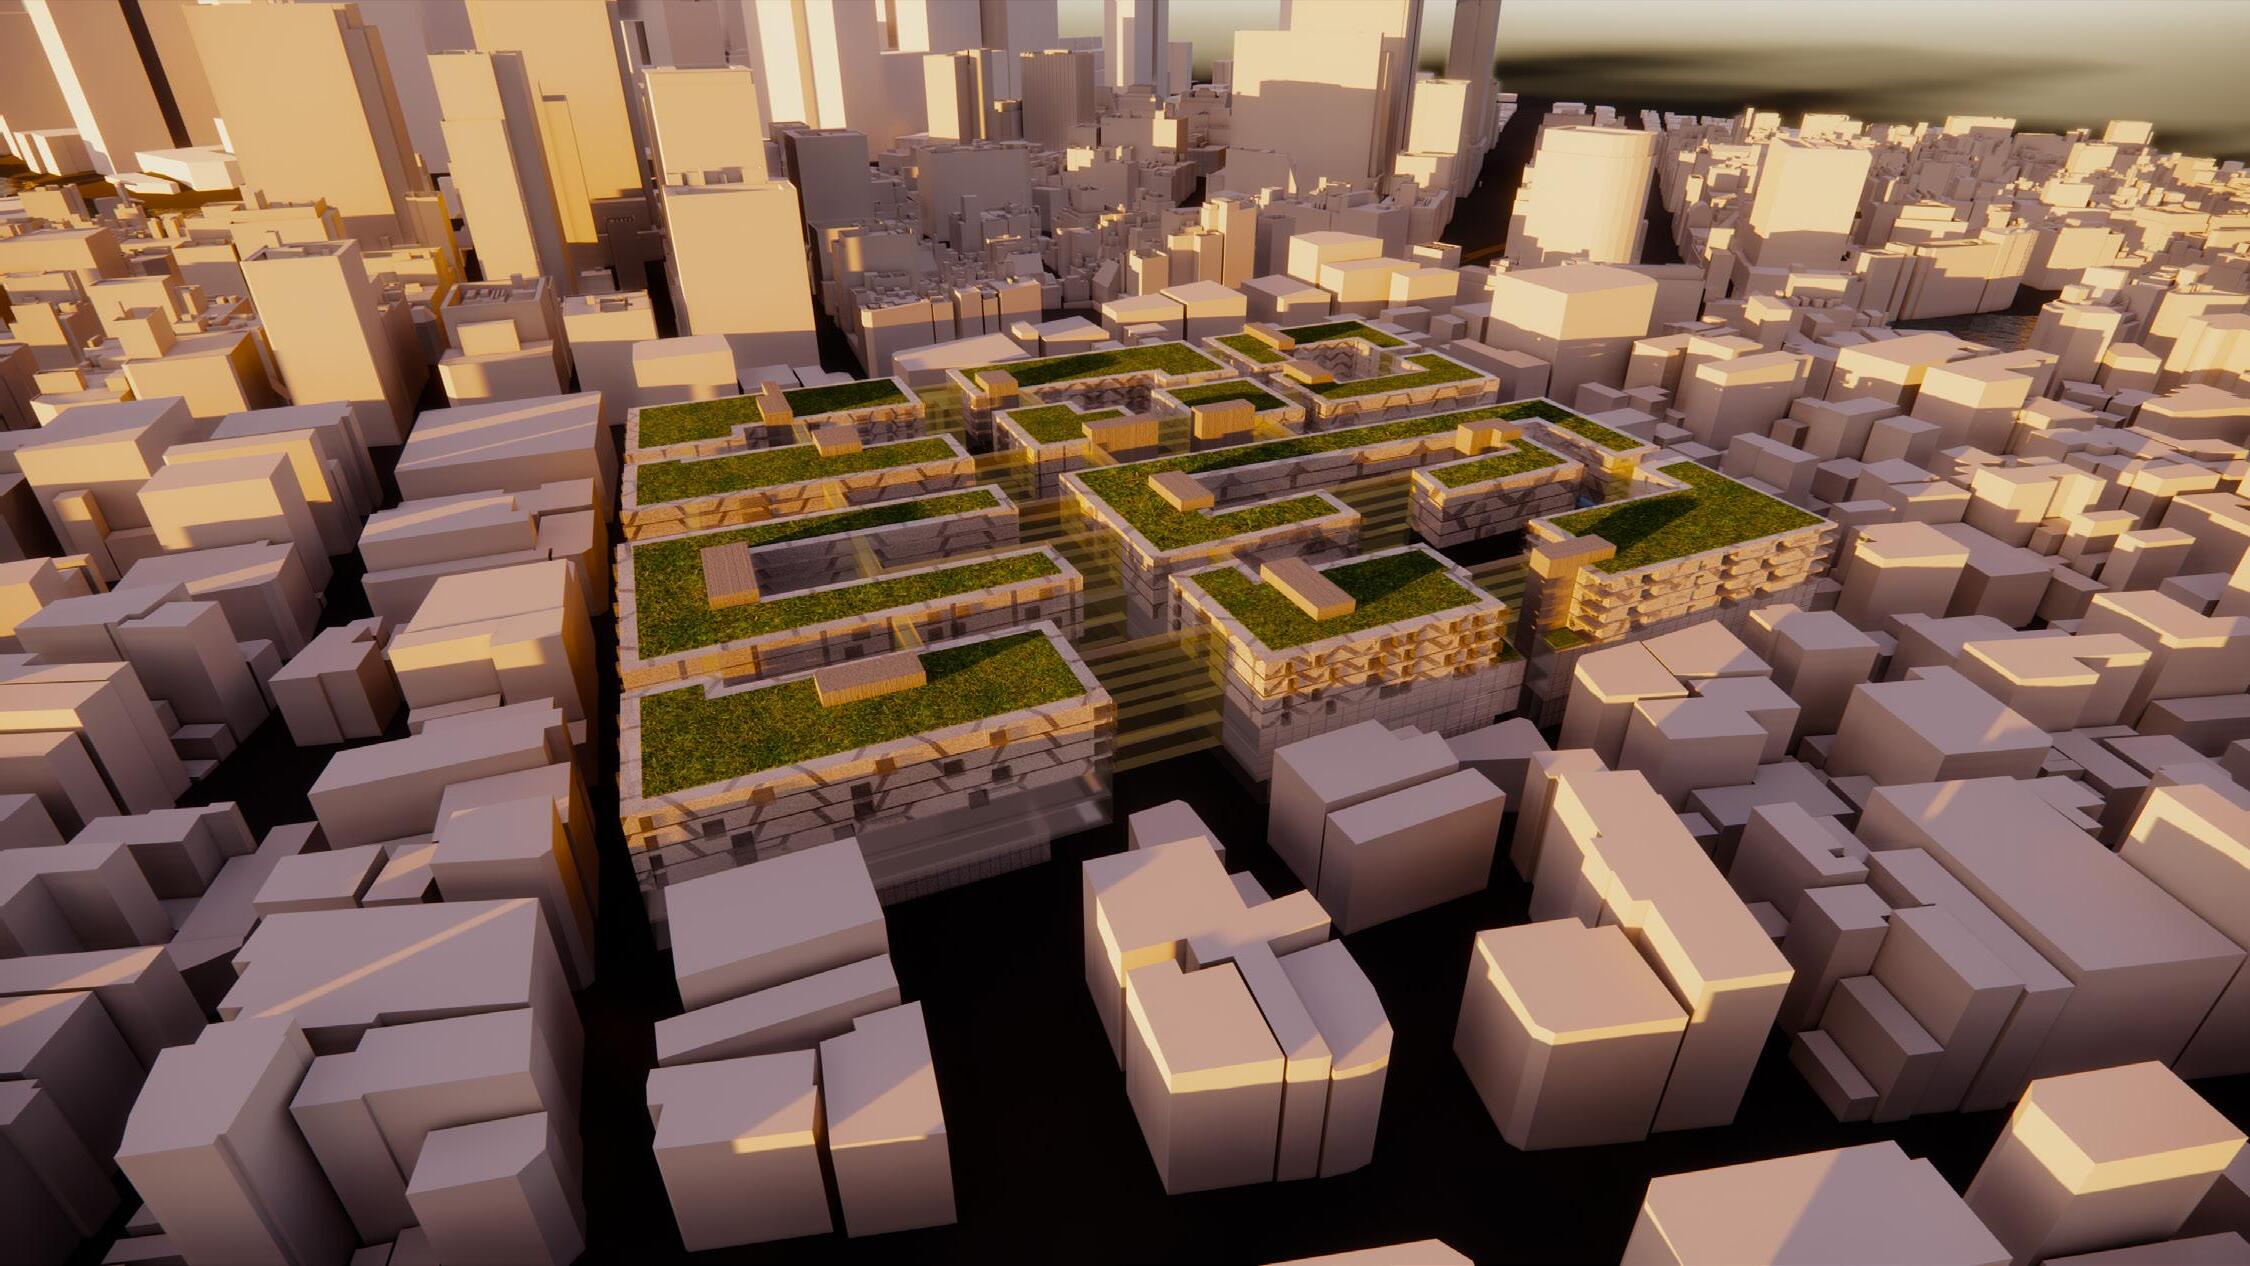
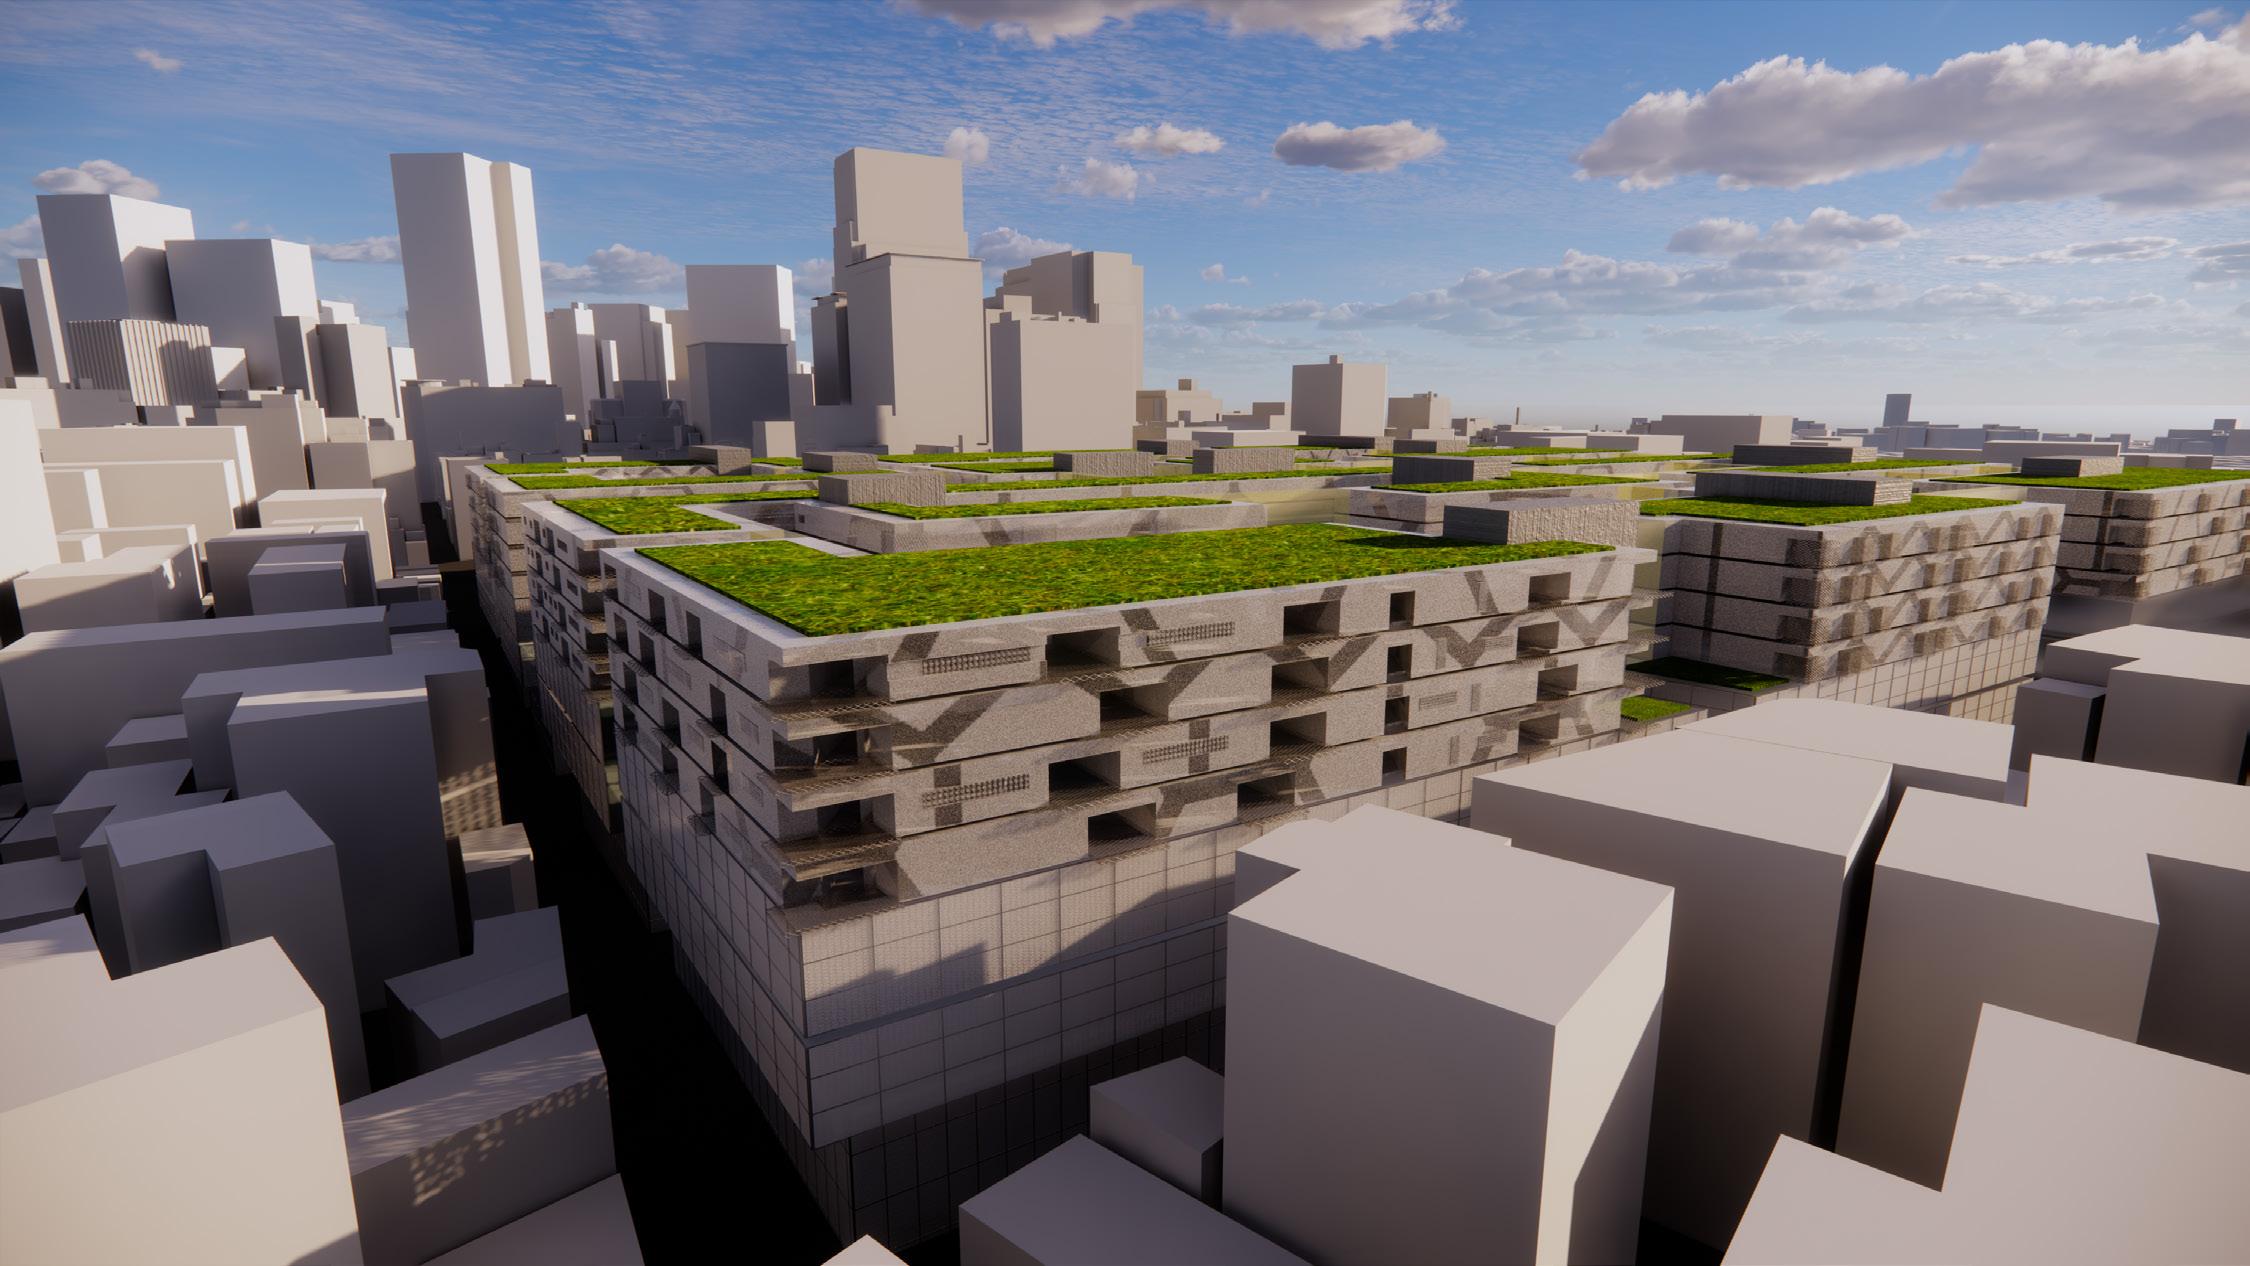
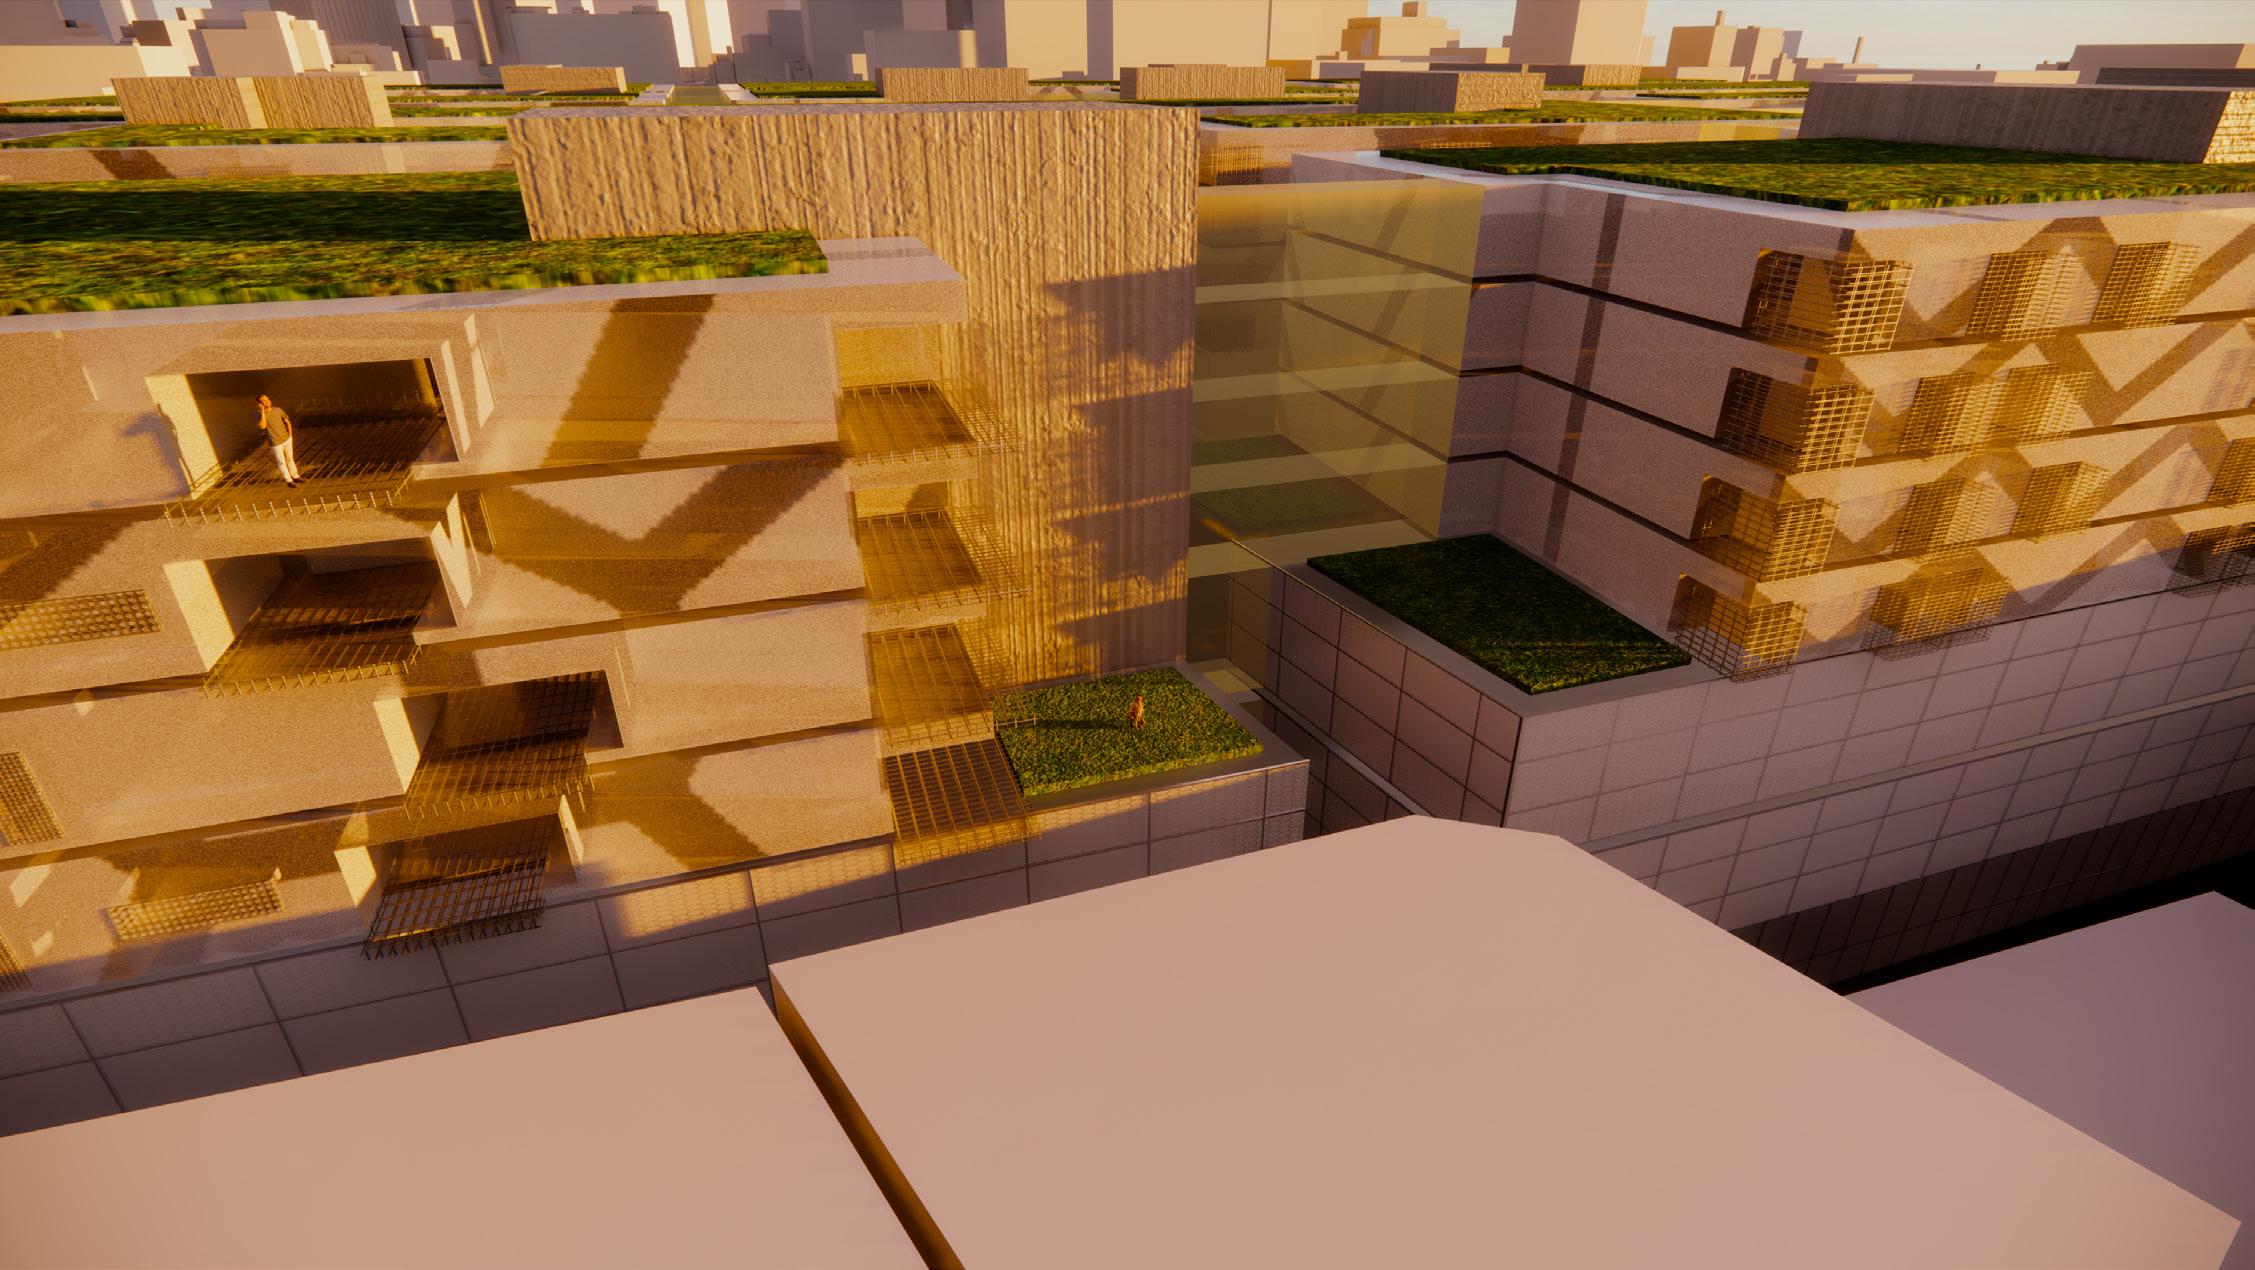
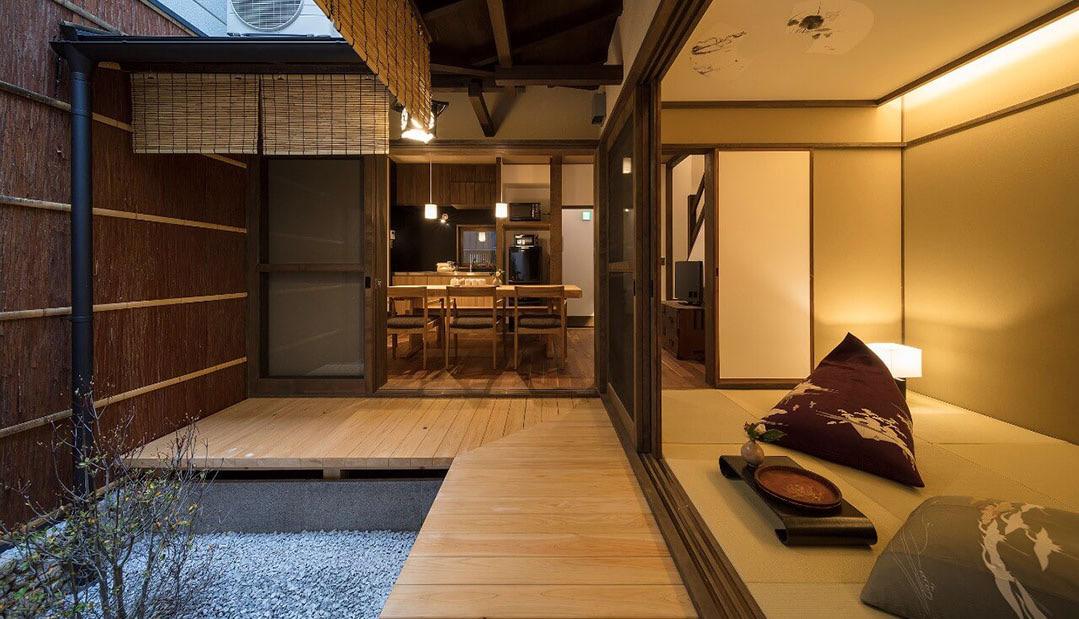
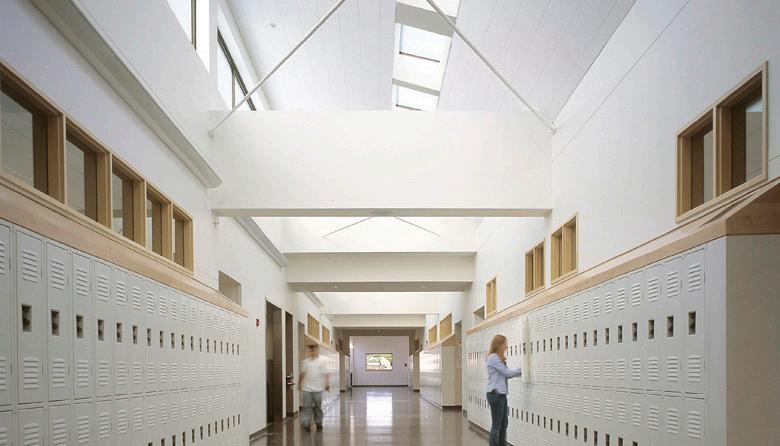
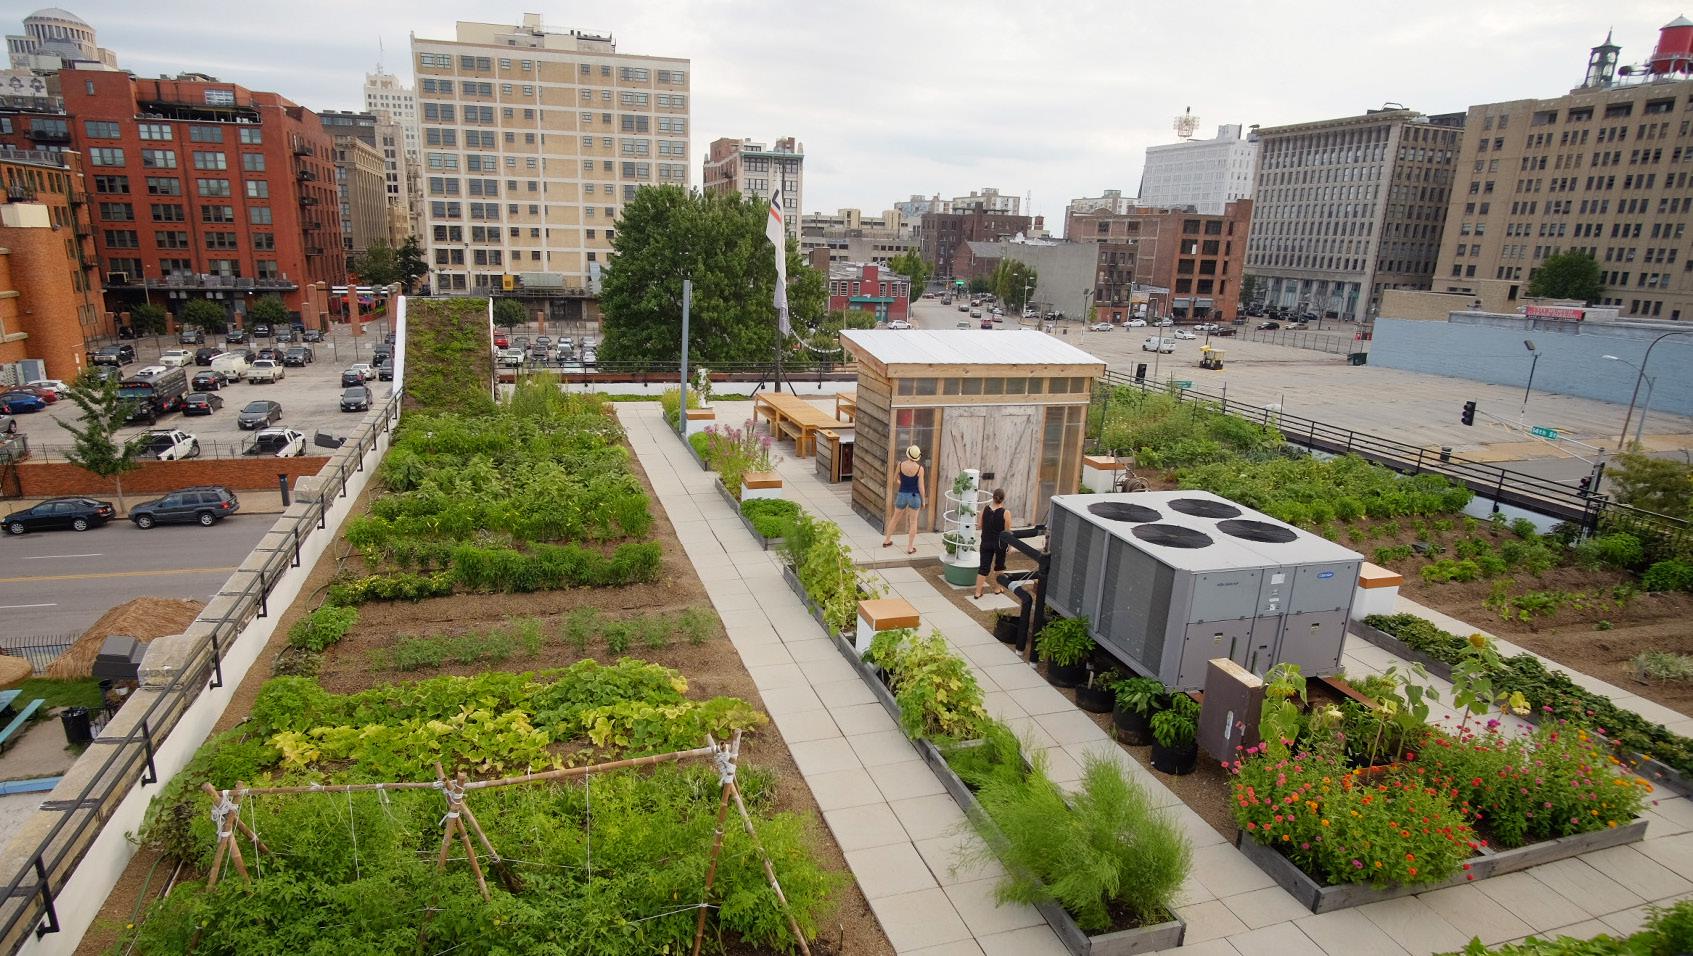
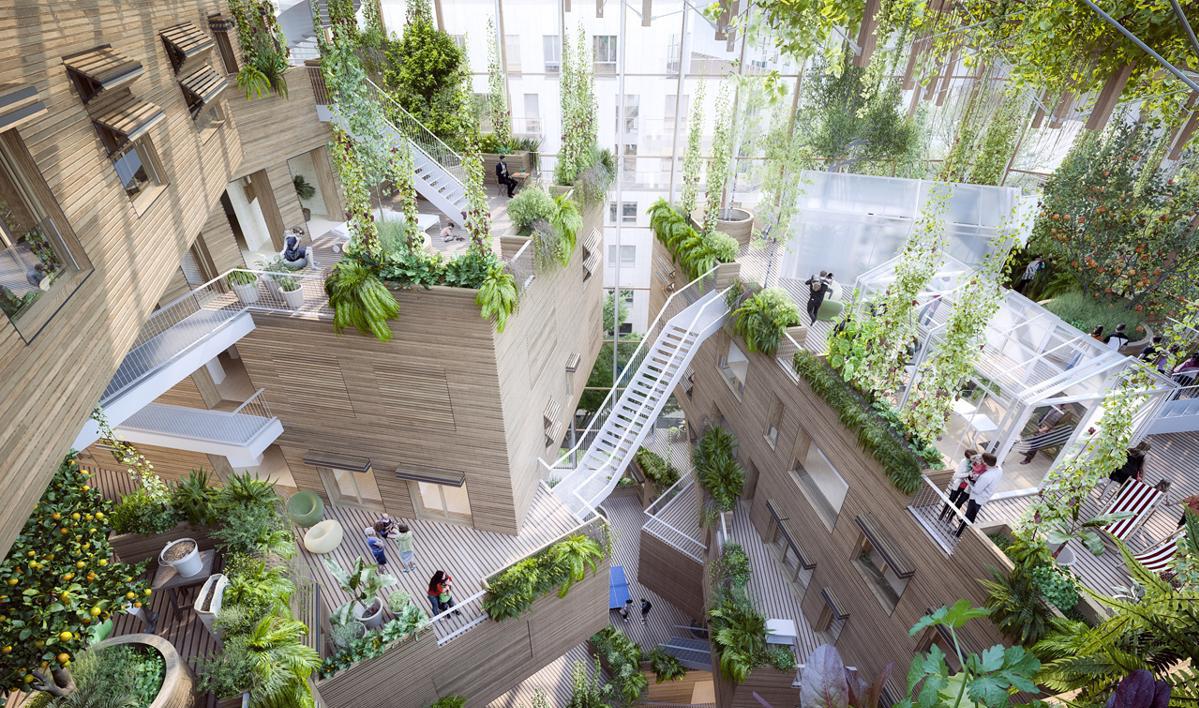
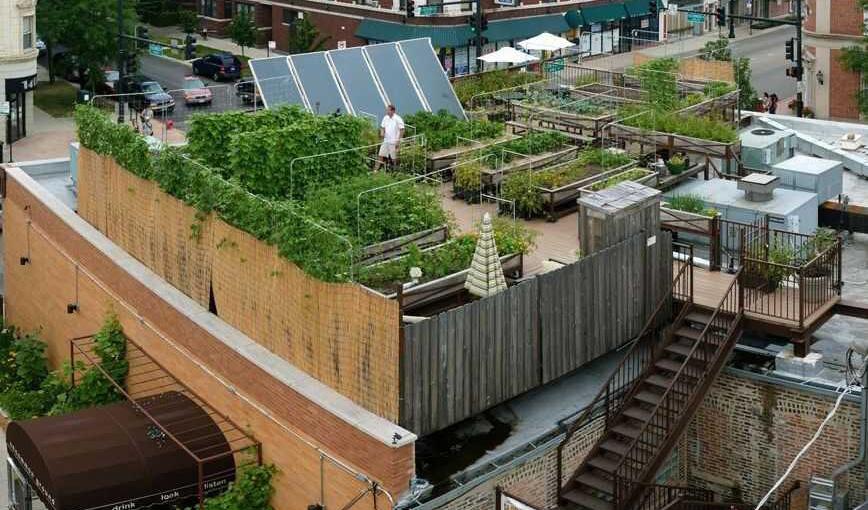
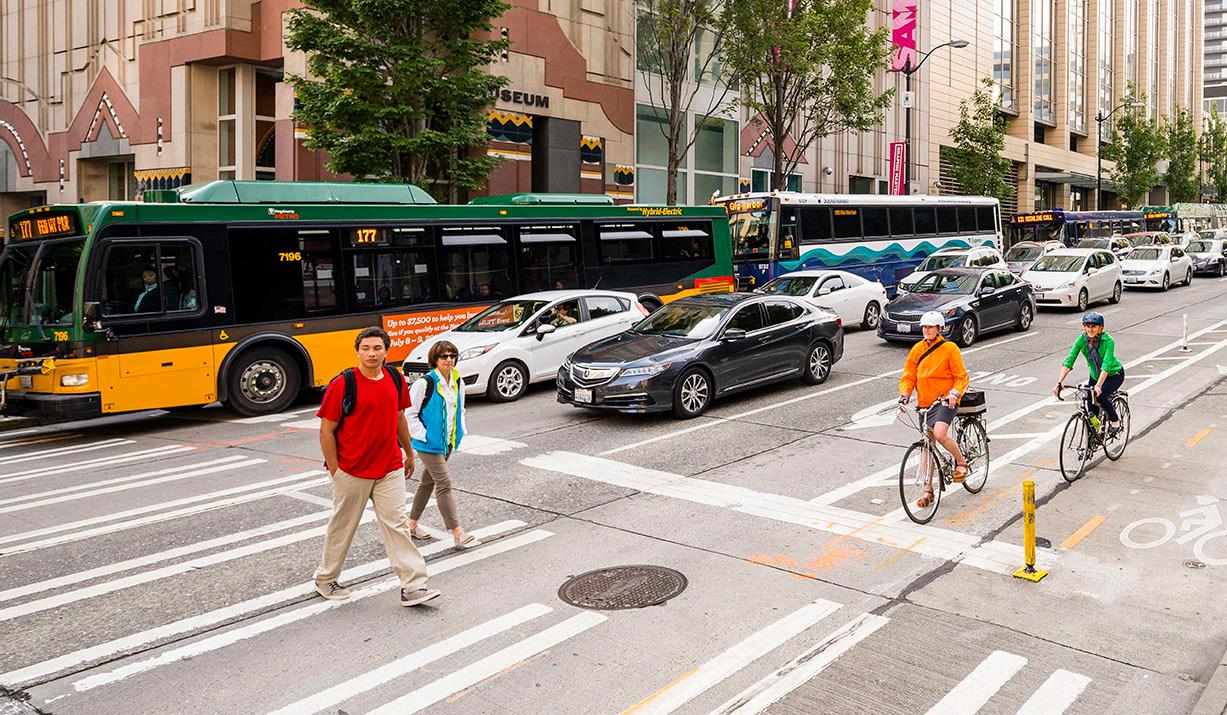
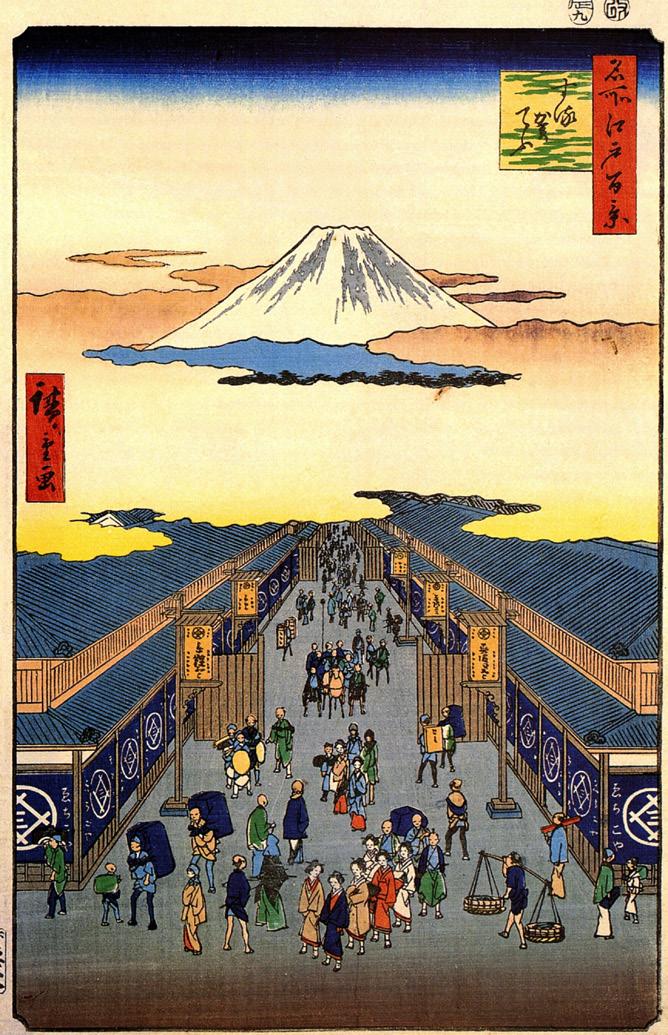
figure 1:
Stations One: Morning View of Nihonbashi
ca. 1833–34
Utagawa Hiroshige
https://www.metmuseum.org/art/collection/search/36922
figure 2:
Kyo-Machiya Floorplan (typical)
Published: Jul 22, 2020 by Moon-Shadow-1985
https://www.deviantart.com/moon-shadow-1985/art/Kyo-Machiya-Floorplan-typical-849589643
figure 3: Erik Olsen
@HardFastAndFree
10:56 AM · Jun 20, 2020·Twitter Web App
https://twitter.com/HardFastAndFree/status/1274355369616302080
figure 4:
“Experience “Live Like a Local” staying in Kyo-machiya”
https://www.tabido.jp/en-us/article/919/
TABIDO Last Updated : 2019.2.20
figure 5:
Food Roof Farm
Urban Harvest STL
https://www.urbanharveststl.org/food-roof-farm
figure 6: Clackamas High School
Boora Architects
Clackamas, Oregon, United States
Credit: Michael Matthers
figure 7:
https://tooledesign.com/expertise/multimodal-transportation-plans/
figure 8: “Rooftop Farming is Getting Off the Ground”
https://www.npr.org/sections/thesalt/2013/09/24/225745012/why-aren-t-there-more-rooftop-farms
September 25, 2013
10:48 AM ET
Eliza Barclay
figure 9: MVRDV Architects
https://www.mvrdv.nl/themes/6/sustainability proposal for La Serre d’Issy in Paris
 By Usha Menon, Athulya
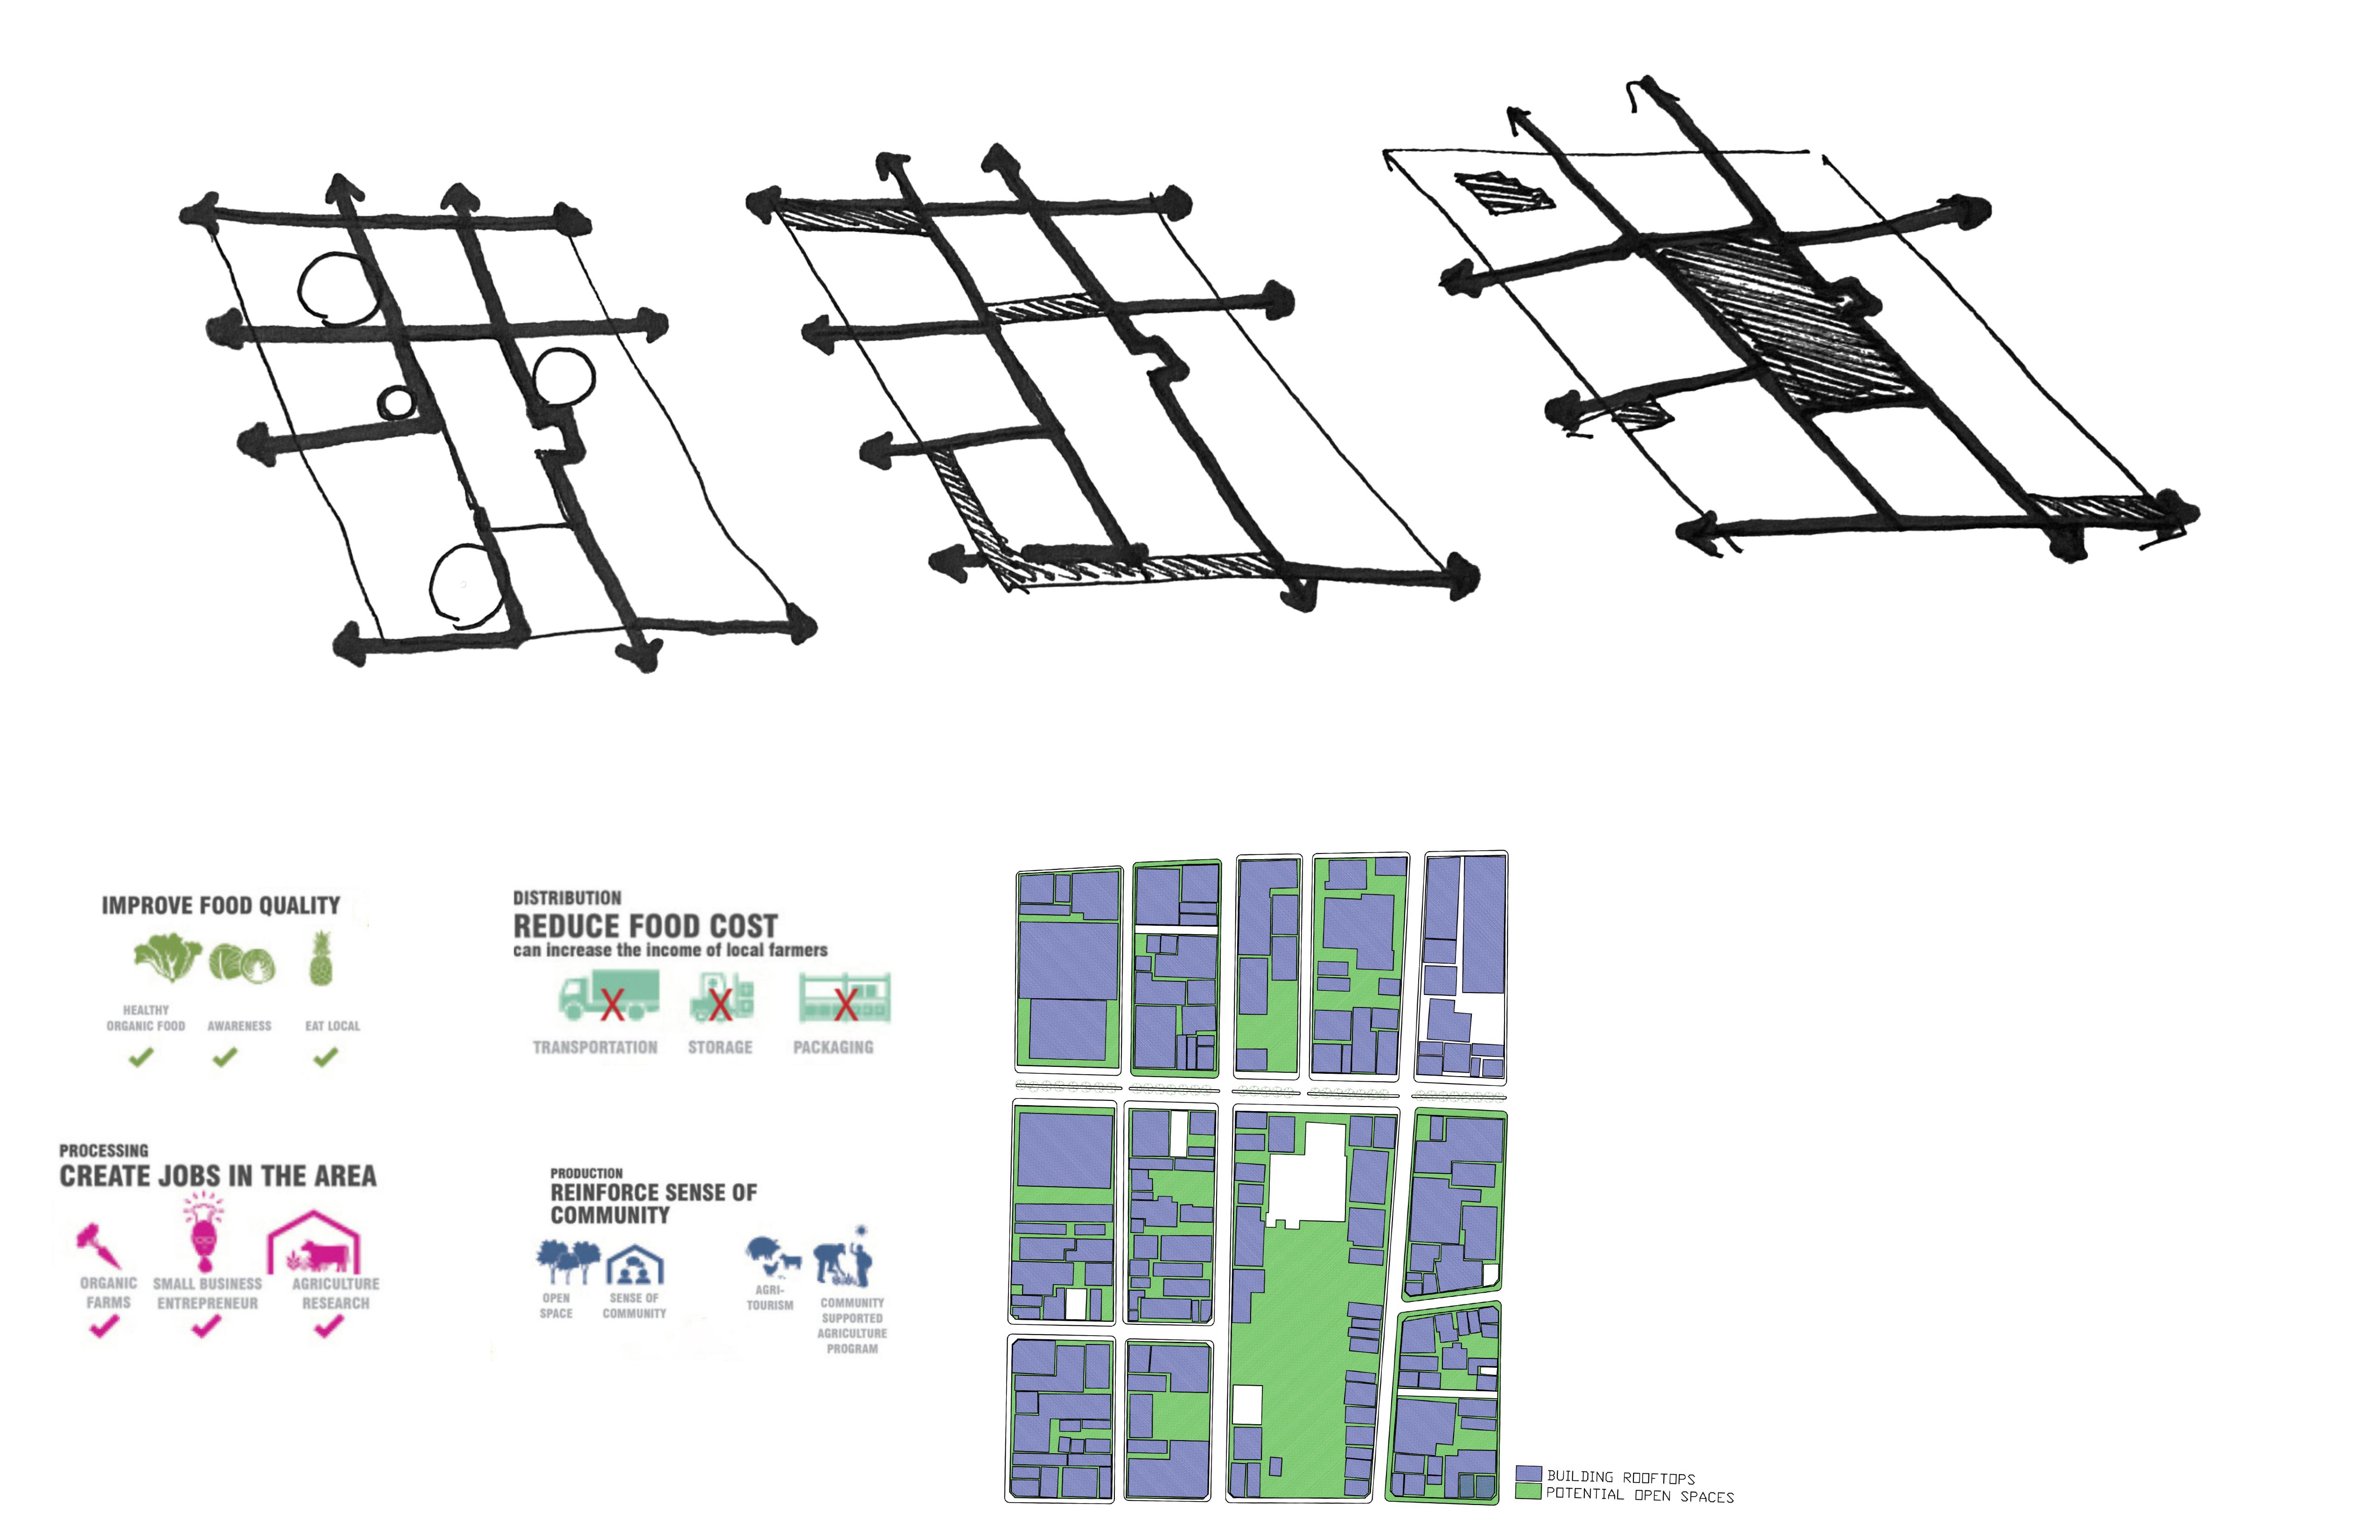
Despite being a highly industrialized country, one-third of Japan’s agricultural output is generated by urban agriculture. Source of fresh and safe products, including organic and low-chemical crops, that are increasingly demanded by urban consumers. In Tokyo, one of the largest and most congested cities in the world, among the intricate networks of railways, roads, buildings and power wires, local agriculture produces enough vegetables to potentially feed almost 700,000 city dwellers.
Horidome park
Office Units with potential roof spaces
Residential units with potential private garden and balcony spaces
Hotels with potential roof spaces for events and agriculture
Hospital
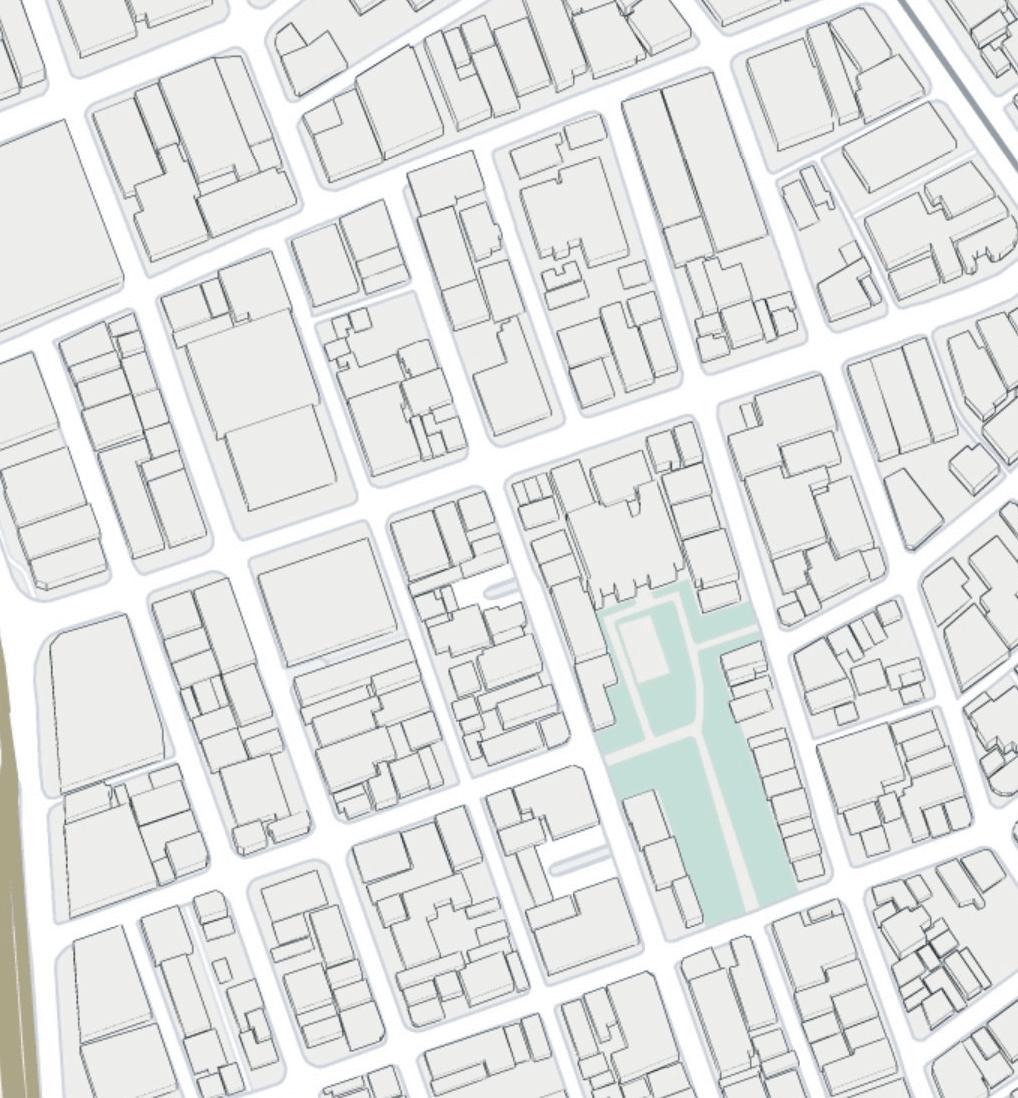
Potential open spaces for CPULs currently surface parking
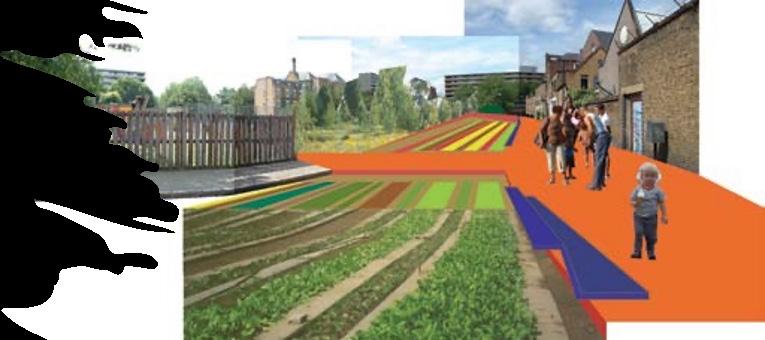
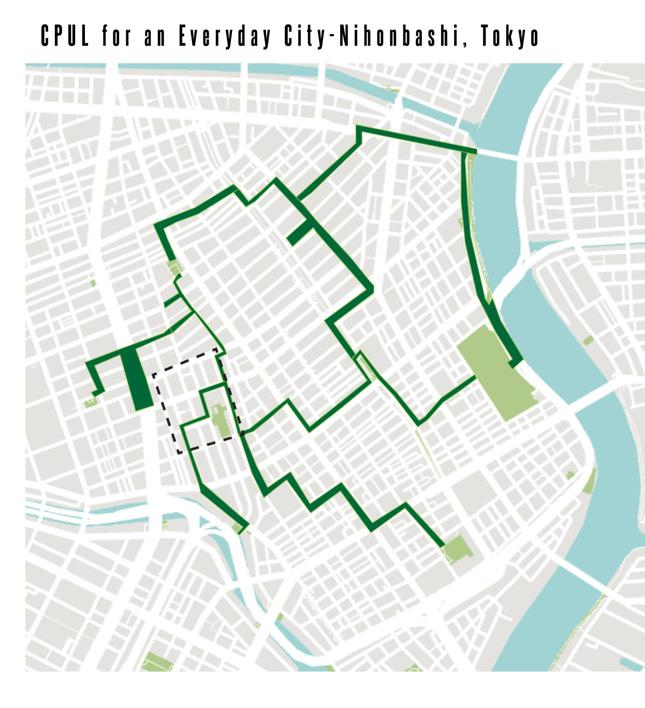
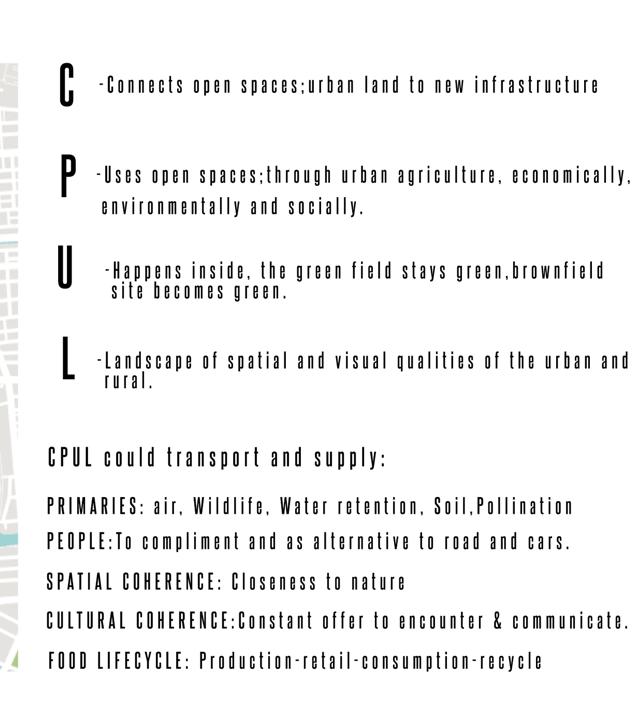
CPUL is a strategy for the coherent integration of urban agriculture into urban space planning. Coined by prolific architects and natural urbanism advocates, Andre Viljoen and Katrin Bohn. (Below) Munton Road, London, before and after implementing a CPUL. In this proposal, the road, which is lightly used by vehicles, would be converted into an urban agricultural field surrounded by cycle and pedestrian ways. From Bohn&Viljoen Architects.


EXISTING ISSUES:
KEY PROBLEMS:
Large swathes of hardscape, absence of green interventions increases urban heat island effect. Absence of connectivity with abutting streets.
INTEGRATION OF GREEN INFRASTRUCTURE METRIC TO EXPLAIN REMEDIATION STRATEGIES:
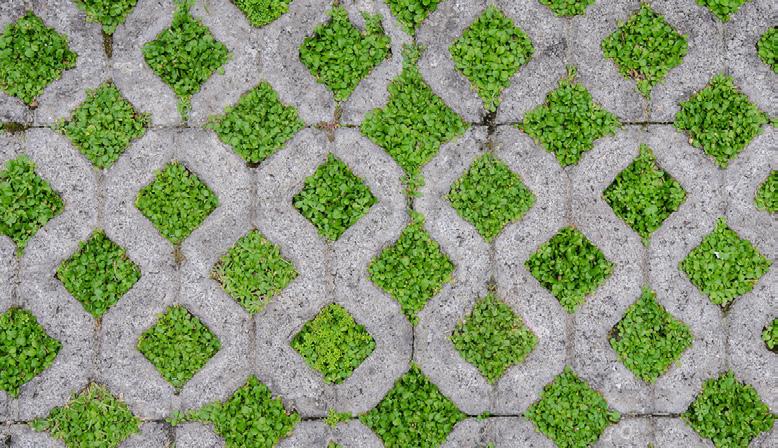
Ecosystem Benefits: Reduces stormwater runoff, reduces heat island, reduces flooding and erosion.
Economic Benefits: Saves money on water management
Community Benefits: Enhances urban streetscape.
Downspout Disconnection- Preventing sewer system overflows, redirecting runoff to rain barrels/ cisterns- reuse water for landscape and other uses.
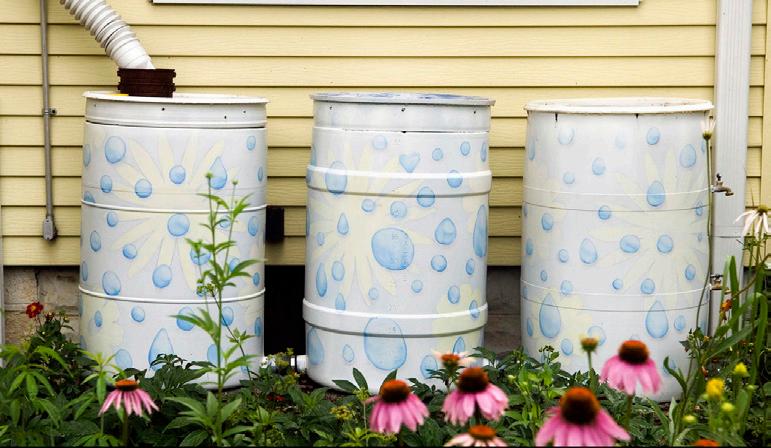
Ecosystem Benefits: Reduces stormwater runoff.
Economic Benefits: Saves money on water management
Community Benefits: Enhances urban streetscape.
Reconfigure Parking (planters for Bio-Retention, partial infiltration), Use of Native plants
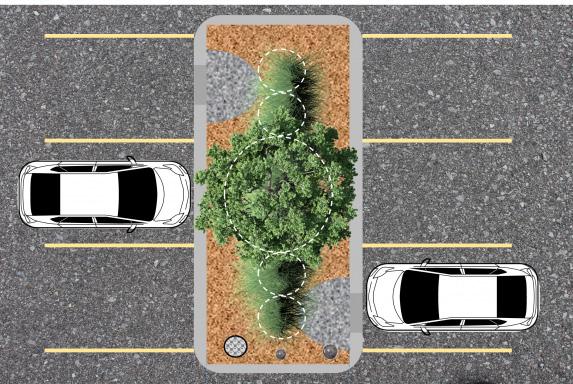
Ecosystem Benefits: Reduces stormwater runoff. Reduces flooding and erosion, reduces CO2, Cleans the air.
Economic Benefits: Saves money on water management
Community Benefits: Enhances urban streetscape.
KEY MAP DEAD PARKING LOTS AND BUILDING REARS FACING MAIN STREETS.B. RETHINKING BUILDING FRONTS TO INTEGRATE LANDSCAPE ECOLOGICAL INTERVENTIONS
EXISTING ISSUES:

Streetscape Development Opportunities for Nihonbashi District 2 Neighborhood
KEY PROBLEMS:
Open space surrounding skyscrapers. Presence of many undeveloped temporary open spaces.
INTEGRATION OF GREEN INFRASTRUCTURE METRIC TO EXPLAIN REMEDIATION STRATEGIES:
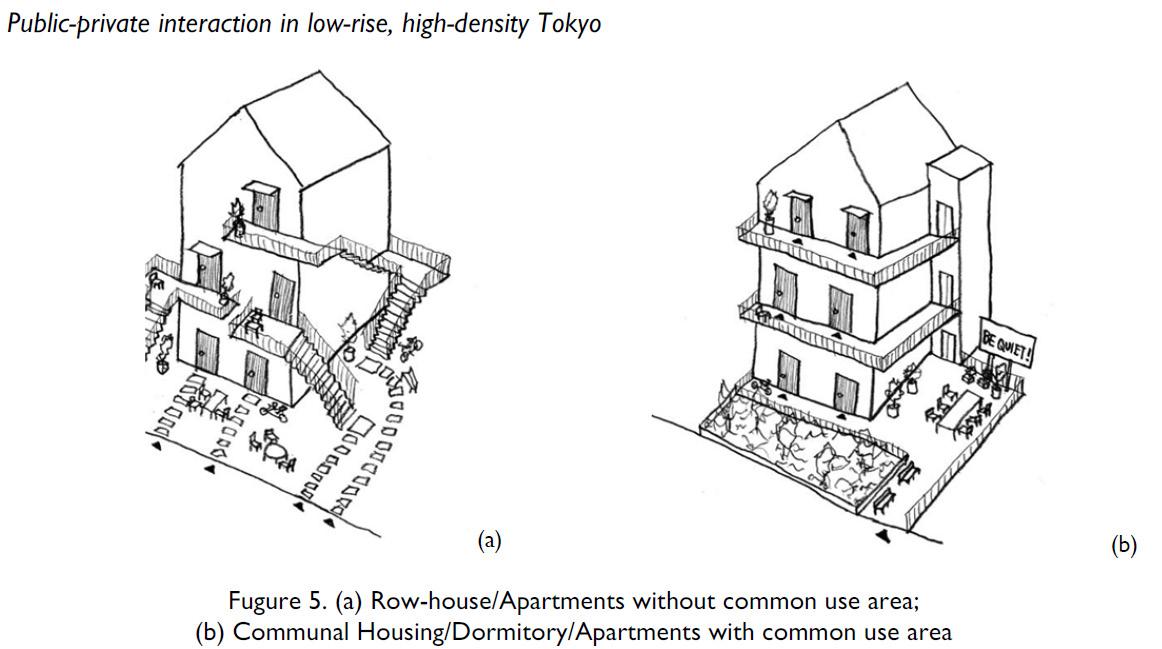
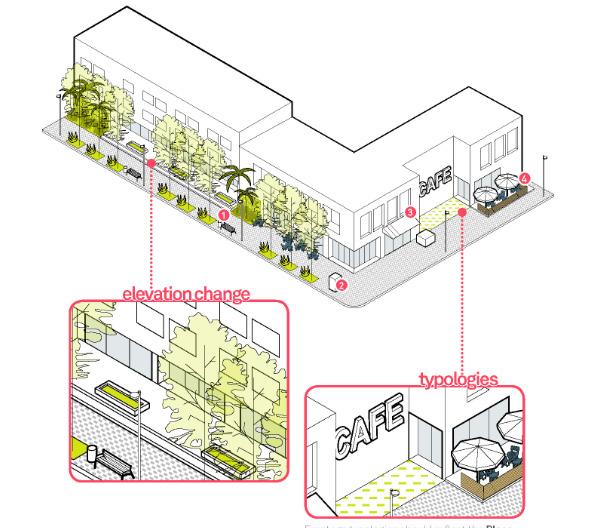
Architecture connects the public realm with the Private realm.
Access and openings shape this connection and add to the identity and experience of the pedestrians.
Streetscape Development Opportunities for Nihonbashi District 2 Neighborhood
Source: Coastal Florida Design and Construction Manual
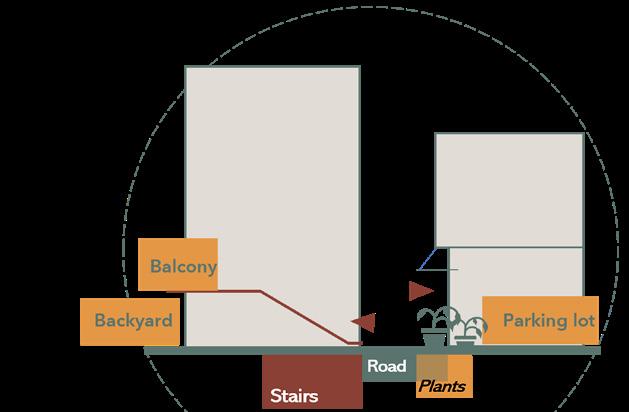
Elevational changes as a result of designing for flood events can alter this connection and should be done without losing the connection.
Architectureconnectsthe public realm with the Private realm.Access and openingsshape this connection and add to theidentityandexperience of thepedestrians. Elevationalchanges as aresult of designing forflood eventscan alter this connection and should be done without losing theconnection.
Frontage typologies should reflect the Place
And Identity while being appropriate for the immediate public realm.


1. Manage Stormwater and Urban Runoff: Bio Retention Planters, Street Trees and Living Infrastructure.
2. Reducing Clutter in ROW while enabling access: Integration of utilities, infrastructure integrated into building frontages through Alcoves and Setbacks.
3. Shading Devices: Overhangs, Trees, Shading Devices that add to the identity of the place.
4. Seatings, Cafes: Connections to the public realm.

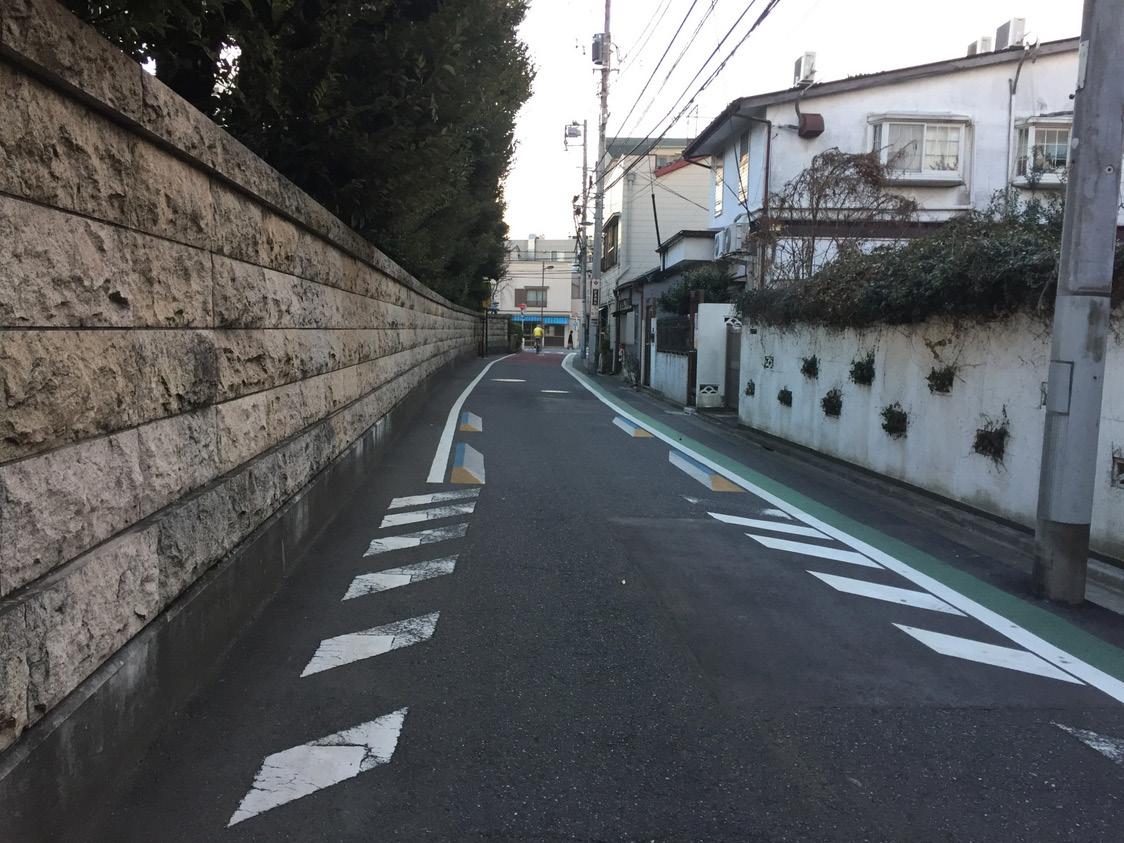
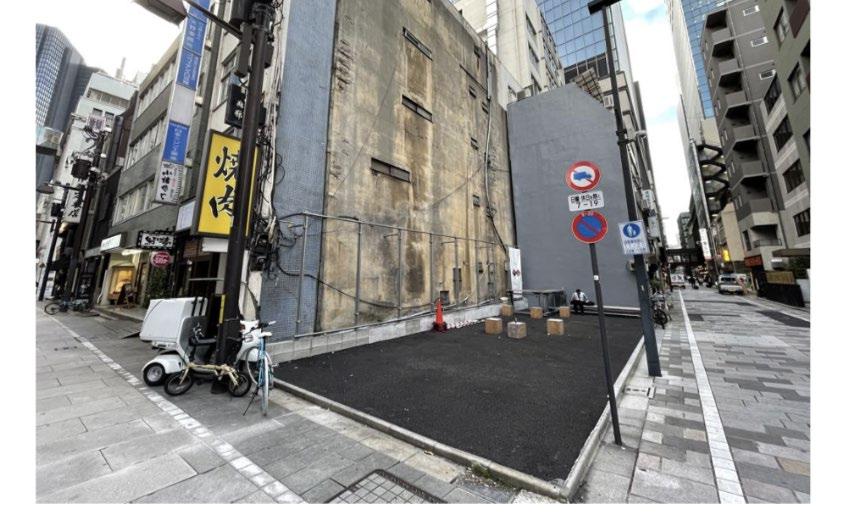
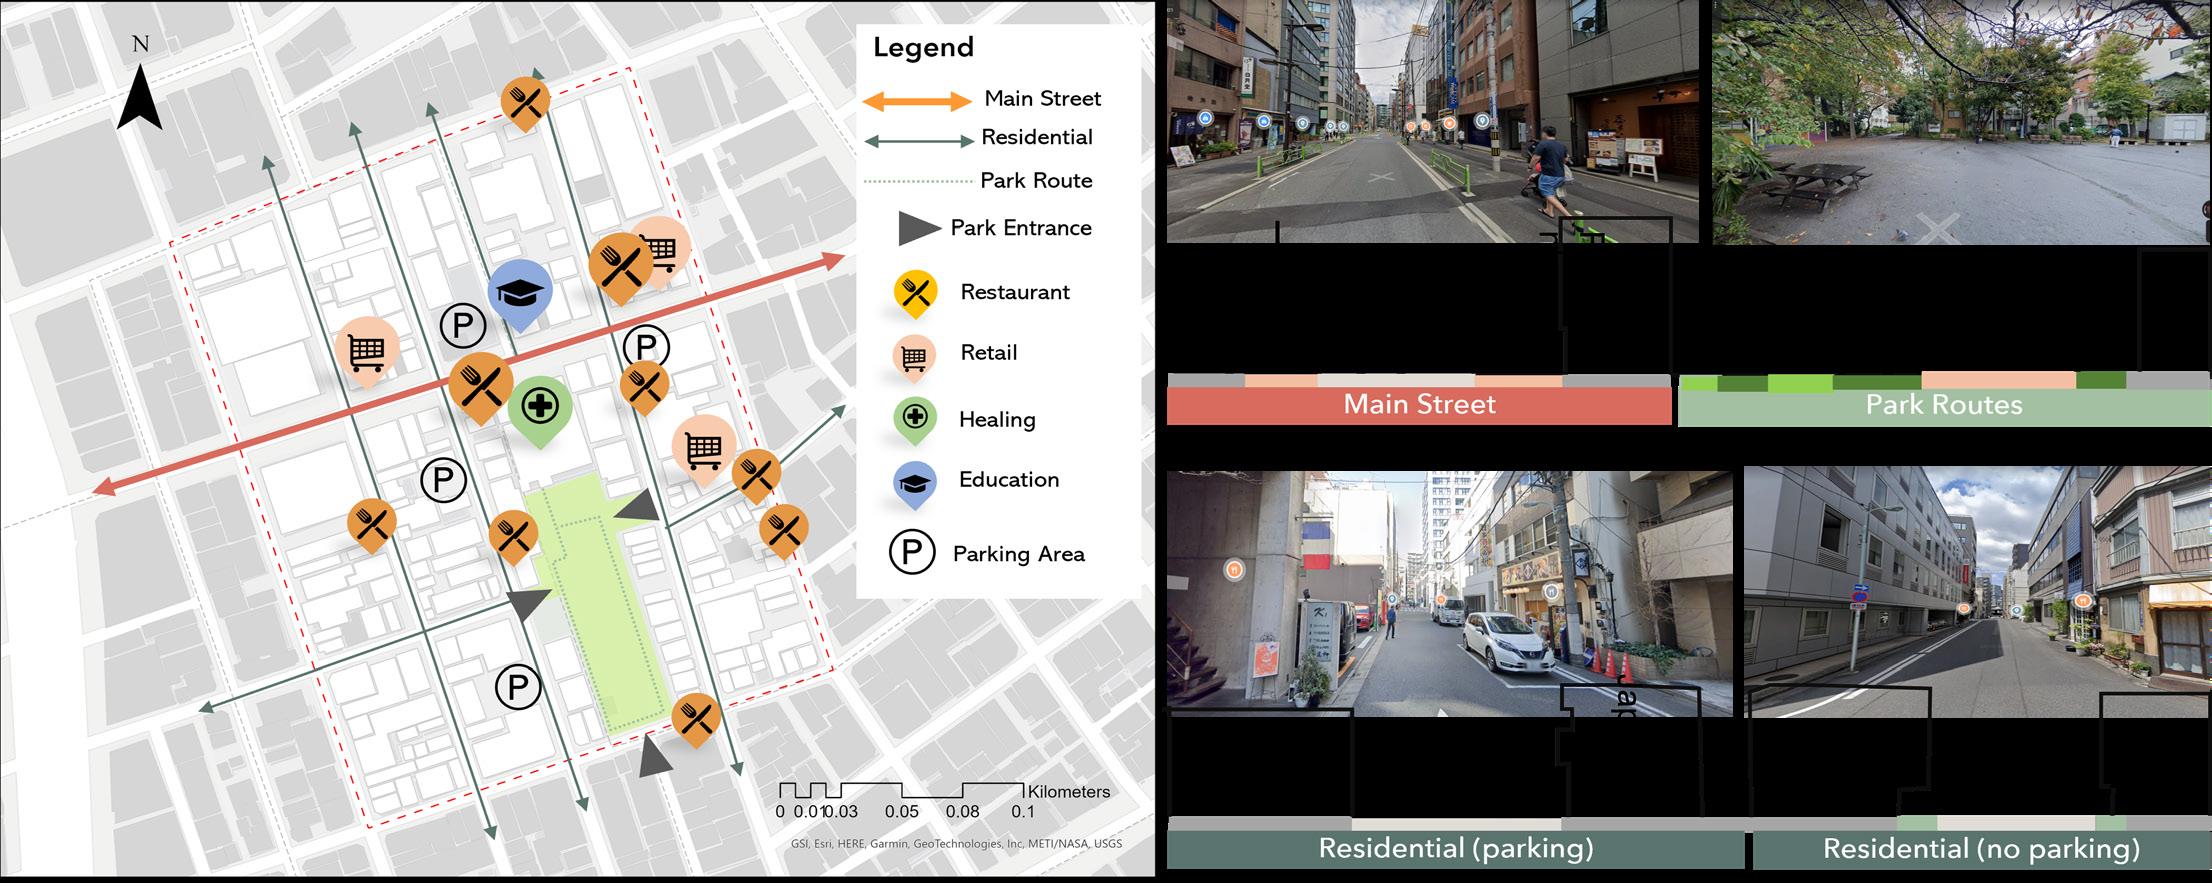
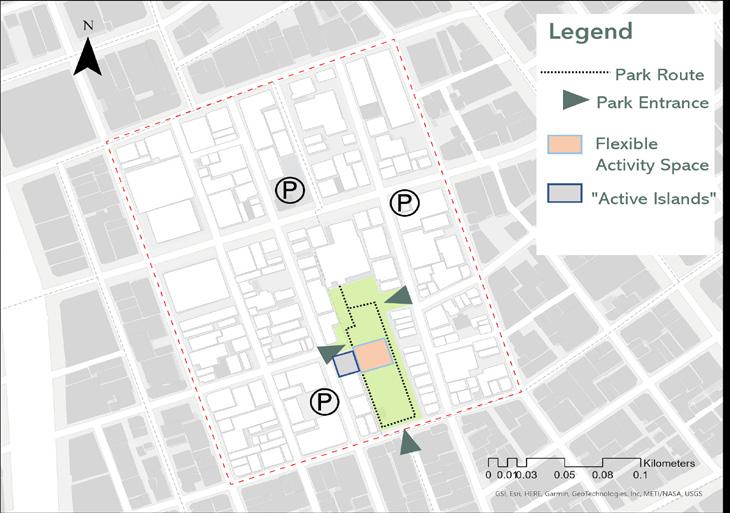
The existing streets were categorized into three class: main street, residential road and park routes. The main street has a narrow walkside less than 3 meters while residential roads are narrow and shared by pedestrian and cars. The park routes, however, have a large area of concrete ground without boundaries. Since the neighborhood was transformed by commercial offices, it was not residential friendly in scale. Three strategies are used to make better use of the space, activate streets and help commuters keep safe during the outbreak.
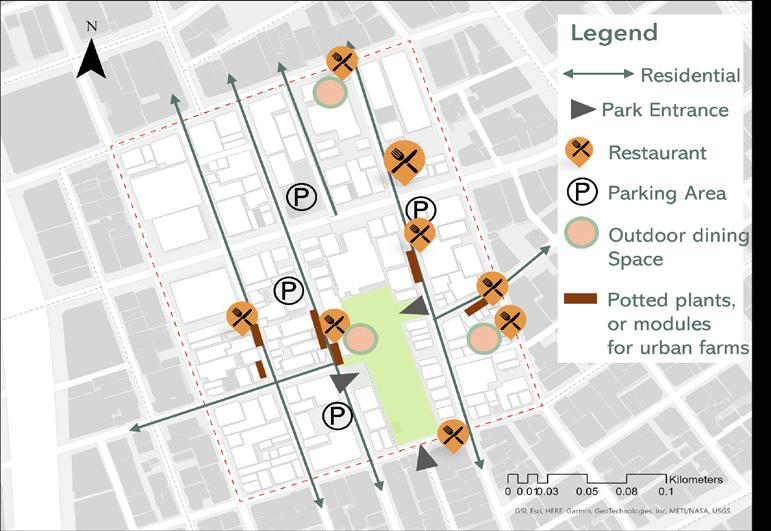
Strategy 1
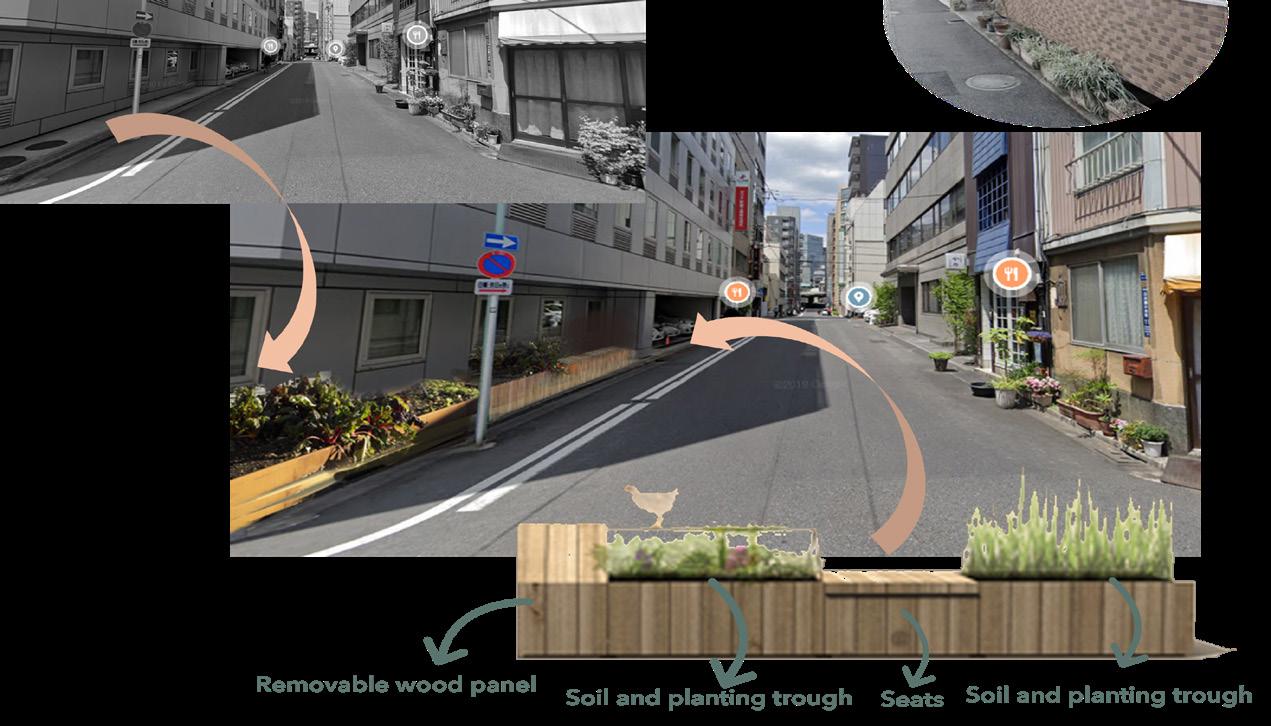
The store was filled with potted plants at the entrance Those potted plants, and the agriculture module which combined with street furniture, are part of the CPULs landscape system. They will be embedded along the residential road to increased entrance depth visually, and also activate the space.
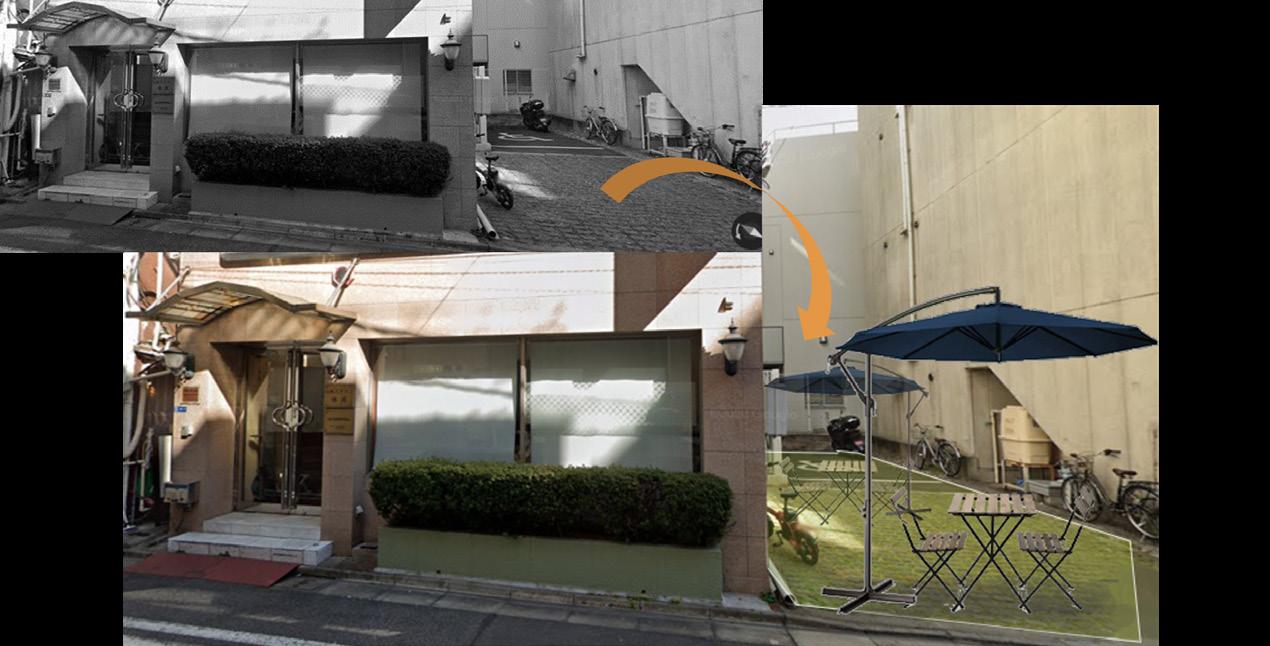
Local Japanese restaurants are located on narrow roads with no outdoor dining space. Outdoor dining strategies in the post-pandemic era utilize the existing small, fragmented outdoor spaces. Place residential road grade outdoor furniture in the parking lot, open terrace or backyard.
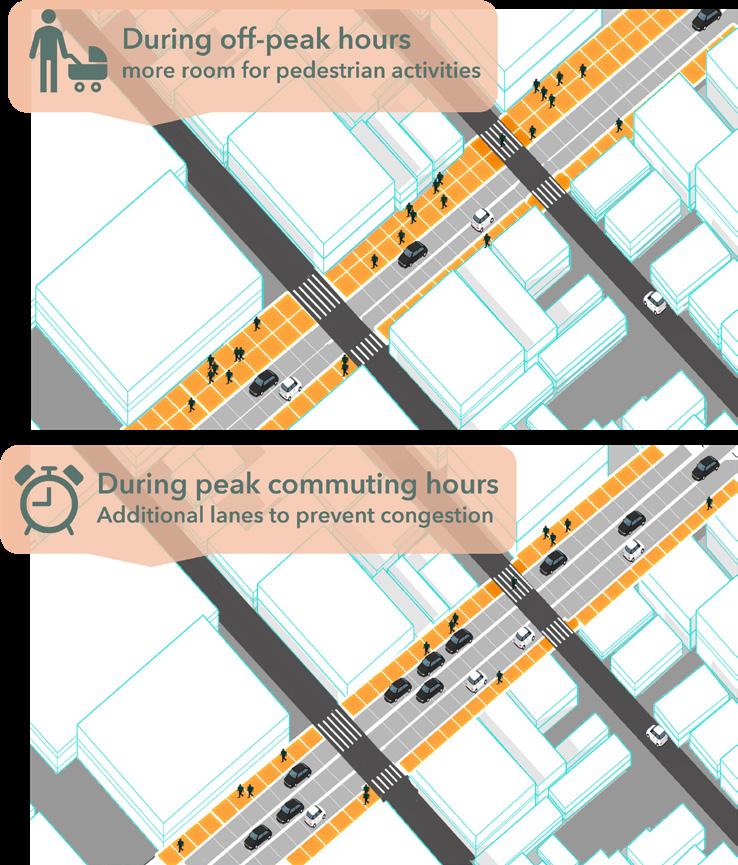
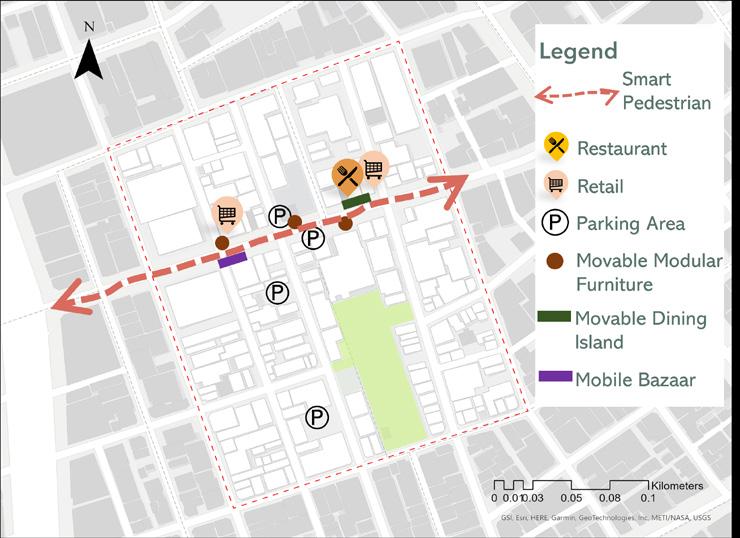
The Main Street used to be a busy pedestrian street.Since the outbreak, there are fewer commuters. Some movable smart street furniture could add vibrancy, but help people keep a safe distance. Install sensors underneath the sidewalks to collect pedestrian data and redefine the sidewalk boundary based on the amount of traffic. The street could also manipulate the furniture and move them to safe places.
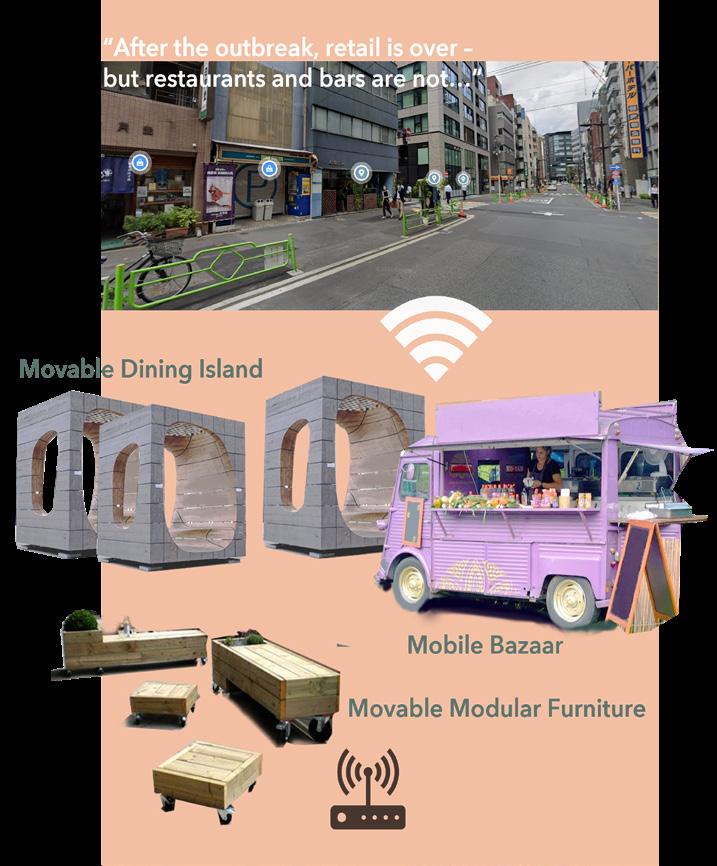
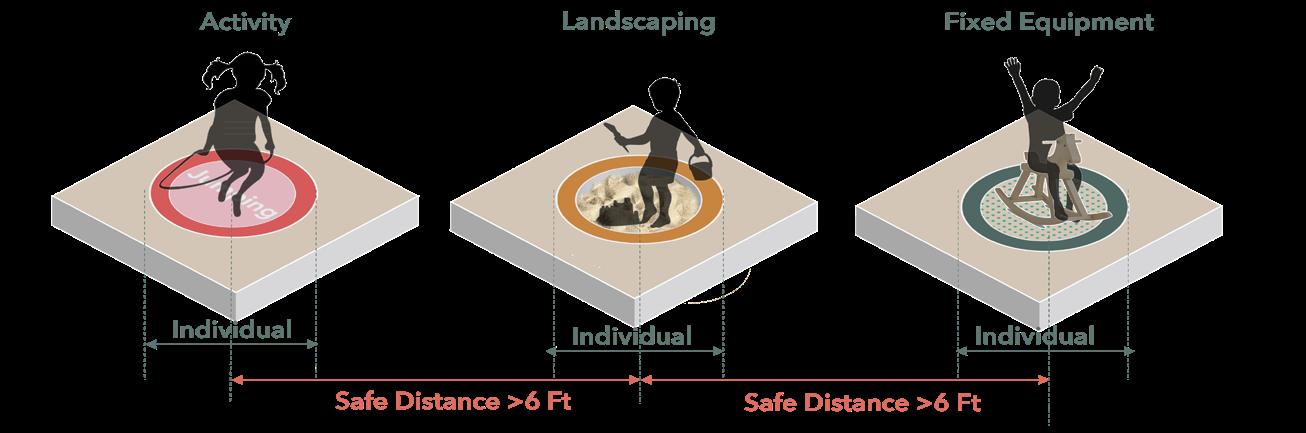
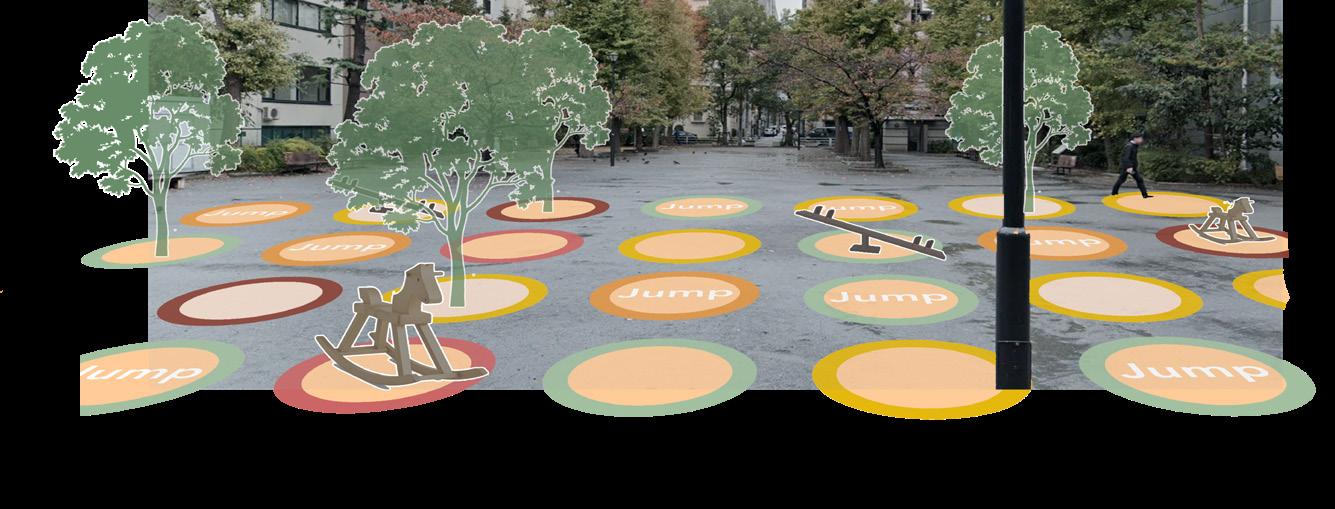
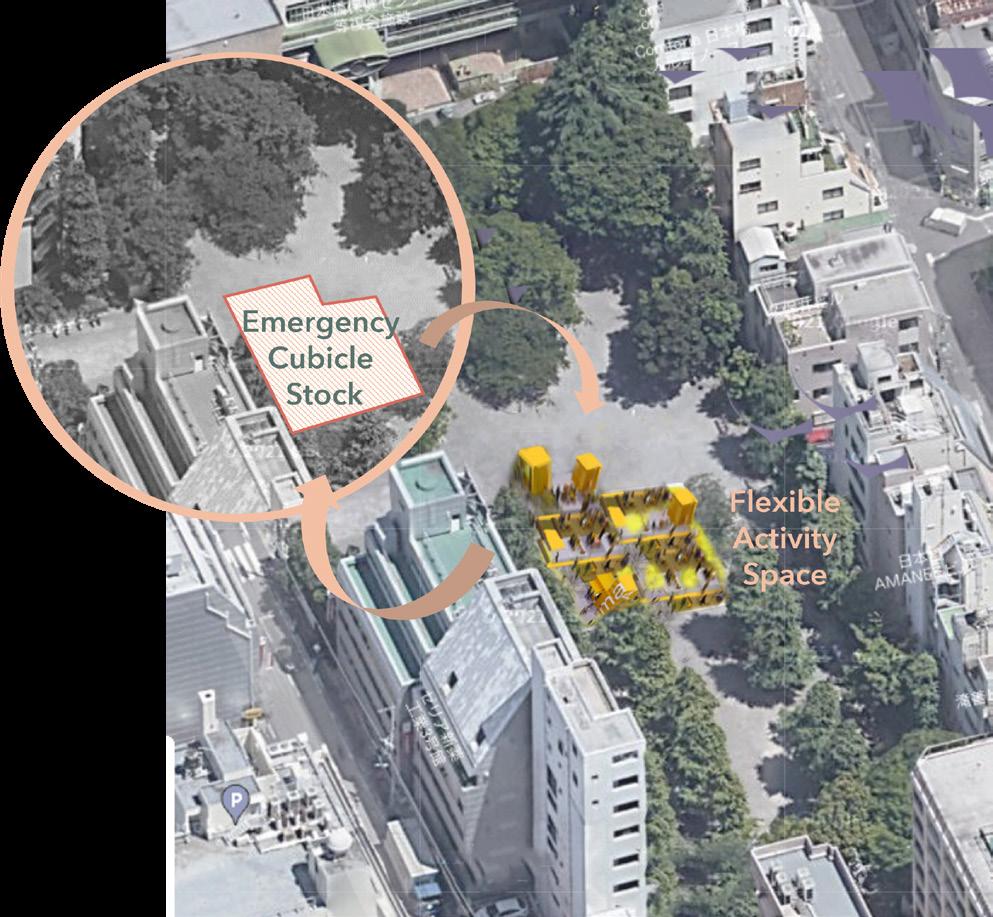
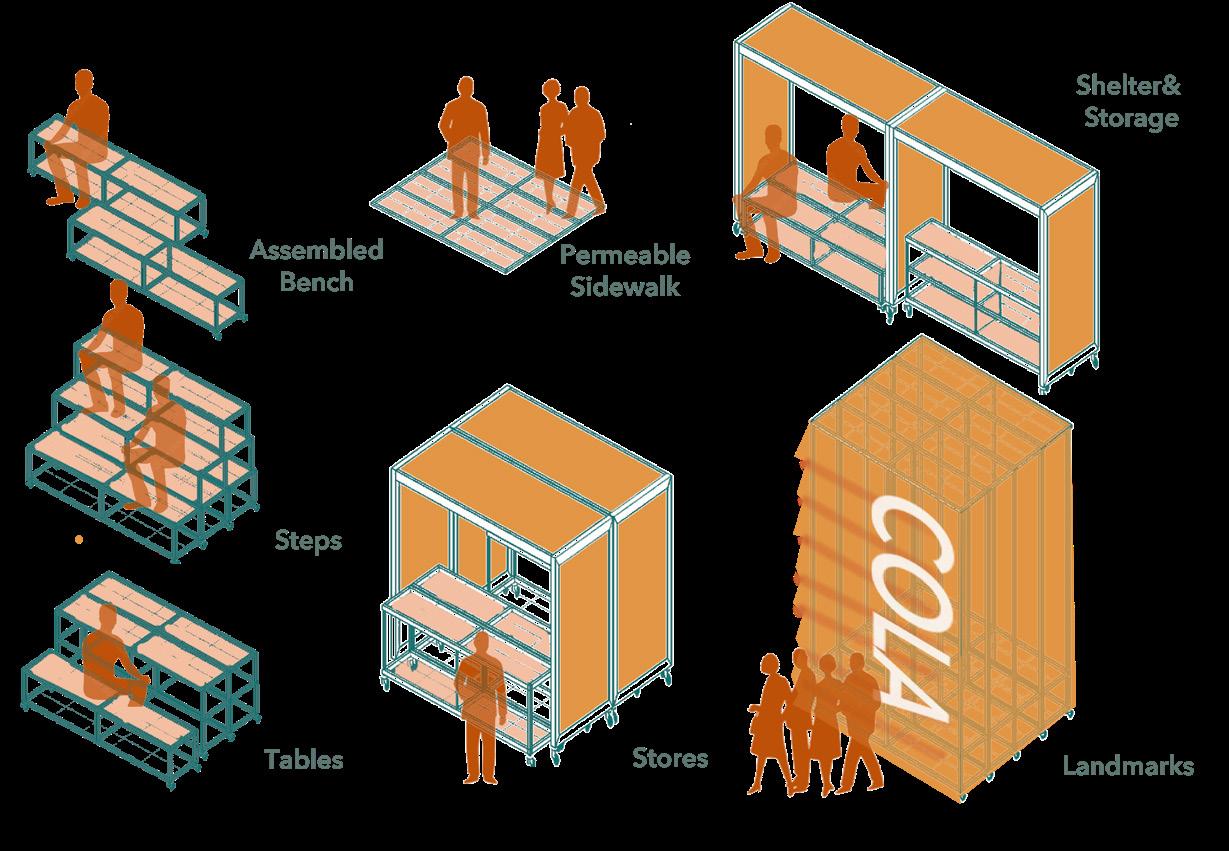
Flexible spaces are made of single units which can be assembled to provide functions, including rest,dining, movies, etc. The units can be removed at any time to leave large open spaces where temporary cubicle wards can be built to meet the needs of a sudden epidemic. The “islands of activity” is site where Individual devices or activities are fixed on an “island” restricted by panting or landscaping and distanced from other. It is a playground for children when they cannot gather.
Barcelona Urban Ecology Agency. (2012). Ecological Urbanism Certification: Urbanism Certification With Sustainability Criteria. Government of Spain.
Kuwabara, Tasuku, et al. (2021). How Japan Could Reach Carbon Neutrality by 2050. McKinsey & Company. https:// www.mckinsey.com/business-functions/sustainability/our-insights/how-japan-could-reach-carbon-neutralityby-2050.
Lucon O., D. Ürge-Vorsatz, A. Zain Ahmed, H. Akbari, P. Bertoldi, L.F. Cabeza, N. Eyre, A. Gadgil, L.D.D. Harvey, Y. Jiang, E. Liphoto, S. Mirasgedis, S. Murakami, J. Parikh, C. Pyke, and M.V. Vilariño, 2014: Buildings. In: Climate Change 2014: Mitigation of Climate Change. Contribution of Working Group III to the Fifth Assessment Report of the Intergovernmental Panel on Climate Change [Edenhofer, O., R. Pichs-Madruga, Y. Sokona, E. Farahani, S. Kadner, K. Seyboth, A. Adler, I. Baum, S. Brunner, P. Eickemeier, B. Kriemann, J. Savolainen, S. Schlömer, C. von Stechow, T. Zwickel and J.C. Minx (eds.)]. Cambridge University Press, Cambridge, United Kingdom and New York, NY, USA.
The ten best climate measures. (2019, December 19). AirClim. https://www.airclim.org/acidnews/ten-best-climatemeasures
UNEP. n.d. Energy. Retrieved from https://unhabitat.org/topic/energy