Seward County Development Corporation Retail Division North Liberal Development www.swks.org

Cover Letter Existing Retail Inventory Development Location Site Map Utility Map Retail Marketplace Potential Data Primary Level Leakage Report Retail Marketplace Profile Regional Demographics Key Local Contacts KS Dept. of Commerce Local Development Programs Table of Contents Seward County Development Corporation 303 N Kansas Ave. Suite 101 & 102 Liberal, KS 67901 620-604-5136 www.swks.org 3 4 5 6 8 10 11 12 13 14 15 16
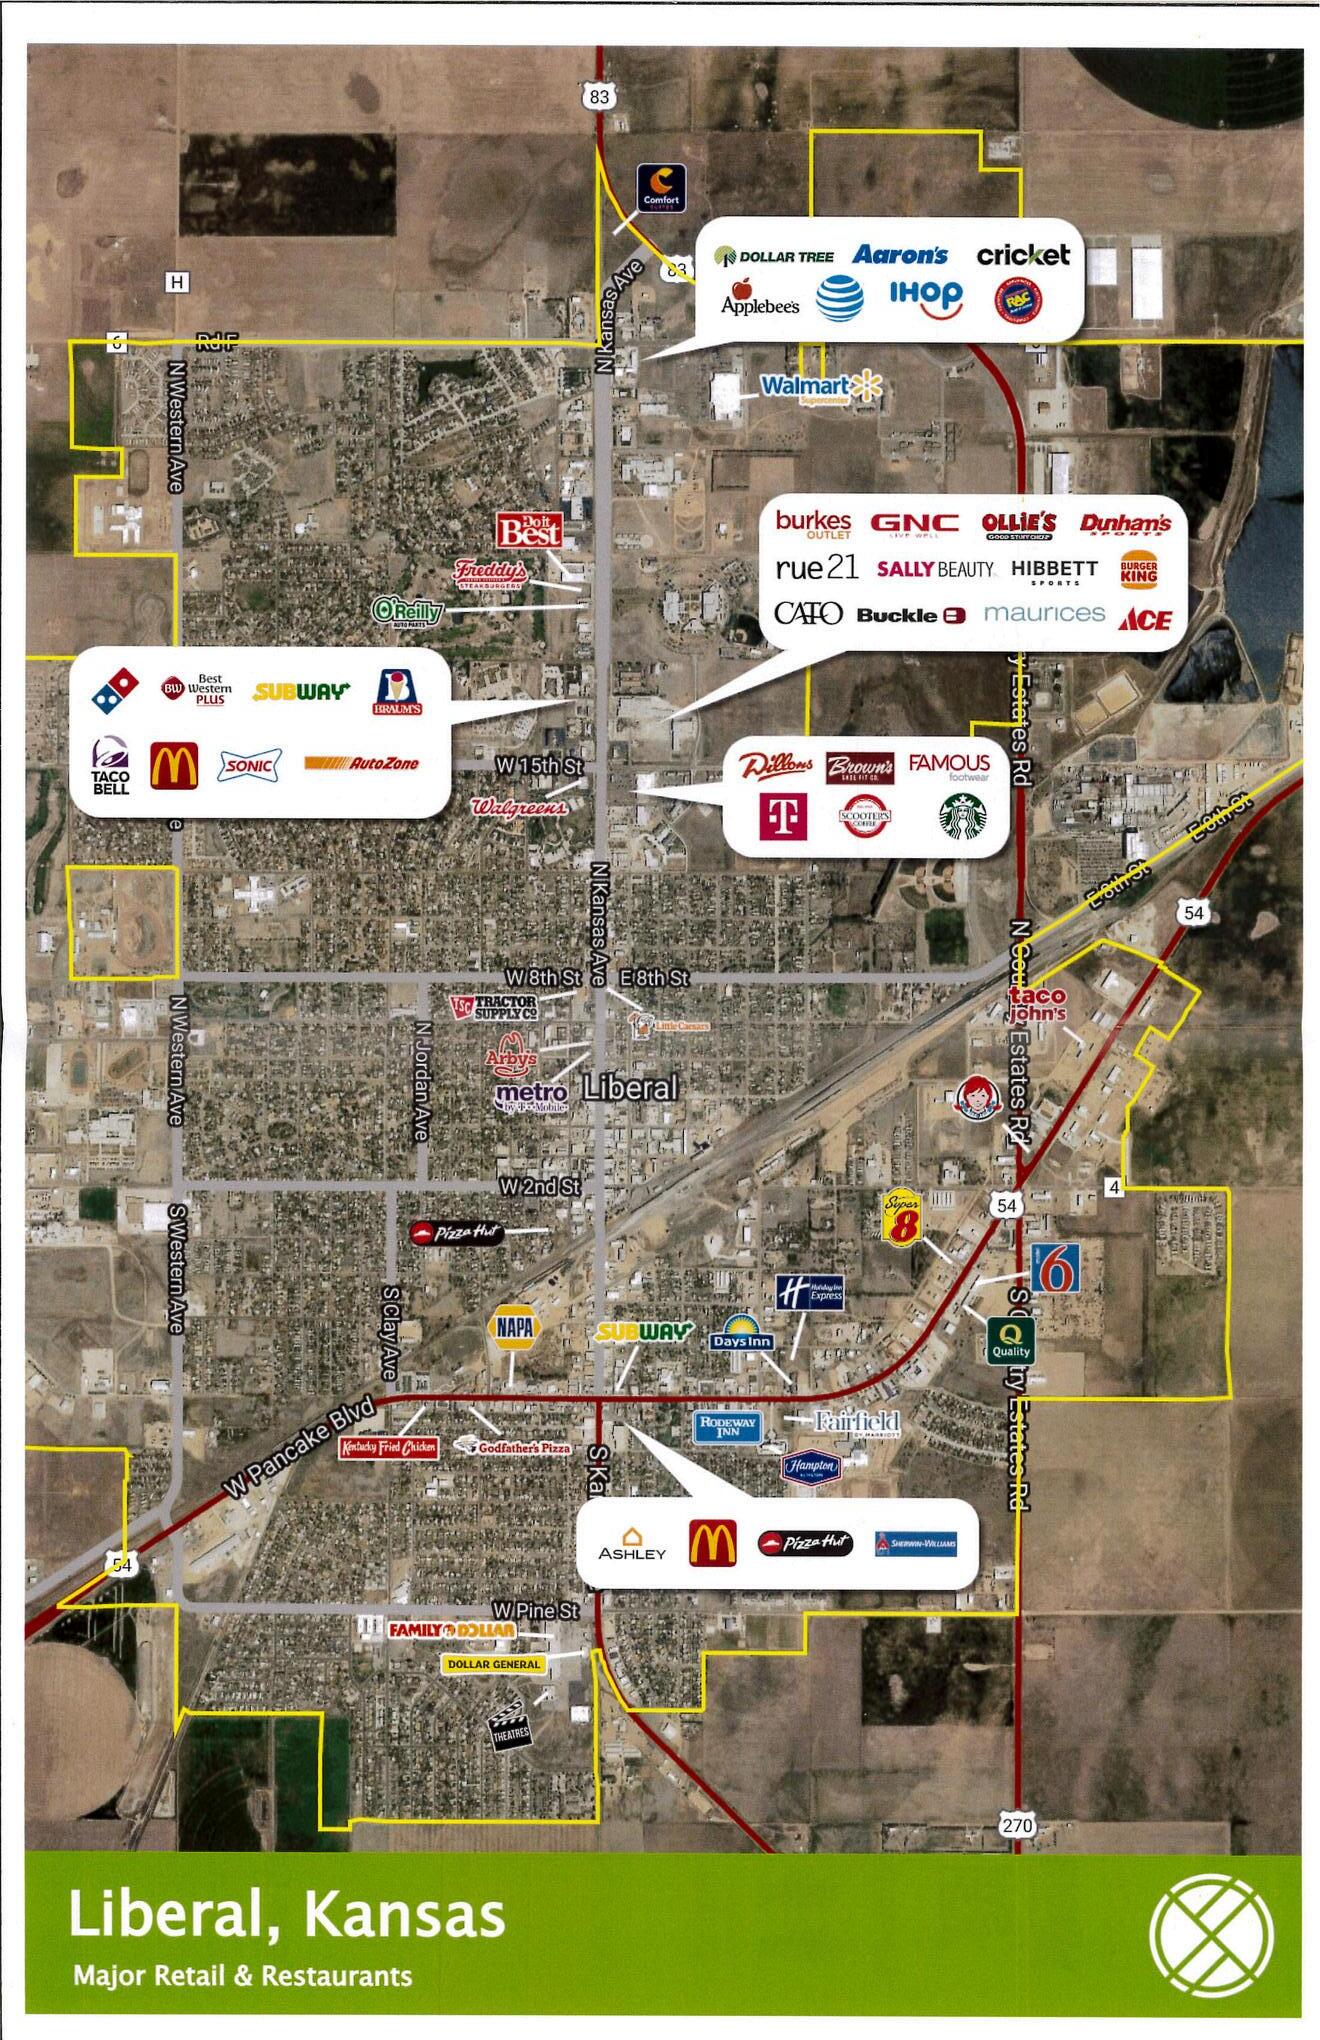
Development Location


Leased
Leased LOI

LOI


Retail Marketplace Potential
Bartel Property Liberal, KS
Ring: 75 mile radius
Demographic Summary
Population Population 18+ Households
Median Household Income
Product/Consumer Behavior
Apparel (Adults)
Bought Men`s Clothing/12 Mo
Bought Women s Clothing/12 Mo
Bought Shoes/12 Mo
Bought Fine Jewelry/12 Mo
Bought Watch/12 Mo
Automobiles (Households)
HH Owns or Leases Any Vehicle
HH Bought or Leased New Vehicle/12 Mo
Automotive Aftermarket (Adults)
Bought Gasoline/6 Mo
Bought or Changed Motor Oil/12 Mo
Had Vehicle Tune-Up/12 Mo
Beverages (Adults)
Drank Non-Diet (Regular) Cola/6 Mo
Drank Beer or Ale/6 Mo
Product/Consumer Behavior
Convenience Stores (Adults)
Shopped at C-Store/6 Mo
Bought Brewed Coffee at C-Store/30 Days
Bought Cigarettes at C-Store/30 Days
Bought Gas at C-Store/30 Days
Spent $1-19 at C-Store/30 Days
Spent $20-39 at C-Store/30 Days
Spent $40-50 at C-Store/30 Days
Spent $51-99 at C-Store/30 Days
Spent $100+ at C-Store/30 Days
Entertainment (Adults)
Attended Movie/6 Mo
Went to Live Theater/12 Mo
Went to Bar or Night Club/12 Mo
Dined Out/12 Mo
Gambled at Casino/12 Mo
Visited Theme Park/12 Mo
Viewed Movie (Video-on-Demand)/30 Days
Viewed TV Show (Video-on-Demand)/30 Days
Used Internet to Download Movie/30 Days
Downloaded Individual Song/6 Mo
Used Internet to Watch Movie/30 Days
Used Internet to Watch TV Program/30 Days
Played (Console) Video or Electronic Game/12 Mo
Played (Portable) Video or Electronic Game/12 Mo
54,119 47,302 42 6% 37 2% 115 94
Latitude: 37 4568 Longitude: -100 8710
58,490 6,375 117,975 75,303 33,000 Expected Number of Adults or HHs 82,254 68,197 97,394 26,550 18,259 93 5% 10 2% 92 8% 59 3% 26 0% 2023 177,010 127,067 62,541 $60,111 Percent of Adults/HHs 64 7% 53 7% 76 6% 20 9% 14.4% 102 101 103 115 105 2028 174,757 124,681 62,392 $67,758 MPI 106 104 103 102 104 Data Note: An MPI (Market Potential Index) measures the relative likelihood of the adults or households in the specified trade area to exhibit certain consumer behavior
purchasing patterns compared to the U S An MPI of 100 represents the U S average Source: These data are based upon national propensities to use various products
services, applied to local demographic composition Usage data were collected by MRI-Simmons in a nationally representative survey of U S households Esri
for 2023
2028 May 16, 2024 ©2024 Esri Page 1 of 4
or
and
forecasts
and
45,876 7,395 19,567 65,209 11,771 14,574 10,592 6,732 6,267 22,897 39,947 24,079 15,753 8,283 86,496 16,292 8,540 58,418 8,944 12,972 9,888 8,322 32,965 36 1% 5 8% 15 4% 51 3% 9 3% 11 5% 8 3% 5 3% 4 9% 18 0% 31 4% 18 9% 12 4% 6 5% 68 1% 12 8% 6 7% 46 0% 7 0% 10 2% 7 8% 6 5% 25 9% 98 85 95 98 86 99 75 70 82 90 92 86 97 98 106 106 110 117 95 104 100 107 124 Expected Number of Adults or HHs Percent of Adults/HHs MPI
Retail Marketplace Potential
Bartel Property Liberal, KS
Ring: 75 mile radius
Product/Consumer Behavior Grocery (Adults)
HH Used Bread/6 Mo
HH Used Chicken (Fresh or Frozen)/6 Mo
HH Used Turkey (Fresh or Frozen)/6 Mo
HH Used Fish or Seafood (Fresh or Frozen)/6 Mo
HH Used Fresh Fruit or Vegetables/6 Mo
HH Used Fresh Milk/6 Mo
HH Used Fish or Seafood (Fresh or Frozen)/6 Mo
Health (Adults)
Exercise at Home 2+ Times/Wk
Exercise at Club 2+ Times/Wk
Visited Doctor/12 Mo
Used Vitamins or Dietary Supplements/6 Mo
Home (Households)
HH Did Home Improvement/12 Mo
HH Used Maid/Prof Cln Svc (+ Furn/Carpet)/12 Mo
HH Purchased Low Ticket HH Furnishing/12 Mo
HH Purchased Big Ticket HH Furnishing/12 Mo
HH Bought Small Kitchen Appliance/12 Mo
HH Bought Large Kitchen Appliance/12 Mo
Pets (Households)
HH
Product/Consumer Behavior
Restaurants (Adults)
Went to Family Restrnt/SteakHse/6 Mo
Went to Family Restrnt/SteakHse 4+ Times/30 Days
Went to Fast Food/Drive-In Restaurant/6 Mo
Went to Fast Food/Drive-In Rest 9+ Times/30 Days
Ordered Eat-In Fast Food/6 Mo
Ordered Home Delivery Fast Food/6 Mo
Take-Out/Drive-Thru/Curbside Fast Food/6 Mo
Ordered Take-Out/Walk-In Fast Food/6 Mo Expected Number of Adults or HHs
Latitude: 37 4568 Longitude: -100 8710
Owns Cat HH Owns Dog 60,005 44,529 9,992 37,684 54,587 53,497 37,684 57,609 11,584 99,539 82,362 25,599 17,743 14,584 17,184 16,888 10,144 16,314 28,816 Expected Number of Adults/HHs 95 9% 71 2% 16 0% 60 3% 87 3% 85 5% 60 3% 40 9% 28 4% 23 3% 27 5% 27 0% 16 2% 26 1% 46 1% 45 3% 9 1% 78 3% 64 8% Percent of Adults/HHs 92 78 98 98 101 102 108 100 99 104 84 104 93 95 96 103 100 113 117 MPI Data Note: An MPI (Market Potential Index) measures the relative likelihood of the adults or households in the specified trade area to exhibit certain consumer behavior
patterns compared to
U S
MPI of 100 represents the U S average Source: These data are based upon national propensities to use various products
to local demographic composition Usage data were collected by MRI-Simmons in a nationally representative survey of U S households Esri
May 16, 2024 ©2024 Esri Page 3 of 4
or purchasing
the
An
and services, applied
forecasts for 2023 and 2028
86,746 25,541 116,540 50,813 29,259 16,700 78,178 22,528 Percent of Adults/HHs 68 3% 20 1% 91 7% 40.0% 23 0% 13 1% 61 5% 17 7% MPI 103 98 101 103 113 98 105 79

leakage primary category # of stores visits by residents residents Attractions 7 2,084 33 1,340 76 Beauty & Spa 5 1,797 65 1,179 87 Breakfast, Coffee, Bakeries & Dessert Shops 6 1,415 78 1,001 10 Budget Accommodation & Inns 3 93.55 71.51 Car Shops & Services 23 1,365 86 750 83 Car Wash Services 3 140 90 71 51 Clothing 15 12,678 37 6,006 62 Community Shopping Centers 5 33,850 20 12,013 24 Department Stores 2 7,445.35 4,075.92 Discount & Dollar Stores 27 6,812 09 3,629 00 Drugstores & Pharmacies 2 210 35 160 89 Electronics Stores 5 1,060 50 768 70 Fast Food & QSR 60 30,090 19 10,207 68 Fitness 3 142 66 89 38 Furniture and Home Furnishings 4 580.98 178.77 Gas Stations & Convenience Stores 38 12,148 63 4,415 58 General Government Services 5 564 64 303 91 Groceries 14 4,417 49 1,305 01 Hobbies, Gifts & Crafts 2 2,964 32 1,859 19 Home Improvement 22 12,066.03 4,844.62 Hotels & Casinos 24 12,079 21 3,754 14 Office Supplies 1 94 90 71 51 Pet Stores & Services 1 1,149 55 786 58 Recreational & Sporting Goods 3 2,884 85 1,912 82 Restaurants 13 15,029.50 7,597.66 Shipping & Storage 1 47 14 35 75 Stores & Services 2 45 83 35 75 Superstores 5 22,881 02 8,938 42 Theaters & Music Venues 1 614 63 339 66 Urgent Care 2 182 98 53 63 Workplace 1 3,287.46 1,465.90 Placer Labs, Inc. 440 N Barranca Ave #1277 Covina CA 91723 United States Primary Category Level Leakage

Table 3. Retail MarketPlace Profile, Seward County, KS, 2018
Industry Summary
Total Retail Trade and Food & Drink
Total Retail Trade Total Food & Drink
Industry Group
Motor Vehicle & Parts Dealers
Automobile Dealers
Other Motor Vehicle Dealers
Auto Parts, Accessories & Tire Stores
Furniture & Home Furnishings Stores
Furniture Stores
Home Furnishings Stores
Electronics & Appliance Stores
Bldg Materials, Garden Equip & Supply Store
Bldg Material & Supplies Dealers
Lawn & Garden Equip & Supply Stores
Food & Beverage Stores
Grocery Stores
Specialty Food Stores
Beer, Wine & Liquor Stores
Health & Personal Care Stores
Gasoline Stations
Clothing & Clothing Accessories Stores
Clothing Stores
Shoe Stores
Book, Periodical & Music Stores
General Merchandise Stores
Department Stores Excluding Leased
Other General Merchandise Stores
Miscellaneous Store Retailers
Florists
Office Supplies, Stationery & Gift Stores
Used Merchandise Stores
Other Miscellaneous Store Retailers
Nonstore Retailers
Electronic Shopping & Mail-Order Houses
Vending Machine Operators
Direct Selling Establishments
Food Services & Drinking Places
Special
Drinking Places - Alcoholic Beverages
Restaurants/Other Eating Places
$225,653,613
$205,035,647
$20,617,966
Demand (Potential)
$50,811,003
$31,547,492
$15,796,242
$3,467,269
$6,324,563
$4,425,989
$1,898,574
$5,700,906
$12,926,496
$11,884,160
$1,042,336
$37,960,195
$33,521,321
$918,079
$3,520,795
$9,515,998
$19,934,634
$7,731,638
$5,212,504
$1,002,371
$1,516,763
$4,733,615
$3,942,460
$791,155
$38,248,454
$28,054,893
$10,193,561
$7,979,399
$397,868
$2,169,398
$955,790
$4,456,343
$3,168,746
$2,229,366
$275,011
$664,369
$20,617,966
$219,326
$1,571,959
$18,826,681
$303,942,901
$272,178,972
$31,763,929
Supply (Sales)
$81,520,950
$70,375,869
$3,410,726
$7,734,355
$10,004,300
$8,065,089
$1,939,211
$4,087,453
$8,233,869
$8,233,869
$0
$58,433,363
$53,230,111
$1,129,380
$4,073,872
$13,960,258
$25,828,197
$12,016,449
$7,486,200
$3,893,112
$637,137
$6,606,820
$6,270,533
$336,287
$42,426,995
$40,151,680
$2,275,315
$6,853,224
$1,322,203
$3,277,720
$296,144
$1,957,157
$2,207,094
$91,715
$0
$2,115,379
$31,763,929
$681,127
$0
$31,082,802
$78,289,288
$67,143,325
$11,145,963
RetailGap
$30,709,947
$38,828,377 -$12,385,516
$4,267,086
$3,679,737
$3,639,100
$40,637 -$1,613,453 -$4,692,627 -$3,650,291 -$1,042,336
$20,473,168
$19,708,790
$211,301
$553,077
$4,444,260
$5,893,563
$4,284,811
$2,273,696
$2,890,741 -$879,626
$1,873,205
$2,328,073 -$454,868
$4,178,541
$12,096,787 -$7,918,246 -$1,126,175
$924,335
$1,108,322 -$659,646 -$2,499,186 -$961,652 -$2,137,651 -$275,011
$1,451,010
$11,145,963
$461,801 -$1,571,959 $12,256,121
Jewelry,
Leather Goods Stores Sporting Goods, Hobby, Book & Music Store
Goods/Hobby/Musical
Luggage &
Sporting
Instr Stores
Depts
Food Services
44-45,722 44-45 722 441 4411 4412 4413 442 4421 4422 443 444 4441 4442 445 4451 4452 4453 446,4461 447,4471 448 4481 4482 4483 451 4511 4512 452 4521 4529 453 4531 4532 4533 4539 454 4541 4542 4543 722 7223 7224 7225
14 8 14 1 21 3 Leakage/Surplus Factor 23 2 38 1 -64 5 38 1 22 5 29 1 1 1 -16 5 -22 2 -18 1 -100 0 21 2 22 7 10 3 7 3 18 9 12 9 21 7 17 9 59 0 -40 8 16 5 22 8 -40 3 5 2 17 7 -63 5 -7 6 53 7 20 3 -52 7 -39 0 -17 9 -92 1 -100.0 52 2 21 3 51 3 -100 0 24 6 188 139 49 28 16 3 9 9 5 4 5 9 9 0 16 9 3 4 12 12 16 10 5 1 7 6 1 9 5 4 13 3 4 2 4 3 1 0 2 49 2 0 47
NAICS NAICS Demand (Potential) Supply (Sales) Retail Gap Leakage/Surplus Factor Number of Businesses Number of Businesses
Regional Demographics

5 Miles 25 Miles 75 Miles Population 20,307 31,277 175,032 Housing Units 7,725 12,430 70,811 Median Age 30.8 32.7 33.9 Median Income $53,173 $55,081 $59,806 Avg. Disposable Income $75,098 $74,405 $64,568 Civilian Labor Force 10,407 15,663 90,811

Seward County
Development Corporation
Eli Svaty
Executive Director 620-655-2036 eli@swks.org
City of Liberal
Rusty Varnado City Manager
785-205-9500 rusty.varnado@cityofliberal.org
Local Contacts
Economic Development

Seward County
Development Corporation
Raquel Arellano Director of Entrepreneurship 925-409-8872 raquel@swks.org
Administration
Seward County
April Warden County Administrator
620-482-5509
awarden@sewardcountyks.org
Planning, Zoning, and Building

North Liberal Development POC
Tanya Colvin Broker
620-482-6876
tanyaloureecolvin@gmail.com
City of Kismet
Rod Lewis Mayor
620=629=0014
rodlewis991@gmail.com
City of Liberal
Keith Bridenstine
Building and Code Director 620-626-2262
keith.bridenstine@cityofliberal.org
Seward County
Albert Gallegos
Planning and Zoning Director 620-626-3394
agallegos@sewardcountyks org
City of Liberal
Arlene Rosales
Permit Technician
620-626-2261
arlene.rosales@cityofliberal.org
Seward County
Hillary Franco
Permit Technician
620-626-3392
hfranco@sewardcountyks org

PEAK – Promoting Employment across Kansas: $750 application fee
Company retains 95% of the payroll withholding tax of PEAK jobs
Company must provide adequate health insurance coverage for full time employees and pay at least 50% of health insurance premium
PEAK eligible jobs, must meet 100% of the county median wage
Must create a minimum of 10 new PEAK eligible jobs, with in the first 2 years Company must ask for a PEAK proposal, through the business incentive questionnaire, working with the Regional Project Manager, prior to applying for PEAK.
Application and Application fee of $750 must be submitted, before PEAK eligible jobs can be counted.
Non-eligible industries include: gambling, religious, retail trade, educational services, public administration, food services and drinking places, unless applying as an international or national headquarters of administrative/back office facility
HPIP- High Performance Incentive Program: $750 application fee
A tax credit for capital investment, with a 16-year carry-forward, equal to up to 10 percent of the eligible investment that exceeds $ 1 million in Douglas, Johnson, Shawnee and Wyandotte counties; $50,000 in Leavenworth county Exemption from sales tax for eligible capital investments/services
A potential workforce training tax credit up to $50,000 per year on training expenditures above two percent of the company payroll Priority consideration for other assistance programs offered through Commerce, and KMS
Company must complete and submit an HPIP Project Description, prior to the project being committed to Company must pay above average industry wage
Invest in training/skill development equal to 2% of payroll, or participate in a state training program
Company must provide adequate health insurance coverage for full time employees and pay at least 50% of health insurance premium
Non-eligible industries include: agriculture, mining, construction and retailing.
Industries that are not manufacturers, at least 51% of revenue must be generated from sales to Kansas manufacturers, and/or out of state commercial; and/or governmental customers
Work Force Training – KIT/KIR: $500 application fee
Grant funds to help offset the costs of training for employees
KIT – training for new employees, hired after the KIT start date
KIR – training for current employees on new processes, technology, equipment; company must have a dollar for dollar match
Positions being trained must be paid an average wage that meets or exceeds the county median wage
Company must provide adequate health insurance coverage for full time employees and pay at least 50% of health insurance premium
Work Opportunity Tax Credits (WOTC) and Welfare to Work Tax Credits
Encourage employers to hire job seekers who face the greatest barriers to employment for up to a $2400 federal tax credit per qualified hire.
Kansas Works Registered Apprentice Program
Available funding: Sponsors can be reimbursed for a portion of the RTI (Related Technical Instruction) per apprentice
International Trade Assistance
Assist Kansas companies with their global market development needs and exporting efforts
Kansas Business Development Incentives Southwest Region - Quick Summary Guide Linette Miller – linette.miller@ks.gov – 785-530-9043 Business one Stop –https://ksbiz.kansas.gov/
Local Development Programs
Property Tax Abatement
Businesses that purchase or expand property for the purpose of: a) manufacturing articles of commerce; b) conducting research and development; or c) storing goods or commodities which are sold or traded in interstate commerce may qualify for property tax abatement with proper approval of the City or County governing body, with final approval from the State Board of Tax Appeals. Certain uses financed by Industrial Revenue Bonds may also qualify for property tax abatements (This has to be approved by the State prior to the issuance).
Industrial Revenue Bonds
In Kansas, IRBs are issued by cities, counties and the Kansas Development Finance Authority. Proceeds from the sale of the bonds to private investors are made available to enable creditworthy companies to purchase land and pay the costs of constructing and equipping new facilities or the costs of acquiring, remodeling and expanding existing facilities.
Community Improvement District (CID)
Property owners may petition the City Commission to create a Community Improvement District (CID) for projects exceeding $200,000. Applicants may request special property tax assessments within the district, special sales tax up to 2% within the district or a combination of both. All property owners within the proposed CID must participate in the petition. Upon creation of a CID, revenue generated by these sources is available through a pay-as-you-go account. A CID can exist for a maximum of 22 years.
Tax Increment Financing (TIF)
Tax Increment Financing (TIF) is a real estate redevelopment tool applicable to industrial, commercial, intermodal transportation area and residential projects. TIF uses the increases in real estate tax revenues and local sales tax revenues to retire the bonds sold to finance eligible redevelopment project costs (K.S.A. 121770 et seq.) or to reimburse the developer on a pay-as-you-go basis.
Neighborhood Revitalization Program (NRP)
This plan is intended to promote the revitalization and development of certain areas within the City of Liberal in order to protect the public health, safety, and welfare, and improve economic conditions which impair and arrest the sound growth of the community for the residents of the City The City will offer property tax rebates for certain improvements or renovation of the property with the designated areas in accordance with the provisions of K S A 12-17, 114 et seq
Façade Improvement Grant
The City of Liberal offers development assistance in the form of 50/50 matching grant money for commercial businesses and property owners located within the City of Liberal, Kansas City grants will be for outside façade improvements, parking lot improvements or sidewalk replacement on the exterior of the business


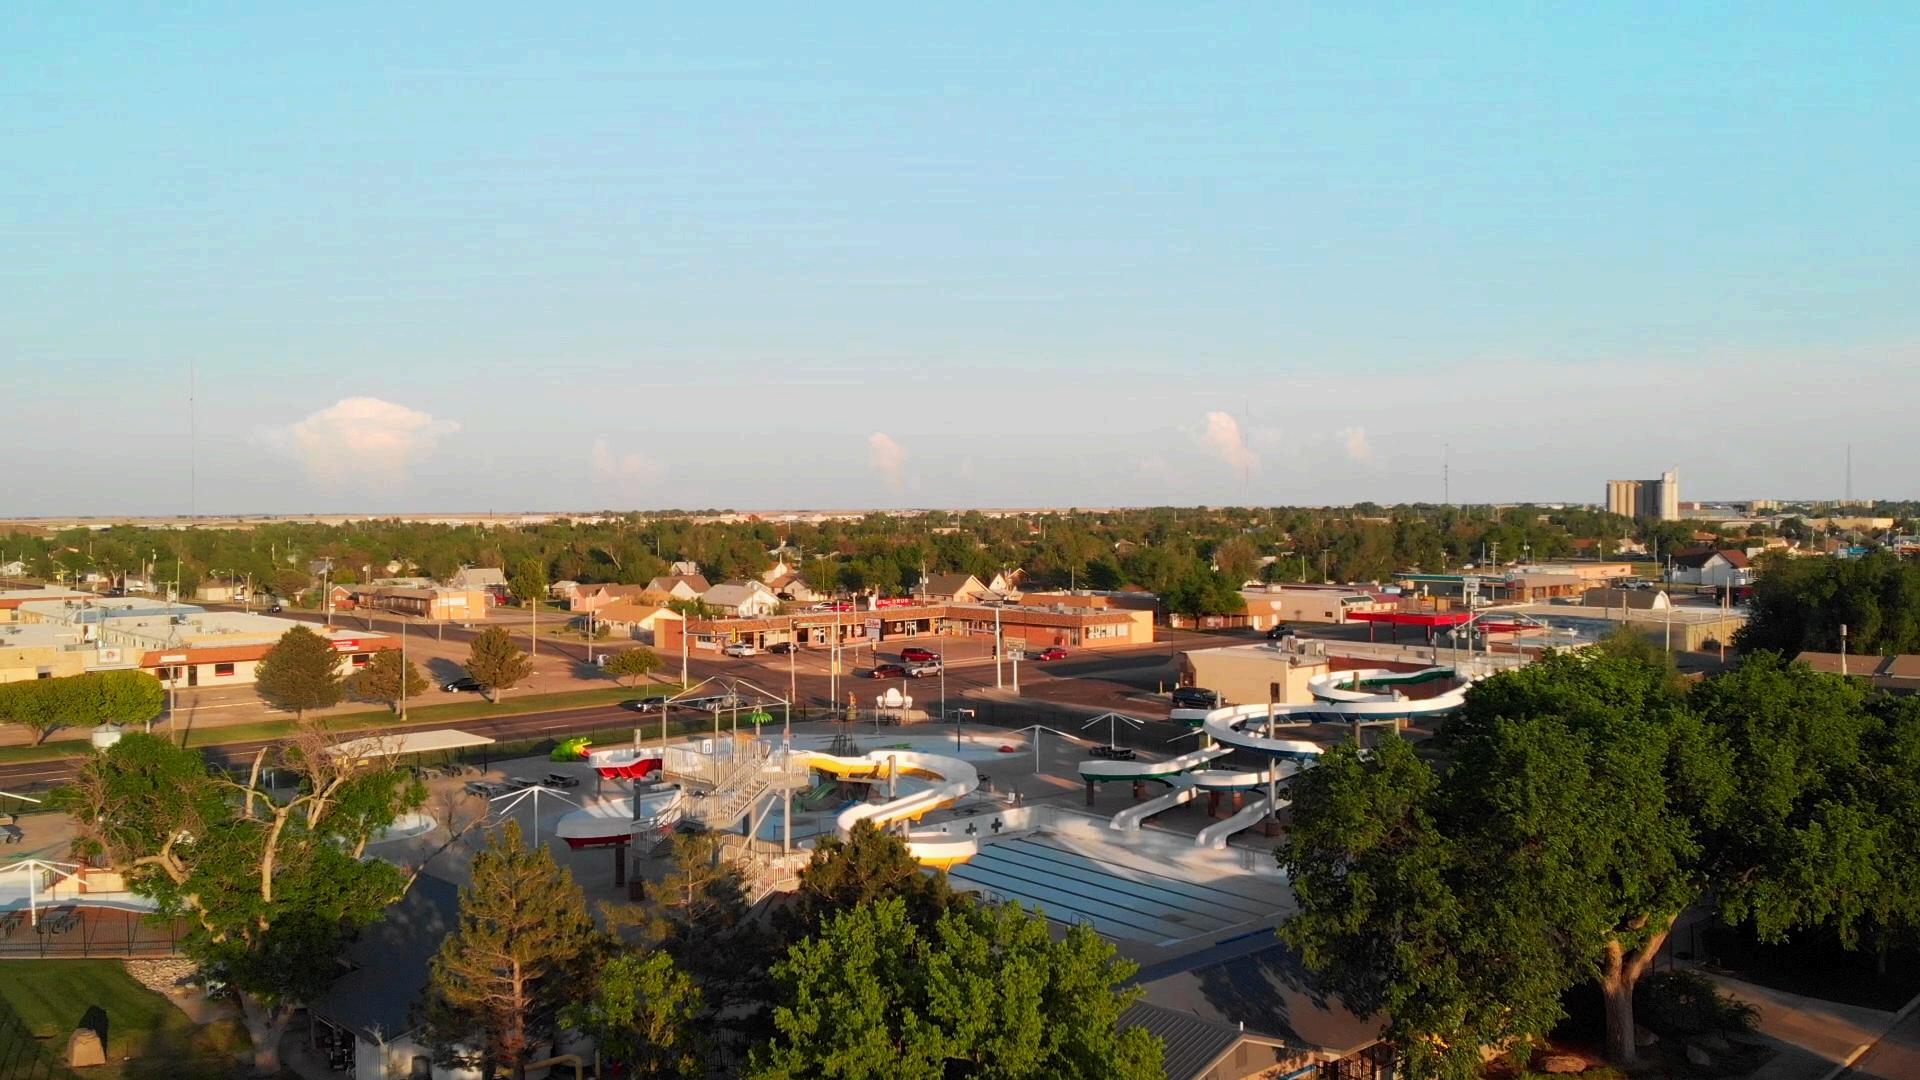
Explore Our Community!
