March 25, 2025
Comite Dialogo Ambiental, Inc.
Re: Steri-Tech Salinas PR Community Noise Impact Study
Comite,
Per your request, I have prepared this report summarizing my opinions relating to this issue and the factual basis for my opinions. This report includes my opinions regarding the noise emissions and impact created by the Salinas Puerto Rico Steri-Tech faciality as incident on the surrounding residential community.
The opinions in this report are based on site noise testing and analysis. The opinions in this report are also based on my education, knowledge, training, and experience in the fields of engineering/physical acoustics, mechanical vibrations, and noise control. I have completed noise and vibrations projects (ranging from industrial noise control, environmental/community noise, product noise/sound quality, hearing conservation, etc.) for approximately six hundred clients located throughout North America as outlined in my attached CV.
I hold all the opinions stated in this report and the subsequent conclusions with a reasonable degree of engineering certainty.

Regards, William
Thornton
1 INTRODUCTION
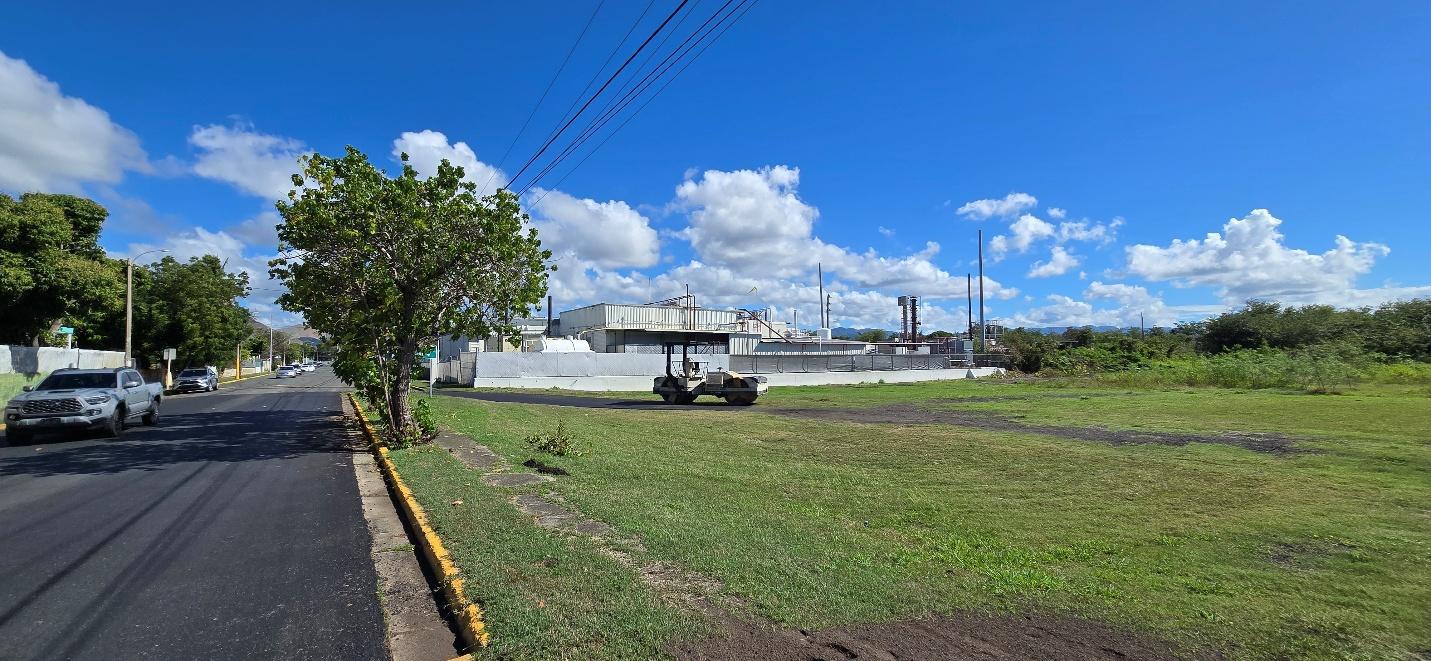
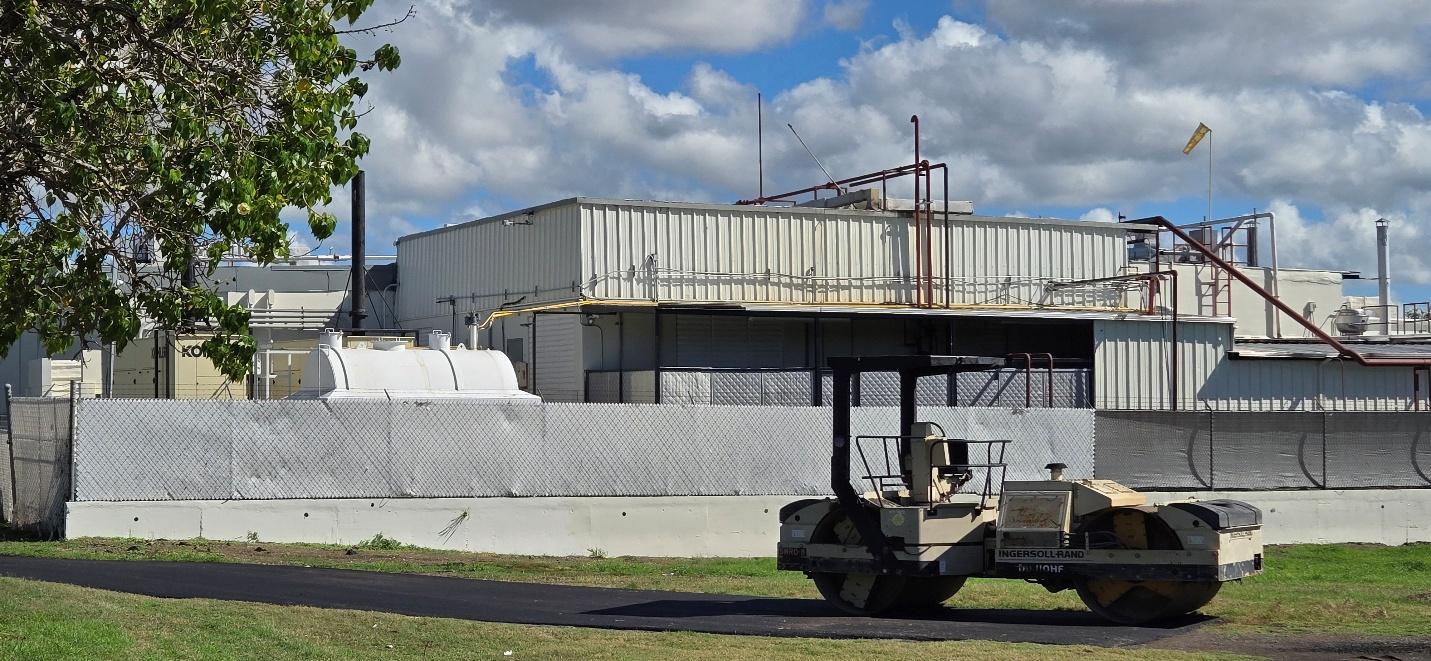
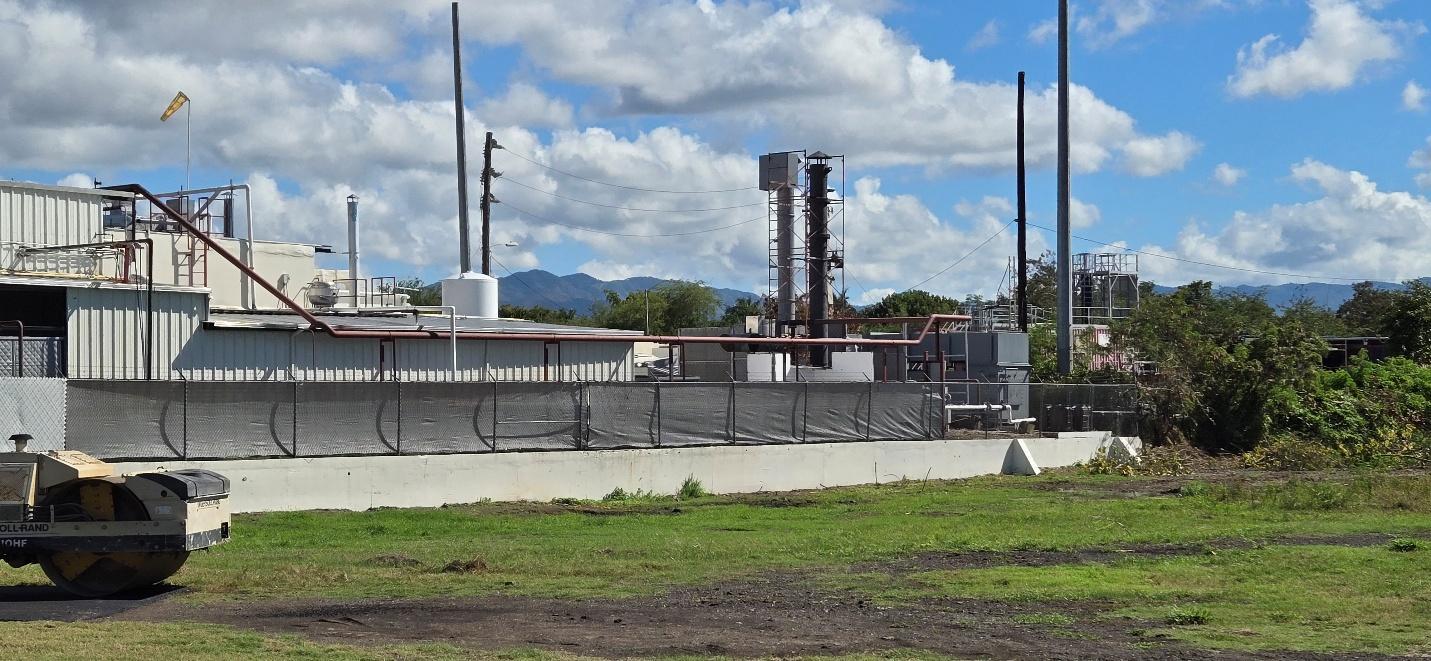
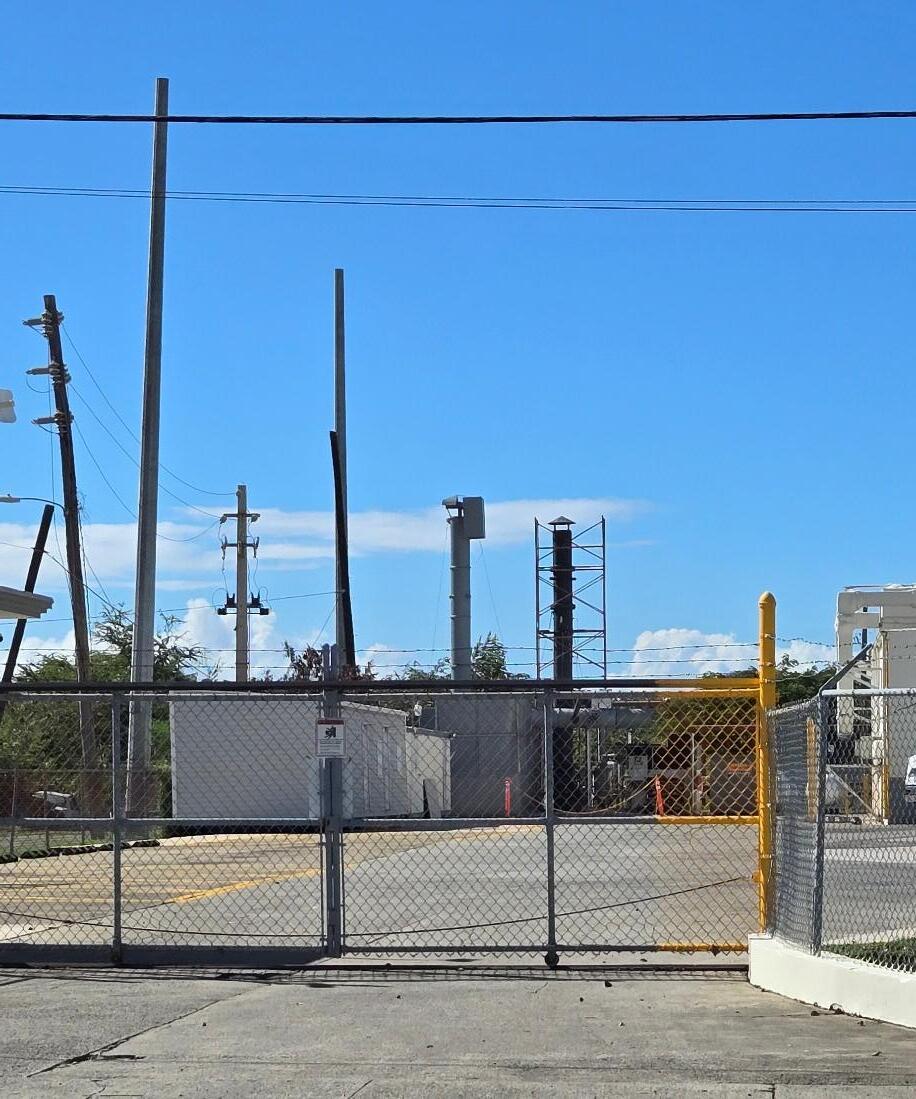
Thornton Acoustics & Vibrations (TAV) performed a community noise study to assess the noise emitted by the Steri-Tech physical plant (Industrial Park, Rd. 701 km. 0.7, Salinas, 00751, Puerto Rico) as incident on the surrounding residential community. Noise monitoring and testing was performed in La Margarita Urbanization, due to the proximity to the plant – directly to the West, with testing at two representative residences (Hilda Carlo, Urb. La Margarita A35 D Street, Salinas, PR 00751 and Margarita Perez's address is Urb. La Margarita A34 D Street, Salinas, PR 00751). The noise study was performed March 8-11, 2025.
This report will discuss the methodology, results, and conclusions of the noise study.
In preparing this report, I have reviewed the following documents:
1. Commonwealth of Puerto, Reglamento para el Control de la Contaminacion por Ruidos, 5 de mayo de 2011
The opinions in this report are based on my site sound testing and analysis. The opinions in this report are also based on my education, knowledge, training, and experience in the fields of engineering/physical acoustics, mechanical vibrations, and noise control. My formal education includes specific course work and training in:
1. Physical Acoustics
2. Mechanical Vibration
3. Non-linear Dynamics
4. Signal Processing
5. Psychoacoustics
6. Audiology
1.2
NOISE PRIMER
To understand and interpret the noise data, analyses and discussions contained in this report it is essential to understand several of the technical nuances related to noise (unwanted sound) and the human perception and impact of noise.
Sound is a pressure perturbation propagating through air, in the form of waves, which can be described in terms of the level (magnitude), the frequency content (spectrum – perceived as tone/pitch) and temporal variation. These variables affect the generation, radiation, propagation, perception, and impact of the sound.
In modelling, measuring and characterizing noise, there exist numerous metrics (dozens) and descriptors. The metrics/descriptors used must be carefully chosen such that they capture and accurately describe and characterize the sound or noise problem being addressed. For many of these metrics and descriptors, although they fundamentally differ in their computation, the results are expressed in terms of decibels (dB), and this can lead to confusion and misinterpretation. The use of the wrong metric will distort the measured results leading to erroneous conclusions. While regulations may dictate the descriptors to be used, this does not necessarily mean that the metric used in the regulation is the most technically appropriate metric.
To characterize the typical ambient sound levels in a community, the sound level exceeded 90 percent of the time (L90, (dB)) metric is often used by convention (in the absence of a formal standard or specific guidance in an ordinance).
The decibel scale used to measure noise is a logarithmic scale rather than a simple linear scale and this leads to misunderstanding and misinterpretation of noise data, levels, and decibel math. Small numerical changes or differences in sound level (expressed in decibels (dB)) are significant differences in acoustical energy. For the reader to interpret and understand the noise data, several simplified rules-of-thumb regarding the sound level/decibel scale are useful. First, every 3-dB increase (or decrease) is a doubling (or halving) the amount of acoustical energy and is considered the smallest change perceptible to an average human listener. Secondly, every 10dB increase (or decrease) is a doubling (or halving) of the perceived loudness of a sound. For
example, if the ambient sound level is increased by 10 dB, the average person would perceive this as twice as loud. An increase of 20 dB would be perceived as roughly 4-times as loud, 30 dB as 8-times as loud and so on.
Noise may create a deleterious impact based on the absolute level of the noise and/or the level increase above some baseline or ambient condition. A sufficiently loud noise will interfere with human activity, speech, sleep etc. regardless of the ambient noise environment. However, in quiet environments (with low ambient noise levels), even relatively “quiet” sounds may produce a negative impact to the degree that they exceed the ambient levels. Noise may also produce a disproportionately large (more than suggested by the simple overall sound level) deleterious impact due to its temporal nature and frequency content such as occurs with Impulse noise or low-frequency noise.
Noise may contain differing levels of energy over a frequency range of roughly 20 to 20,000 Hertz ((Hz), or cycles per second – the human audible frequency range). The frequency content of noise (which can be measured and expressed as a spectrum) has a significant effect on the emission and propagation of noise as well as on the human perception, loudness, and impact of the noise.
Noises that are emitted at one or more single frequencies or narrow frequency bands are known as pure tones. These pure tones are heard and often subjectively described as “hums,” “buzz,” “whine” or “whistle.” It is well established in scientific literature that noise containing pure tones is more intrusive, disruptive, and annoying than broadband noise of a similar level.
In a very crude attempt to create metrics that approximated the simple frequency response of human hearing; the A,C, and Z (zero-weighting or linear) frequency weightings were developed based upon equal loudness curves over 70 years ago (denoted dB(A), dB(C) and dB/dB(Z)). In the subsequent 70 years, more accurate and representative metrics and human loudness descriptors have been developed. The A-weighting filter (used in the Puerto Rico noise regulations) is essentially a low-pass acoustical filter which filters out, deemphasizes, or rejects low frequency acoustical energy below 500 Hz. The A-weighted decibel has been proven over time to be highly correlated with the risk of occupational noise induced hearing loss and this has led to widespread
use and familiarity with the A-weighted decibel. This has also led to overuse and over-emphasis on the A-weighted decibel in noise regulations (many practitioners are unaware of the limitations and alternatives). The A-weighted decibel will understate the loudness and human impact of sound containing strong low-frequency energy or tones.
2 METHODOLOGY
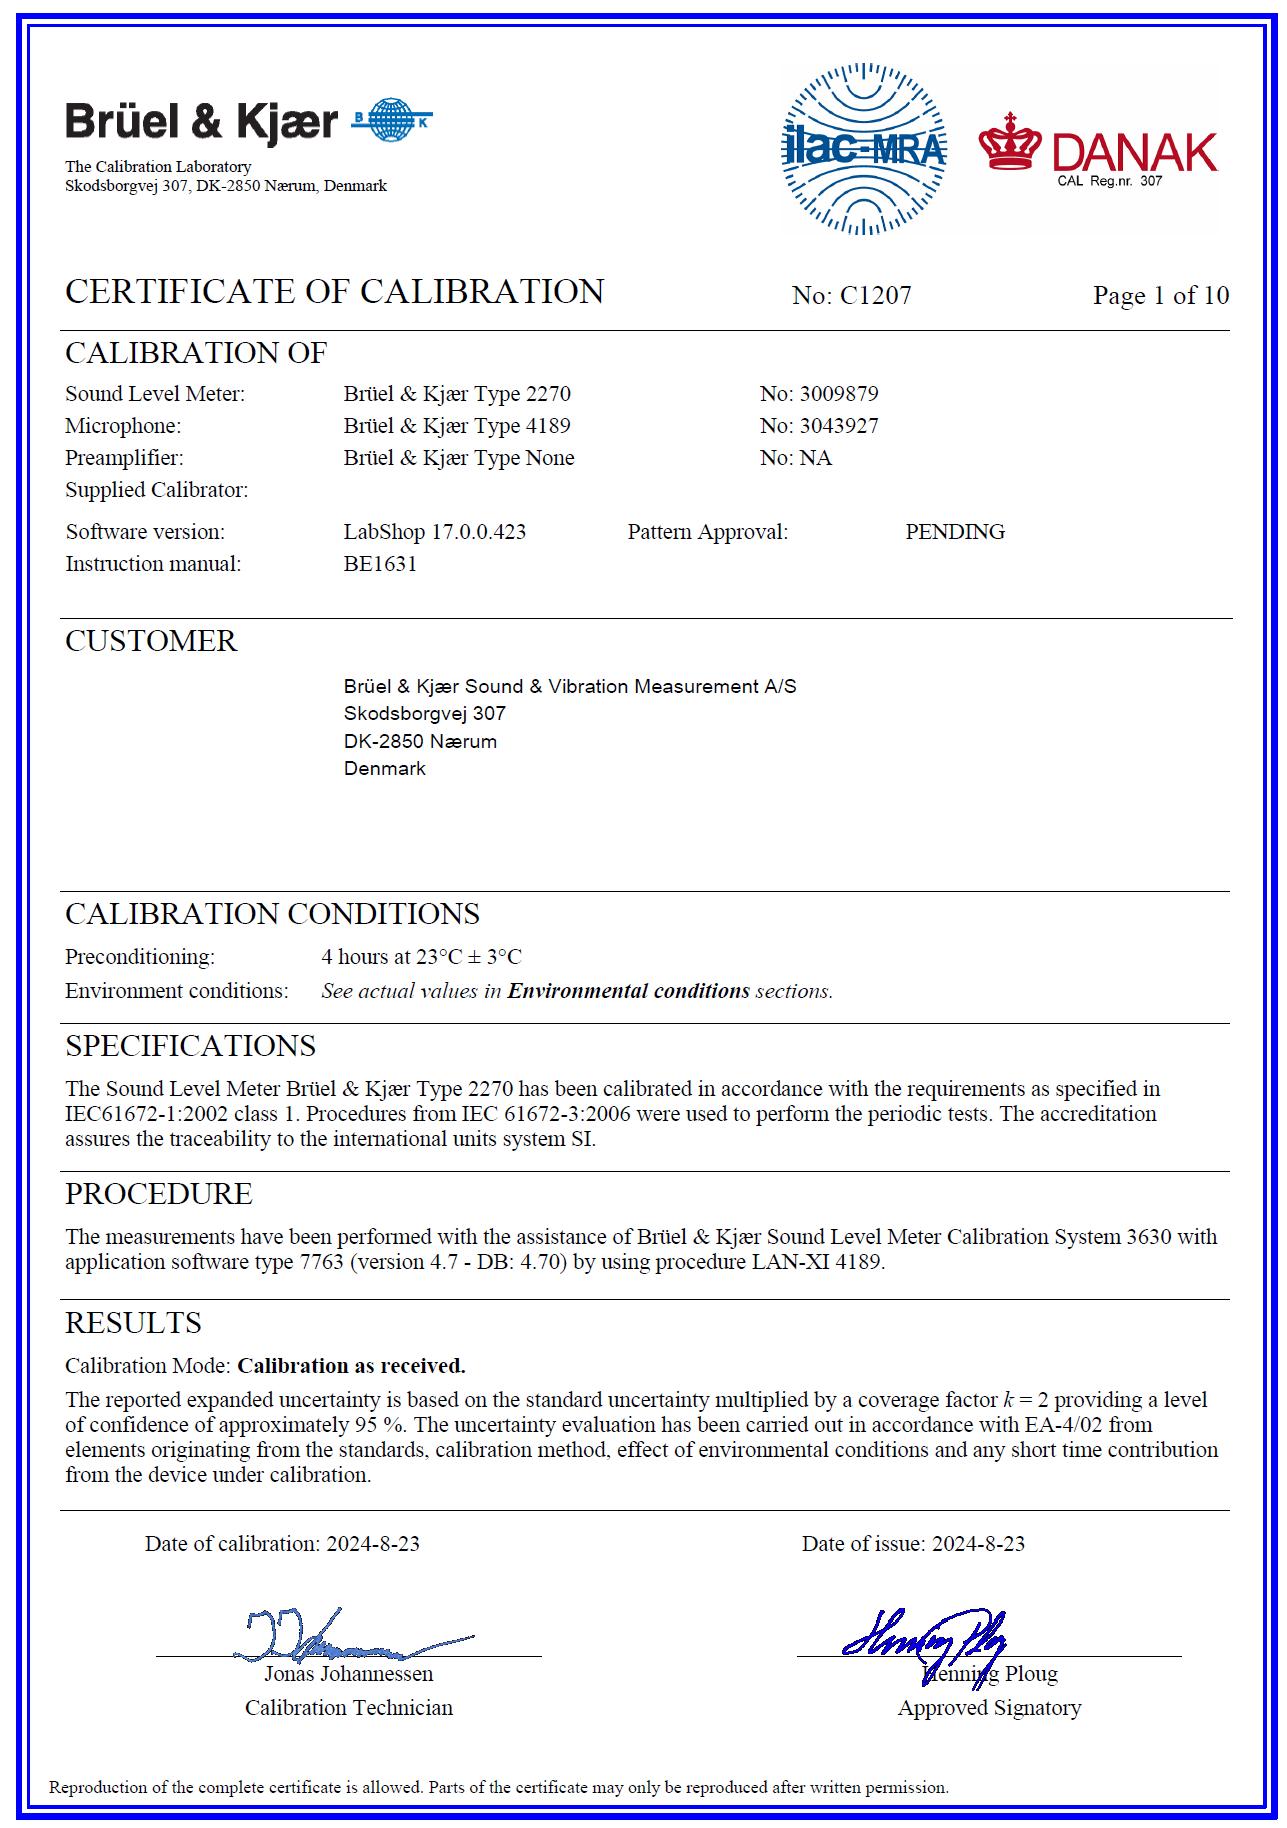
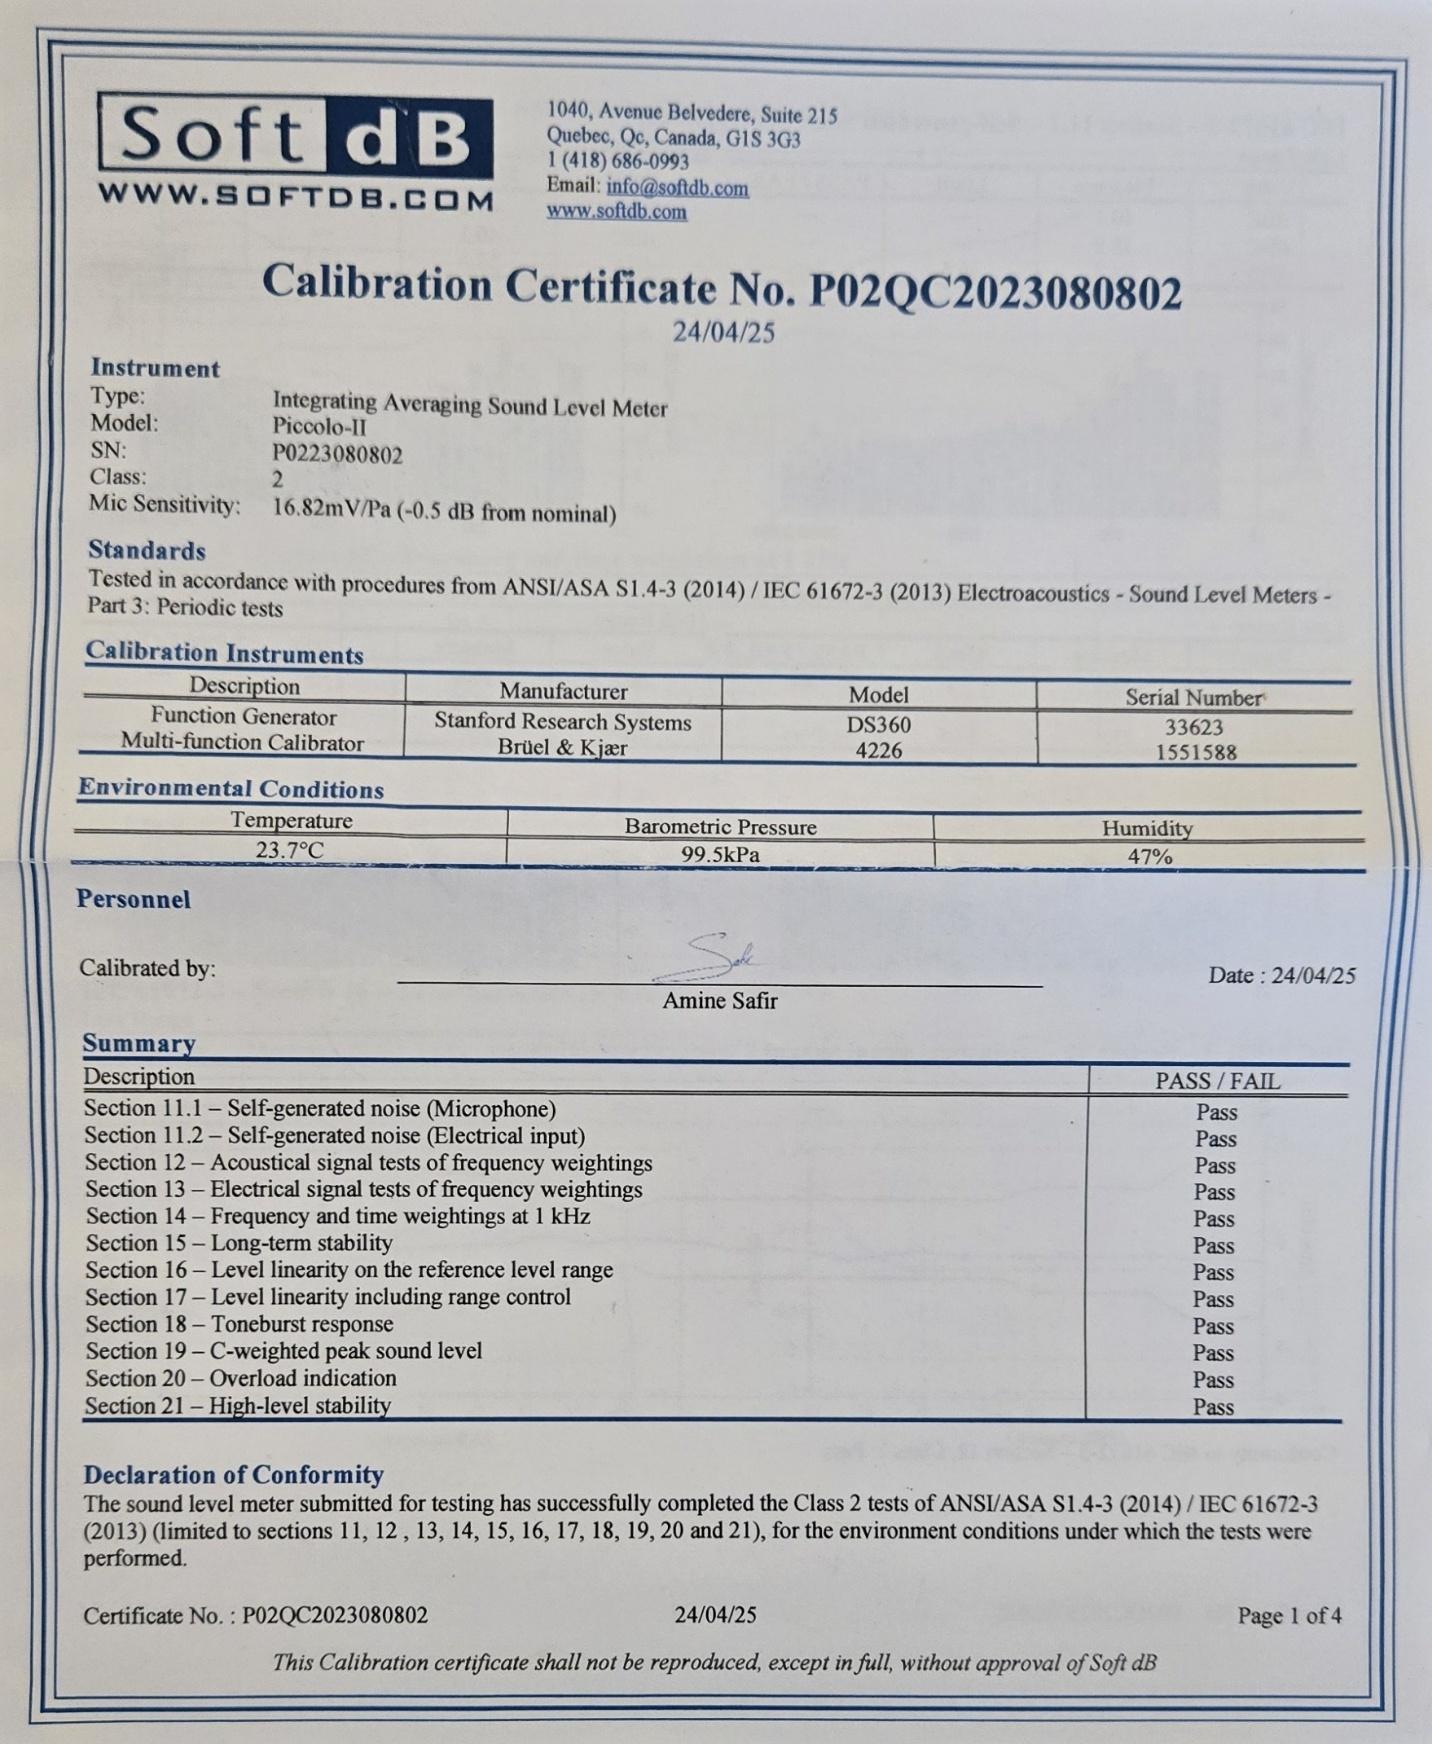
TAV measured and monitored the noise emissions produced by the Steri-Tech facility including noise incident on the homes in La Margarita Urbanization. TAV measured and monitored using a Bruel & Kjaer 2270 Sound level meter/Analyzer and a SoftdB Piccolo-II sound level meter (the calibration certificates for both devices are shown in the report appendix). All measurements and testing were performed according to accepted industry best practices and in compliance with applicable US/International (ANSI, ISO) standards and guidelines. The sound level meters were traceably calibrated within the last 12 months and were field calibrated at the start and completion of this project. Noise testing was performed at two primary locations shown in Figure 1, with a noise monitor located at point 1 and testing at points one and two (including on the interior of the home).
The measured noise levels and spectra were evaluated in terms of the Puerto Rico noise regulation limits and relative to industry noise impact guidelines.

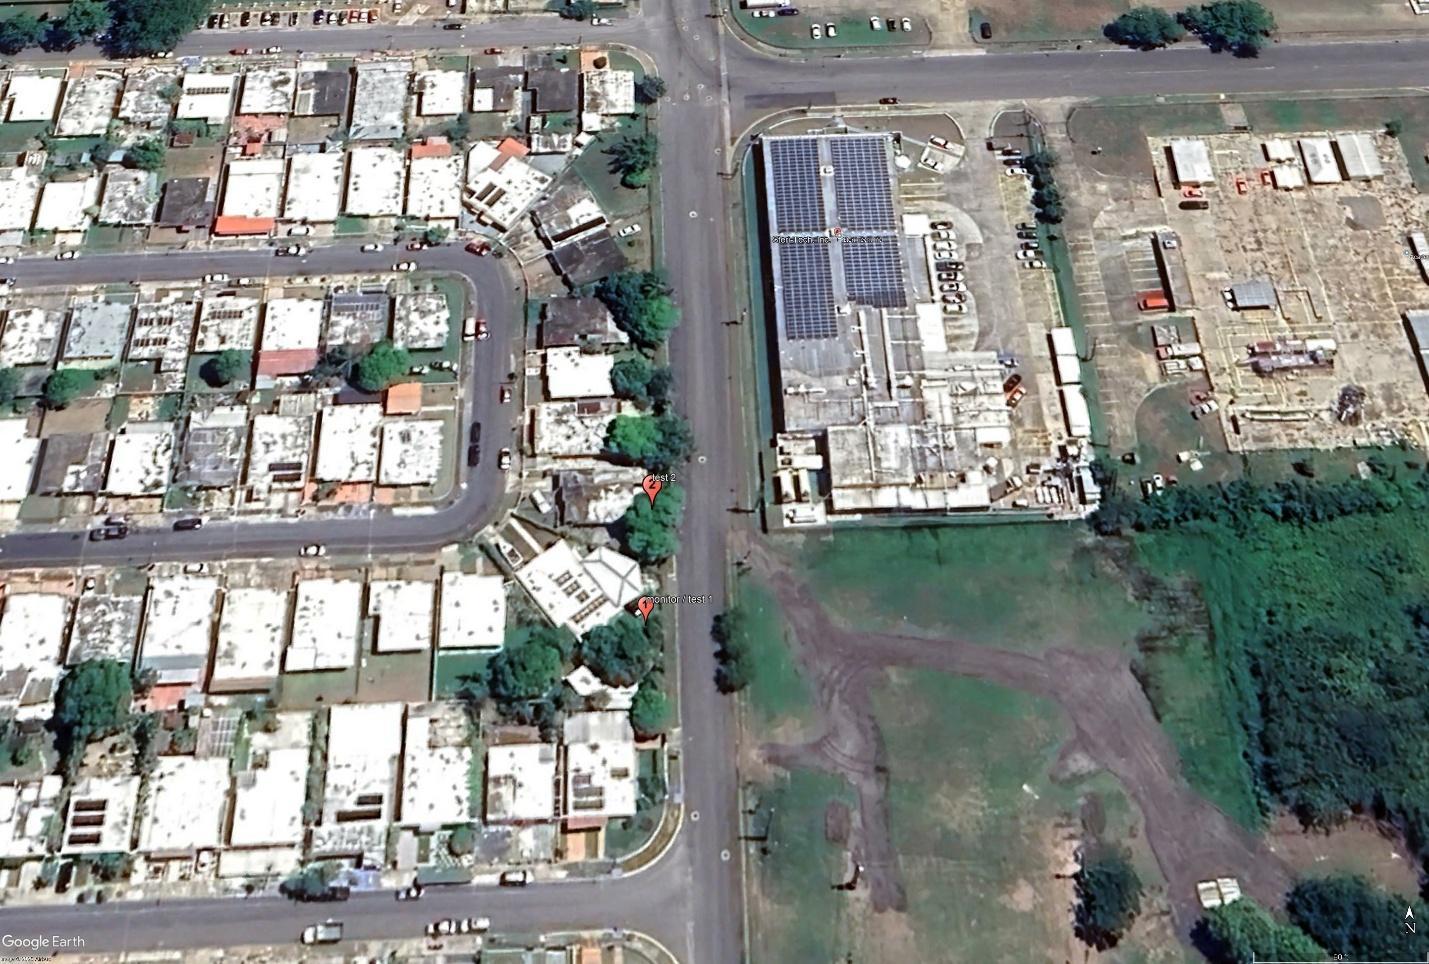
Figure 1 Aerial site view showing the Steri-Tech plant and La Margarita Urbanization. Test/monitoring locations indicated by red place markers.
2.1 NOISE MONITORING/TESTING
A noise monitor was installed at point one and used to measure and record the noise levels and spectra, computed in 15-minute intervals, continuously from March 9 until March 11, 2025.
Additional spot measurements were collected periodically throughout the study to augment the monitor data. These measurements were collected at points 1, 2, and in the residence at point 1 as well as other community locations.
2.2 COMMONWEALTH OF PUERTO RICO NOISE REGULATIONS
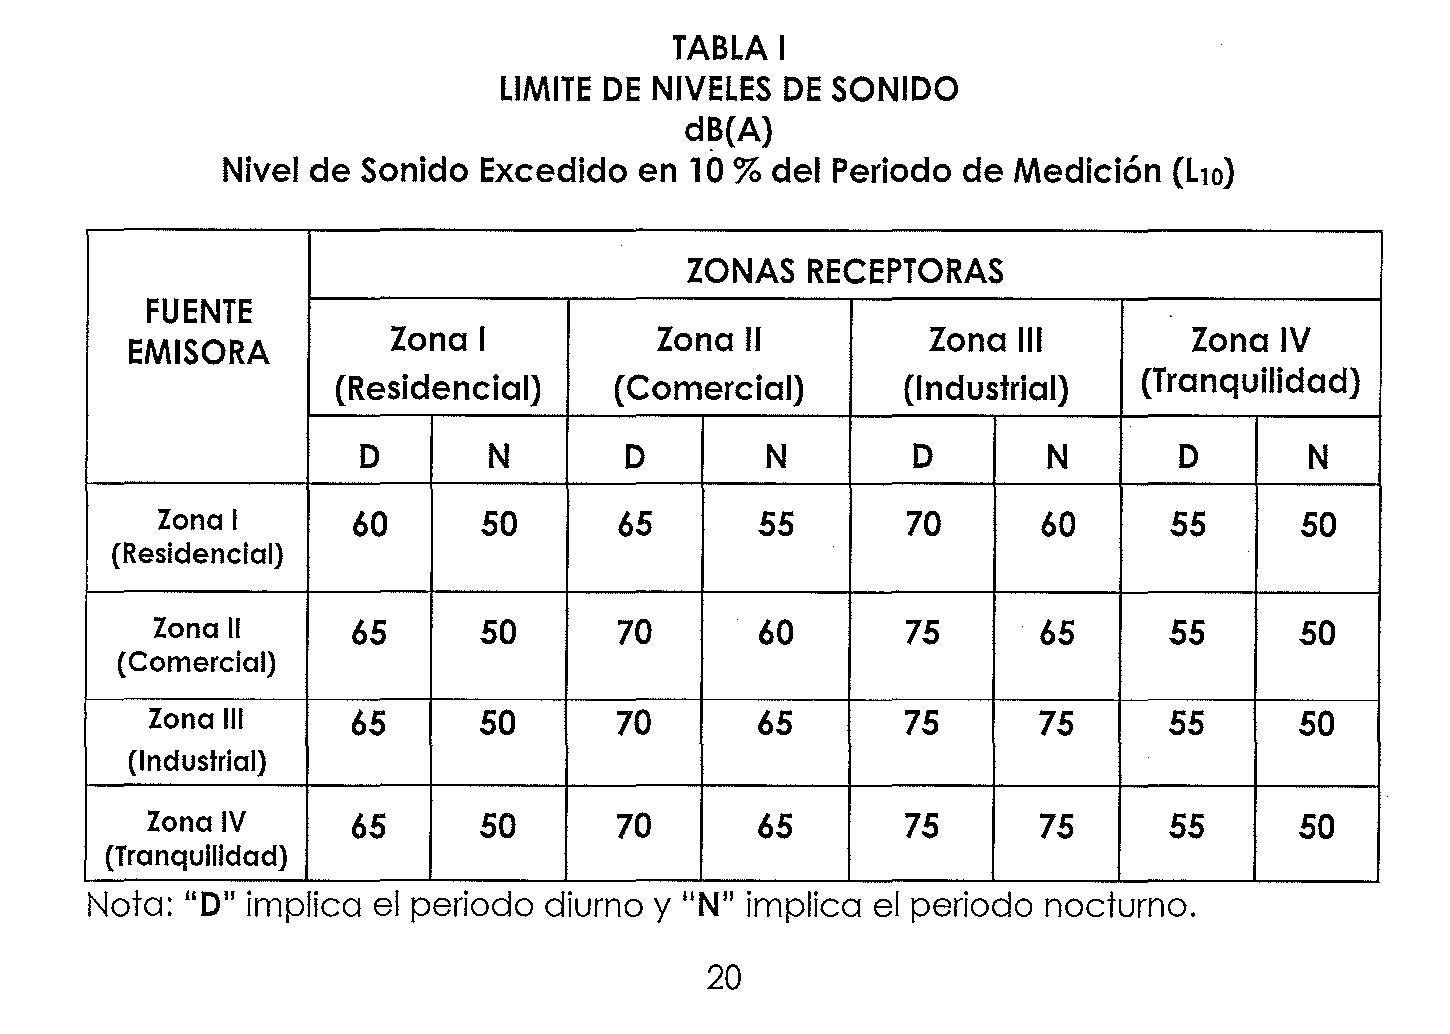
The Commonwealth of Puerto Rico has enacted environmental and community noise regulations that are applicable to the noise incident in this community. The Regulation title page and limits are shown in Figures 2 and 3, respectively.
The limits for a residential receiver due to a commercial/industrial source, expressed in terms of the A-weighted sound level exceeded 10% of the time (LA10), are 65 dB(A) during the daytime (7AM – 10PM) and 50 dB(A) during the nighttime (10:01PM – 6:59AM). The lower nighttime limits reflect the need for quiet during nighttime hours to allow residents to sleep with a reduced risk of sleep interference and disruption.


Figure 2 Puerto Rico Noise Regulations title page.