Powered Up - Evaluating the Year-Round Benefits of Solar and Storage in Massachusetts
Principal Authors
Synapse Energy Economics
Selma Sharaf
Pat Knight
Deniz Karabakal
Executive Summary
Massachusetts has long been at the forefront of solar energy adoption, and this leadership will continue to shape the Commonwealth’s energy future. This report highlights the role of solar and storage in achieving this future. We quantify the economic and reliability benefits of solar and storage in Massachusetts and aim to inform effective energy planning and policy at a time when electricity demand and prices are rising. Synapse modeled the impacts of solar and storage growth in Massachusetts and other New England states between 2025 and 2030 in two scenarios: a “Policy” case, which assumes deployment of projected solar and storage resources, and a “Reference” case, which assumes no growth of solar and storage beyond 2025 levels.
In 2030, we estimate Massachusetts solar + storage additions could contribute . . .
Lower energy costs by $313 million
Year-round reliability: 44 percent of avoided energy costs occurs from November through March
Less reliance on imported gas (by 29 Bcf) to reduce volatility and energy dollars sent out of state
Climate benefits of $432 to $721 million in avoided greenhouse gas emissions costs
We find that new solar and storage projects installed between 2025 and 2030 will deliver major energy affordability benefits for Massachusetts customers and the regional economy:
• Solar and storage additions across New England between 2025 and 2030 will save an estimated $313 million in energy costs for Massachusetts in 2030 alone. Solar and storage resources added to the electric grid lower wholesale electricity prices by increasing energy supply. Distributed resources at customer sites also decrease electricity demand, further reducing prices.
• Solar and storage have positioned Massachusetts as a regional leader in clean energy, and other New England states are aiming to follow similar trajectories. We find that solar and storage additions across the region will save an additional $371 million in the other five New England states in 2030. Solar and storage also reduce Massachusetts’ dependence on fuel imports by displacing more expensive gas-fired generation, helping customers avoid the volatile and
unpredictable price spikes associated with gas prices. By 2030, new solar and storage in Massachusetts is estimated to avoid 29 billion cubic feet (Bcf) of gas, equivalent to one-quarter of the state’s current electric-sector gas consumption.
• Solar and storage help to mitigate the most volatile aspect of customer bills, the supply charge. This produces certainty for customers and reduces the cost that customers currently pay to wholesale suppliers to reduce risk.
• Solar and storage provide benefits even in winter periods, where reliability is a growing concern. Of the estimated energy cost savings from solar and storage, 44 percent occur from November through March.
• Massachusetts-based solar and storage also provide 2030 benefits of $432 to $721 million in avoided greenhouse gas emissions.
I. Solar and Storage Are Key to Massachusetts’ Energy Goals
Massachusetts has long been a leader in solar energy, with more than 4.4 gigawatts (GW) installed as of 2025, alongside 2.3 GW of battery storage.1 A prior Synapse analysis found that behind-the-meter solar resulted in a cumulative $513 million of savings in Massachusetts between 2014 and 2019 (in 2019 dollars).2 More recently, June 2025 numbers from the New England grid operator (ISO New England) showed how solar energy allowed New England to mitigate expensive peak demand.3
There is still a long road ahead: electricity demand is rising across the country, driven by the expansion of data centers, electric vehicles, and heat pumps. ISO New England anticipates a 15 percent increase in gross annual energy use by 2034.4 Relying on gas to meet this rising demand is risky gas prices are volatile and building new pipeline infrastructure is expensive and unpopular.5 Solar, increasingly paired with battery energy storage, is fast to deploy and part of a solution to maintain grid reliability and energy independence in Massachusetts.6
For instance, the Massachusetts Clean Energy and Climate Plan for 2050 (CECP), released in December 2022, estimated that 27 to 34 gigawatts (GW) of solar capacity would be needed in Massachusetts by 2050 to reach emissions reduction requirements, alongside 5.8 GW of storage capacity.7 CECP modeling projects that 8 GW of solar and 3.5 GW of storage would need to be installed in Massachusetts by 2030 to meet the 2050 requirements.8
Massachusetts has primarily attracted solar and storage investments through the Solar Massachusetts Renewable Energy Target (SMART) program. As the SMART program evolves, it is useful for policymakers to understand the benefits of solar and storage coming online to meet growing energy demand and protect ratepayers.9
1 All capacities presented in this report are expressed in AC capacity.
2 Synapse Energy Economics. 2020. Solar Savings in New England. Available at: https://www.synapse-energy.com/new-englandsolar-savings
3 Wasser, M. 2025. “How rooftop solar is helping New England stay cool during the heat wave.” WBUR. Available at: https://www.wbur.org/news/2025/06/24/behind-the-meter-solar-peak-demand-iso-new-england
4 ISO New England. 2025 CELT Report. Available at: https://www.iso-ne.com/system-planning/system-plans-studies/celt/
5 Johnson, E. 2025. “ISO New England Overview and Regional Update”. ISO New England. Available at: https://www.isone.com/static-assets/documents/100023/isone_2025_04_23_nh_bia.pdf.
6 EIA. 2025. “Solar, battery storage to lead new U.S. generating capacity additions in 2025”. Today in Energy. Available at: https://www.eia.gov/todayinenergy/detail.php?id=64586
7 Massachusetts Executive Office of Energy and Environmental Affairs. 2022. Clean Energy and Climate Plan for 2050. Available at: https://www.mass.gov/doc/2050-clean-energy-and-climate-plan/download.
8 Massachusetts Executive Office of Energy and Environmental Affairs. 2024. “Massachusetts Clean Energy and Climate Plan for 2025 and 2030”. Massachusetts Workbook of Energy Modeling Results 2024, Full Scenario Available at: Source: https://www.mass.gov/doc/massachusetts-workbook-of-energy-modeling-results/download
9 Massachusetts Department of Energy Resources. 2025. “Solar Massachusetts Renewable Target (SMART).” Available at: https://www.mass.gov/solar-massachusetts-renewable-target-smart
Massachusetts’ SMART Program Updates
The initial version of the SMART program set a target of 1,600 MW and used a declining rate structure to compensate homeowners and businesses for producing solar energy.a The target was doubled in 2020 to 3,200 MW with a program expansion, known as SMART 2.0. SMART 2.0 was designed to maximize the program’s benefits to the electric grid by enabling more battery energy storage projects through the Energy Storage Adder, which compensates projects that colocate solar and storage.b
The federal One Big Beautiful Bill (OBBA), enacted in July 2025, significantly alters the landscape for clean energy incentives. It accelerates the phase-out of federal tax credits, including the 30 percent residential solar tax credit. In anticipation of the deleterious effects of OBBA on the solar energy industry in Massachusetts, the Department of Energy Resources filed SMART 3.0 as an emergency regulation in June 2025.c Instead of the declining rate structure, the State will recalibrate rates and capacity annually. This will allow the program to adapt to shifting circumstances such as tariff-driven price increases, supply chain constraints, and federal incentive rollbacks.
a In other words, the incentive rates were lowered each time an enrollment tier was filled.
b Massachusetts Executive Office of Energy and Environmental Affairs. 2021. Solar Massachusetts Renewable Target (225 CMR 20.00): Guideline on Energy Storage. Available at: https://www.mass.gov/doc/ess-guideline-clean-final-092221/download
c Massachusetts Department of Energy Resources. 2025. “SMART 3.0 Program Details” Available at: https://www.mass.gov/info-details/smart-30program-details
Against this backdrop, this report quantifies the economic and reliability benefits of continued solar and storage deployment demonstrating how these resources support Massachusetts in meeting its energy goals and keeping energy affordable for households and businesses.
II. Quantifying the Energy Benefits of Solar and Storage
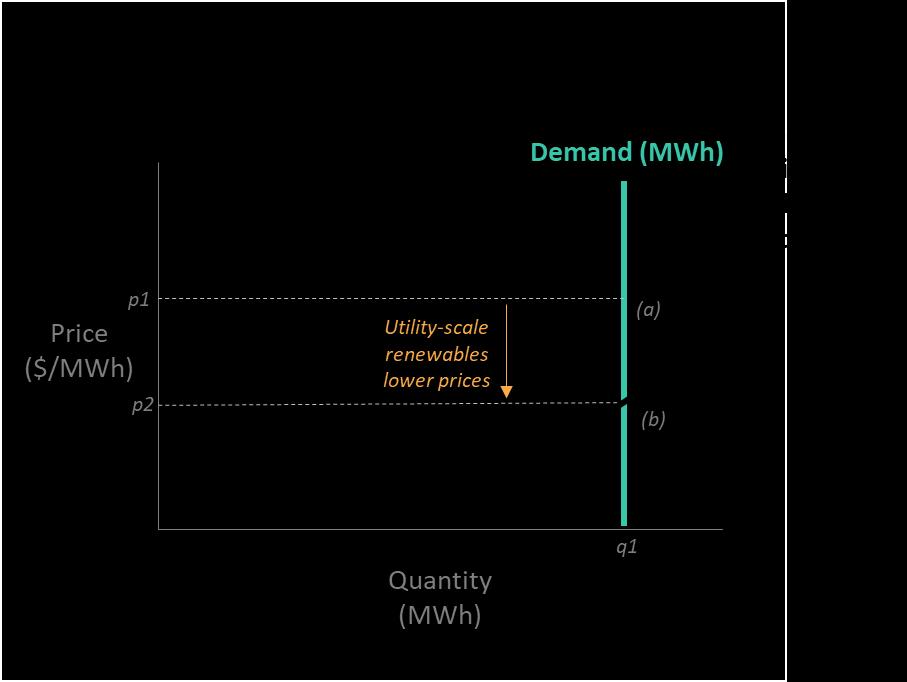
Unlike fossil-fuel-fired power plants, solar and storage produce and dispatch electricity with no variable costs (i.e., no fuel or variable operations and maintenance costs). This allows utility-scale solar resources to bid into the wholesale energy market at or near zero dollars per MWh. ISO New England operates a lowest-cost-based wholesale energy market system, so it dispatches these resources first. As a result, these resources reduce the price that the entire wholesale energy market pays for electricity, with this benefit flowing down to the retail electricity rates that customers see on their bills each month. These wholesale cost savings can be referred to as “avoided energy costs”. Since ISO New England operates a regional wholesale energy market for all six New England states, installations of utility-scale solar and storage in any one of these states impacts prices across the region.
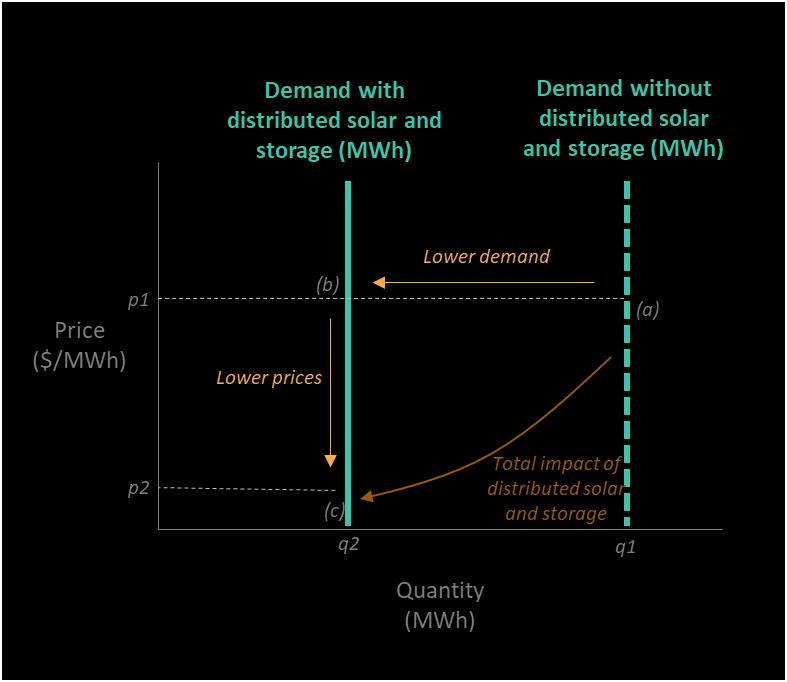
Distributed solar and storage also decrease demand on the grid by providing energy at or near where it will be consumed. This decrease in demand effectively provides two different mechanisms to drive down electricity costs: it decreases the overall amount of electricity purchased by and from the market, and in doing so, it lowers the market clearing price (since the price is set by the most expensive resource needed to meet demand). These cost savings are also a form of avoided energy costs.
In addition, energy storage can enhance the benefits of solar by charging during periods with low demand and thus lower electricity prices and discharging during periods of high demand and high prices. This allows the system to meet hourly demand while avoiding the need to dispatch more expensive resources. See Figure 1 for an illustration of the impact of zero marginal-cost utility-scale resources on the wholesale energy market, and Figure 2 for an illustration of the market effects of distributed solar and storage.
Figure 1. Price effects for utility-scale solar and storage
Estimating electricity prices
The main factors impacting electricity prices in New England are electricity demand, gas prices, and Regional Greenhouse Gas Initiative (RGGI) prices, in that order. We conducted regression analyses using historical data from 2018 to 2024 to estimate electricity prices in the region based on these three variables. We conducted this analysis for each month of the year, for “on-peak” and “off-peak” periods. We produced 24 predictive equations of hourly wholesale electricity price, each corresponding to a month and on-peak or off-peak periods.10
Calculating avoided energy costs
The Massachusetts CECP provides projections of solar and storage installations in New England by state. To convert these totals into distributed, utility-scale, paired, and standalone resources, we relied on data from ISO New England forecasts and data from the SMART Program.11 We present our projections of 2030 solar and storage capacity for Massachusetts in Table 1.
10 We use the ISO New England definitions of these time periods. On-peak is weekdays from 7 am to 11 pm; off-peak is weekdays from 11 pm to 7 am, plus weekends and holidays.
11 We use the ISO New England definitions of distributed and utility-scale solar: Distributed resources are interconnected to the distribution system (either behind-the-meter or interconnected directly to the distribution system) and typically have nameplate capacities of 5 MW or less. Utility-scale resources are connected to the transmission system.
Figure
Table 1. Modeled resource quantities for Massachusetts (GW)
We modeled two 2030 scenarios: a “Policy” case adopting the Table 1 projections and a “Reference” case in which solar and storage capacities are maintained at 2025 levels. We then converted these solar capacities (measured in GW) into hourly MWh generation using hourly capacity factors from ISO New England. Storage resources were assumed to charge during the hours with the lowest electricity prices (and likely the lowest demand) and discharge during hours with the highest electricity prices (and likely the highest demand). See Appendix A for our detailed storage assumptions.
For each hour of the year, we calculated ISO New England energy prices using the predictive equations from the regression analyses. We adjusted the demand input to account for the load not met by solar, storage, or other resources we expect to come online during the modeling timeframe (Vineyard Wind, Revolution Wind, and New England Clean Energy Connect).12 We multiplied these energy prices by the total ISO New England electricity demand to obtain total hourly costs. The difference between the Policy and Reference cases represents the costs avoided in 2030 through new solar and storage installed since 2025 (i.e., “avoided energy costs”)
These energy benefits can be classified as “load impacts,” or benefits associated with reducing the overall consumption of electricity (caused by distributed resources) and “price impacts,” or benefits associated with changing the market clearing price (caused by both distributed and utility-scale resources). We allocated price impacts to each state based on the amount of new solar and storage resources installed, and we allocated load impacts based on the amount of electricity consumed by each state.
Finally, we repeated this analysis for 24 weather-years to reflect a wide range of possible conditions and resulting benefits in 2030.
12 New wind, hydro, and other zero-marginal cost resources have price suppression effects in both the Reference case and the Policy case. As the supply curve is extended, there are diminishing returns from adding zero-marginal cost capacity. Without these other resources in place, the benefits from solar and storage would be even higher
III. What We Found
NEW SOLAR AND STORAGE PROVIDE $313 MILLION IN ANNUAL BENEFITS TO MASSACHUSETTS
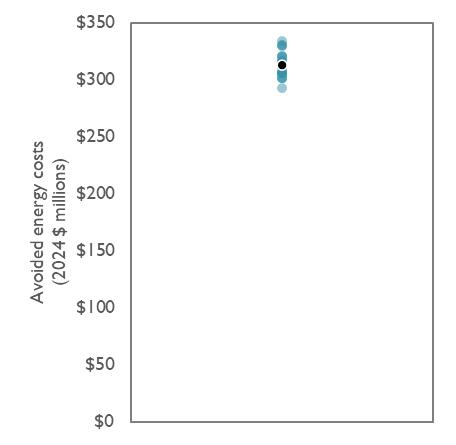
We estimate that new solar and storage will produce energy benefits of about $313 million (in 2024 dollars) in Massachusetts in 2030 (see Figure 3). We find that about 20 percent of the estimated benefits are due to load effects and 80 percent are from price effects. Solar and storage provide similar avoided energy cost benefits to the other New England states, totaling $371 million across Connecticut, Maine, New Hampshire, Rhode Island, and Vermont.
Figure 3. Distribution of 2030 savings across weather-years in Massachusetts
The upper bound represents a higher contribution from solar and storage (e.g., heat waves)
Average
The lower bound represents a lower contribution from solar and storage (e.g., temperate weather)
These benefits could grow as temperatures and loads increase in future years. The range of data points in Figure 3 reflects scenarios in which 2030 experiences weather conditions from historical years that were temperate, hot, and cold. The points are clustered, highlighting that the benefits of solar and storage are robust over a range of weather conditions. Across the distribution of years, energy cost savings in Massachusetts in 2030 rise as high as $334 million (under weather-year 2022). This is a year where solar and storage contributions particularly align with high load hours, lowering energy costs.
SOLAR AND STORAGE MITIGATE THE VOLATILITY OF NATURAL GAS AND RETAIL SUPPLY CHARGES
By displacing natural-gas-fired generation, solar and storage resources will help New England retain energy dollars that would otherwise flow out of the region to pay for natural gas fuel. The Policy case avoids the consumption of 29 Bcf of gas in Massachusetts in 2030. This is about one-quarter the amount of gas consumed by Massachusetts’ electric sector in 2024.13 Without the addition of solar and storage, Massachusetts would have to depend on importing this fuel rather than generating electricity with instate resources. Furthermore, with increasing levels of electricity consumption (especially during winter months), the deployment of new clean energy resources could avoid the need for additional gas pipeline infrastructure. These pipeline resources are challenging to construct and not inexpensive: dollaradjusted estimates for projects proposed in the mid-2010s are priced at $640 million per year to supply about 0.9 Bcf per day of additional gas capacity.14
Understanding customer bills
The primary two components of residential electricity bills in Massachusetts are supply and delivery charges. Supply charges include the cost of generating electricity and procuring capacity. They are largely tied to the marginal resource (for New England, that’s gas). Delivery charges include the cost of transporting electricity from the grid to the customer, as well as charges related to state policy initiatives such as SMART and energy efficiency programs. Wholesale energy cost-suppression decreases the supply component of customer bills but does not affect the delivery charge.
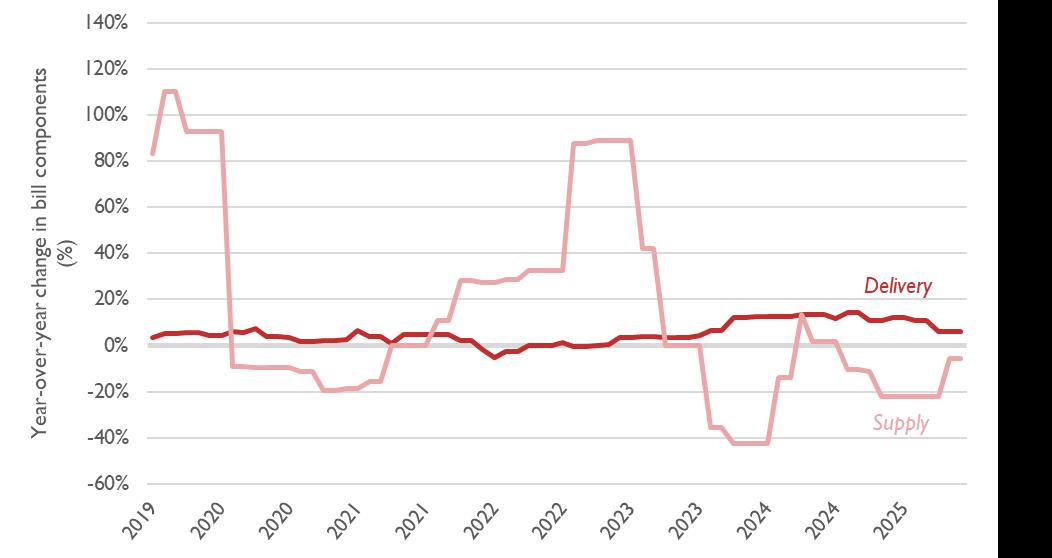
To provide context on the role of supply in customer bills, we analyzed historical electricity bills from the two largest investor-owned utilities in Massachusetts (Eversource and National Grid). Our findings show that while historical delivery charges have remained relatively stable over time, supply charges are much more volatile (see Figure 4). Over the time period from October 2019 to September 2025, the average supply component of a typical residential customer bill in Massachusetts varied greatly, from $67 to $184 (in 2024 dollars).15 Solar energy can protect ratepayers from this volatility by reducing reliance on gas, particularly during times of high demand when gas prices spike.
13 U.S. Energy Information Administration. 2025. “Natural Gas Consumption by End Use”. Natural Gas Data. Available at: https://www.eia.gov/dnav/ng/ng_cons_sum_dcu_sma_a.htm.
14 “New England’s Shrinking Need for Natural Gas.” Synapse Energy Economics. February 2017. Available at https://www.synapse-energy.com/sites/default/files/New-Englands-Shrinking-Need-for-Natural-Gas-16-109.pdf
15 This assumes 600 kilowatt-hour (kWh) monthly energy usage.
4. Year-on-year changes in monthly Massachusetts bill components
Source: Average of Eversource and National Grid rates from RateAcuity. Changes are estimated assuming a typical residential customer using 600 kWh per month
SOLAR AND STORAGE BOOST RELIABILITY AND AFFORDABILITY THROUGHOUT THE YEAR, EVEN IN THE WINTER
As electrification of heating increases, Massachusetts’s hour of highest demand its peak is expected to shift from the summer to the winter. Transportation electrification will likely further drive up this peak. Both the magnitude and the timing of peak demand have implications for grid reliability. Currently, New England relies heavily on natural-gas-fired power plants, which are subject to freezing and fuel availability constraints during extreme winter weather.
16
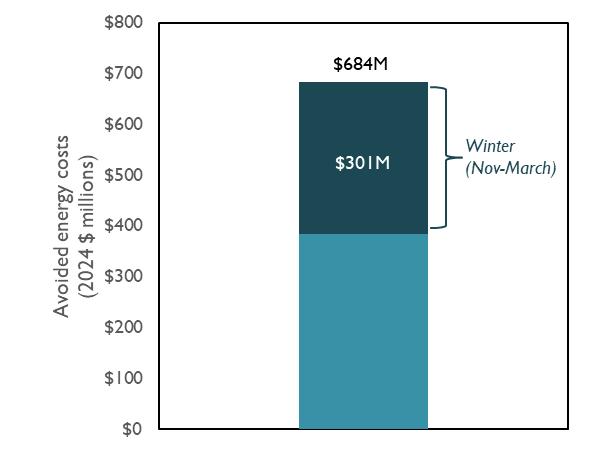
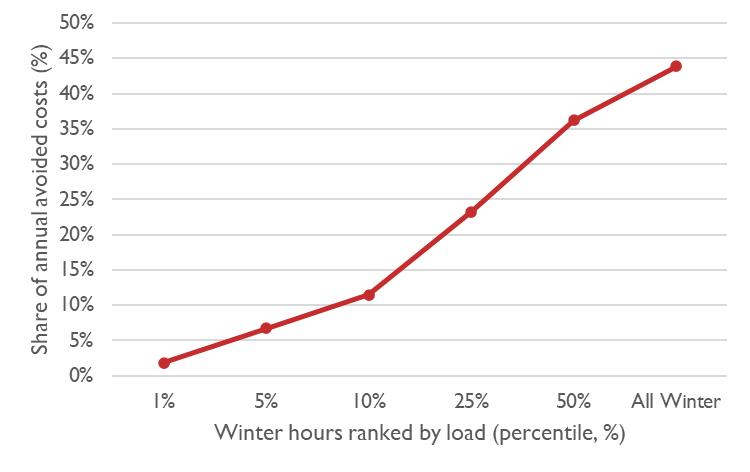
We find that solar and storage will provide valuable contributions to winter reliability. In the top 50 percent of winter hours ranked by load in 2030, solar and storage serve 11 percent of demand, on average across all weather-years. Battery storage shifts net load and flattens the peak by charging when there is excess generation and discharging during high-demand periods. Solar resources complement storage by producing that excess supply with little to no variable cost. Of the avoided costs from solar and storage additions in New England modeled in the Policy case, 44 percent occur in the November through March winter months (see Figure 5). Many of these savings are realized during the highest-load winter hours, when reliability risk is greatest (see Figure 6).
16 Arbaje, P., Specht, M. 2024. “Gas Malfunction: Calling into Question the Reliability of Gas Power Plants”. Union of Concerned Scientists. Available at: https://www.ucs.org/resources/gas-malfunction#top
Figure
5. Winter share of avoided-cost benefits from New England solar and storage additions
6. Share of solar and storage benefits by winter hour load percentile
Figure
Figure
SOLAR AND STORAGE AVOID $432 TO $721 MILLION PER YEAR IN GREENHOUSE GAS COSTS, AMONG OTHER BENEFITS
Our analysis estimates that the projected solar and storage additions will avoid about 1.6 million metric tons of carbon dioxide emissions in Massachusetts in 2030. Entities in New England use varying assumptions for the social cost of carbon. The 2024 edition of the Avoided Energy Supply Components in New England (AESC) study provides a range from $271 to $453 per metric ton for 2030. 17 Applying this range of values to 1.6 million metric tons yields a range of avoided greenhouse gas emission benefits from $432 to $721 million.
Other benefits not quantified in this study include avoided capacity costs, avoided transmission investments, ancillary services, and public health benefits.
17 Synapse Energy Economics. 2024. Avoided Energy Supply Components in New England: 2024 Report. Table 94. Prepared for AESC 2024 Study Group. Available at: https://www.synapse-energy.com/sites/default/files/inlineimages/AESC%202024%20May%202024.pdf
IV. Conclusions
Massachusetts’ long-standing clean energy leadership will necessarily adapt to meet changing circumstances in the energy sector. Based on its energy goals and the strategies developed to meet them, Massachusetts will need to ensure solar and storage play a central role in the future of energy in Massachusetts and New England. By 2030, the addition of these resources will result in energy cost savings, reduced reliance on gas, reliability contributions, and other benefits. We present a summary of our findings in Table 2.
These findings provide insight into the fundamental role of solar and storage in Massachusetts’ energy portfolio. Key benefits include:
• Lower energy costs: Solar and storage additions reduce energy costs in 2030 by an average of $313 million in Massachusetts and $684 million across New England.
• Reduced reliance on imported gas: Solar and storage allow Massachusetts to decrease its dependence on imported gas resources, reducing the need for 29 Bcf of gas in the state in 2030. This keeps dollars within the local economy, protects Massachusetts families and businesses from gas price volatility, and helps avoid costly new infrastructure.
• Year-round reliability: Solar and storage deliver benefits even in winter months, with 44 percent of avoided energy costs occurring from November through March.
• Climate benefits: Massachusetts-based solar and storage provide an estimated $432 to $721 million in avoided greenhouse gas emissions benefits in 2030. Reducing emissions helps protect residents from expensive climate impacts of gas-fired generation.
Table 2. Summary of solar and storage impacts in Massachusetts
Appendix A. Input Assumptions
Table 3. List of key input assumptions
Hourly load forecast
Loads
Solar and storage forecast
Capacities
Distributed vs. utility-scale
Based on ISO New England’s 2025 load forecast, which includes electric vehicles and building electrification. Load is projected on an hourly level for each New England state. We model 2030 over 24 weather-years to reflect varying solar, wind, and load conditions.
Interpolated using the MA CECP forecast. We estimated capacities for each New England state, for 8 different categories of resources (combinations of solar/storage, distributed/utility-scale, and standalone/paired).
Assumed a percentage breakdown based on ISO New England 2025 PV forecast.
Paired vs. standalone Assumed a percentage breakdown based on data from MA’s SMART program.
Capacity factors Based on ISO New England data.
Storage dispatch
Charging and discharging patterns
Storage characteristics
Other resources
Resource additions besides solar and storage
Other variables
Gas prices
Daily charging and discharging profile for each month based on our analysis of electricity prices with only solar.
Assumed average duration of 4 hours. For other parameters, we adopted defaults from EPA’s AVoided Emissions and geneRation Tool (AVERT):18 lithium-ion batteries with 80% depth of discharge, 85% round-trip efficiency, and 150 maximum allowable discharge cycles per year (on the 150 highest load days).19, 20
Assumed Vineyard Wind, Revolution Wind, and New England Clean Energy Connect will come online by 2030 and impact the supply curve alongside solar and storage resources.
Historical prices and short-term futures from Natural Gas Intelligence, long-term price forecast from U.S. Energy Information Administration’s 2025 Annual Energy Outlook. We used variation in daily heating degree days to translate monthly gas prices to hourly values.
RGGI prices From RGGI, Inc. (forecasted prices from Case B Policy Scenario).
Historical electricity prices From ISO New England data.
Avoided emissions inputs
Marginal CO2 emissions rate From Avoided Energy Supply Costs in New England 2024 Report, Table 97. Gas CO2 emissions rate From U.S. Energy Information Administration. Social cost of carbon Based on Avoided Energy Supply Costs in New England 2024 Report.
18 AVERT User Manual – Appendix K. Synapse Energy Economics for US EPA. April 2024. Available at: https://www.epa.gov/system/files/documents/2024-04/avert-user-manual-v4.3.pdf.
19 Cole, W. and A.W. Frazier. 2019. Cost Projections for Utility-Scale Battery Storage. NREL. Available at: https://www.nrel.gov/docs/fy19osti/73222.pdf
20 Viswanathan, V., et al. 2022. 2022 Grid Energy Storage Technology Cost and Performance Assessment. PNNL. Available at: www.pnnl.gov/sites/default/files/media/file/ESGC%20Cost%20Performance%20Report%202022%20PNNL33283.pdf