Seesaw contracted with Instructure to examine the impact of its platform usage on student literacy outcomes. Instructure designed the study to satisfy Level III requirements (Promising Evidence) according to the Every Student Succeeds Act (ESSA, 2015)
Study Sample and Methodology
This study was conducted with data from the 2024–25 school year and included 3,254 K–5 students across one public school district in Oklahoma Researchers conducted analyses by grade band to allow for better interpretability of findings: Kindergarten–Grade 1 (39%), Grade 2 (22%), and Grades 3–5 (38%).
The sample was racially and ethnically diverse, comprising students who identified as White/Caucasian (32%), Black/African American (26%), Hispanic (20%), and Multiracial (19%). In terms of socioeconomic status, 68% of students were eligible for free or reduced-price lunch. Six percent were designated as English learners (EL), and 16% were identified as students need special education. Slightly over half of the sample (51%) identified as female.
Researchers used three measures to examine Seesaw implementation and its potential impact on student literacy outcomes: Seesaw usage data, Renaissance Star Early Literacy (for the K–1 sample), and Star Reading (for Grades 2–5). Regression analyses were conducted to explore the association between Seesaw use and student literacy outcomes, controlling for prior literacy achievement. The models included key student-level covariates grade, race/ethnicity, free or reduced-price lunch status (FRL), English learner status (ELL), special education status (SPED), and gender to account for potential selection bias.
Main Research Findings
Main Research Findings
Kindergarten-Grade 1
Students whose families engaged with their Seesaw work more often tended to have better EOY literacy scores
Students who engaged more by posting voice or video work on Seesaw tended to have better EOY literacy scores.
ELL Students whose families engaged with their Seesaw work more often and who engaged more by posting voice or video work on Seesaw tended to have better EOY literacy scores.
Greater student engagement with the Reading Fluency Assessment feature was associated with higher EOY literacy scores.
Grade 2
No evidence that family visits to student work or the number of students’ voice or video posts were associated with EOY literacy scores
Greater student engagement with the Reading Fluency Assessment feature was associated with higher EOY literacy scores
Grades 3-5
No evidence that family visits to student work or the number of students’ voice or video posts were associated with EOY literacy scores
ELL Students whose families engaged with their Seesaw work more often and who engaged more by posting voice or video work on Seesaw tended to have lower EOY literacy scores.
Note: All the above findings were statistically significant at p < .05
Conclusions
Given the positive findings, this study provides results to satisfy ESSA evidence requirements for Level III (Promising Evidence).
Introduction
Recent national assessments have revealed that student performance in literacy continues to be a significant concern in the United States. The 2024 administration of the National Assessment of Educational Progress (NAEP) showed that average reading scores for fourth-grade students were 5 points lower compared to 2019 (National Center for Education Statistics [NCES], 2024). Furthermore, the results indicated that only 31 percent of fourth-graders performed at or above the NAEP Proficient level, a decline of 4 percentage points from 2019. These ongoing challenges highlight the critical need for effective literacy instruction and engagement, particularly in the early grades.
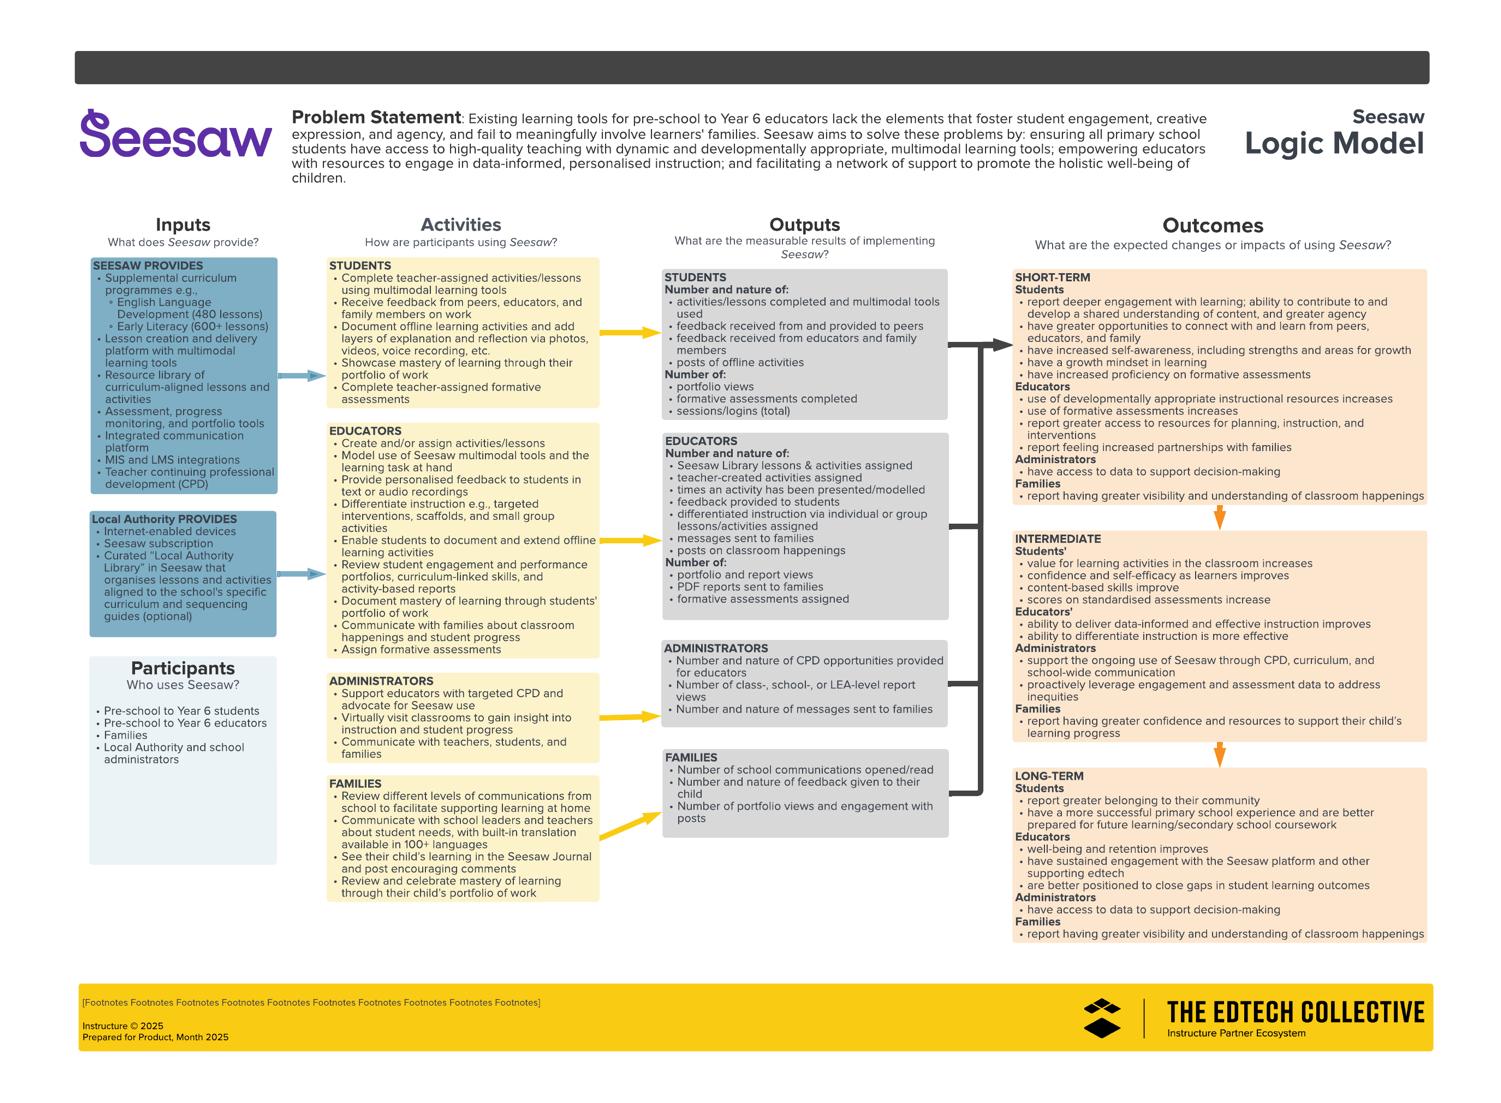
Seesaw recognizes that existing learning tools for prekindergarten to Grade 5 educators often lack the elements that foster student engagement, creative expression, and agency, and can fail to meaningfully involve learners’ families. Seesaw aims to solve these problems by ensuring all elementary students have access to high-quality instruction with dynamic and developmentally appropriate, multimodal learning tools; empowering educators with resources for data-driven, personalized instruction; and facilitating a network of support to promote the holistic well-being of children.
As part of their ongoing efforts to demonstrate the effectiveness of their solution, Seesaw contracted with Instructure to examine the association between usage of Seesaw and student literacy outcomes Using the Every Student Succeeds Act (ESSA) standards as guidance in developing a study design, findings in this report align with Level III requirements (Promising Evidence). The following research questions guided this study:
Implementation
1. To what extent did students engage with Seesaw during the school year? On average, how many
a. times did families view their child’s work on Seesaw?
b. posts did students create using voice or video recordings?
c. posts did students create using the Reading Fluency Assessment feature?
Student Outcomes
2. After controlling for prior achievement and other student demographic characteristics (e.g., grade, race, EL status, special education status, and FRL status), did students' performance on standardized literacy assessments vary based on their use of Seesaw during the school year?
This report details the study design and methods, implementation, findings, and conclusions.
Study design and methods
This section of the report briefly describes the study participants, measures, and analysis methods.
Study Design
This study used a correlative design to align with ESSA Level III evidence standards. It included all students in the district who used Seesaw during the 2024–25 school year
Setting and Participants
This study was conducted with data from the 2024–25 school year and included 3,254 K–5 students across one public school district in Oklahoma Researchers conducted analyses by grade band to allow for better interpretability of findings: Kindergarten–Grade 1 (39%), Grade 2 (22%), and Grades 3–5 (38%). The sample was racially and ethnically diverse, comprising students who identified as White/Caucasian (32%), Black/African American (26%), Hispanic (20%), and Multiracial (19%). In terms of socioeconomic status, 68% of students were eligible for free or reduced-price lunch. Six percent were designated as English learners (EL), and 16% were identified as students need special education. Slightly over half of the sample (51%) identified as female.
Measures
This study included the following measures to provide insights into Seesaw implementation and evidence about the potential impacts of Seesaw on student literacy outcomes.
Seesaw Usage Metrics Researchers analyzed 2024–25 student-level Seesaw usage data, including the total number of family visits to student work and the total number of video or voice posts. These data were used to gauge the extent of student engagement with Seesaw throughout the school year and to explore relationships between Seesaw use and student reading and math outcomes. The study also included an exploratory analysis of Seesaw’s AIpowered Reading Fluency Assessment. This tool tracks key metrics such as the percentage of words read correctly, words correct per minute, word additions, and omissions. Students record themselves reading a custom or pre-made passage independently, after which teachers receive auto-graded transcripts and class- and student-level reports, along with recorded reading samples, to monitor progress over time.
Standardized Student Assessments. Student literacy outcomes were assessed using Renaissance Star Early Literacy assessment scores for the K–1 sample and Star Reading assessment scores for Grades 2–5. The beginning-of-year (BOY) score for each assessment was used as a pretest to control for students' prior achievement, while the end-of-year (EOY) score served as the primary outcome measure. Star Early Literacy scores range from 200 to 1,100, while Star Reading scores range from 600 to 1,400, with higher scores indicating stronger literacy skills.
Data Analysis
Researchers used a variety of quantitative analytic approaches. First, researchers conducted descriptive statistics to examine participant characteristics and support implementation analyses.
To examine the association between Seesaw usage and student outcomes, researchers employed regression analysis. These models assessed the relationship between various usage metrics and end-of-year literacy scores. All models controlled for prior achievement, measured by BOY scores, and included key student-level covariates grade, race/ethnicity, FRL status, ELL status, SpEd status, and gender to account for potential selection bias.
Implementation
The analysis of program implementation drew on usage data from 3,254 active Seesaw users, as determined by available login records. Tables 1–3 present a detailed breakdown of how specific Seesaw tools were used.
Usage trends in grades 3–5 showed a noticeable decline compared with lower grades. According to the Seesaw, the administrative team shared that the district uses Canvas as its primary PK–12 platform and had previously implemented Seesaw only for K–2. The 2024–25 school year was the first full year of Seesaw use in grades 3–5, which may help explain the observed drop-off in usage in these grades.
Table 1. Descriptive statistics for total number of family visits to student work
Table 2. Descriptive statistics for and the total number of students’ video or voice posts
Table 3. Descriptive statistics for Reading Fluency Assessment posts
Effectiveness Findings for 2024–25 School Year
Regression analyses were conducted to examine the relationship between student Seesaw usage and end-of-year literacy outcomes. All models controlled for prior achievement (BOY scores) and key student-level covariates grade, race/ethnicity, FRL status, ELL status, SpEd status, and gender to account for potential selection bias. This approach isolates the unique association between each engagement metric and student outcomes, providing a clearer picture of how specific usage patterns relate to literacy performance. Standardized effect sizes (omegasquared) were calculated to quantify the strength of these relationships (see Appendix B for details)
Overall Association Between Family Engagement, Student Voice and Video Posts, and K–1 End-of-Year Literacy Scores
Students whose families engaged with their Seesaw work more often tended to do better by the end of the year even after taking into account where they started and their FRL status. Each additional visit was associated with nearly a 1-point gain in end-of-year scores, meaning a family that participated in 10 more visits than another could expect their child to score about 9 points higher (ω2 = .04, p < .001).
Similarly, students who engaged more by posting voice or video work tended to perform better by the end of the year. Each additional post was associated with about a 0.4-point gain, meaning a student who made 10 more posts could expect roughly a 4-point higher end-of-year score (ω2 = .01, p < .001). These findings albeit modest, suggest that both family involvement in student work and students’ active, expressive participation through voice and video can meaningfully influence learning outcomes.
Among K–1 students, family involvement in student work and students’ active, expressive participation through voice and video can meaningfully influence learning outcomes
Family visits to student work in Seesaw Students' voice and video posts
1. Association between Seesaw engagement metrics and end-of-year Star early literacy assessment scores for K-1 students (n = 1,282)
Kindergarten–Grade 1 English Language Learners (n = 56) Findings in this small ELL subsample mirrored the overall sample but should be interpreted cautiously. Regression analyses indicated that greater family engagement and student expressive participation were associated with higher end-of-year scores. Each additional family visit corresponded to a 1.7-point gain (10 more visits ≈
Figure
17 points; ω2 = 0.12, p = .006), while each additional student voice or video post corresponded to a 2.6-point gain (10 more posts ≈ 26 points; ω2 = 0.19, p = .001).
Kindergarten–Grade 1 Students’ Reading Fluency Assessment Posts (n = 460). Regression analyses indicated that greater student engagement with the Reading Fluency Assessment feature was associated with higher end-of-year literacy scores, even after controlling for beginning-of-year scores, ELL status, and SpEd status. Each additional post was associated with a 7.5-point increase in EOY scores (partial ω2 = 0.02, p = .004). Overall, these results suggest that engaging with the feature may provide meaningful gains in literacy
Overall Association Between Family Engagement, Student Voice and Video Posts, and Grade 2 End-of-Year Literacy Scores
For the overall second-grade sample, there was no evidence that family visits to student work or the number of students’ voice or video posts were associated with end-of-year scores. However, in the subsample of students who used the Reading Fluency Assessment feature (n = 461), regression analyses indicated that greater engagement with the tool was associated with higher end-of-year literacy scores, even after controlling for beginning-of-year scores, FRL status, and SpEd status. Each additional post was associated with a 1.2-point increase in EOY scores (partial ω2 = 0.01, p = .03).
Overall Association Between Family Engagement, Student Voice and Video Posts, and Grades 3–5 End-of-Year Literacy Scores
For the overall grades 3–5 sample, there was no evidence that family visits to student work or the number of students’ voice or video posts were associated with end-of-year scores. Among a small subsample of English learner students (n = 84), neither family visits to student work nor students’ voice or video posts were positively associated with end-of-year literacy scores. In fact, regression results indicated small negative coefficients for both engagement metrics.
Conclusions and Recommendations
Overall, findings from the 2024–25 evaluation suggest that Seesaw can serve as a meaningful platform for fostering engagement between students, families, and teachers particularly in the early grades. Across kindergarten and grade 1, higher levels of family interaction with student work and greater student participation through voice and video posts were both associated with stronger end-of-year literacy outcomes. Although these effects were modest in size, they highlight the potential value of consistent, expressive engagement in supporting early literacy development.
The exploratory analyses of Seesaw’s AI-powered Reading Fluency Assessment feature also showed promising early results. Students who used this tool more frequently tended to achieve higher literacy scores, suggesting that integrating technology-driven, student-centered practice opportunities can complement teacher-led instruction.
Findings for older students and specific subgroups (e.g., English learners and students with disabilities) were more mixed. Usage levels in grades 3–5 were lower overall, reflecting the district’s transition year in expanding Seesaw to upper elementary grades. Additionally, within the small ELL subsample, higher levels of family or student posting were not positively associated with end-of-year outcomes, underscoring the need for cautious interpretation and further investigation.
This study provides results to satisfy ESSA evidence requirements for Level III (Promising Evidence). Specifically, this study met the following criteria:
Correlative design
Proper design and implementation
Statistical controls through covariates
At least one statistically significant, positive finding
Researchers recommend the following next steps:
• Sustain and deepen early-grade engagement.
o Continue to encourage family participation and student expressive posting in K–2 classrooms, where evidence suggests the strongest links to literacy growth.
• Expand professional learning around effective Seesaw use.
o Provide targeted support for teachers especially in grades 3–5 to integrate Seesaw in ways that promote meaningful student reflection and family connection, rather than task completion.
• Differentiate engagement supports for subgroups.
o Explore tailored strategies for English learners and students with disabilities to ensure that Seesaw activities and feedback mechanisms are linguistically and developmentally accessible.
• Monitor implementation consistency.
o Continue collecting and analyzing usage data across schools and grades to identify where engagement practices are strongest and where additional coaching or communication with families may be needed.
References
Every Student Succeeds Act, Pub. L. No. 114-95 (2015). URL
National Center for Education Statistics. (2024). NAEP report card: Reading Grade 4 national results. U.S. Department of Education, Institute of Education Sciences. URL
Appendix
A. Seesaw Logic Model
Appendix B: Additional Information on Outcome Findings
Overall Association Between Family Engagement, Student Voice and Video Posts, and K–1 End-of-Year Literacy Scores
Table B1. Overall Association Between Number of Family Visits to Student Work and K-1 Students’ Literacy Outcomes on Star Early Literacy (n = 1,282)
Table B2. Overall Association Between Number of Posts with Voice and Video and K-1 Students’ Literacy Outcomes on Star Early Literacy (n = 1,282) Table B3. Association Between
B4. Association Between Number of Posts with Voice and
Table B5. Association Between Number of Reading Fluency Assessment Posts and K-1 Students’ Literacy Outcomes on Star Early Literacy (n = 460)
Overall Association Between Family Engagement, Student Voice and Video Posts, and Grade 2 End-of-Year Literacy Scores
Table B6. Overall Association Between Number of Family Visits to Student Work and Grade 2 Students’ Literacy Outcomes on Star Early Literacy (n = 730)
Table
Table B8. Association Between Number of Family Visits to Student Work and Grade 2 ELL Students’ Literacy Outcomes on Star Early Literacy (n = 48)
Table B9. Association Between Number of Posts with Voice and Video and Grade 2 ELL Students’ Literacy Outcomes on Star Early Literacy (n = 48)
Table B10. Association Between Number of Reading Fluency Assessment Posts and Grade 2 Students’ Literacy Outcomes on Star Early Literacy (n = 461)
Overall Association Between Family Engagement, Student Voice and Video Posts, and Grade 3–5 End-of-Year Literacy Scores
Table 11. Overall Association Between Number of Family Visits to Student Work and Grade 3–5 Students’ Literacy Outcomes on Star Early Literacy (n = 1,242)
Table B12. Overall Association Between Number of Posts with Voice and Video and Grade 3–5 Students’ Literacy Outcomes on Star Early Literacy (n = 1,242)
Table B13. Association Between Number of Family Visits to Student Work and Grade 3–5
Students’ Literacy Outcomes on Star Early Literacy (n = 84)
Table B14. Association Between Number of Posts with Voice and Video and Grade 3–5
Literacy Outcomes on Star Early Literacy (n = 84)
Table B15. Association Between Number of Reading Fluency Assessment Posts and Grade 3–5 Students’ Literacy Outcomes on Star Early Literacy (n = 461)