Seesaw contracted with LearnPlatform by Instructure, a third-party edtech research company, to examine the association between usage of their learning solution and student reading outcomes. LearnPlatform designed the study to satisfy Level III requirements (Promising Evidence) according to the Every Student Succeeds Act (ESSA)
Study Sample, Measures, and Methods
This treatment-only study occurred during the 2022–23 school year and included 8,133 K–5 students from 25 elementary schools from a suburban district in the midwestern US who use Seesaw. In terms of demographics, the district was racially diverse and included students who identified as Asian (4%), Black (31%), Hispanic (28%), White (28%), and other (9%) Sixteen percent of the students had individualized educational programs (IEPs), 16% had English language learner (ELL) status, and 71% had free and reduced lunch (FRL) status In addition, the percentages of students enrolled in each of the grades were as follows: kindergarten (10%), first grade (18%), second grade (18%), third grade (20%), fourth grade (19%), and fifth grade (15%).
Researchers used three measures to provide insights into Seesaw implementation and evidence about potential impacts of Seesaw on student learning outcomes: Seesaw usage metrics and NWEA MAP® RIT scores for reading and mathematics (math)
Researchers used a variety of quantitative analytic approaches. First, researchers conducted descriptive statistics to summarize participant characteristics and support implementation analyses. Researchers then conducted partial correlations and regressions to examine how Seesaw use related to student reading and math outcomes from fall 2022 (beginning of year) to spring 2023 (end of year) The analyses included student-level covariates to control for potential selection bias. In addition, researchers calculated standardized effect sizes (Hedge’s g) to determine the magnitude of changes in student outcomes
Conclusions
This study provides results to satisfy ESSA evidence requirements for Level III (Promising Evidence) given the study design and positive, statistically significant findings.
ESSA Level III Study Key Takeaways for Reading Outcomes
Number of family visits to student work in Seesaw is related to NWEA MAP® reading scores, but the association varied by grade.
Students who had more family visits to their work in Seesaw had statistically significantly higher end-of-year NWEA MAP® reading scores (r = .05; p < .001).
Students who had any number of family visits to their work (low, moderate, and high use) had slightly higher end-of-year NWEA MAP® reading scores compared to students who did not have any family visits to their work in Seesaw (effect sizes .06, .08, and .13 respectively). All these results were statistically significant (p < .001).
Students who had between 131–803 family visits to their work in Seesaw (high use) had higher end-of-year NWEA MAP® reading scores compared to students who had 36–130 family visits (moderate use; effect size .06) and 1–35 family visits (low use; effect size .07) These results were statistically significant (p < .05).
Kindergarten and grades 1 and 3 students who had more family visits to their work in Seesaw had higher end-of-year NWEA MAP® reading scores. These results were statistically significant (r = .11, r =.08, and r = .07; p < .05, respectively).
Among students who had FRL status, there was a positive, statistically significant association (r = .06; p < .001), such that FRL students who had more family visits to their work in Seesaw had higher end-of-year NWEA MAP® reading scores
Number of posts with video or voice in Seesaw is related to NWEA MAP® reading scores, but the association varied by grade.
Students who created more posts with video or voice in Seesaw had higher end-ofyear NWEA MAP® reading scores (r = .03; p = .003).
Grade 1 and 2 students who created more posts with video or voice in Seesaw had higher end-of-year NWEA MAP® reading scores. This result was statistically significant (r = .09 and r = .09; p < .001, respectively)
Among students who had FRL status, there was a positive, statistically significant association (r = .04; p = .003), such that students who created more posts with video or voice in Seesaw had higher end-of-year NWEA MAP® reading scores
Grades 4 students who created more posts with video or voice in Seesaw had lower end-of-year NWEA MAP® reading scores. This result was statistically significant (r = -.09; p < .001).
ESSA Level III Study Key Takeaways for Math Outcomes
Number of family visits to student work in Seesaw is related to NWEA MAP® math scores, but the association varied by grade.
Students who had more family visits to their work in Seesaw had statistically significantly higher end-of-year NWEA MAP® math scores (r = .03; p = .012).
Students who had any number of family visits to their work (low, moderate, and high use) had slightly higher end-of-year NWEA MAP® math scores compared to students who did not have any family visits to their work in Seesaw (effect sizes .08, .06, and .11 respectively). All these results were statistically significant (p < .001).
Grades 2 and 3 students who had more family visits to their work in Seesaw had higher end-of-year NWEA MAP® math scores. These results were statistically significant (r = .08; p = .002 and r = .07; p = .005, respectively).
Among students who had FRL status, there was a positive, statistically significant association (r = .06; p < .001), such that students who had more family visits to their work in Seesaw had higher end-of-year NWEA MAP® math scores.
Grades 5 students who had more family visits to their work in Seesaw had lower endof-year NWEA MAP® math scores and this result was statistically significant (r = -.08; p = .005)
Number of posts with video or voice in Seesaw is related to NWEA MAP® math scores, but the association varied by grade.
Students who created more posts with video or voice in Seesaw had higher end-ofyear NWEA MAP® math scores (r = .05; p < .001).
Grade 1 and 2 students who created more posts with video or voice in Seesaw had higher end-of-year NWEA MAP® math scores. These results were statistically significant (r = .12 and r = .11; p < .001, respectively).
Among students who had FRL and ELL status, there was a positive, statistically significant association such that students who created more posts with video or voice in Seesaw had higher end-of-year NWEA MAP® math scores (r = .07; p < .001 and r = .07; p =.012, respectively)
Grades 4 and 5 students who created more posts with video or voice in Seesaw had lower end-of-year NWEA MAP® math scores. These results were statistically significant (r = - 06; p = .011 and r = -.10; p < .001, respectively).
Introduction
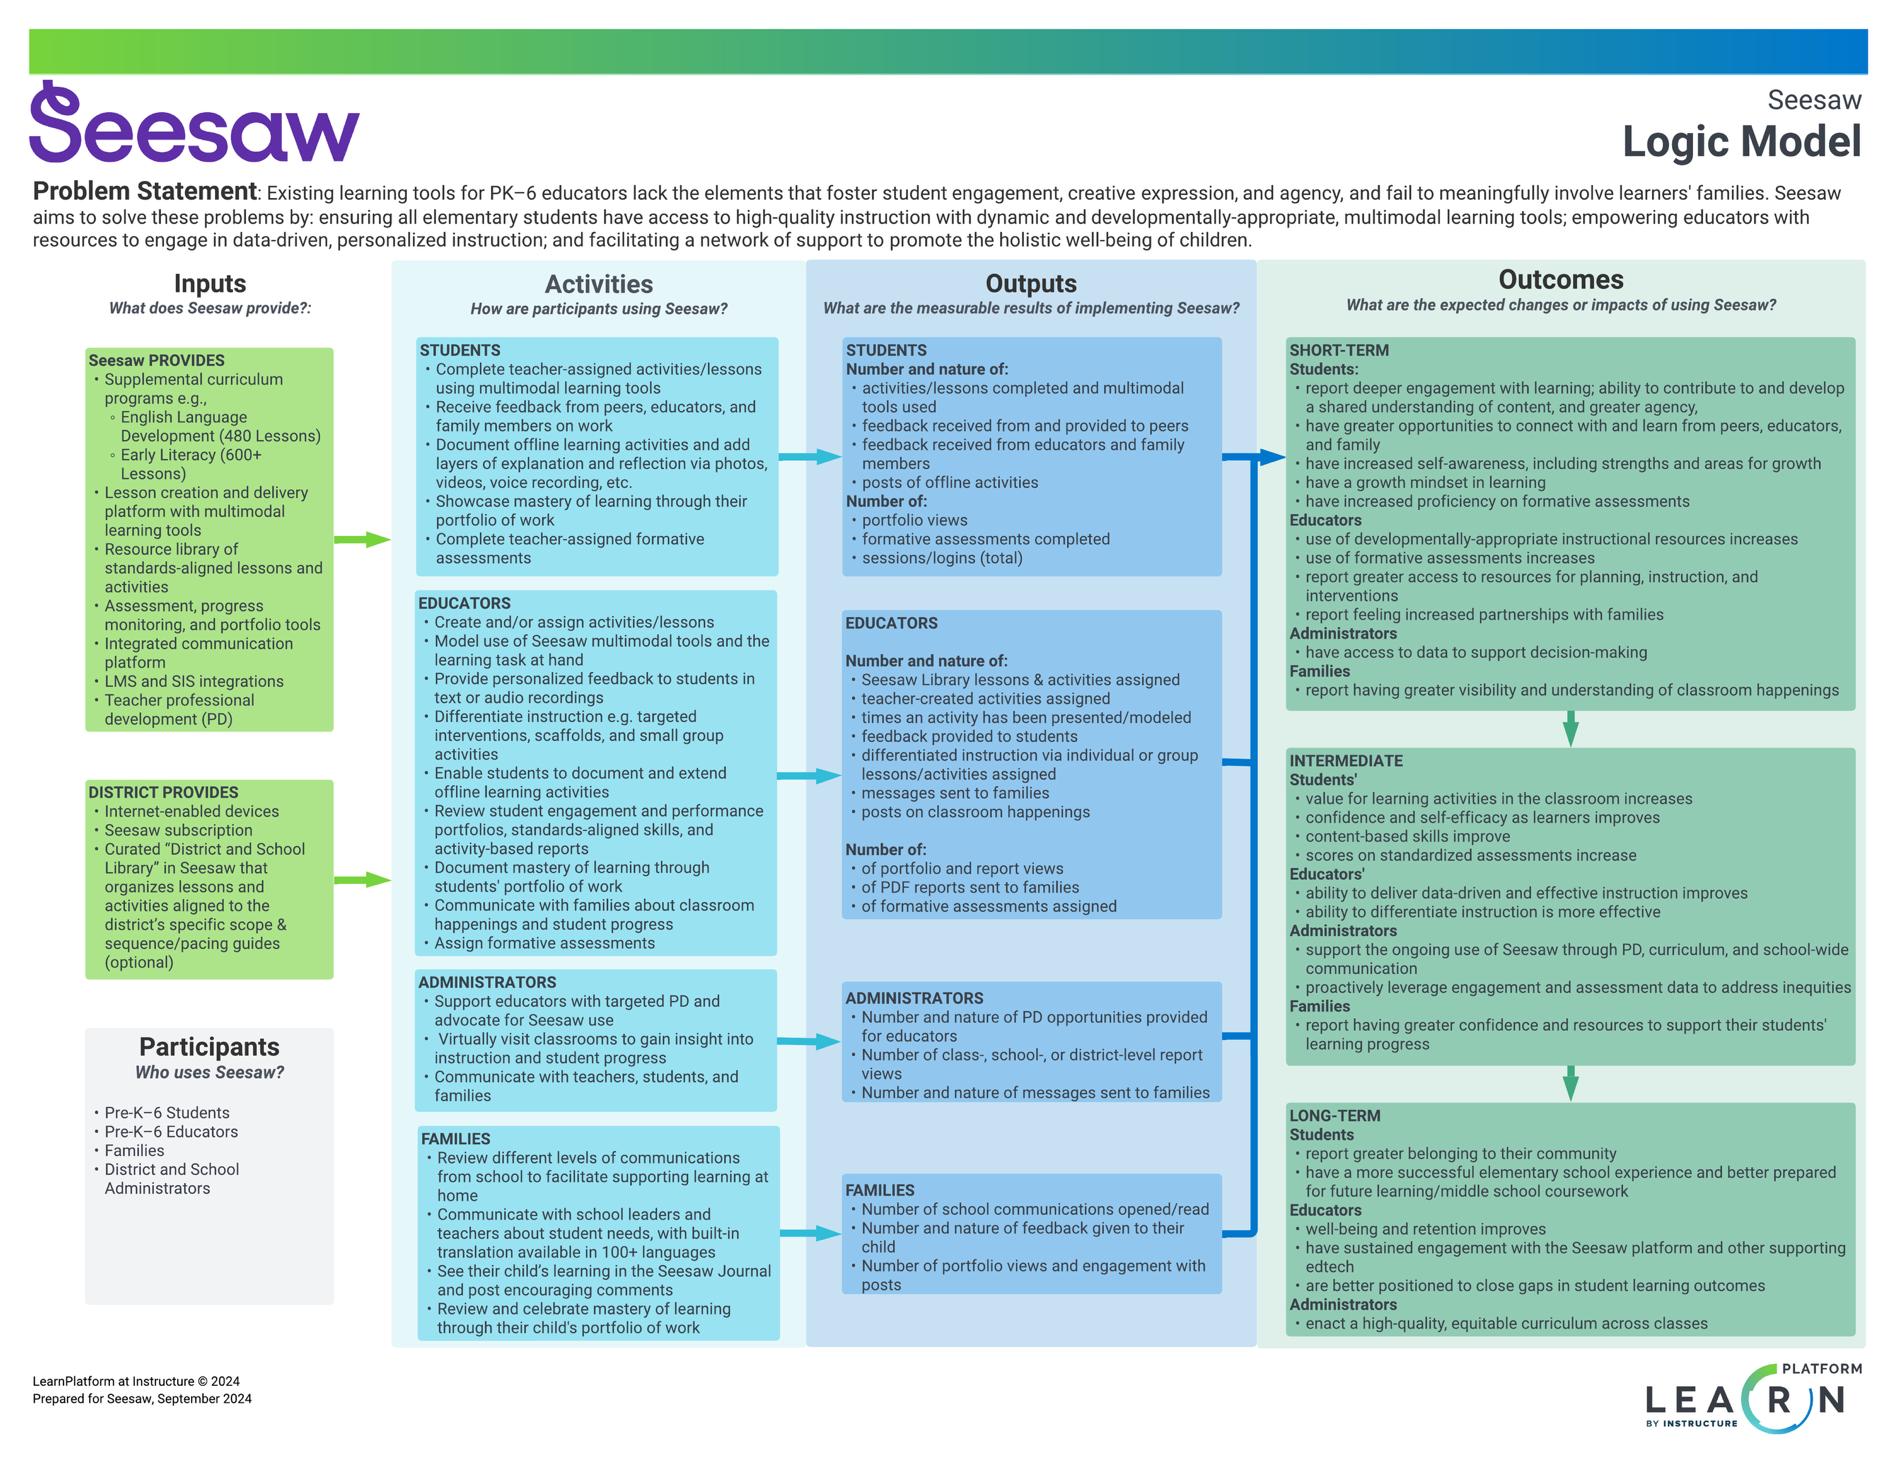
Seesaw recognizes that existing learning tools for prekindergarten to Grade 5 educators lack the elements that foster student engagement, creative expression, and agency, and fail to meaningfully involve learners' families. They aim to solve these problems by ensuring all elementary students have access to high-quality instruction with dynamic and developmentally appropriate, multimodal learning tools; empowering educators with resources to engage in data-driven, personalized instruction; and facilitating a network of support to promote the holistic well-being of children.
As part of their ongoing efforts to demonstrate the efficacy of their learning solution, Seesaw contracted with LearnPlatform, a third-party edtech research company, to examine the association between usage of Seesaw and student outcomes. After collaborating on the development of a logic model (Appendix B) for Seesaw (Shah & Lee, 2023), LearnPlatform designed the study to satisfy Level III requirements (Promising Evidence) according to the Every Student Succeeds Act (ESSA):
Program Implementation Research Question
1. To what extent did students use Seesaw during the 2022–23 school year?
a. On average, how many times did students' family members view their student's work?
b. What is the average number of video or voice posts created by students on the Seesaw platform?
Effectiveness Research Question
2. After controlling for prior achievement and other student demographic characteristics (i.e., grade, race, ELL status, and FRL status), did students’ performance on standardized reading and math assessments vary based on their use of Seesaw during the 2022–23 school year?
Methods
This section of the report briefly describes the setting, participants, measures, and analysis methods.
Setting
The study included a suburban school district in the midwestern U.S. and an analytic sample of K–5 students across 25 schools.
Participants
This treatment-only study occurred during the 2022–23 school year and included 8,133 K–5 students from 25 elementary schools from a suburban district in the midwestern US who use Seesaw. In terms of demographics, the district was racially diverse and included students who identified as Asian (4%), Black (31%), Hispanic (28%), White (28%), and other (9%). Sixteen percent of the students had individualized educational programs (IEPs), 16% had English language learner (ELL) status, and 71% had free and reduced lunch (FRL) status. In addition, the percentages of students enrolled in each of the grades were as follows: kindergarten (10%), first grade (18%), second grade (18%), third grade (20%), fourth grade (19%), and fifth grade (15%).
Measures
This study included the following measures to provide insights into Seesaw implementation and evidence about the potential impacts of Seesaw on student outcomes.
Background. When teachers assign lessons or tasks in Seesaw, students can complete these assignments using multimedia tools, like video, voice, photo, drawing, or text. Students can also capture offline classroom learning activities using the same tools. These learning artifacts are called student posts 1 Family members get notified for each new post created by their child and can meaningfully engage with these learning artifacts by visiting student posts via the Seesaw app/website
Seesaw Usage Metrics Researchers utilized 2022–23 student-level usage (i.e., total number of family visits to student work in Seesaw and total number of video or voice posts in Seesaw). These usage data informed the extent to which students used Seesaw during the school year and whether students’ use of Seesaw related to reading and math outcomes on NWEA MAP®.
Standardized Student Assessments. NWEA MAP® RIT scales are stable, equal interval scales that use individual item difficulty values to measure student achievement independent of grade level. The
1 Based on Seesaw’s ESSA Level IV report, video or voice posts and family visits were deemed to be key measures of use. Instead of measures like the total number of logins and all posts, these measures are relatively unique to Seesaw and are well-suited to elementary students
scores are vertically scaled so that student scores can be compared over time and across grade levels. The RIT scale ranges from 100–350. Researchers used respective RIT scale scores as overall measures of reading and math achievement, each at two time points: pretest (i.e., fall 2022) and posttest (i.e., spring 2023).
Data Analysis
Researchers used a variety of quantitative analytic approaches. First, researchers conducted descriptive statistics to describe participant characteristics and support implementation analyses. Researchers then conducted regressions and partial correlations to examine how Seesaw use related to student reading and math outcomes from fall 2022 (beginning of year) to spring 2023 (end of year) The analyses included student-level covariates to control for potential selection bias. In addition, researchers calculated standardized effect sizes (Hedge’s g) to determine the magnitude of changes in student outcomes
Program Implementation Findings
The charts below show Seesaw use during the 2022–23 school year based on internal usage data On average, and across the overall sample, there were 22 family visits to student work (SD = 41) across the school year and students created 14 Seesaw posts with video or voice (SD = 29)
Table 1 Average Seesaw student usage by grade
Researchers conducted a k-means cluster analysis to group students by similar levels of Seesaw usage based on the total number of family visits to student work and total number of video or voice posts in Seesaw
For number of family visits to student work, students fell into four usage categories ranging from no usage, low usage (1–35 family visits), to moderate usage (36–130 family visits), and high usage (131– 813 family visits) (Figure 1).
For number of video or voice posts in Seesaw, students fell into four usage categories including no usage2 , low usage (1–24 posts), moderate usage (25–100 posts), and high usage (101–420 posts) (Figure 2). Appendix C shows a breakdown of the mean posts and family visits within each usage category.
2 All the students in the sample had used one or more of Seesaw’s features and functionalities, therefore, we considered our study to be a treatment-only study. The no usage category refers to those students who were users of Seesaw but who did not have any video/voice posts and/or family visits.
Most students had between 1–35 family visits to student work in Seesaw.
4,368
Number of students
2,275
1,261
Number of family visits to student work
Figure 1 Overall distribution of total number of family visits to student work in Seesaw
Most students created between 1–24 posts with video or voice in Seesaw.
1,305
5,686 928
Number of students Number of posts with video or voice
Figure 2. Overall distribution of total number of posts with video or voice in Seesaw
Effectiveness Findings for 2022–23 School Year
Researchers first examined whether greater usage of Seesaw was related to higher end-of-year (EOY) NWEA MAP® reading and math scores using partial correlation analyses that included beginning of year NWEA MAP® reading and math scores, grade, race, FRL status, and ELL status as covariates. Researchers report statistically significant findings at the p < .05 level. Statistically significant findings are marked green (positive effect size) or red (negative effect size) in graphs. Findings that are not statistically significant are marked yellow (Appendix C)
Overall Association Between Seesaw Usage and EOY NWEA MAP® Reading and Math Scores
Key Finding 1 Students who had more family visits to their work had statistically significantly higher NWEA MAP® reading scores (r = .05, p < .001) and math scores (r = .03, p = .01; Figure 3)
Additionally, students who created more posts with video or voice had higher end-of-year NWEA MAP® reading scores (r = .03, p = .002) and math scores (r = .05, p < .001; Figure 4)
Students who had more family visits to their work had statistically significantly higher reading and math scores compared to students who had fewer family visits.
Correlation coefficient
0 1
-1
NWEA MAP® EOY Reading Scores
NWEA MAP® EOY Math Scores
Figure 3 Association between number of family visits to student work in Seesaw and end-of-year student reading and math outcomes on NWEA MAP® in terms of correlation coefficients
Correlation coefficient
Students who had more posts with video or voice had statistically significantly higher reading and math scores compared to students who had fewer posts.
NWEA MAP® EOY Reading Scores
NWEA MAP® EOY Math Scores
Figure 4 Association between number of posts with video or voice in Seesaw and end-of-year student reading and math outcomes on NWEA MAP® in terms of correlation coefficients
Researchers then examined whether greater usage of Seesaw related to higher end-of-year NWEA MAP® reading and math scores using linear regression models that included beginning of year NWEA MAP® scores, grade, race, ELL, and FRL status as covariates. This association was further investigated among usage clusters for family visits to student work and posts with video or voice (shown in Figures 1 and 2). To allow for better interpretability of results, marginal means for each cluster are presented below. The orange vertical lines at the top of each bar represent a 95% confidence interval (Appendix C)
Overall Association Between Number of Family Visits to Student Work in Seesaw and EOY NWEA MAP® Reading and Math Scores
Key Finding 2 Students who had any number of family visits to their work in Seesaw (low, moderate, and high use) had slightly higher end-of-year NWEA MAP® reading scores compared to students who did not have any family visits to student work (Hedge’s g effect sizes .06, .08, and .13, respectively)
Students who had between 131–803 family visits to student work in Seesaw (high use) also had slightly higher end-of-year NWEA MAP® reading scores compared to students who had between 36–130 family visits (moderate use; effect size .06) and between 1–35 family visits (low use; effect size .07). All these results were statistically significant (Figures 5).
Marginal means for NWEA MAP® Reading Scores
(n = 1,261)
(n = 229)
Total number of family visits to student work
Figure 5. Marginal means for EOY NWEA MAP® reading scores for K – 5 students by usage group.
Key Finding 3. Students who had any number of family visits to their work in (low, moderate, and high use) had slightly higher end-of-year NWEA MAP® math scores compared to students who did not have any family visits to student work in Seesaw (Hedge’s g effect sizes .08, .06, and .11, respectively) All these results were statistically significant (Figures 6).
Marginal means for NWEA MAP® Math Scores
Total number of family visits to student work
Figure 6. Marginal means for EOY NWEA MAP® math scores for K – 5 students by usage group.
Overall Association Between Number of Posts with Video or Voice and EOY NWEA MAP® Reading and Math Scores
Students who created between 101–420 posts with video or voice (high use) had slightly higher endof-year NWEA MAP® reading scores compared to students who created less than 101 posts. This result was not statistically significant3 (Figure 7).
Marginal means for NWEA MAP® Reading Scores
Total number of posts with video or voice
7. Marginal means for EOY NWEA MAP® reading scores for K – 5 students by usage group.
Key Finding 4 Students who created between 101–420 posts with video or voice (high use) had slightly higher end-of-year NWEA MAP® math scores compared to students who created fewer than 101 posts (no use, low use, moderate use; Hedge’s g effect sizes .14, .13, and .16, respectively). All these results were statistically significant (Figures 8).
Marginal means for NWEA MAP® Reading Scores
Total number of posts with video or voice
8. Marginal means for EOY NWEA MAP® math scores for K – 5 students by usage group.
3 While the overall association is positive and statistically significant, the magnitude is small and therefore, the differences in adjusted means for NWEA MAP® reading scores for each usage cluster are not statistically significant.
Figure
Figure
Researchers examined whether greater usage of Seesaw related to higher end-of-year NWEA MAP® reading and math scores for each grade. Each partial correlation included beginning of year NWEA MAP® scores, race, FRL status, and ELL status as covariates.
Association Between Number of Family Visits to Student Work and Student Reading Outcomes on NWEA MAP® by Grade
Key Finding 5 Among kindergarten and grades 1 and 3 students, there was a positive, statistically significant association (p < .05), such that students who had more family visits to their work in Seesaw had higher end-of-year NWEA MAP® reading scores The results for grade 2 students were approaching significance Negative results were observed for grades 4 and 5, and these results were not statistically significant (p < .05; Figure 9).
Grades K-1 and 3 students who had more family visits to their work in Seesaw had statistically significantly higher end-of-year reading scores.
Correlation coefficient
Figure 9 Association between number of family visits to student work in Seesaw and student EOY reading outcomes on NWEA MAP® by grade.
Association Between Number of Family Visits to Student Work and Student Math Outcomes on NWEA MAP® by Grade
Key Finding 6 Among grades 2 and 3 students, there was a positive, statistically significant association (p < .05), such that students who had more family visits to their work in Seesaw had higher end-of-year NWEA MAP® math scores. The results for K –1 and grade 4 students were not significant and a negative, statistically significant result was observed for grade 5 (Figure 10)
Grades 2 & 3 students who had more family visits to student work in Seesaw had statistically significantly higher end-of-year math scores.
Correlation coefficient
Figure 10. Association between number of family visits to student work in Seesaw and student EOY math outcomes on NWEA MAP® by grade
Association Between Number of Posts with Video or Voice and Student Reading Outcomes on NWEA MAP® by Grade
Key Finding 7 Positive results were observed for K – 2 students, and the results for grades 1 and 2 students were statistically significant (p < .05), such that students who created more posts with video or voice in Seesaw had higher end-of-year NWEA MAP® reading scores. Negative results were observed for grades 3 – 5, and results for grade 4 students were statistically significant (p < .05), such that students who created more posts with video or voice in Seesaw had lower end-of-year NWEA MAP® reading scores (Figure 11).
Grades 1 - 2 students who created more posts with video or voice in Seesaw had statistically significantly higher end-of-year reading scores. This relation was not significant for kindergarten.
Correlation coefficient
Figure 11. Association between number of posts with video or voice in Seesaw and student reading outcomes on NWEA MAP® by grade
Association Between Number of Posts with Video or Voice and Student Math Outcomes on NWEA MAP® by Grade
Key Finding 8. Positive results were observed for K – 2 students, and the results for grades 1 and 2 students were statistically significant (p < .05), such that students who created more posts with video or voice in Seesaw had higher end-of-year NWEA MAP® math scores. Negative results were observed for grades 3 – 5, and results for grades 4 and 5 students were statistically significant (p < .05), such that students who created more posts with video or voice in Seesaw had lower end-of-year NWEA MAP® math scores (Figure 12)
Grades 1 - 2 students who created more posts with video or voice in Seesaw had statistically significantly higher end-of-year math scores.
Correlation coefficient
Figure 12. Association between number of posts with video or voice in Seesaw and student math outcomes on NWEA MAP® by grade
Association Between Seesaw Usage and Student Reading and Math Outcomes on NWEA MAP® by Free or Reduced-Price Lunch (FRL) Status
Key Finding 9 Students with FRL status who had more family visits to their work had statistically significantly higher NWEA MAP® reading scores (r = .06, p < .001) and math scores (r = .05, p < .001; Figure 13). Additionally, students with FRL status who created more posts with video or voice had higher end-of-year NWEA MAP® reading scores (r = .03, p = .003) and math scores (r = .07, p < .001; Figure 14; Appendix C).
Correlation coefficient
-1 0 1
Students with FRL status who had more family visits to their work had statistically significantly higher reading and math scores compared to students who had fewer family visits.
NWEA MAP® EOY Reading Scores
NWEA MAP® EOY Math Scores
Figure 13. Association between number of family visits to student work in Seesaw for students with FRL status and end-of-year student reading and math outcomes on NWEA MAP® in terms of correlation coefficients
Students with FRL status who had more posts with video or voice had statistically significantly higher reading and math scores compared to students who had fewer posts.
Correlation coefficient
-1 0 1
NWEA MAP® EOY Reading Scores
NWEA MAP® EOY Math Scores
Figure 14. Association between number of posts with video or voice in Seesaw for students with FRL status and end-of-year student reading and math outcomes on NWEA MAP® in terms of correlation coefficients
Association Between Seesaw Usage and Student Reading and Math Outcomes on NWEA MAP® by ELL Status
Among students who had ELL status, there was only one statistically significant association between Seesaw usage and end-of-year NWEA MAP® math scores That is, ELL students who created more posts with video or voice had higher end-of-year NWEA MAP® math scores (r = .07, p = .012). None of the other associations were statistically significant (Appendix C)
Conclusions and Recommendations
In sum, the findings support a positive association between Seesaw usage and improved reading and math scores for K – 5 students. Given positive outcome findings, this study provides results to satisfy ESSA evidence requirements for Level III (Promising Evidence). Specifically, this study met the following criteria for Level III:
Correlational design
Proper design and implementation
Statistical controls through covariates
At least one statistically significant, positive finding
Researchers recommend the following next steps:
o Students who had any family visits to their work had higher reading and math scores on NWEA MAP® Seesaw should continue to explore ideal implementation at other sites using this baseline information
o Students in grades K 2 tend to create more posts which are related to higher reading and math scores, however, there is a decline in number of posts created by students in upper grades. The Seesaw team should consider how the specific needs of upper elementary students differ and whether the product should include different features to better meet their needs.
o Seesaw should consider recruiting a district that is willing to engage in prospective data collection, specifically related to student engagement with the platform and teacher perceptions about its implementation. Such data will enable the Seesaw team to understand whether and how student engagement levels are related to the use of Seesaw and whether higher student engagement (as afforded by Seesaw) mediates higher student achievement on standardized assessment.
Acknowledgements
The authors would like to extend their deepest thanks to Avery Wall who supported the preparation of data for this report
References Shah, M. & Lee, A. 2023. Seesaw Logic Model. Study Type: ESSA Evidence Level IV. LearnPlatform.
Appendix B. Additional Information on Program Implementation
Table B1. Descriptive statistics for the family visits to student work in Seesaw by usage clusters
Table B2. Descriptive statistics for the number of posts with video/voice in Seesaw by usage clusters
Appendix C. Additional information on Outcome Findings
Overall Association Between Number of Family Visits to Student Work and Student Reading Outcomes on NWEA MAP®
Table C1. Reading Skills on NWEA MAP® by number of family visits to student work in Seesaw (covariates: beginning of year NWEA MAP® reading scores, race, and ELL and FRL status; grade was not a statistically significant covariate for this model)
Overall Association Between Number of Family Visits to Student Work and Student Math Outcomes on NWEA MAP®
Table C2 Math Skills on NWEA MAP® by number of family visits to student work in Seesaw (covariates: beginning of year NWEA MAP® math scores, grade, race, and ELL and FRL status)
1–35 visits compared to 36–130
1–35 visits compared to 131–803
Overall Association Between Number of Posts with Video or Voice and Student Reading Outcomes on NWEA MAP®
Table C3. Reading Skills on NWEA MAP® by number of posts with video or voice in Seesaw (covariates: beginning of year NWEA MAP® reading scores, grade race, ELL, and FRL status)
Overall Association Between Number of Posts with Video or Voice and Student Math Outcomes on NWEA MAP®
Table C4. Math Skills on NWEA MAP® by number of posts with video or voice in Seesaw (covariates: beginning of year NWEA MAP® math scores, grade, race, ELL, and FRL status)
Comparisons
25–100 posts compared to 101–420 posts
Association Between Number of Family Visits to Student Work and Student Reading Outcomes on NWEA MAP® by Grade
Table C5. Partial correlation coefficients and associated p-values for grade-level analyses (covariates: beginning of year NWEA MAP® reading scores, race, ELL status, and FRL status)
Association Between Number of Family Visits to Student Work and Student Math Outcomes on NWEA MAP® by Grade
Table C6 Partial correlation coefficients and associated p-values for grade-level analyses (covariates: beginning of year NWEA MAP® math scores, race, ELL status, and FRL status)
Association Between Number of Posts with Video or Voice and Student Reading Outcomes on NWEA MAP® by Grade
Table C7. Partial correlation coefficients and associated p-values for grade-level analyses (covariates: beginning of year NWEA MAP® reading scores, race, ELL status, and FRL status)
Association Between Number of Posts with Video or Voice and Student Math Outcomes on NWEA MAP® by Grade
Table C8 Partial correlation coefficients and associated p-values for grade-level analyses (covariates: beginning of year NWEA MAP® math scores, race, ELL status, and FRL status)
Association Between Number of Family Visits to Student Work and Student Reading and Math Outcomes on NWEA MAP® by FRL and ELL Status
Table C9. Partial correlation coefficients and associated p-values for analyses by FRL and ELL status (covariates: beginning of year NWEA MAP® reading scores, grade, and race)
Table C10 Partial correlation coefficients and associated p-values for analyses by FRL and ELL status (covariates: beginning of year NWEA MAP® reading scores, grade, and race)
Association Between Number of Posts with Video or Voice and Student Reading and Math Outcomes on NWEA MAP® by FRL and ELL Status
Table C11 Partial correlation coefficients and associated p-values for analyses by FRL and ELL status (covariates: beginning of year NWEA MAP® reading scores, grade, and race)
Table C12 Partial correlation coefficients and associated p-values for analyses by FRL and ELL status (covariates: beginning of year NWEA MAP® reading scores, grade, and race)
Appendix D. Additional information on Outcome Findings by Zip Code
Researchers conducted exploratory analysis to examine whether greater usage of Seesaw related to higher end-of-year NWEA MAP® reading and math scores for each zip code Researchers examined whether greater usage of Seesaw related to higher end-of-year NWEA MAP® reading and math scores using partial correlations that included beginning of year NWEA MAP® scores, grade, race, ELL, and/or FRL status as covariates. Students spanned 23 zip codes however only 9 of these zip codes had enough students to run the analyses.
Table D1: Average Seesaw student usage by zip code
Association Between Number of Family Visits to Student Work and Student Reading Outcomes on NWEA MAP® by Zip Code
Students from zip codes 61104 and 61107–09 who had more family visits to their work in Seesaw had statistically significantly higher end-of-year reading scores.
Correlation coefficient
Figure D1. Association between number of family visits to student work in Seesaw and student EOY reading outcomes on NWEA MAP® by zip code
Association Between Number of Posts with Video or Voice and Student Reading Outcomes on NWEA MAP® by Zip code
Students from zip codes 61107–09 who created more posts with video or voice in Seesaw had statistically significantly higher endof-year reading scores.
Figure D2. Association between number of posts with video or voice in Seesaw and student EOY reading outcomes on NWEA MAP® by zip code
Association Between Number of Family Visits to Student Work and Student Math Outcomes on NWEA MAP® by Zip code
Students from zip codes 61104 and 61107 who had more family visits to their work in Seesaw had statistically significantly higher end-of-year math scores.
Correlation coefficient
Figure D3. Association between number of family visits to student work in Seesaw and student EOY math outcomes on NWEA MAP® by zip code
Association Between Number of Posts with Video or Voice and Student Math Outcomes on NWEA MAP® by Zip code
Students from zip codes 61101 and 61107–09 who created more posts with video or voice in Seesaw had statistically significantly higher end-of-year math scores.
Figure D4. Association between number of posts with video or voice in Seesaw and student EOY math outcomes on NWEA MAP® by zip code