2019
i in 1Q’19
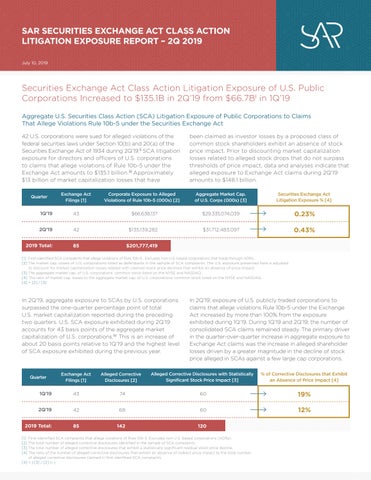
Aggregate U.S. Securities Class Action (SCA) Litigation Exposure of Public Corporations to Claims That Allege Violations Rule 10b-5 under the Securities Exchange Act
42 U.S. corporations were sued for alleged violations of the federal securities laws under Section 10(b) and 20(a) of the Securities Exchange Act of 1934 during 2Q’19.ii SCA litigation exposure for directors and officers of U.S. corporations to claims that allege violations of Rule 10b-5 under the Exchange Act amounts to $135.1 billion.iii Approximately $13 billion of market capitalization losses that have
In 2Q’19, aggregate exposure to SCAs by U.S. corporations surpassed the one-quarter percentage point of total U.S. market capitalization reported during the preceding two quarters. U.S. SCA exposure exhibited during 2Q’19 accounts for 43 basis points of the aggregate market capitalization of U.S. corporations.iv This is an increase of about 20 basis points relative to 1Q’19 and the highest level of SCA exposure exhibited during the previous year.
In 2Q’19, exposure of U.S. publicly traded corporations to claims that allege violations Rule 10b-5 under the Exchange Act increased by more than 100% from the exposure exhibited during 1Q’19. During 1Q’19 and 2Q’19, the number of consolidated SCA claims remained steady. The primary driver in the quarter-over-quarter increase in aggregate exposure to Exchange Act claims was the increase in alleged shareholder losses driven by a greater magnitude in the decline of stock price alleged in SCAs against a few large cap corporations. Securities Exchange Act Class Action Litigation Exposure of U.S. Public Corporations Increased to $135.1B in 2Q’19 from $66.7B
been claimed as investor losses by a proposed class of common stock shareholders exhibit an absence of stock price impact. Prior to discounting market capitalization losses related to alleged stock drops that do not surpass thresholds of price impact, data and analyses indicate that alleged exposure to Exchange Act claims during 2Q’19 amounts to $148.1 billion.
During 2Q’19, SAR accounted for 63 filed SCAs that allege violations of Rule 10b-5.v After consolidating the filed SCAs against individual corporations, SAR accounted for 42 filed claims. A total of 68 claimed corrective disclosures were alleged against 42 corporate defendants based on the first-identified SCA complaints.vi, vii Of the 68 corrective disclosures alleged during 2Q’19, 8 exhibit an absence of price impact (Halliburton II) and do not meet the thresholds related with heightened pleading standards of loss causation (Dura) viii 12% of alleged stock price declines claimed in 42 SCAs against directors and officers exhibit an absence of price impact.ix This is indicative of an increase in quality of the SCAs based on a 7 percentage point quarterly increase over 1Q’19, when almost 19% of the alleged corrective disclosures claimed against directors and officers exhibited an absence of price impact.
U.S. SCA Exposure of Large Cap Corporationsx
The Securities Exchange Act class action litigation exposure of large cap corporations was $125.4 billion during 2Q’19. This is a material increase of 118%, or $68 billion relative to 1Q’19. 9 large cap corporations were sued for alleged violations of Rule 10b-5 during 2Q’19. The average aggregate market capitalization of U.S. large cap corporations, according to the market capitalization range of the S&P 500 Index during 2Q’19, was $29.5 trillion.xi In 2Q’19, exposure to alleged violations of the Exchange Act by large cap corporations was 42 basis points of the aggregate market capitalization of all publicly traded large cap corporations.
Analysis: 2Q’19 presents a material increase in SCA exposure of 21 basis points relative to 1Q’19. Notably, the number of filed SCAs against large corporations decreased by close to 9, but total exposure more than doubled. The SCA claims rate against large caps remained the same, but the level of exposure more than doubled. Data and analysis indicate that stock drop declines alleged in 2Q’19 in SCAs against large cap corporations are significantly greater as a percentage of large cap corporate market capitalization. A greater magnitude of claimed alleged stock price declines translates into greater potential severity of the corresponding SCA.
U.S. SCA Exposure of Mid Cap Corporationsxii
The Securities Exchange Act class action litigation exposure of mid cap corporations was $5.8 billion during 2Q’19. This is a decrease of 5.3%, or $328 million relative to 1Q’19. 11 mid cap corporations were sued for alleged violations of Rule 10b-5 during 2Q’19. The average aggregate market capitalization of U.S. mid cap corporations, according to the
market capitalization range of the S&P MidCap 400 Market Index during 2Q’19, was $1.45 trillion.xiii In 2Q’19, exposure to alleged violations of the Exchange Act by mid cap corporations was 40 basis points of the aggregate market capitalization of all publicly traded mid cap corporations. This is a decrease of 2 basis points relative to 1Q’19.
U.S. SCA Exposure of Small Cap Corporationsxiv
The Securities Exchange Act class action litigation exposure of small cap corporations was $3.9 billion during 2Q’19. This is a notable increase of 27.6%, or $843 million relative to 1Q’19. 22 small cap corporations were sued for alleged violations of Rule 10b-5 during 2Q’19. The average aggregate market capitalization of U.S. small cap corporations, according to the market capitalization range of the S&P SmallCap 600 Market Index during 2Q’19, was $730 billion.xv In 2Q’19, exposure to alleged violations of the Exchange Act by small cap corporations was 53 basis points of the aggregate market capitalization of all publicly traded small cap corporations. This is an increase of 11 basis points relative to 1Q’19.
Analysis: 2Q’19 continues to present an on-going trend of increasing SCAs against small cap corps. Exposure of SCAs filed against small cap corps exceeds half a percentage point of their aggregate market capitalization. 2Q’19 marks the quarter with the greatest number of Exchange Act claims filed against small cap corps.
Aggregate Market Cap. of Small Caps (000s)
of Small Cap Corporations to Alleged Violations of the Exchange Act
U.S. SCA Exposure by Industry Segment
SCAs filed against U.S. corporations in the Retail Consumer Products, Software, and Industrial segments account for 50% of the SCAs filed in 2Q’19. SCAs filed against U.S. corporations in the Hardware/Semiconductor, Industrial, and Telecom segments account for 90% of Securities Exchange Act class action litigation exposure exhibited in 2Q’19. SCAs filed against U.S. corporations in the
Healthcare, Industrial, and Energy segments had the greatest percentage of alleged market capitalization losses where there is verifiable evidence of an absence of price impact. 75.9% of alleged shareholder losses against directors and officers of U.S. Healthcare corporations are based on alleged corrective disclosures where a verifiable absence of price impact exists.
Any reprint of the information or figures presented in this quarterly report should reference SAR, LLC. Please any direct inquiries to Stephen Sigrist at 202.891.3652 or stephen@sarlit.com. SAR is a software, technology, and data analytics company that actively tracks, monitors, and analyzes private securities fraud actions that alleged violations of the Exchange Act of 1934. All information presented in this report is subject to revision.
i $68.1 billion reported for 1Q’19 has been adjusted to discount the market capitalization losses that correspond with SCAs that have been voluntarily dismissed by Plaintiffs’ counsel during 2Q’19.
ii This tally accounts for U.S. publicly traded corporations listed as defendants in first-identified securities class action complaints filed during 2019. The tally excludes securities class action complaints against U.S. corporations that were sued for alleged violations of the federal securities laws in previous quarters. A U.S. corporation that was sued a second or third time during the current quarter is not accounted for in the current quarter’s tally. This tally also excludes cases against international corporations that trade on U.S. exchanges through American Depositary Receipts (ADRs). Federal securities class action complaints are screened for allegations that specifically include violations of Rule 10b-5 and define a specific alleged inflationary period (the Class Period) of the corresponding company’s price of common stock. Only the claimed stock price declines presented in the first-identified complaint against each defendant company are accounted for to estimate the cumulative decline in market capitalization losses.
iii A public corporation’s exposure to alleged violations of Rule 10b-5 is estimated by tracking the cumulative decline in market capitalization during open market trading sessions that correspond with the timing of the claimed alleged corrective disclosures that surpass thresholds of price impact and are presented in a first-identified SCA complaint. Aggregate measures of exposure exclude market capitalization declines of international companies that have been sued for violations of the U.S. federal securities laws and trade on U.S. exchanges through American Depositary Receipts (ADRs).
iv Second quarter aggregate market capitalization is defined as the average of total market capitalization on April 1st, 2019 and June 30th, 2019 for all U.S.-domiciled equities that trade on the NYSE or Nasdaq.
v SAR relies on Docket Alert and Court Wire notifications attained from Thomson Reuters.
vi SAR accounted for a total 116 corrective disclosures alleged in 63 filed claims for alleged violations of Rule 10b-5 against U.S. corporations during 2Q’19.
vii This tally of corrective disclosures includes only those from first-identified SCA complaints filed during 2019 against U.S.-based companies that have publicly traded shares of common stock in the NYSE or NASDAQ. The tally excludes securities class action complaints against companies for which there are first-identified complaints in prior quarters.
viii See Dura Pharmaceuticals, Inc. v. Broudo, No. 03-932, 2005 WL 885109 (2005), and Halliburton Co. v. Erica P. John Fund, Inc., 134 S. Ct. 2398 (2014).
ix A single-firm multivariate regression analysis with a minimum of 100 observations (if a full 252 observations is unattainable) for a Control Period is applied to evaluate the statistical significance of the logarithmic residual stock price decline on the trading day(s) affected by an alleged corrective disclosure(s) (or the alleged adverse event). Statistical significance is measured by computing the t-statistic of the residual stock price decline during the trading session that is affected by the alleged corrective information. (If the t-statistic is greater than plus or minus 1.96, the likelihood that the daily residual return of the defendant company’s common stock could have been caused by random volatility is less than 5%.)
The Control Period ends one trading day prior to the start of the Class Period presented in the corresponding securities class action complaint.
x Large cap corporations are the sub-set of defendant corporations that have market capitalizations at the start of the operative Class Period that are above a threshold for inclusion ($3.7 billion) in the S&P 500 Market Index.
xi This is the average total market capitalization of U.S.-based corporations that traded on the NYSE or Nasdaq exchanges with market capitalizations greater than $3.7 billion between April 1st, 2019 and June 30th, 2019.
xii Mid cap corporations are the sub-set of defendant corporations that have market capitalizations at the start of the operative Class Period that are within a threshold for inclusion (above $1.26 billion and below $3.7 billion) in the S&P MidCap 400 Market Index.
xiii This is the average total market capitalization of U.S.-based corporations that traded on the NYSE or Nasdaq exchanges with market capitalizations between $1.26 and $3.7 billion between April 1st, 2019 and June 30th, 2019.
xiv Small cap corporations are the sub-set of defendant corporations that have market capitalizations at the start of the operative Class Period that are below a threshold for inclusion ($1.26 billion) in the S&P SmallCap 600 Market Index.
xv This is the average total market capitalization of U.S.-based corporations that traded on the NYSE or Nasdaq exchanges with market capitalizations less than $1.26 billion between April 1st, 2019 and June 30th, 2019.
Sources: S&P Global Market Intelligence, S&P Dow Jones Indices, Thomson Reuters, SAR SCADA Database as of July 1, 2019.