THE DIGEST © Copyright - Science for Sport Ltd 2016 -2020. All Right s Reserved. A monthly su mmary of the l atest sports performance research September 2022 | Issue #71 PERFORMANCE
Study Details

Study Details
Prac�cal Takeaways from study

Related links to learn more about the topic
Reviewers comments on the st udy


Strength & Conditioning
James is currently the Head Strength & Conditioning Coach for the Romanian Rugby Union. He has previously worked in America's professional rugby competition Major League Rugby with Austin Elite and the NZ Women’s National Rugby League Team. He is a published author and has completed a MSc in Sport & Exercise Science from AUT, Auckland, NZ.

Technology & Monitoring
Cody is a strength and conditioning coach and adjunct lecturer at the University of Iowa. He has an MSE in Exercise Science from the University of Kansas and also holds a CSCS from the NSCA.

Youth Development
Tom is the Head of Athletic Development at St Peters RC High School. He holds a Masters in S&C and has previously worked with West Bromwich Albion FC, Gloucester Rugby club, and Great Britain Equine. Tom is our youth research reviewer at Science for Sport.

Tom is currently an assistant professor in applied sports sciences and has worked in elite sport for over 10 years. Previous roles include working as a sports scientist at Liverpool FC, where he completed his PhD, and working across a number of other sports. He is passionate about physiology and has published papers on strength and conditioning, nutrition and youth development
Fatigue & Recovery
Matthew is a Physical Therapist and the Clinical Director at a private Physical Therapy clinic in NYC. He has a special interest in the treatment of lower extremity/foot and ankle injuries along with helping runners and walkers to get back to what they love to do.


In order to achieve optimal performance during competitive situations, athletes have to learn how to achieve and maintain peak mental state. It is especially important that they don’t let competition stresses distract from this state. This is typically achieved by learning, developing, and practising psychological skills and strategies.

Many such stress distractions act upon our emotions, and this is not confined to the day of competition itself The importance of routine is high in regulating emotion in the days before and following competition as well as during the event itself
The aim of this study was to present a five-stage framework for emotional regulation using preparatory routines in a self-paced motor task – in this case freethrow shooting performance in basketball.
In this case study, an 18-year-old female professional basketball player was identified as someone who was struggling with her performance, which saw her freethrow percentage fall from 70 to 40%. This was thought to be a result of mental stress, as typically her misses coincided with critical match situations.
For three weeks, the participant met with a psychologist twice per week to learn and practice relaxation, imagery, self-talk, concentration, and reframing. Following this period she practised these principles during training, especially focusing on upper-body muscle relaxation, and awareness of the connection between thoughts and feelings.
Next the participant developed a pre-performance routine (PP-R) based around the work she’d done prior to this stage. This included fast muscle relaxation, quick concentration, verbal cues, imagery/simulation of the movement, and finally the shot itself. In addition, she reframed her thoughts during (by using self-talk) and after (principles of attribution training) practice as a general mental skill for strong mental toughness. Her PPR was then implemented during competitive play as well as time after competition being considered.


A preparatory routine (PR) includes both behavioural and mental components used by an athlete to regulate their emotions and actions. The model employed in this case study was considered to apply PR in an optimal manner, as it provided relevant information regarding their emotional regulation. This in turn allows for manipulation of the strategy during competition for refinement.
It was acknowledged this is especially relevant and useful for self-paced motor tasks such as free-throws here as well as skills such as golf putting, soccer free kick taking and many others. The ability to perform key skills in a consistent manner is of crucial importance and such a model may also be of use in realms outside that of this case study
Want to learn more?
Then check the se out...
The use of a PP-R led to an improvement of the participant’s free-throw shooting ability, with shot success rising from 40% to 60-65%. It was also noted that beyond this, her overall basketball performance improved - this came in the form of her, in the authors’ words “becoming a dominant player” who received more than 25 mins of play time each game, although her previous game time was not referenced.

“There is strong case study evidence presented here that a relevant preparatory routine can be really useful in overcoming mental stress during the execution of self-paced motor tasks. The importance of learning and practising these skills is highlighted and I think is especially important before such techniques can be used in competitive situations. I think it’s also important that the skill of refinement of the PR during competition is considered, as this provides flexibility to the framework.
“Although this is a case study – which comes with the typical limitations regarding how broadly the conclusions can be used – I think this is an interesting, important study that can provide a starting point for any athlete wishing to get a better grip on their performance, especially when the stakes and nerves are high! It is important to find a way to use similar strategies that work for you, but I feel this is an important tool for those looking to optimise their performance.”

This month ’ s top research in strength & conditioning.

CAN WE JUST GET STRONGER TO PUNCH HARDER?
WHEN SHOULD YOU TERMINATE A SET BASED ON VELOCITY LOSS?

Increasing punching force is highly beneficial for boxers as it potentially influences fight outcomes in the athletes’ favour by scoring knockdowns, a knockout, or influencing a judge’s perception of clean punches especially as an opponent wears the damage.
While technique is always of highest importance, force production capabilities may also play a large role. Therefore, this critical review examined the role of strength on punch impact force in amateur and professional boxers.
The authors searched MEDLINE, Google Scholar, Scopus, SPORTDiscus, and Web of Science for cross-sectional, correlational, and observational studies. The following keywords were searched: “boxing,” “boxing AND strength,” “boxing AND neuromuscular system,” “boxing AND weight training,” “boxing AND resistance training,” “boxing AND punch performance,” “boxing AND punch impact force,” “boxing AND peak force,” “boxing AND power,” and “boxing AND anaerobic.”


From the selected studies, the following information was extracted: study information (i.e., author(s), year of publication); descriptive information of subjects (i.e., performance level, gender, age, body mass); punch assessment (i.e., punch type, punch variable, punch measurement tool, and protocol), maximum strength assessment (i.e., assessment type, variables), explosive strength assessment (i.e., assessment type, variables), relationships between strength and punch impact force (i.e., Pearson’s r), and strength training interventions (i.e., strength quality type, training phase, duration, frequency, control group, performance measures, results).

Relationship between maximal strength & punch force characteristics
§ Absolute peak force of the lower body assessed by the isometric mid-thigh pull (IMTP) explained 46% of the variance in punch impact force (r = 0.68). Identical associations were found for absolute maximal strength impulse (i.e. how much force changes momentum) (r = 0.68), and force at 5 m.s-1 (r = 0.68).
§ Peak force measured through an isometric squat was largely associated with jab and cross-impact force in elite male and female amateur boxers (r = 0.79 & 0.73 respectively).
§ Isometric bench press was not related to jab or cross punch impact force, impulse, or force at 5 m.s-1. However, it did correlate with relative punch impact force (r = 0.62).
§ Boxers who produced higher punching impact forces had significantly greater absolute lower body strength than medium and low punch impact force boxers.
§ Compared with other sports, boxers display lower body maximal strength similar to collegiate wrestlers and elite MMA fighters but are below sports such as elite rugby league. Relationship between explosive strength & punch force characteristics
§ Strong correlations were found between countermovement jump (CMJ) height and jab and cross punch impact forces (r = 0.72 & 0.80 respectively). Strong correlations were also found with squat jump (r = 0.77-0.78), loaded squat jump (r = 0.83 –0.85), CMJ peak force and peak power (r = 0.68 & 0.54) respectively with punch impact force.
§ Explosive bench press throw was strongly related to jab (r = 0.75 – 0.76) and cross (0.78 – 0.79) impact force. Further, barbell velocity of the bench press at 30-80% 1RM was correlated with velocity of the cross but not the jab (r = 0.64 –0.82).
§ Elite amateur boxers report CMJ heights between 36 – 43.1cm on average, which is below team sport athletes and other martial arts such as taekwondo, karate, judo, and wrestling.

This critical review hammers home the point that lower body strength and power are crucial for punching impact force. While boxing may seem like an upper body sport, the lower body is what separates sub-elite and elite boxers regarding physical performance. A seminal study on punching impact force shows more experienced boxers have greater contributions from the legs compared to less experienced boxers (see HERE).
There are two methods I believe would work well when planning strength training for a boxer. First is to run a phasic approach, prioritising maximal strength after a fight. This would involve heavy squats, leg press, or other lower body exercises >80% 1RM. As fight camp approaches and through the beginning of fight camp, explosive strength is prioritised with various jumps and plyometrics. This can also be complexed with maximal strength exercise if the athlete is lacking in this area. Finally, a peaking phase can be performed mixing explosive strength and oscillatory isometrics to enhance the ability to rapidly contract and relax.

Another approach is to use a force-velocity profile taken from a squat jump test to identify a boxer’s weakness. If they are force deficient, you could use the approach above. If they are velocity deficient, explosive strength should be prioritised initially
“While the lower body is vital for punch performance, there are other factors at play. For example, rotational strength and power, and the ability to maximise effective mass at impact with the double peak muscle activation phenomenon (see HERE). This means we can’t solely focus on physical outputs; while it’s the boxing coach’s area of expertise to work on the technical side of boxing, physical performance coaches can reinforce and enhance certain technical abilities without overstepping our boundaries. For example, end range isometrics can reinforce the stiffening and bracing required to maximise effective mass and transfer as much momentum to the target. It can also strengthen the double peak muscle activation seen in elite fighters.”
Velocity based training (VBT) allows for prescription and auto-regulation of resistance training. Setting velocity thresholds is a common way of using VBT to target specific adaptations. A velocity loss of 40-50% means the set is performed to near or until failure. In contrast, a velocity loss of 20-25% allows the individual to stop far from failure in the bench press and squat.
Velocity loss is when a set is terminated at a specific percentage decrement of the highest velocity rep in the set.
Higher velocity losses have been shown to induce greater hypertrophy whereas lower velocity loss results in better strength and power gains (see ). Other studies HERE investigating the bench press and finding similar results have used high intensities (65-85% 1RM).
Therefore, this study examined if these findings can be extrapolated to the bench press at lower intensities.
Fifty resistance trained young men (age = 23.3 ± 3.3 yr) were allocated to one of four groups in a counterbalanced sequence based on their bench press 1RM: 0% (VL0), 15% (VL15), 25% (VL25), 50% (VL50) velocity loss thresholds.
Before and after the training intervention, subjects underwent:

§ Cross sectional area (CSA) measurement of the pectoralis major
§ A maximal isometric bench press test 1cm above the chest. Maximal isometric force, rate of force development (RFD), average tangential slope of force-time curve at 50, 100, 150, 200, and 400 ms, and surface electromyography (EMG) of the pectoralis major and triceps.
§ A progressive loading test with the Smith machine bench press using a linear position transducer They recorded 1RM, mean propulsive velocity (MPV) during unloaded and all loaded bench press reps.
§ A fatigue test, completing as many reps as possible until muscle failure with a load corresponding to 70% pre-training 1RM. Max number of reps to failure and average MPV for the set were measured.
The training intervention lasted eight weeks, where they bench pressed twice per week with an intensity of 5570% increasing linearly Three sets were performed each session with four minutes rest between sets.
VL0 performed one rep per set. The other groups terminated the set when reaching their corresponding velocity loss threshold.

This study adds to the current body of evidence suggesting the use of VL thresholds are a viable strategy to target neuromuscular or hypertrophic adaptations. Here is how you can use them:
§ VL50 – hypertrophy goal
§ VL25 – maximum strength goal
§ VL15 & VL0 – speed goal

Bear in mind this is specifically for the bench press at intensives between 55-70% 1RM, and velocity loss thresholds may differ with other exercises.
High velocity loss (e.g. VL50) should typically be avoided with athletes when strength is important, or getting close to a competition due to negative neuromuscular adaptations. However, if the primary goal is hypertrophy and an athlete is far away from competition, VL50 may have its place.
You can also use velocity loss as an easy way to periodise a training program. For example, starting at a 50% velocity loss and progressing to a 10-15% velocity loss as you progress from hypertrophy, to strength, to speed and power if you run a phasic approach to programming.
There are many options on the market to measure barbell velocity The Gymaware is typically considered the gold standard. However, there are accelerometer-based options that are more cost effective such as the Vmax Pro, which I personally use.
Only VL50 showed significant increases in pec CSA. All groups significantly improved isometric force and RFD. Only the VL25 showed significant increases in pec EMG activity with VL50 significantly reducing triceps EMG activity
VL15, VL25, VL50 showed significant improvements in 1RM strength but VL0 did not. Only VL0 and VL15 showed a significant increase in maximal unloaded velocity
VL50 performed significantly more maximum reps during the fatigue test post training compared to Vl0.
Over the eight weeks, total reps performed were:
§ VL0 = 48 reps
§ VL15 = 189

§ VL25 = 310
§ Vl50 = 491
“Velocity loss is a proven viable option for prescribing resistance training to target strength, speed, or hypertrophy adaptations. Velocity loss isn’t the only way to use VBT. For example, instead of programming with percentages where you need to test 1RM, you can use velocity ranges, which autoregulates load; i.e. performing an Olympic Weightlifting derivative between 1.82.0 m.s-1 peak velocity
“General best use is using peak velocity for ballistic actions and average velocity for isotonic strength exercise, as traditional strength exercises have a long deceleration phase during the concentric action.
“Finally, VBT can be used as a monitoring tool by measuring peak velocity of a loaded jump with a set load each week. For example, as part of an athlete's warm-up, performing a trap bar or barbell squat jump with 40-60kg weekly and measuring peak velocity provides a great indicator of readiness and progress on a training program.”

This month ’ s top research on technology and monitoring.
AN EASY METHOD TO ESTABLISH I NTENSITY ZONES IN ENDURANCE RUNNING
ELITE SPORT MONITORING TRENDS IN THE UNITED KINGDOM
CATEGORISING AND PRESCRIBING ON-FIELD TRAINING DRILLS FOR FEMALE SOCCER PLAYERS
All running that an athlete performs in training is not created equal, as the relative speed, duration, and distance will vary and is specific to the individual and intended adaptation. Therefore, as with any modes of training and exercise, there is a volume and intensity associated with the prescription of load, and having a specific plan is arguably most effective for improved performance (see HERE).
There are typically three intensity zones associated with endurance activity that can be helpful in appropriately managing and dosing work for athletes in training but identifying these zones in a practical (non-laboratory setting) can be a challenge.

Zone 1 is fairly easy to identify subjectively, with the ‘talk test’ or rating of perceived exertion (RPE) at 4 out of 10 (see HERE).
Zone 2 is a pace or intensity that is associated with critical speed (CS, see ), that has shown potential to be estimated HERE with two or three training/race performances (see HERE).
The threshold that separates zone 2 from zone 3 however, does not have a universally accepted method, and it is difficult to identify what would be considered velocity at maximum oxygen uptake (vVO2max). Therefore, this study aimed to establish valid predictions of vVO2max, by using CS from two training performances in experienced running athletes in order to appropriately define intensity zones with trainin
Twenty-two Tier 2 recreational runners (age 24-51-yr) with at least two years of competitive running experience were assessed with a progressive treadmill protocol in a laboratory setting to determine an estimated VO2max, using gas analysis with open-circuit spirometry and the associated treadmill velocity (vVO2max).
Additionally, participants ran ‘citizen races’ of 1-, 2-, 3-, 6-, or 10miles on separate days throughout the autumn and winter months in favourable conditions (10-20°-C, dry, minimal wind) with the goal of running the fastest pace possible. Regression analysis was performed using the 1- and 2-mile performances to determine CS.
Critical Speed was compared to vVO2max for each individual, and correlational analysis was performed across all participants.
Calculated CS from the 1- and 2-mile performances, or the average velocity of either citizen race, proved to be a valid estimate of vVO2max.
Therefore, a protocol or distance that challenged the athlete in the 4-8-min range could serve as both a measure of CS and an estimate of vVO2max, proving even more time efficient than having to run two trials.


When prescribing any type of extensive (>1-min) activity, it is critical an athlete understands the intended intensity (e.g. pace or velocity) that they should be working at to accomplish the intended demands of training. For example, if the session is meant to be restorative and low-intensity (below initial lactate or ventilatory thresholds), an athlete must understand what this pace is and feels like.
§ To help describe and confirm what zone 1 is and feels like for an athlete, use the ‘talk test,’ which should be a pace that still allows sentences and back and forth conversation to be ‘comfortable.’ This is also associated with an RPE of 3 or 4 out of 10.
§ Learning zone 1 is important to understand because for an endurance athlete who trains with high volumes of work (e.g. >40-km per week), the majority (70-80-%) should be accomplished in this low-intensive but comfortable intensity (see HERE).
§ Likewise, the difference between zone 2 and zone 3 should be understood by the athlete, respecting that accumulating work at a submaximal intensity (zone 2) can be challenging, but does not have to be exhausting.
§ Lastly, dosing workloads in zone 3 very sparingly (<10-% of total volume) is important for managing fatigue and allowing recovery, but also experiencing supramaximal paces that can help the athlete better prepare for competition and improve performance.
If laboratory testing is not available, identifying training measurements that can simultaneously provide feedback for the coach, while also offering performance-enhancing benefits allows training and testing to occur simultaneously This optimises the time and efforts of the athlete with an arguably repeatable and reliable assessment of performance potential based on the results of this study. Identifying a ‘sweet spot’ distance that is specific to the athlete’s race distance, as well as not overly psychologically and physically taxing is important to identify. Selecting one test that can be performed more frequently (every 2-4-weeks) is better than two tests that are performed every 6-8-weeks. Other considerations around testing and training:
§ Running a range of distances for minimal time in the 4- to 20-min window can help predict performance across the 800m to 5km race distances. If performances do not match predictions, this can help to identify weakness and guide more specific training to prepare for a specific race. For instance, if an athlete is preparing for the 800m, and their 2km and 5km distances suggest a potential to run faster in the 800m than they are currently able to, their extensive aerobic abilities are better than their higher zone 3 capacity Therefore, the coach may spend more time at the intensity and pace that is specific to an 800m.

§ A specific method for increasing VO2max is to run five to eight repetitions of 800-1200m, with a 400m jog (or 3min) between repetitions (see HERE).
“Identifying relative intensity zones for endurance training and an athlete s performance potential is vital for effective prescription, appropriately managing the dosage of training, and allowing the opportunity for improvements in performance. Athletes often want to work hard and associate higher intensities with more effective training (“no pain, no gain” mentality), but oftentimes a coach is in place, not to push, but rather to protect a driven athlete from doing too much and too fast. High volumes are necessary and beneficial for endurance athletes, improving oxidative metabolism, as well as leading to cardiovascular and respiratory adaptations. However, when these high volumes are composed of too much high-intensity effort work, this disproportionate combination can increase the risk of injury or fatigue due to lack of recovery from overload.
“With the results from this research, identifying a simple relationship between CS and vVO2max empowers coaches and athletes to train with a better understanding of intensity This range of intensity is likely already being experienced by the athlete in training, and with assessment, coaches can provide feedback for athlete progress and guidance in training. From a time and cost-effective standpoint, identifying simple and easy assessments that allow training to concurrently occur, define intensity, and evaluate performance are priceless.”
An effort to better understand an athlete’s readiness and response to training – paired with the ability to obtain massive amounts of readily available information from various technologies (e.g. wearable devices, timing systems, force plates) and athlete self-reporting questionnaires – has created a demand for entire ‘athlete monitoring systems’ (AMS) within elite sport to gather, manage, and visualise data.
Similar to training philosophies, there is a specific methodology adopted by teams, coaches, and athletes that aims to optimise efficiency and provide actionable return from the information coming in. In navigating monitoring strategies, there are countless options and little clarity on what works best regarding specific questions to ask of athletes, how to improve the adherence when collecting information, and disseminate information effectively to all parties involved.
To date, research around monitoring in elite sport has largely originated from Australasian countries and is predominantly around invasion sports (e.g. soccer, basketball, football, hockey, and rugby, see HERE), leaving gaps in the literature for other regions (e.g. United Kingdom (UK)) and sports (e.g. track and field, boxing, canoeing (sprint and slalom), cycling, gymnastics, rowing, and swimming). Therefore, this study investigated monitoring strategies (e.g. how information was collected, examined, and relayed between coaches and athletes) within elite sport, specifically in the UK, featuring suggested trends and areas of improvement.

A 50-question (~20-minute) survey that enquired about background information, monitoring data collection, analysis, feedback, athlete adherence, as well as specific questions relative to use with or without an AMS, was sent to 75 practitioners working in elite sport within the UK. Follow-up attempts were made at 2- and 4-weeks following the initial request and a total of 30 responses (40%) was collected for review by researchers.
The practitioners who responded had 8±5 yrs of involvement with nearly 600 senior national team athletes from a range of sports: track & field, para track & field, cycling, para cycling, gymnastics, hockey, judo, rowing, rugby 7’s, sailing, swimming, taekwondo, and triathlon.
A summary of findings based on the respondents’ goals with monitoring, the manner in which data was gathered, assessed, and shared was presented.
Seventeen percent of respondents did not currently utilise an AMS but were attracted to doing so. The general reason for not currently interacting with an AMS was poor athlete adherence or logistical constraints.
Of those (83%) who did implement an AMS, 16% of those individuals did not have logical or scientific understanding as to why they were administering monitoring in their current fashion.
§ For the group that did implement an AMS, their general explanation for use was related to mitigating injury or illness and optimising performance.
Medical teams for 44% of respondents did not gather athlete monitoring data - instead daily monitoring was handled by another member of the multidisciplinary team (e.g. coach or scientist).
Seventy-two percent of respondents collected data using mobile devices, but there is uncertainty whether this method is truly effective enough for athlete adherence in elite sport (see HERE)
Ninety-six percent of respondents employed a customised questionnaire, involving various combinations of single-item questions. No respondents utilised a published and validated questionnaire (e.g. REST-Q, see HERE).
§ The most common single-item questions were sleep quality, muscle soreness, and illness/injury status.
Most (84%) used some range of a Likert scale, with 57% using a 10-point scale but that same percentage (57%) did not know why their scale range was selected and used.
Few respondents used extensive analysis models (e.g. exponential and rolling averages, or linear/non-linear modelling), but rather standard deviations and raw data sets were most commonly implemented to assess changes in training status. This practice is likely due to time constraints, lack of knowledge, or adapting to providing clear feedback for other coaches and athletes, directly
Forty-four percent of respondents felt follow-up feedback was not sufficient to coaches and athletes. Most feedback occurred with the multidisciplinary team, followed by the athlete, then coach. However, some never even discussed data with the athletes (4%) or coach (8%).

Most importantly, all parties (coaches, athletes and support staff) need to have a working knowledge of why they are implementing the monitoring strategy that has been decided. This begins with an assessment of what questions need to be answered, and what information coaches and athletes lean on to make decisions for training prescription and effectiveness. By doing this, monitoring strategies that are minimally invasive to the overall day-to-day operation can be identified and simplified.
§ For example, if coaches are concerned with muscle soreness or an athlete’s perception of energy (fatigue), a simple and consistent question around that topic should be implemented. Coaches should aim to limit time demands when collecting data, not adding additional stress to an athlete s daily routine, nor should it be used against them as a form of control (surveillance) that creates anxiety or invades an athlete’s privacy without their interest.

§ Further, aid athlete adoption and consistency by getting them to understand why you are collecting the information and how it will benefit them.
In order to provide the best potential for success when implementing an AMS, a team approach that involves all parties (e.g. coaches, support staff, and athletes), has high compliance, and is open to feedback and modification will be optimal. This involves identifying someone as the lead or contact with execution and analysis, as well as coaches and athletes taking time to ask questions, investing time and energy in follow-up and understanding of the data.
§ From there, it is important that all parties involved are included and data is not withheld from coaches or athletes. Since the data has been deemed important, the insight provides current, important, and actionable insight that allows everyone, athletes included, to operate at a higher, more accountable level, with the ability to make more confident decisions.

Caution should be taken when viewing an AMS as an injury reduction tool (see ), but it does create HERE the opportunity for improved communication relative to an athlete's perceived physical health, psychological well-being, and ability to manage the stress of life and sport. A questionnaire or AMS is not a cure-all - there is still reaction and follow-up necessary in order to effectively modify and prescribe training.
§ Specifically, when using single-time athlete self-report measures (e.g. soreness, well-being, sleep quality), these reports should be approached as triggers or alerts for follow-up conversation, not a burden of awareness or barrier to deeper understanding. Use this information to more effectively prescribe training and educate athletes, developing ownership in their recovery and adaptation ability
§ With regards to having support and reasoning for monitoring decisions, customising questions presents a great opportunity to individualise, but due to the lack of clarity of single-item questionnaire sensitivity to change (see ), coaches should take time to validate their questionnaires upon HERE implementation (see ). This increases support and buy-in for all involved. HERE
Literature suggests that sleep quality as a single-item report measure has poor sensitivity (see HERE), suggesting that an objective measure of sleep or performance, and questions that focus on other athlete perceptions (e.g. energy or vigour) is better for specific insight into an athlete s perception of readiness.

A Likert scale beyond seven points does not improve validity or reliability When selecting a Likert scale, it has been suggested to choose between 4 to 7-points, and each should be clearly defined and understood by both coaches and athletes (see HERE)
"This research highlights the important principles to remember when selecting and employing a monitoring strategy An AMS is most successful when it is well received by everyone, using it as an advantage or opportunity to heighten the understanding and effectiveness of training. This takes strategy in and of itself, to incorporate it into a training routine, not as a burden, but opportunity to leave no stone unturned in the pursuit to be the best and maximise potential, accomplishing, and possibly surpassing goals.
“There are of course limits related to time, resources, and even humility from others to be transparent and collaborative in the first place. All of which can be overcome, and where there is a will, there is a way The initial focus needs to be 100% buy-in from any coach and athlete involved. Further, implementing technology or questionnaires that have been validated through research. Ultimately, the more parties involved, the more difficult it can be, but with patience and perseverance, a well-supported (through both evidence and experience) strategy can be implemented. This is when and how monitoring improves an athlete s education, recoverability, and performance. Allowing all the time, energy, and effort to bring the return on investment intended.”
Research has recognised a significant improvement in female soccer players’ technical abilities (see ) and HERE at higher speeds than ever before (see ). This could HERE be due in large part to better physical, tactical, and technical training.
Coaches utilise various drills that emphasise different components of the complexity of soccer, stretching over a large pitch, involving high levels of aerobic ability, yet also requiring precise ball-handling (footwork) and explosive speed. There is not one perfect drill that can accomplish this, especially while managing fatigue inseason, but coaches can reinforce execution and their style of play through a strategic arrangement of drills that vary in intensity and duration to prepare players for the demands of the game.
However, there is limited research on the rapidly changing performance capacity and training demands for female soccer players. Therefore, the purpose of this study was to better understand the running demands and ball handling across various training drills utilised in female elite soccer, with special attention to how those drills were implemented across the days and weeks of inseason training.

Training data for 458 female soccer players (defenders, midfielders, forwards) across 18 teams and three divisions (Women s Super League, Women s Championship, and Women s Super League Academy) was collected across 28 weeks during the 2020-21 season using inertial measurement units worn on each foot.
Researchers looked specifically at training sessions involving the full team (starters and non-starters), quantifying the number of ‘touches’ (when a player interacted with the ball at their feet), ‘releases’ (when a player kicked a ball out of possession), as well as totaland high-speed (>5.29-m.s-1) running-distance covered during each drill. The touches and releases were identified to represent the ‘technical demands, while the running distances represented the ‘locomotor’ demands of a drill.
Drills were categorised consistently across all teams using previous research (see ) and an educational HERE webinar was given to staff from each team for collective understanding and classification. Six different drill types were defined:
§ Position Specific Training – drills separated and coached directly by position or individual.
§ Possession – drills simulating match play, designed to keep the ball from the other team.
§ Intensive Small-Sided Games – drills that simulated match-play on a reduced-size pitch, with constraints (specific rules) to increase intensity and reduced players (1-3 per side).
§ Extensive Small-Sided Games – drills simulating match-play on a reduced-size pitch, but with at least four players per side and modified rules.
§ Tactical – drills that increase players' understanding of their specific role and responsibility within the team during various match-like situations.
§ Technical – drills that developed a specific ability (passing, shooting, defending, or ball-handling) yet still working as a group.
Nearly 20,000 data sets from players’ training were analysed that incorporated simultaneous technical and locomotor demands, quantifying the volume (duration) and intensity (rate) of each drill and identifying the variability at which it was incorporated into in-season training. This information was also examined for variance across the three female divisions selected and presented based upon duration, intensity, and frequency
Drill duration and the number of releases per minute were the two qualities that varied most between drill categories, suggesting duration was the primary variable to adjust (rather than intensity) when prescribing.
Locomotion (total distance and high-speed running distance per minute) had trivial variability between drills.
There was little variance in the number of touches per minute between drills (2.15-2.93-n.m-1).
Technical drills had the highest number of releases per minute (1.65 n.m-1).
Across all three divisions, technical drills and extensive small-sided games were most prevalent. Women’s Super League primarily implemented technical and tactical drills (54% of all drills)), while Women’s Super League Academy spent the majority of work on extensive small-sided games and possession-based drills (52%).


Given the results of this study, when organising training drills, the target to develop (e.g. technical, tactical, position specific skill) and duration should be the primary focus to determine training prescription.
§ Coaches should pay close attention to the length of time for each drill to ensure consistent quality and productivity for the athletes. Allowing a drill to go too long, especially in-season, can be overly taxing and place athletes at a higher risk of injury
It is critical for coaches to recognise that the most elite division researched (Women’s Super League) primarily focused on technical and tactical drills (54% of time) with the entire team because those are the most important skills that can dictate performance (see ). They need to be prioritised during in- HERE season training in order to maintain and continually develop those abilities.
For more developmental levels or players who only train 3-4 times per week (versus 4-5), dedicating more training time to extensive small-sided games and possession-based drills in training is suggested. By focusing on team-based match-specific qualities and performance, this is arguably the greatest return on the time invested, especially since there are technical or tactical demands underlying small-sided games or possession drills.

The other consideration is technical drills and more extensive small-sided games carry less psychophysiological stress (e.g. lower heart rate and rating of perceived exertion (RPE)). This is another reason to primarily include this during in-season training as there is less of a burden on recovery and readiness between matches.
§ Classifying drills based on rate of touches per minute is a poor proxy for intensity and a coach s understanding of the potential psychophysiological impact a drill has on a player Alternatively, categorising drill intensity by RPE or heart rate response (e.g. % of maximum heart rate) is a more accurate representation and provides coaches with insight to best plan training drills.
§ Additionally, pitch size is likely the greatest influence on the intensity of a drill, such that, the smaller the pitch, the greater the rate of interactions between players and the ball (touches and releases per minute), but a larger pitch would bring more locomotive demands on a player Therefore, the most important thing a club can do is quantify training drills based on volume of running and categorise based on intensity (RPE or heart rate). In turn, implementing a team-specific drill classification system that enables coaches to organise training drills effectively and efficiently across the week.
A final consideration around the context of drill prescription to appreciate is the coach’s competence, especially as it relates to position-specific drills. A coach may be inclined to put more time with a specific technical development (e.g. goalkeeping, or defending), if he or she has a plethora of experience in that area. Use this as an advantage to dedicate time to developing a given quality and understanding to its fullest in the athletes, but also be cautious of the bias it can possess in leaving other areas underdeveloped.
Then check the se out...

“This novel and well-sampled research for female soccer players is a great example of better understanding how to manage a week (microcycle) and individual on-field training session. It is similar to strength training in the weight room, appreciating that all exercises are not created equally, meaning that what you do and how you do it matters. Different exercises have a purpose, an effect, and outcome relative to what is specifically performed (e.g. sets, reps, technique, etc.). The same holds true for various training drills on the pitch - although it all looks like soccer, each drill carries a purpose, effect, and can either help or hurt an athlete’s progress in-season.
“Therefore, understanding the demands associated with a drill and creating a shared classification system amongst the team can be pivotal in helping coaches better prioritise and prescribe drills in a training session and across the week. Most importantly, this holds true for any sport (e.g. basketball, hockey, rugby, etc.), and is not specific to soccer.”
“With this shared understanding, training moves closer to ‘optimal,’ in that training time is efficient and effective, with a reduction in injury risk because of well-managed training loads. Coaches can become more organised and calculated in how and why they prescribe a given drill and recognise the minimal effective dose necessary to accomplish the goals intended (e.g. improved technical ability, better tactics, improved possessions, or increased match-like exposure). By doing this, the weaknesses of a team or individual are better developed and the sport itself is advanced.”

This month ’ s top research on fatigue and recovery

CONGESTED SCHEDULES VS. REC INVESTIGATING NON-CONTACT IN PROFESSIONAL FOOTBALL
DO PNEUMATIC COMPRESSION DEVICE HAVE AN EFFECT ON PERFORMANCE USED FOR THE UPPER BODY?
ARE SHORTER OR LONGER NAPPING INTERVALS MORE EFFECTIVE FOR ATHLETIC PERFORMANCE?
INVESTIGATING HIP AND KNEE ANGLES FOR FEMALES WITH PATELLOFEMORAL PAIN SYNDROME
Professional football teams are required to play up to 50 matches over a competitive season, which spans about 40 weeks. This forces the players to endure a congested schedule where recovery between match days is limited. As a result of o this, it has been suggested that fatigue accumulates and may cause a significant injury risk especially through non-contact injuries.
The aim of this study was to analyse how factors such as strength, sleep quality, perceived muscle soreness and fatigue affect the relative risk of football players sustaining non-contact injuries during matches and training periods.
Forty-six players from the same French Ligue 1 team with an average age of 24.2 years of age were studied over a total of two seasons. A recovery monitoring procedure was implemented when the team played at least two matches per week with a maximum of four days between those matches. The players being studied had to have played at least 90 minutes during those matches. Out of the forty-six original players in the study, fifteen fit the criteria to be a part of the current study This procedure consisted of a recovery protocol along with a monitoring procedure.
The recovery protocol was performed the days after each match and consisted of the following: drinking a high sodium drink for sweat recovery, cold (10 to 12°C) bath immersion for 10 minutes, use of compression garments and eating a high carbohydrate/protein meal. This was done 30 minutes prior to training sessions following match days. This protocol was utilised 48 times in total in the two seasons.
The recovery monitoring procedure consisted of subjective and objective testing of the players who fitted the study criteria. Subjective reporting included a question regarding duration of nighttime sleep and naps taken, the Hooper scale (quality of sleep, level of fatigue, muscle soreness and level of fatigue rated from 1 to 7) and perceived recovery from a 0 to 10 scale. Following a standardised warm-up of 10 minutes on a cycle ergometer, Objective reporting was taken which included creatine kinase concentration measurement, a countermovement jump and the level of isometric posterior limb muscle test (knee and hip flexed to 90 degrees with maximum push on a force plate).
The authors also looked at injury data. They defined an injury as any physical complaint sustained that resulted from a match or training. Injury incidence was calculated as all injuries sustained per 1000 hours of football.
The data for all testing was collected and analysed. It was taken for each day after the matches and compared on an individual and group level.
The authors found 38 total opportunities to implement the recovery protocol/monitoring. This was limited due to the season s schedule and other external factors in the team being studied. Fifteen total players were studied over this time. Over the two seasons, there were a total of 29 total injuries reported with 20 of those being non-contact. The total injury incidence during this time was 12.5 injuries per 1000 hours of football play (most occurring during matches compared to training).
It was found that the relative risk of non-contact injury increased when perceived fatigue and perceived soreness increased. This was reported at the time period of two and three days after the match. On the other hand, relative risk of non-contact injury was reduced when sleep quality was reported to be higher Along with this, there was a lower decrement of isometric force with the posterior lower extremity tested.
Other variables measured included the following changes from the first to the third day after a match. Although it is noted below, the following variables were not found to have an association with risk of non-contact injuries: creatine kinase levels, sleep quality, stress, perceived recovery and countermovement jumps
§ Sleep quantity increased
§ Sleep quality decreased
§ Stress decreased
§ Fatigue decreased
§ Muscle soreness decreased
§ Perceived recovery increased

§ Creatine kinase concentrations decreased
§ Countermovement jump scores improved from a loss of 12.3% to 9.5% from baseline reference

§ Isometric force cumulated score fluctuated from a drop of 17.2% the day after a match, to 14.5% the second day after a match to 18.3% three days after a match.
A congested schedule in professional football decreases the ability for players who participated in full matches to fully recover. Perceived muscle soreness and fatigue can accumulate and increase risk of non-contact injuries.
Monitoring players' sleep quality can be a factor in injury risk reduction. This can be measured through subjective questionnaires and conversations with players.

Monitoring strength can assist coaching and rehabilitation staff to try to reduce injury risk. Measuring isometric strength of players and looking for a decrease in force throughout the season can provide objective data to catch decreases in performance and increases in risk of injury
Adjusting training schedules and player rotations during matches may be necessary when perceived soreness and fatigue is reported along with drops in strength testing.

Although it cannot fully prevent injury, implementing recovery strategies such as optimal nutrition, sleep quality and strength training throughout the season may decrease the risk of it occurring more frequently
“Decreasing risk of injury throughout the season is vital especially when football players go through a congested schedule. Strength training of the posterior chain (which includes your gluteals and hamstrings) can help to improve muscle power and force along with providing balance between the front and back side of our lower body
“Sleep quality and quantity cannot be ignored either Players and coaches need to be aware of the amount of time they are able to sleep in season in order to achieve maximal performance. Without it, there is an increased risk of injury with a decrease in performance.
“Monitoring both sleep and strength training can be implemented by coaches and players alike. This can be done through journals and weekly check-ins with players regarding sleep habits and quality. From a strengthening perspective, rehabilitation professionals and coaches can work together to develop programs that emphasise the correct muscles and movement patterns to maintain force development and endurance necessary for sport.”
Intermittent Sequential Pneumatic Compression devices (ISPC) have recently become popularised in order to enhance recovery from athletic performance. The devices most commonly look like pumped-up sleeves and were initially designed for conditions of venous insufficiency, as they mimic the anatomical muscle venous pump system. This is done through inflation of separate chambers of the device from a distal to proximal (lower portion of limb to upper portion of limb) pattern, with the desired effect to increase blood flow during recovery
This venous pumping has been suggested to remove metabolic waste from muscle, which has an effect on the blood lactate levels - the higher the lactate level, the more fatigued the athlete is suggested to be.
Research on these devices in the past has mostly focused on the lower extremities, with mixed results being found. The current study aimed to investigate ISPC’s role in recovery and the efficacy of using them after upper body exercise on perceived muscle soreness and physical performance variables.
The study consisted of 50 subjects (37 male and 13 female) who were between 18-42 years old (mean 27). They all had experience with resistance training and had been doing so at least three times a week for at least six months. The ISPC device being utilised in the study was the Recovery Pump at 80mmHg for 30 minutes. This was used following the below protocol.
Warm-up: 2 mins at 50 % maximum perceived intensity on arm grinder or rowing ergometer (subjects choice), 10 internal and external shoulder rotations per arm with a theraband, 10 bicep curls with the same theraband and 10 forearm supination/pronations with a 3kg dumbbell in each hand.
1. Performance measures: these were measured before exercise, after exercise and after the recovery
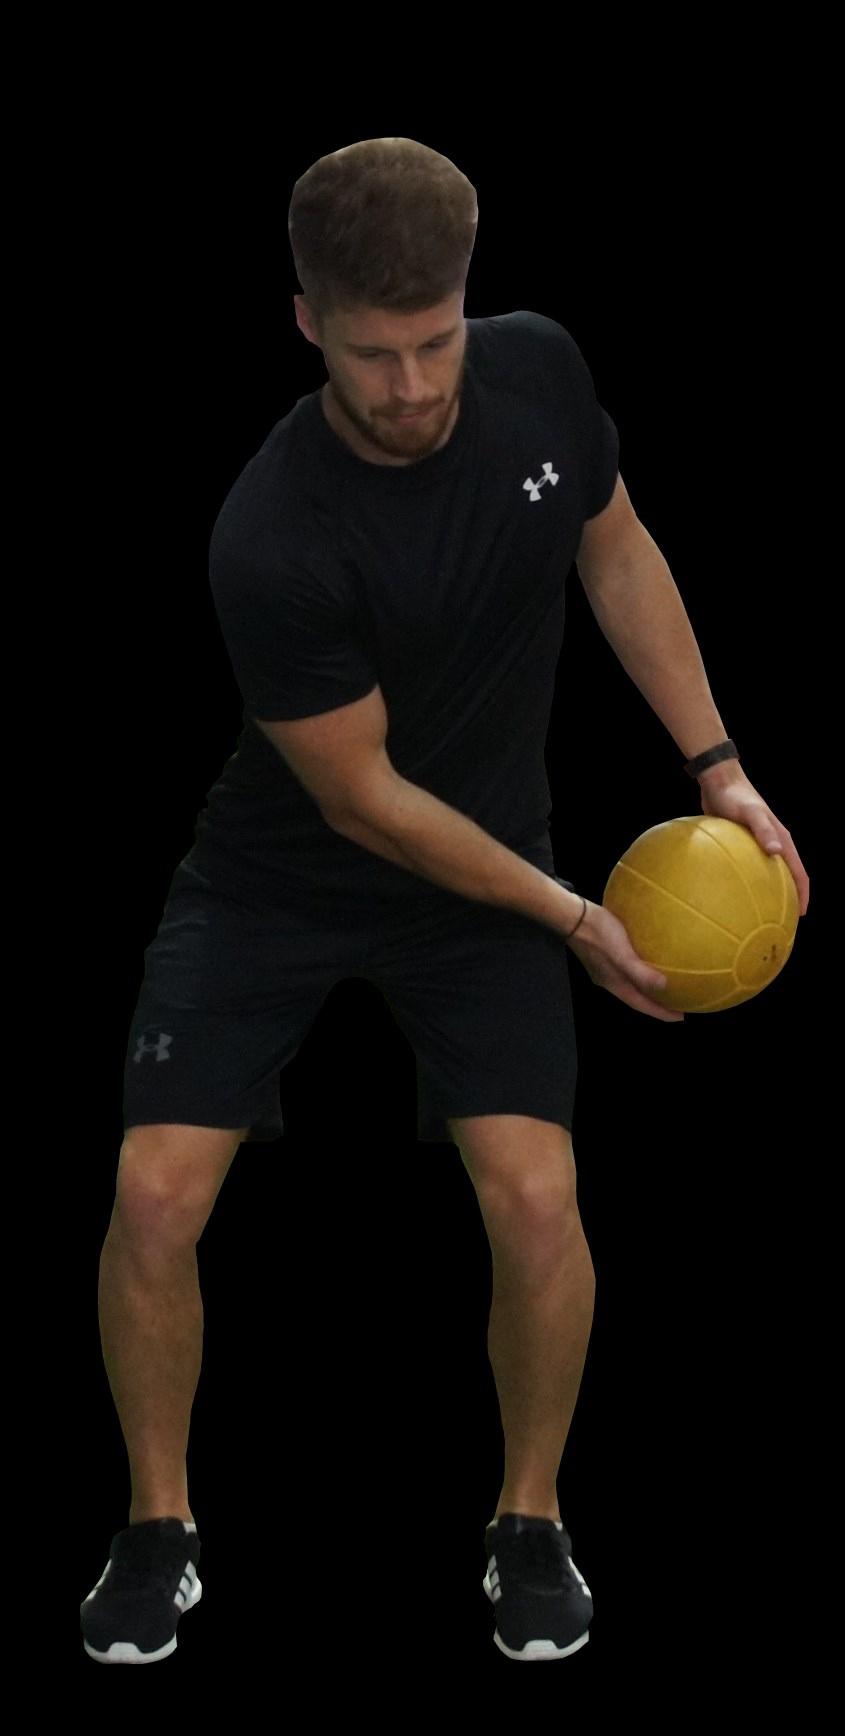
2. Grip strength dynamometer, which was used as a measure of strength. Seated single-arm medicine ball throw for distance (8 kg men, 4 kg women), which was used as a measure of upper body power
3. Single-arm preacher bench bicep curls for muscular strength endurance working to failure (12 kg for men, 6 kg for women)
A fatiguing exercise circuit was performed in between the two trials of the performance tests.
1. Reverse grip battle rope waves for one minute
2. Farmer’s carries: 20m while holding a dumbbell in each hand (30kg for men, 20kg for women)
3. Chin-up: until repetition failures
4. Bar hang: to grip strength failure

5. Hand-grip crushers (a multi rep grip strength exercise): to grip strength failure


The proposed benefits of ISPC for recovery following upper body exercise is small in terms of performance but assisted with perceived soreness for up to 24 hours. This soreness change may be caused by the compression of the device to the targeted muscles. Due to these changes in perceived recovery, the use of ISPC may be beneficial in sports that are upper-body dominant like track-and-field throwing events and grappling sports. Further study in the specific sports is needed to measure the benefits.
Training status of subjects may play a part in the recovery benefit. Prior studies found more significant performance changes with use of the ISPC. These studies measured ‘healthy men ’ and did not mention the training status. This may be a limiting factor, as it is possible when proper training is performed, there is less to recover from. This will leave less potential benefit from a recovery method. Further study with non-trained individuals may find more robust results to show the benefit of the devices.
The effects of ISPC on blood lactate level is unknown and has not been proven in the literature. Further studies measuring these levels in subjects during testing would be more effective.
In the rehabilitation setting, the cost of these devices and limitation in the current evidence for their effect may be detrimental to their continued use.
Following the protocol that was used in this study, there were minimal performance benefits from use of the ISPC upper body device when using it for a 30-minute recovery period. The only performance measure to show significant improvement was for the single-arm medicine ball toss, which is a measure of power This was only found in between trials of the medicine ball toss. All other performance measures showed trivial benefits from use of the ISPC.
Small but significant changes in perceived muscle soreness for up to 24 hours after exercise were found. The authors believe this may be due to the ISPC’s proposed ability to increase local blood and lymph flow through the sequential compression of the targeted muscles. This increase in local blood flow may accelerate the removal of metabolic waste. This could also be due to a decrease in swelling through the compression of the muscle by the ISPC
“This review shows the mixed results of use of ISPC. Although the perceived benefits are enticing, there is a lack of improvement in strength, endurance and power The cost of the devices, along with the recovery time needed, may outweigh the benefits perceived in a rehabilitation setting.
“ISPC studies in the future may benefit from measurement of blood lactate levels to understand the true effects on the metabolic level of the muscle. If there is evidence showing positive changes in this measure, ISPC would be a beneficial resource for the athlete and the rehabilitation professional.”

OBJECTIVE
Proper sleep is necessary to enhance recovery and thereby improve physical and physiological performance. Heart rate, body temperature, blood pressure and cardiovascular function can change dramatically in a beneficial manner during sleep compared to awake conditions. This is primarily caused by an increase in parasympathetic levels during sleep and / or rest conditions along with a regulation of cardiovascular activity
Recommendation of eight hours or greater is appropriate for athletes to achieve this. In order to supplement nighttime sleep when it is not possible, naps have been suggested. In previous studies, naps of varying duration have shown benefits of improved performance. The purpose of this study was to examine the physiological impact of a 40 min nap and a 90 min nap on performance in the 5 metre shuttle run test and on several physiological and perceptual responses.
Sixteen men aged 20 (± 3 years) who were involved in amateur sports including soccer, rugby and handball were studied. Participants reported training a minimum of four days per week with an average of two hours of training per day They were non-smokers, did not have sleep disorders and did not consume alcohol or antioxidants in the preceding two months.
Three experimental sessions were performed prior to the shuttle run testing. Each subject completed the three sessions with a minimum of 72 hours in between. The study conditions included a 90-minute nap, a 40-minute nap or no nap. Participants began testing at 1345 with a 15 minute familiarisation period to the space followed by a nap from 1400-1440 or 1400-1530 depending on the trial. Following the sessions, subjects watched or played videos / games until 1700. Along with the nap conditions, there was an additional session in which players rested only without sleeping.
Autonomic function was assessed via a GT3X activity monitor
Sleepiness was assessed subjectively via a 0-10 scale and the Stanford Sleepiness Scale was used to quantify the degree of sleepiness.
Response to Exercise was measured via the RPE Scale and Perceptual Recovery Scale.
5m Shuttle Run Test: The highest distance covered, total distance that was covered and fatigue were measured.


Napping is a beneficial way to improve recovery and subsequent performance when appropriate night-time sleep conditions cannot be achieved. Increases in parasympathetic levels gained from the naps may be the reason why this occurs.
Overall, performance and autonomic function improve with a longer duration nap. This improvement could have happened due to the longer naps increasing parasympathetic activity for a longer duration. The napping conditions also allowed for higher levels of Slow Wave Sleep and Rapid Eye Movement sleep which coincides with night-time sleep. With this, longer duration of napping produced improved anaerobic performance and capacity during testing . In short, this study provides athletes and the general population with another tool for recovery Although the study had limitations including not accounting for injury or higher level athletes, napping can be utilised to improve objective performance and subjective perception of exertion.
Future studies would benefit from different methods of testing athletes including more sport specific drills or longer duration endurance type tasks. Along with this, it would be interesting to see the effects of napping on resistance training. This could be useful information to strength and conditioning coaches across various athletics.

Following experimental sessions, it was found that physical and autonomic (involuntary actions) performance improved while sleepiness decreased with napping compared to no nap conditions. With this, longer nap periods produced improved results in all conditions of physical and autonomic performance.
Participants achieved higher distance scores on the Shuttle Run Test and reported less perceived exertion for the testing when in the nap condition sessions. Along with this, they achieved lower heart rate, body temperature and blood pressure levels during the napping sessions.
“Napping is a beneficial recovery method which can supplement a sleep schedule which may be affected by travel or congested schedules. Longer periods of napping can mimic night-time sleeping and provide the athlete with improvement in their autonomic functions.”
“Rehabilitation professionals and other fitness practitioners should recommend napping to athletes who are going through drops in performance especially during congested schedules. It is a good way to supplement night-time sleeping especially when dealing with college athletes who need to balance school work with athletics.”
Patellofemoral pain syndrome (PFPS) is a common diagnosis affecting female athletes disproprotionately PFPS is a result of multiple factors, including anatomical and mechanical . From an anatomical perspective, PFPS may be associated with a condition called genu valgus which causes an inward angle at the knee. This is created by the angle between the front of the hip to the patella to the foot which are also internally rotated. People affected by this condition usually will present with pain around and in the retro (behind) patellar area. This may also be called runner’s or jumper’s knee.
This mechanical and anatomical stress over time leads to a decrease in the contact area between the femur and patella, causing pain. Females are more affected by this due to higher FPPA (frontal plane projection angle), which is a measure of the degree of the dynamic valgus angles associated with performed movements. Due to these anatomical differences, this may be more apparent in females.
In order to determine exact angles and provide treatment, accurate measurement is required. Recently, 3-D movement analysis has been used along with 2D analysis in a clinical setting, which uses inexpensive equipment or practitioner visual measurement.
The purpose of this study was trifold. The first was to determine whether 2D FPPA measurements were associated with the measurements of the hip and knee kinematics obtained from 3D movement analysis. The second was to find whether there was an association between the FPPA measured during a single-leg squat to more dynamic activities like running. Lastly, this study compared the FPPA measured during the single leg squat for females with and without PFPS.
The study consisted of 20 female participants with PFPS, and 20 healthy female participants. PFPS was found if the participants demonstrated all of the following clinical situations:
§ Verbal pain score of at least a 3/10 on the visual analogue scale during at least two activities (squatting, prolonged sitting, stair climbing, running or jumping)
§ Knee symptoms behind or adjacent to the patellar
§ Pain with compression of the patella by the physical therapist
§ Insidious onset of symptoms present for a minimum of two months

§ Greater than a 14-point deficit on the Anterior Knee Pain

Both groups completed the following tasks, which were recorded using 3-D motion analysis: Running at a velocity of 3.7 m/s (+/- 5%) (standardised footwear between groups), five single-leg squats and five consecutive single-leg hops.
During these tasks, the FPPA was measured via 2-D measurement and 3-D measurement.
Measurement of hip and knee angles during a single-leg squat can provide valuable information to hypothesise mechanics during running and jumping. The more negative a FPAA is in a single leg squat, the more likely it will be apparent in jumping and running.
3-D motion analysis is a reliable way to measure hip and knee joint angles in the assessment of dynamic lower extremity exercises but may be unrealistic in most clinical settings due to cost. Apps such as myDartfish and Onform may be useful. As was discussed in the study however, 3D motion analysis is preferred when accurate measurement is needed.
From the measurements found in squatting, running and jumping in the study, females with PFPS may benefit from hip strengthening of the abductors along with activities to limit knee external rotation in different weight-bearing movements.
Limitations in this study included the use of a standardised shoe for all subjects being tested. This could have a negative effect on performance if their shoe is not appropriate for their foot type. Future studies should look at the effects of a stability vs. neutral shoe during these movements to see if there was a correlation with the PFPS being studied.
When comparing 2-D measurement to 3-D measurement, it was found 2-D measurement only reflected up to 30% of the variance in kinematics shown in 3-D measurement. The 2-D angle measurements found at the knee correlated to the 3D measurements of hip angle motions found with a negative FPPA. It should be noted however, that this is not an appropriate clinical tool when accurate measurements are needed.
From the results, it was shown that there is a combination of biomechanical abnormalities when looking at a negative FPPA, as the hip and knee joints both produce it. Knee external rotation was found to have the highest correlation to a negative FPPA with single-leg squatting. At the hip joint, the negative FPPA were highly associated with a posterior pelvic rotation at the contralateral hip rather than internal rotation, which was the expected result. This pelvic rotation leads to an increase in hip external rotation. This was also found during running and jumping.
It was found the PFPS group demonstrated a more medial orientation of the knee during the single-leg squats along with an increase in knee external rotation angles during the descent phase. Along with this, the PFPS group had larger hip adduction angles. Interestingly, the change in FPPA value from single-leg stance starting point in the squat was more than twice as large among the PFPS group versus the control group. This may be due to hip abduction weakness causing less hip motion control.
“This review details the association between the FPPA and lower extremity kinematics, which are associated with PFPS. Measuring the FPPA during a single leg squat can be a useful clinical tool in order to devise an appropriate rehabilitation plan for females with PFPS.”
“When assessing clients, always be mindful of single leg squat kinematics, as they can tell us a lot about other activities such as running and jumping. The test may be a powerful baseline measurement for preseason athletics in females to predict possible PFPS and prevent it from occurring.”
“Although 2-D clinician measurement is not as appropriate as 3-D measurement when exact measurement is appropriate, visually assessing the FPPA can categorise female athletes to help reduce the risk of further injury. From this, these athletes can focus on rehabilitation to address appropriate hip and knee kinematics/strengthening. With this, 2-D measurement can be useful compared to 3-D measurement when clinicians are limited by budget and / or costs.”

This month ’ s top research on youth development.
AN INVESTIGATION INTO LOAD INSIDE AND OUTSIDE OF ENGLISH FOOTB ACADEMIES
HOW CAN COACHES UTILISE WEIGHTED VEST PROTOCOLS IN YOUTH SPEED TRAINING?


Football academies are under increasing levels of pressure to find new talent. Considerable amounts of money, coupled with an investment of time into an athlete, comes with an expectancy to produce players able to play in their first team or to sell on elsewhere.
Studies that have looked at training-load data have shown age-related increases in both volume and intensity, which can contribute to injury. However, few studies have explored the load experienced by academy football players outside of their football sessions. Subsequently, this study aimed to understand the load relationship experienced in and outside of football sessions and variations seen over three age groups.
Fifty-two male academy footballers across three different age groups (U12, U13/14 and U15/16; 13.4 ± 1.3 yrs) from an English academy were recruited for this study All participants were asked to self-record the duration, intensity and mode of moderate to vigorous physical activity undertaken outside of academy training in an activity diary
This information was collected daily, based on a match day +1, +2, + 3, -3, -2, -1 system used at the academy Once gathered, this data was then combined with rating of perceived exertion (RPE) data collected from the academy sessions for a total of 78 weeks.
To assess if there was a relationship, the coefficient of variation as a percentage of the mean was taken.


In monitoring training load, those responsible for designing physical activity must be aware of their role in looking after an athlete s holistic wellbeing. Although this may require a culture shift, incorporating wellbeing or burnout measures into daily practice can be essential. Building this into a monitoring system can be challenging, but the team at BASES have you covered with a fantastic monitoring tool Within this (HERE). article, coaches are shown how to monitor burnout symptoms based on three categories: 1) reduced sense of accomplishment, 2) sport devaluation and 3) physical and emotional exhaustion. This can also be extended for sports science staff, as our roles can be incredibly demanding.
If an athlete is reporting fatigue or burnout, coaches need to have the ability and knowledge to help them out of this hole. In this study no statistical difference (HERE), was observed between cold water immersion and passive recovery compared to cold water immersion and active recovery. However, athletes perceived that the active recovery reduced soreness and improved readiness. Therefore, as well as it being interesting that different methods are perceived differently, coaches might look at some dynamic stretching (e.g thoracic rotations, kneeling hip flexor stretches, and squat to reaches), low intensity aerobic work (e.g. bike work or small-sided games) and self-massage/foam rolling. The science behind these methods can be quite extensive, so Grégory Dupont has collated an evidence-based approach in a short video which can be viewed here.

Finally, there are several practical ways to assess if an athlete is potentially doing too much. If you notice an athlete is expressing an altered or lower mood than usual or is missingyour sessions due to illness, particularly upper respiratory tract infections (HERE), thenthis may be a sign they are overdoing it. Reading the athlete's mood is very important asa coach and a series of follow-up questions may provide insight whilst givingopportunities to help the individual. In addition, reductions in speed or power (e.g.countermovement jump) measurements may reflect a change in neuromuscularfunction, indicative of fatigue. These measures must be consistent in order for a full readiness profile to be developed.
Want to learn more?
Then check the se out...
A key finding of this study was that there was no significant difference in the load experienced outside of the academy between age groups. However, there was a greater coefficient of variation in the U15/16 group compared to the U12 and U13/14 groups. This means that between-player variation increases with age, with older players requiring closer monitoring outside of training. Another important finding in this study was that there was a significant increase in the load experienced by participants outside of the academy on particular days and depending on the age groups.
As participants got older (U15/16), the range of activities that players engaged in outside of their academy settings reduced, suggesting that players utilise their time away from training differently
“When working with young football players, practitioners need to be aware of the challenging physical and social dynamics that accompany the youth of today As a teacher, I know first-hand that we place a lot of pressure onto students to represent them in fixtures. Whilst this is never against their will, I am fortunate to be in a position where I can alter their week to account for an increase in load. Unfortunately, this luxury isn’t afforded in all school environments.
“When we consider that ‘kids will be kids,’ we must also think about the additional things they should rightfully be doing between the ages of 12-16. To navigate these issues, I wrote an article highlighting how teachers and students can enter conversations with their clubs regarding collaboration.
“In order to monitor habitual physical activity levels, coaches need to develop systems that collect this kind of data which can be challenging from a logistical standpoint. The team at DSM strength do a good job at bridging this with their athlete monitoring series In addition, (HERE). David Johnson, who authored this research, recorded an interesting podcast attached, which investigates the role of growth and maturation on training load in youth. The overarching opinion is coaches need to closely monitor this, as high training load and/or sharp increases in training load result in injury
“Finally, future studies should consider the role of academic load (e.g. GCSE’s in the UK education system) on wellbeing and injury as previous correlations have been seen in the attached article. This will allow the best chance to balance everything that is going on within a student’s schedule”

The acute effects of a good warm-up on measures of performance have been well documented. Studies that have investigated the impact of a warm-up on physical performance have typically found an active warm-up prior to training or competition has positive impacts on measures such as vertical jump, horizontal jump, speed and agility
Such findings were also consistent when athletes warmed-up using a post-activation potentiation protocol, where a conditioning exercise followed by an explosive movement generated greater performance.
However, few studies have investigated the benefits of using a weighted vest (WV) on performance. Therefore, this study focused on the impact of WV use on sprint times in youth soccer players.
Twelve participants from an English U16 male sub-elite soccer team volunteered to take part in this study Participants were a mixture of attackers, midfielders and defenders who regularly took part in soccer specific training and competitive match play. In addition, participants received regular plyometric and sprint training.
All participants completed a sprint test, with timing gates set up at 10 and 20-metres. Following an explanation of the procedure, participants were assigned to one of four conditions, three of which required the participant to wear a WV These were:
1. Condition 1 – unloaded 20m sprints
2. Condition 2 – WV loaded sprints @10% bodyweight (BW)
3. Condition 3 – WV loaded sprints @20% BW
4. Condition 4 – WV loaded sprints @30% BW
Once assigned, participants were instructed to perform one 20-metre sprint with a three-step run-up using their normal running technique. After this, all participants repeated the 20-metre sprint test after 4, 8 and 12 minutes of recovery duration to assess the differences in pre-post sprint times.


As all WV protocols had a positive influence on sprint speed over short distances, coaches should look to employ the use of load-resisted sprints with youth. In the attached video, coach Codey Bidlow uses a host of bounds and short sprints to achieve speed returns in training. In addition, Bidlow also explores the role of load on decrements in speed (e.g. a greater load = higher force outputs at lower velocities). When looking to start this form of training with youth, a sound base of technique developed through wall drills, band-resisted sprints and hamstring conditioning (i.e. single-leg bridges, Romanian deadlifts and Nordic holds) could be advantageous. This is supported by Dr Toby Edwards, who explores the role of speed in team sport athletes in his thorough breakdown of the important components of acceleration and maximum speed training in youth which can be listened to in the attached podcast.
When using weighted implements to aid sprinting, coaches should be aware the athlete can experience some differences in their technical ability. For example, the introduction of load often brings about changes in both stride length and stride frequency when compared to unloaded sprinting Although this isn’t something to worry about, you may see improper or (HERE). undesirable technique when first introduced. In addition, weighted vest protocols often have several effects on technique. For example, Cronin and colleagues (2008) found that vest sprinting has less effect on the trunk angle, allowing the individual to remain upright in sprinting. Moreover, athletes should expect to experience greater eccentric braking force at the beginning of the stance phase when wearing a vest compared to other equipment (e.g. sled towing). From this, it may be suggested that weighted vest protocols are better at developing maximum speed, whereas sled towing, which typically require greater thigh extension and trunk lean, may be more conducive to acceleration performance.
As this is a practical takeaways section, coaches do need to think about the logistics of adding equipment to their facility/training regime. As youth S&C departments are often not blessed with an endless budget, thinking about how adaptable equipment is can be useful for a coach. For example, weighted vest can be useful during crawl patterns, loaded pull-ups, press-ups, and sport-specific positions (e.g. scrummaging in rugby). On the other hand, a sled may offer greater use for loaded sprint/agility patterns, loaded crawls, lateral and reverse sled pulls With (HERE). this in mind, coaches should consider how useful certain equipment is when working under financial constraint, as both weighted vests and sleds with plates can be very expensive.
The main finding of this study is that all VW conditions improved 10 and 20-metre sprint performance in comparison to condition 1 (unloaded 20m sprints), though these improvements were non-significant.
Despite all interventions improving 10 and 20-metre acceleration, no significant findings were reported between conditions. However, the researchers did emphasise that the greatest reductions in 20-metre sprint times were seen on condition 2, with 12 minutes of recovery, with positive findings being found for condition 2 in improving 10-metre sprint times at 4 minutes of recovery
This study demonstrated that although no statistical difference existed between conditions 2, 3 and 4 when looking to improve sprint performance in soccer players, all are equally effective for young football players (U16) and could be placed into a warm-up.
“Training for speed is a really important factor when looking to be a successful soccer player Therefore, players should dedicate time to develop their sprint technique every week. The role of the S&C coach within this process is to organise, manage, and alter load for individuals in order to drive adaptation. According to Haugen and colleagues in the attached article, children should perform sprint training at >90% of max speed twice a week to maintain and develop speed. However, coaches should be cautious, as excessive and rapid increases in training load could be responsible for a large proportion of soft-tissue injuries.
“When looking to assess which sprint-training method to use, the best advice first and foremost is that some form of sprint training is better than none. Placing maximum efforts into the late part of a warm-up or between skill practices may be a good way to include this. Other methods, such as hill sprints, weighted vests, and sled pushes/pulls are also highly effective at improving sprint speed. In the attached study here, Florin provides a series of age-appropriate speed training recommendations, which can be used instantly in your sessions here.”
This month ’ s top research on nutrition

WHAT IS THE IMPACT OF PRE-MATCH CAFFEINE INTAKE ON POST-MATCH SLEEP QUALITY?
THE IMPORTANCE OF A PERIODISED CARBOHYDRATE STRATEGY
DOES LOWERING THE MAINTENANCE DOSE OF BETA-ALANINE MAINTAIN AN AEROBIC PERFORMANCE?

Caffeine is one of the most popular ergogenic aids in the world. Worldwide consumption is crazy, with many everyday people consuming it daily and athletes using it as a stimulant before training and competition (infographic below). Personally, I have seen athletes consume multiple cans of energy drinks each day without any understanding as to how much caffeine they have consumed.
Caffeine consumption can affect numerous sleep indices, such as sleep onset latency and efficiency, rapid eye movement sleep, total sleep time, insomnia, anxiousness, and activity in athletes. As a result, caffeine has the potential to reduce sleep quality and recovery time, resulting in lower physical and cognitive function, especially when caffeine has been consumed in the evening.
The aim of this study was to (1) explore sleep in rugby league athletes before and after an evening match, and (2) investigate the relationship between changes in salivary caffeine concentration and sleep on the night of competition.
Fifteen professional rugby league athletes were recruited - all players were regular caffeine consumers prior to taking part in study
Prior to and during an evening (7:50 pm kick off) rugby league match, players consumed ad libitum (as much or as often or desired) a commercially-available preworkout supplement, and/or tablets which contained approximately 175mg and 100mg of caffeine per serving respectively
Saliva samples were collected from the players using a synthetic swab for 45 seconds, one-hour before and 30 minutes after the game, and then frozen ready for later analysis. High-performance liquid chromatography was used to examine saliva samples for caffeine.
Sleep was evaluated on three occasions: the night before the match, the night of the match, and the night following the match using an activity monitor (Actiwatch 2) worn on the players’ wrists, as well as a self-report sleep diary This allowed both an objective estimation of sleep and also a subjective self-report of player sleep time.
One hour prior to competition, the salivary caffeine concentration of players was 2.1 μg/mL. Compared with pre-competition measures, post-competition salivary caffeine concentration was significantly increased (8.1 μg/mL)
Evening competition caused significant adjustments in sleep-wake cycles, as well as shorter sleep duration: on the night of the match, players slept an average 4 hours 27 minutes, which was significantly less than the night before (where it was 210 mins longer) and after (161 mins longer) the match.
Caffeine supplementation prior to and during competition leads to substantial increases in post competition salivary caffeine concentration. Although not significant, there was a trend for caffeine consumption to reduce sleep duration and increase sleep latency Additionally, in regard to changes in salivary caffeine concentrations and wake time and time in bed, only minor relationships were found.


Although a nice study, it is very difficult to control the habitual caffeine consumption of athletes within elite sporting environments. As such, the variance in post-match salivary caffeine concentration may be a consequence of higher basal levels of salivary caffeine, while the lack of standardisation relating to the type, timing, and dosage of supplementation in the current study should also be highlighted.

As correlations between caffeine consumption and sleep characteristics were all non-significant, the authors rightly highlight that other factors are likely contributing to poor sleep characteristics for players including: exposure to floodlights, post-match alcohol consumption and sleep environments. I would also add from personal experience with rugby players, adrenaline of the match, muscle soreness and mobile phone use in bed are common issues I see in day-to-day practice.


Practitioners working with athletes who consume caffeine before evening competition should look to provide educational programs to improve sleep hygiene practices. In practice, I have always seen better uptake of education when things are kept simple and easy to understand. Caffeine consumption timelines are a good idea for example.
Finally, caffeine can be consumed through many forms including fluids (coffee, energy drinks etc), gum, gels and tablets. Working with your athlete to provide them with individualised strategies may result in a lower intake in the evening and support improved sleep characteristics. For example, if a player currently consumes an energy drink with 200mg of caffeine in, but actually feels they only need 100mg, then they would be better to take on a caffeine gum rather than the energy drink. Be careful with the actual caffeine content of coffee pods! They are not all what they say they are!
Then check the se out...
“I liked reading this paper and it reminds me of many conversations that I have had with rugby players regarding caffeine intake. Of course, the focus on match play is to perform, and this results in many players consuming over 300 or 400mg of caffeine pre-match, about 3-6mg/kg body mass, which is aligned to a recent position stand and article below. It is not surprising that they struggle to sleep post-match.
“What do you do then? Do we ask players to not take caffeine so they can sleep better post-match or should we be allowing them to sleep in the following day and catch up on the sleep this way? This is certainly a strategy that is favoured by players; instead of getting them up early on a recovery day and bringing them into the club, allowing them to completely rest at home and lay in for as long as they want to. Hopefully studies in this area are completed soon to answer this research question.”


The cycling Grand Tours are some of the most physically demanding events in competitive sports worldwide. All three Grand Tours (Giro d’Italia, Tour de France, and Vuelta a España) follow a relentless format of 21 days or riding, covering more than 3,000kms of varied terrain.
The differences in terrain mean that cycling intensity and duration can vary significantly, resulting in a range in daily exercise energy expenditure. Exercise energy expenditure can fluctuate from 1000kcal during a time trial to more than 4500kcals during a mountain stage (see related article below). Nutritional support is essential for optimising fuel availability as well as maintaining body mass during races. It’s a balancing act, as significantly increasing the rider’s body mass or underfuelling the rider can reduce performance.
In this case study, the authors adjusted carbohydrate (CHO) intake to match the riders’ energy demands per day The current guidelines recommend 8-12 g·kg−1 to support 4-5 hours of moderate-to-high intensity exercise, but these recommendations fail to match the substantial day-to-day variation in energy demand during multi-day events, such as the Grand Tours.
The aims of this case study were to measure the riders’ daily exercise energy expenditure and to describe the daily CHO periodisation strategy for a male cyclist during the 2021 Vuelta a España.
The 26-year-old male rider had six years’ experience as a professional cyclist, cycling at UCI World Tour level for the last three years. Within his eight-man team, the rider was a domestique requiring him to support the team during the hilly and mountain stages.
The Vuelta a España route covers 3,417km in 20 stages. The race included one individual time trials (total: 40.9km), six flat stages (total: 1074km), four hilly stages (total: 688.8km) and nine mountain stages (total: 1614.9km).
The food available to the rider was made by the team chef according to pre-planned menus. Pre-purchased sport nutrition products (gels, carbohydrate drinks, bars etc) were also available.
To measure dietary intake, the rider completed a weighed food diary along with the remote food photography method which was shared via WhatsApp. The nutrition team used a database of all the offered food with its macronutrient content which they used to calculate the rider’s carbohydrate intake. The team then gave feedback on food recommendations to the rider to ensure he was meeting his CHO intake goal that day On-bike exercise energy expenditure was measured using a meter and bike computer. Body mass was measured each morning in a fasted state with minimal clothing.


This case study shows large variation in daily exercise energy expenditure during different stages of a Grand Tour To extend this beyond cycling, multi-day events in other sports (e.g. ultra triathlons, knock out tournament football, tennis tournaments) should also consider variations in daily exercise energy expenditure if exercise intensity and/or duration varies.

To measure exercise energy expenditure, one method is the use of doubly labelled water (although accurate, it is very expensive). Therefore, GPS combined with heart rate measure may provide a more applied measure. If the technology can’t be applied at the competition, mimicking the event at a training camp can help estimate daily exercise energy expenditure or a simple and easy tool to monitor fuelling and recovery can be assessment of morning body weight.
To match variations in energy expenditure, nutritional fuelling strategies should vary day to day Being prepared during a multi-day event with supplements, foods, meals, and full menus with known nutrient content allows the nutritional strategy to be dynamic and reactive when necessary This should also be planned during training.
Nutritional guidelines are useful to provide an approximate remit for a potential nutritional strategy, however this case study reiterates the importance of tailoring those recommendations to the athlete and the event.
It’s important to individualise nutritional strategies based on the athlete’s food preferences. This rider increased carbohydrate intake in meals later in the day, and whilst he still consumed a range of carbohydrate-rich products, he preferred whole food items during a race. Providing a few options to your athlete whilst remaining within the nutrition strategies boundaries will always result in better uptake and engagement from the athlete.
This case study shows tailored nutrition recommendations can be delivered in a time sensitive, dynamic, and intense racing environment using remote technologies. The nutrition team achieved this using cloud-based software and communication apps which allows them to support the athletes without physically being there. They do emphasise the importance of onsite support to “capture any nuance and details that can be missed with only digital communication”, but it does highlight this area for development.
The largest mean exercise energy expenditure was during the mountain stages (4602 kcals), followed by the hilly stages (4040 kcals), flat stages (3022 kcals), individual time trial (1701 kcals), and rest days (563 kcals). To match fuelling needs, total relative CHO intake varied from 17 7 g·kg−1 during mountain stages to 5.1 g·kg−1 on rest days (see figure below)

Carbohydrate intake was manipulated across all meals; however, the largest range was observed at the post-stage meal (1.1-4.0 g·kg−1) and at dinner (1.2-4.9 g·kg−1). Breakfast CHO intake (1.1-2.3 g·kg−1) did still vary, but remained the most consistent compared to the other meals.
Whilst racing, carbohydrate intake ranged from 0.6-1.6 g·kg−1.hr, depending on the fuelling requirements. The greatest contribution of CHO on the bike came from whole foods (37g ± 10%), then bars (21g ± 10%), gels (14g ± 6%) and high concentration carbohydrate drinks (15g ± 17%).
“As a performance nutritionist, individualising nutritional strategies (see below podcast link) is so important, particularly when you are working at elite level with individuals or in a small team. But for me, this case study takes that level of detail to another height. It is a proactive, thorough, and practised approach but still leaves room for quick, reactive, and dynamic responses to changes in data. You get a sense of how important the team surrounding the athlete is, and the level of work, communication, and synergy needed to achieve success.
“The use of carbohydrates to fuel cycling performance is not a new concept, but this case study elevates our understanding of applying a detailed day-to-day carbohydrate periodisation strategy to an elite cyclist.”


During high intensity exercise, the rapid production of hydrogen ions (H+) causes intramuscular pH to decrease, leading to acidosis and muscle fatigue. This is where beta-alanine has gained lots of attention in recent years (see related videos). This supplement increases muscle carnosine levels which can act as a buffer to reduce this acidity and its associated limiting effects on performance (Derave et al., 2007).
The research is well established supporting the ergogenic effects of beta-alanine in exercise lasting from 30 seconds to 10 minutes. Current supplement protocols suggest a dose of 3.2-6.4 g.day-1 over a period of 4-12 weeks. However, Stegaen et al. (2014) (related article below) argues the optimum betaalanine dose to maintain high skeletal muscle carnosine over an extended period is 1.2 g.day-1.
No studies have evaluated the effect of this maintenance dose (1.2g.day-1) on physical performance. Therefore, the aim of this study was to investigate the effects of a loading phase (6.4g.day-1 for four weeks), followed by a maintenance dose (1.2 g.day-1 for six weeks), on performance in repeated sprints in anaerobically trained men.
Thirty anaerobically trained individuals, with more than three years’ experience in team sports involving sprints (rugby, American football, football, and basketball), participated in the study
The cohort was split evenly into the supplementation group and control group. The supplement group consumed 6.4 g.day1 of beta-alanine, whilst the control group supplemented with the placebo for four weeks. After the first four weeks, the supplement cohort was split evenly again. The supplement group consumed a maintenance dose of 1.2 g.day-1 for six weeks, whilst the other group supplemented with a placebo for six weeks. The control group continued taking the placebo for the last six weeks.
The beta-alanine was in the form of an 600-800mg capsule which was taken at even intervals throughout the day to achieve the required dose for that day
Group 1 was the control group. Group 2 was supplemented with beta-alanine for the first four weeks and the placebo for the final six weeks. Group 3 was supplemented with beta-alanine for the full 10 weeks.
All participants completed the repeated sprints protocol before supplementation, at four weeks, and at 10 weeks. On arrival, participants provided a capillary blood sample to determine blood lactate concentration and completed a 24-hour food recall and anthropometric evaluation. The participants then fasted for four hours.
Thirty minutes before the exercise protocol, participants were given 30g of maltodextrin diluted in 300ml of water for food standardisation. The performance test consisted of 4x30 seconds sprints with four minutes of active recovery between efforts. Performance measures included power, fatigue percentage, blood lactate, and rating of perceived exertion (RPE).


Supplementing with a higher dosage of beta-alanine (more than a maintenance dose of 1.2 g.day-1) may be beneficial with increasing muscle carnosine levels and sports performance. The International Olympic Committee (IOC) recommends a protocol of 65 mg.kg taken in a split dose (every 3-4 hours) over 10-12 weeks, whereas the International Society of Sports Nutrition suggests 46g of beta-alanine for at least 2-4 weeks. Practising a supplement protocol with an athlete is important to determine any performance benefits, even if this is through some trial and error
Although the results were not significant, there were improvements in relative mean power after four weeks of supplementation with 6.4 g.day-1 of beta-alanine. This small improvement in an elite competitive sport environment can be the difference between winning or losing. An example of this was the difference between 1st and 6th place in the 2020 Tokyo Olympic Men s 100m final, which was 0.18 seconds, or 1.84%. Therefore beta-alanine could be effective at reducing the small percentage difference between competitors in elite sport.

Although beta-alanine is safe to use in healthy populations at recommended doses, it is also important to consider the side effects. These include itching and tingling (paraesthesia), and skin rashes. This seems to effect some athletes more than others, so always practise any supplementation or nutritional strategy during training to understand its effect on the athlete.
The authors comment on the success of beta-alanine on repeated sprints performance, but the results are mixed. After four weeks, group 2 (9.63 watts.kg-1) and group 3 (9.35 watts.kg-1) had higher relative mean power compared to group 1 (9.12 watts.kg-1), but the results were not significant.
After the full 10 weeks, relative mean power was significantly reduced in all three groups compared to week four At week 10, group 3 had the highest relative mean power (8.11 watts/kg-1) compared to group 1 (7.83 watts.kg-1) and group 2 (7.65 watts.kg-1), although again the results weren’t significant. There were no significant differences in percentage of fatigue, blood lactate, and RPE scores between all three groups at week four or week 10.
It is worth noting that nine individuals experienced itching or tingling after the first four weeks, and three individuals experienced the same symptoms after 10 weeks.
“Beta-alanine is one of the five ergogenic supplements recommended by the International Olympic Committee based on the vast amount of evidence that supports its beneficial effects on anaerobic performance. This research contributes to that body of evidence, promoting a dose of 6.4g.day1 but discouraging the use of a maintenance dose as low as 1.2 g.day-1. A great podcast episode on this area is below
“Personally in practice, the effectiveness of a supplement protocol to be followed though correctly is built upon good education with your athletes. I can confidently say that when I present sections of the science, show my athletes the figures, explain the rationale and the importance of the ‘why’, the buy-in to the supplement is always far better My advice is to always educate the athlete and allow them to ask as many questions as possible.”
This month ’ s top research on nutrition

HOW DOES YOGA ACUTELY IMPACT HEART RATE AND HEART RATE AVAILABILITY DURING AND FOLLOWING MENTAL STRESS?

OBJECTIVE
Cardiovascular disease is a leading cause of death around the world. Many commonly known risk factors, such as smoking, obesity and high blood pressure only predict around 50% of new cases. Beyond those physical risk factors, psychological stress may also play a role. It has been suggested that those who demonstrate exaggerated psychological responses to stress may be at greater risk of developing hypertension and other cardiovascular risk factors.
Previously, aerobic exercise has been found to reduce mental stress, with those who are fitter also seeming to reduce their blood pressure and heart rate quicker following a stressful event. Interestingly, yoga has also been found to reduce stress and depression as well as improving some cardiovascular diseases. Few studies though have looked at the impact of yoga on cardiovascular reactivity (the difference in measures of cardiovascular function when comparing periods of rest and during the presence of an external stressor).
Heart rate variability (HRV) is considered the variation in time between each heartbeat and represents the heart’s ability to respond to internal and external stimuli. It increases as we become relaxed and decreases during periods of stress. Yoga has been shown to increase HRV, although studies have not directly assessed HRV while subjects have actively been performing yoga. Nor has the link between yoga and HRV been investigated when combined with stressful events.
The purpose of this study was to examine the effect of acute yoga practice on heart rate (HR) and HRV responses to and recovery from mental stress.
This randomised, counterbalanced, crossover designs study had 44 participants (21 males, 23 females; mean age 24.6 ± 3.8 years) complete two separate conditions. The first was a 30-minute yoga session (five mins warmup, five mins breathing exercises, 20 mins yoga poses). The other session acted as a control and saw them video watching (VW) on TV where the history of the earth was presented. This was done in a random order
Following each condition, participants experienced two different stressors. The first of these tests was a Stroop task. This test shows one slide per second for five mins, with slides showing the name of a colour, but written in a different colour. Participants are asked to call out the name of the ink colour, not the word itself They were also asked to complete a mental arithmetic task following the Stroop task where they spent five mins doing a serial subtraction task.
HR and HRV, measured via electrocardiogram, were recorded, and analysed at rest, during each condition, and during the stress and recovery periods until five mins after the end of the mental stress period.
HR was significantly lower during the yoga condition (67 ± 8 bpm) as compared to that during the VW condition (72 ± 9 bpm). Despite this, there was no significant difference in HRV between the two conditions.

During both mental stress tasks and recovery periods, there was no significant difference in either HR or HRV responses between the two conditions.


This study suggests that an acute bout of 30 mins yoga practice was no better than quietly sitting when it came to reducing HR and HRV reactivity to and recovery from mental stress, when provided in the form of psychological and mathematical tasks.
This is in contrast with previous studies that have used acute bouts of aerobic exercise. This suggests that different types of exercise may have different impacts on cardiac autonomic reactivity to stress. In addition, chronic yoga practice may be required for modulating HR and HRV responses to a single bout of yoga practice.
“ I’m sure many people might read this paper and hope, or even expect, there would be some positive physiological responses to stress brought about by the yoga intervention. This was not the case, however. I think it is important to remember that this session was only 20 mins of yoga posing, which is quite short. We might see more favourable results with longer sessions or following a longer period of these shorter sessions.
“In addition, I think this particular type of mental stress, although controlled, may provide a different kind of stress to that of a more emotional nature, which people may consider using yoga to help combat.

“As with all studies, I think this is an interesting starting point that we can now refine to consider how meditative practices, including yoga, might help us to combat psychological stresses.”
Want to learn more?

Then check the se out...